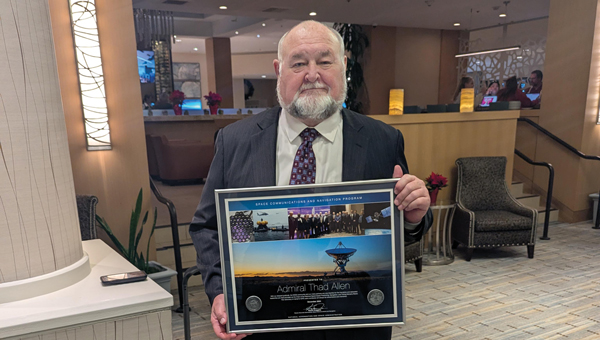
The National Space-Based Positioning, Navigation, and Timing Advisory Board continued its discussions on how best to protect, toughen and augment GPS at its 31st meeting, which took place Dec. 4-5 at the Sonesta Redondo Beach and Marina in Redondo Beach, California. The meeting was convened by James J. Miller, of NASA, who is the board’s executive director, and chaired by retired Adm. Thad Allen of the U.S. Coast Guard.
On the first day, after hearing reports from its six subcommittees, the board heard the following presentations:
Karen Van Dyke, director, PNT & spectrum management, Department of Transportation (DOT), on DOT’s IDM and complementary PNT work.
Maj. Christine Bonniksen, retired from the U.S. Air Force, deputy director for flight projects, NASA Langley Research Center, and Shachak Pe’eri, Ph.D., acting director, National Geodetic Survey, National Ocean Service, National Oceanic and Atmospheric Administration (NOAA), on NOAA’s implementation of a GDGPS-based GPS High Accuracy and Robustness Service.
Anh Nguyen, Ph.D., NASA flight opportunities program (Bryce Space and Technology, LLC) and Lisa Valencia, NASA Space Communications and Navigation Program (Overlook Systems Technologies, Inc.) on the SpaceLoft 15 multi-GNSS flight experiment (see the article on p. 16).
Allison Kealy, Ph.D., director of the Innovative Planet Research Institute, Swinburne University, Australia, on resilient PNT.
Brad Parkinson, Ph.D., the board’s first vice chair, on a comparison of GPS with the other GNSS.
Satoshi Kogure, senior chief officer of satellite navigation technology, Japan Aerospace Exploration Agency on Japan’s Quasi-Zenith Satellite System (QZSS).
Moon Beom Heo, Ph.D., executive director of KPS R&D Directorate, Korea Aerospace Research Institute on the Korean Positioning System (KPS).
Matt Higgins, international engagement subcommittee chair on Galileo.
Cordell DeLaPena, executive officer, MilComm & PNT, Space Systems Command, USSF on the status of the GPS program, including L5, OCX, civil signal monitoring, resilient-GPS and low-Earth orbit PNT.
On the second day, the board held a roundtable discussion, then heard updates from its international members and representatives. For video of the proceedings, go to youtube.com/@nationalpntboardmeetings822/streams.
To celebrate Allen’s long service as this board’s chair, NASA conferred a beautiful plaque to him, bearing the following text:
“PRESENTED TO Admiral Thad Allen
With our deepest gratitude, the NASA community and our many partners are very thankful for the friendship and dedicated leadership you have provided as the Chair of the National Space-Based Positioning, Navigation, and Timing Advisory Board. Your advocacy on behalf of GPS users worldwide will always be remembered and cherished. December 2024
Kevin Coggins
Deputy Associate Administrator, Space Communications and Navigation
NATIONAL AERONAUTICS AND SPACE ADMINISTRATION”
“Seen & Heard” is a monthly feature of GPS World magazine, traveling the world to capture interesting and unusual news stories involving the GNSS/PNT industry.
Waymo opens autonomous rides in LA
Photo: Waymo
Waymo has launched its fully autonomous ride-hailing service in Los Angeles, available 24/7, following a waitlist of nearly 300,000 users before its rollout. The service covers nearly 80 square miles of Los Angeles County, including Santa Monica, Hollywood Boulevard and the University of Southern California. Waymo plans to expand its coverage as it scales its operations.
A large UAV show in Quanzhou, Fujian Province, China, ended in disaster when hundreds of UAVs crashed due to GNSS jamming. The event, intended to celebrate the city’s history with 2,000 UAVs equipped with low-altitude fireworks, faced significant disruptions when a camera drone entered the area without notifying authorities, leading them to mistakenly jam the signal. This incident resulted in an estimated loss of more than 10 million yuan ($1.4 million)
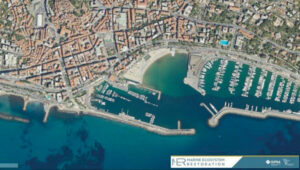
ISPRA project unveils coastal habitats of Italy
Photo: ISPRA
The PNRR MER A16-A18 project, led by the Italian Institute for Environmental Protection and Research (ISPRA), has released its first preliminary data for mapping Italian coastal habitats through the WebGIS Virgeo cartographic platform. The project focuses on mapping the growth of the Posidonia oceanica and Cymodocea nodosa meadows, which are crucial for biodiversity. Using high-resolution satellite imagery, lidar sensors and autonomous unmanned vehicles, the project is creating a comprehensive database for marine coastal ecosystem management and protection.
Celestial navigation system for UAVs
Photo: Cpl. Harrison Rakhshani
Researchers at the University of South Australia have developed a celestial navigation system for UAVs. The new system combines visual observations of the stars with standard autopilot technologies. In tests of the system using a fixed-wing UAV, researchers could pinpoint its position within 2.5 miles. This technology can be deployed by UAVs in GPS-compromised or denied areas by eliminating the need for GPS.
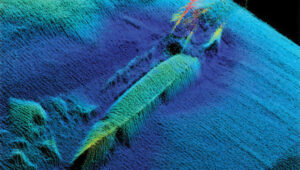
Nearly three quarters of Earth’s surface is covered by water, yet only about a quarter of that surface has been mapped in detail using modern high-resolution technology.
Marine experts worldwide work together to chart the ocean floor, ensuring the safety of ports, harbors and navigable routes. This effort is crucial for global trade, as more than 90% of goods are transported by ships. Ocean floor surveying also supports the installation of offshore infrastructure such as fiber optic cables, pipelines, drilling platforms and wind turbines.
The increasing population in coastal regions and rising sea levels due to climate change have heightened the importance of observing coastal transformations, erosion and other marine alterations. These factors are essential for understanding and protecting coastal ecosystems.
Mapping techniques
In deep waters, massive multi-beam echo sounders (MBES) operating at very low frequencies collect depth data. As water depth decreases, smaller devices with higher frequencies and resolution must be used. However, near the shore, these devices become less efficient due to the slope of the shelf interfering with sound signals.
In near-shore scenarios, collecting depth data is best done using airborne lidar sensors, which offer several advantages over sensors on surface vessels. One advantage of airborne sensors is that they can simultaneously map both the seafloor and the adjacent topography to offer seamless land-water transition data. This capability is particularly valuable in dynamic coastal environments where rapid coverage of large areas is essential.
Bathymetric lidar is specifically designed for mapping shallow coastal waters, typically effective up to depths of 50 m. It can provide high-resolution data, often achieving sub-meter positional accuracy, which is crucial for detailed coastal mapping. By combining MBES for deeper waters with lidar for near-shore areas, researchers and surveyors can create comprehensive and accurate maps of the entire coastal zone. This method offers an in-depth understanding of underwater topography, aiding various applications in marine science, coastal management and navigation.
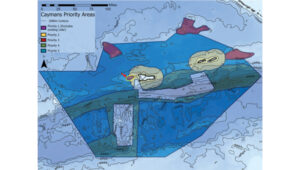
The waters of the Cayman Islands are abundant in marine life, featuring coral reefs, seagrass beds and a variety of fish species. A high-resolution map of the seafloor is essential to begin exploring, identifying, characterizing, exploiting, conserving and managing ocean resources. Saildrone has begun a mission to map 29,300 square nautical miles (100,490 sq km) of the Cayman Islands’ Exclusive Economic Zone (EEZ). This mission uses autonomous technology to survey 80% of this EEZ.
The Cayman Islands EEZ, extending up to 200 nautical miles from shore, encompasses an area nearly half the size of Florida — and 380 times greater than the island itself. The mission will provide detailed and precise bathymetric data for this area, contributing to a comprehensive understanding of the seafloor topography in the region. The data collected seeks to enhance maritime navigation and support scientific research, environmental conservation efforts and marine resource management in the Cayman Islands.
“Our waters hold such great value to us for a myriad of reasons, ranging from recreational to economic. Conducting this assessment will allow our government to make data-driven decisions that will strengthen our policies and legislation as it relates to our maritime infrastructure,” said Juliana O’Connor-Connolly, premier and minister for District Administration and Lands.
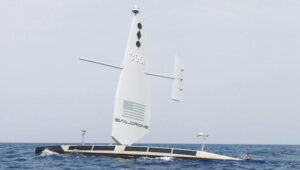
The Saildrone Surveyor USV is a purpose-built platform for autonomous deep-water ocean mapping. (Photo: Saildrone)
The mission is philanthropically funded by the London and Amsterdam Trust Company Limited, a Cayman-based organization. Saildrone is tasked with collecting the raw bathymetry data, which will be provided to the UK Hydrographic Office to process and update the Cayman Islands’ nautical charts. The data will belong to the government of the Cayman Islands.
Autonomous seafloor exploration
The mission is being conducted using a 20-m Saildrone Surveyor uncrewed surface vehicle (USV) equipped with MBES and metocean sensors for ocean mapping and ecosystem monitoring, as well as radar, cameras and advanced machine learning. Metocean stands for meteorology and physical oceanography. Globally, only 26% of the ocean has been mapped, a result of the lack of survey ship capacity. While a survey ship takes years to build, Saildrone can produce one Surveyor in as little as six weeks.
This nautical chart shows the Cayman priority mapping areas. The yellow oval indicates the vessel’s location as of Dec. 9, 2024. (Photo: Saildrone)
Saildrone USVs have demonstrated a reduction of more than 97% in operational carbon emissions when compared to survey ships to accomplish the same task. Additionally, they lower the risk to personnel. This information is highlighted in Saildrone’s Carbon Impact Report, which provides a comprehensive evaluation of the carbon emissions associated with maritime data collection and the emissions mitigated by using Saildrone’s USVs.
Saildrone’s ocean mapping solutions support storm surge modeling efforts and emergency response, as well as coastal resiliency and hazard studies, resource management, restoration projects, habitat mapping and infrastructure for renewable energy generation. USVs equipped with deep ocean mapping sonars now serve as a reliable option for data collection in large areas such as EEZs.
Bathymetry is crucial to understanding Earth’s aquatic environments. Its importance has evolved significantly since the early days of navigation, when mariners relied on lead lines and poles to gauge water depths. The field of bathymetry continues to advance with emerging trends that enhance data collection capabilities. Autonomous platforms such as USVs and autonomous underwater vehicles are increasingly utilized for bathymetric surveys, allowing for more extensive and detailed mapping. Additionally, as the industry grapples with challenges such as workforce shortages and the need for more efficient data collection methods, autonomous systems are proving to be a valuable solution.
Trimble’s Applanix POSPac MMS, an advanced GNSS-inertial post-processing software, seamlessly integrates with the Applanix POS MV and multibeam or sonar sensors to deliver high-accuracy results. (Photo: Trimble)
“Autonomous and uncrewed platforms have become a real force multiplier, and the trend continues,” said Peter Stewart, director of marine products at Trimble Applanix. “Companies such as XOcean and Saildrone are showing what is possible, leveraging cloud processing and enabling data collection in remote areas while maintaining a work-life balance for their staff. Since finding qualified engineers and surveyors to fill these roles offshore is an industry-wide concern, more flexible working conditions are needed to hire and retain talent.”
Another emerging trend is the development of sensors capable of penetrating murky waters, which can significantly enhance surveyors’ ability to gather data in challenging environments. Advanced sonar systems, innovative light-and-sound combinations and newly developed sensors allow research teams to collect detailed data. Post-processing technology for bathymetry has also significantly advanced, making data acquisition, processing and presentation more efficient and accessible. This allows researchers to map and study underwater terrains that were previously inaccessible or poorly understood.
Typical marine vessel data processed in POSPac MMS PP-RTX mode. (Photo: Trimble)
“Ease of use and installation are key trends toward ensuring valuable hydrographic data can be acquired, processed and presented efficiently,” Stewart said. Trimble works with users and third parties to offer an optimal workflow, making technology and the data it creates more accessible and operations more efficient, he added.
The IN-Fusion+ PP-RTX2 processing mode in Trimble’s POSPac MMS software is designed to improve post-processed GNSS-inertial trajectory generation. This mode uses Trimble’s CenterPoint RTX technology to deliver centimeter-level positioning accuracy without the need for local base stations. Stewart shared how this technology can be particularly useful when surveying around offshore windfarms, where shore-based RTK infrastructure is often too distant to be useable.
I am very pleased to announce that professor Washington Yotto Ochieng has agreed to join our Editorial Advisory Board.
He is the current head of the department of civil and environmental engineering and chair professor in positioning and navigation systems at Imperial College London, where he has been on the faculty since 1997. He is also the interim director of the college’s Institute for Security Science and Technology. Among his several other current roles, he is the president of the Royal Institute of Navigation, formed in 1947 following the example of the U.S. Institute of Navigation; a member of the board of trustees of the Science Museum Group appointed by the UK prime minister; and chair of the advisory board of the Science Museum in London.
For a much longer bio of Ochieng, including his full list of titles and honors, visit here.
GPS World featured Ochieng in its May 2009 issue, in a special section on “GNSS Leaders to Watch.” We wrote that he was “excited by the potential benefits of the new signals from modernized and new signals, and their integration with novel terrestrial systems/sensors.”
He has proposed the following question for EAB discussion:
When we discuss the security of GNSS/PNT systems, we nearly always focus on interference — i.e., meaconing, intrusion, jamming or spoofing. However, GNSS/PNT systems are embedded in systems of systems that also offer many other opportunities for cyberattacks. What should we do about it? We will publish responses from other EAB members in the next issue.
Finally, our heartfelt thanks to Terry Moore and Jean-Marie Sleewaegen, who resigned from the EAB, for their many contributions over the years, and a special thanks to Jules McNeff, who has served on the EAB since the magazine’s inception 35 years ago!
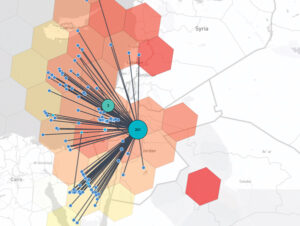
A closer look at potentially spoofed aircraft in the Middle East on Dec. 5, 2024. The map indicates that roughly 244 flights were potentially spoofed in Jordan and the surrounding areas. The level of spoofing is indicated by the color of the hexagons — the redder the hexagon, the more jamming was observed. (Photo courtesy of SkAI Data Services)
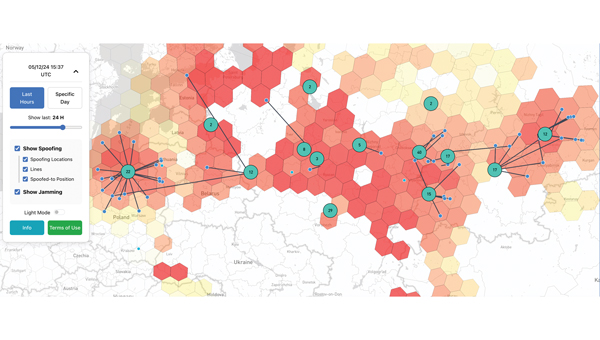
Electronic warfare techniques, such as GPS spoofing and jamming, are on the rise. With the increasing prevalence of this sophisticated form of warfare, industry experts must be aware of the threats and find ways to manage them to protect daily operations and civilians. It is important to contribute to the conversation about strategies to mitigate these risks.
SkAI Data Services has answered the call by creating a live GPS Spoofing and Jamming Tracker Map. The map — available at spoofing.skai-data-services.com — utilizes live ADS-B data from the OpenSky Network to identify and display potentially spoofed aircraft in real time and where GPS jamming activity was observed within the past few hours. SkAI Data Services developed the algorithms with the support of the Zurich University of Applied Sciences — Centre for Aviation.
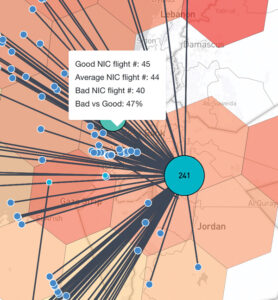
The blue markers represent the positions of aircraft just before they were spoofed. Users can hover over the lines to view information about the affected flights or over the hexagons to access insights on the level of interference. (Photo courtesy of SkAI Data Services)
The map displays clusters that indicate areas where spoofed GPS positions of aircraft have been detected. The numbers within each cluster show how many flights were spoofed at that specific location.
The blue markers represent the positions of aircraft just before they were spoofed. The lines connect these real positions to their corresponding spoofed locations. The map also displays areas of potential GPS jamming or radio frequency interference, indicated by colored hexagons. The redder the hexagon, the more jamming was observed. While not all pre-spoofed locations can be detected, increasing the window duration will reveal more lines.
Similar to gpsjam.org, SkAI Data Services uses the reported navigation integrity category (NIC) to identify these zones. Users can hover over the hexagons to see the number of aircraft reporting good NIC (greater than 7), average NIC (between 5 and 7) and bad NIC (less than 5). SkAI Data Services also offers custom API endpoints to integrate jamming and spoofing data into third-party products.
In February 1991, two Russians joined this magazine’s Editorial Advisory Board: Nocolay Ivanov, Ph.D., research and development director of the USSR’s Institute for Space Device Engineering, and Gennady Gromov, Ph.D., chief designer general for the Leningrad-based All-Union Scientific Research Institute for Radio Equipment. Both were leading experts in GLONASS.
In October 1982, 4 1/2 years after the launch of the first GPS satellite, the Soviet Union had launched the first test satellite for its new constellation. It peaked in 1996, with more than two dozen operating satellites in orbit, then declined, hitting a nadir of just seven operational satellites in 2001.
Additionally, early GLONASS satellites were plagued by orbital failures and short lifetimes. Many observers wrote the system off as another victim of the economic and political disarray following the collapse of the Soviet Union. Then, the new Russian government reversed the trend by substantially increasing its funding for the program. By October 2011, the full orbital constellation of 24 satellites was restored. Next year, Russia plans to launch Glonass K-2, the latest generation of GLONASS satellites.
Following Russia’s invasion of Ukraine, however, much international scientific and technical cooperation with the country has been on hold. On April 8, 2022, the European Commission declared: “Following the Russian invasion against Ukraine and in solidarity with the people of Ukraine, the Commission has decided to suspend the cooperation with Russian entities in research, science and innovation.” Two months later, on June 11, 2022, the White House followed suit: “Consistent with U.S. domestic and international law, we will wind down institutional, administrative, funding, and personnel relationships and research collaborations in the fields of science and technology with Russian government-affiliated research institutions.”
By contrast, cooperation between the U.S. and European space agencies continues apace, as evidenced by a recent successful test of the interoperability of GPS and Galileo receivers.
Meanwhile, in 2024, China reached a total of 45 operational BeiDou satellites in orbit. It is also conducting research on BDS technology upgrades and technological trials for integration with low-Earth orbit PNT systems. It touts this, together with its active participation in the work of relevant United Nations bodies, as enhancing international collaboration.
At the latest two-day meeting of the National Space-Based Positioning, Navigation and Timing Advisory Board, in early December, much of the agenda was devoted to updates on international GNSS capabilities — including Japan’s QZSS and Korea’s KPS — and discussion of how GPS compares with the other global and regional navigation satellite system constellations.
Future GPS policies and budgets will depend largely on the choices made by the next U.S. administration.
War, international collaboration and the periodic changes in national perspectives and priorities brought about by elections contribute as much as scientific and technical research to the prospects of GNSS — this fantastic global utility that enables us, among other things, to track the movement of containers from Shanghai to Los Angeles, fly safely from New York to Paris and coordinate universal time across our planet.
Saying the government must focus on “delivering an operational resilient positioning, navigation and timing (PNT) system for the United Kingdom as soon as we can,” the British Science Minister, Lord Patrick Vallance, announced several initiatives in his opening remarks to the Royal Institute of Navigation’s UK PNT Leadership Seminar on Nov. 20, 2024.
Among them was a funding increase for the National Physical Laboratory’s National Time Centre (NTC) project from £30 million ($38 million) to £62.7 million ($79 million) and a plan to have NTC and the first of the nation’s new eLoran towers at initial operating capability (IOC) by January of 2027.
Plans for all efforts beyond next year were necessarily “subject to spending review.”
Still, seminar attendees were gratified to hear the minister’s endorsement of the 10-point PNT policy framework published by the previous administration in 2023 and his commitment to operationalizing it with implemented systems.
Shabana Haque, Ph.D., head of the United Kingdom’s National PNT Office, also addressed the seminar and elaborated on the government’s actions to date and plans moving forward. She also discussed efforts toward developing quantum technologies and how all the capabilities would be incorporated into a coherent architecture.
Photo: RNT Foundation
Clocks
The United Kingdom recognizes time and timing as the most fundamental component of the PNT utility. Its NTC R&D program, run by the National Physical Laboratory (NPL), has been up and running since 2019. Its primary objective is to create “…a resilient UK national time infrastructure through the building and linking of a new atomic clock network distributed geographically in secure locations.”
Five years later, that program is coming to an end. Plans are in the works for the next phase of the NTC program, which includes developing a national timing infrastructure and supporting a new timing ecosystem — one that includes two-way satellite-time transfer (TWSTT), eLoran and the country’s legacy MSF radio time service. The industry will have a valuable role in the architecture of time distribution and providing value-added services while accessing highly resilient and well-authenticated core government time infrastructure.
As a result of NTC work to date, traceable time and frequency signals can now be accessed by industry and academia from three NPL nodes dispersed across the United Kingdom. They are at the University of Strathclyde in Scotland, the University of Cranfield in the Midlands and the University of Surrey in the south.
eLoran
eLoran also features prominently in the United Kingdom’s PNT plans. Britain operated Loran-C as part of the Northern European network until the end of 2015. For the last year of that, differential stations were deployed along the United Kingdom’s eastern coast and maritime operations based on eLoran were authorized.
On Jan. 1, 2015, and despite British pleas to the contrary, other northern European nations terminated Loran broadcasts in favor of Galileo. The United Kingdom has continued to operate its single eLoran transmitter as a national time signal. Plans call for additional transmitters to enable eLoran navigation across the nation and its adjacent waters within the next two years.
UrsaNav Loran monitor on Nautel equipment. (Photo: RNT Foundation)
The UK government has been working with several partners to advance its understanding and plan for the implementation of an eLoran capability. Haque highlighted work with the European Space Agency’s NAVISP program, resulting in the British company Roke developing an eLoran antenna for handheld devices.
She also discussed integrating the NTC’s clock and fiber network with eLoran signals and developing GNSS/eLoran receivers.
Many were particularly interested in an “eLoran Effectiveness Report” that the government commissioned and received from the General Lighthouse Authority’s Research and Development (GRAD) team. GRAD has extensive experience with the technology, having operated and evaluated the differential eLoran system along Great Britain’s east coast.
In a related move that helped signal the United Kingdom’s commitment to the technology, the Ministry of Defence issued a Request for Information (RFI) in September 2024 about a deployable eLoran capability. The RFI indicated that the document was a prelude to an acquisition.
Quantum research
The United Kingdom has invested more than £1 billion ($1.3 billion) into quantum research, which has the potential to contribute to PNT with better timekeeping and inertial and gravimetric sensing.
One aim of the quantum research program is to develop “…new navigation and timing systems to provide resilience and improved accuracy in the event of the denial of satellite systems.” A specific goal is to deploy quantum navigation systems, including clocks, on aircraft by 2030.
The program began in 2014 and has seen a significant increase in 2024 with the establishment of five quantum hubs nationwide. The hub at the University of Glasgow focuses on resilient PNT systems for national security and critical national infrastructure.
Policy and coordination
Minister Vallance and Haque also discussed two important non-technology themes.
The first was that the United Kingdom’s PNT office is fully funded, staffed, and very active. It was created last year as a cross-government effort and includes representation from the Ministry of Defence. In addition to pushing the nation’s PNT efforts forward, the office has been engaged with numerous other governments, including those of the United States, Canada, Australia, New Zealand, Europe, Japan and Korea.
USCG Loran tower circa 1995. (Photo: RNT Foundation)
Second, while the PNT initiatives are necessary for the nation’s resilience and security they will also be a source of economic benefits. This goes beyond enabling the British economy to function during local and potentially widespread GNSS disruption events. As the nation develops the technology stack to support its own resilient PNT architecture, along with enabling and supporting policies, resilient PNT devices and services will become marketable to others.
A sovereign PNT capability that can both stand on its own and cooperate with GNSS is becoming increasingly attractive to many nations. Being able to source such a capability from a respected and trusted ally such as Great Britain could make acquiring and implementing such a system much easier for many.
The UK Science Minister also praised the RIN’s work and publication of a series of tools to help explain PNT and the need for resilience to those outside the community. The tools also will help organizations evaluate their readiness for GNSS disruptions.
Available from the RIN’s Resilient PNT Portal, they are
A PNT explainer that outlines risks from over-dependence on GNSS and provides links to other informative resources.
A best practices “placemat” describing a “Prepare, Act, Recover” framework for PNT disruptions.
A PNT resilience checklist for organizations to use to self-evaluate their risk from GNSS disruptions.
The RIN recommends PNT experts use these tools working with customers, suppliers, and partners and act as a “guiding hand.”
The RIN sees these all as a “phase 1 release.” Feedback on the tools is encouraged and should be sent to [email protected]. The RIN team is eager to know what works and what could be improved, as well as to receive suggestions for other efforts.
As a “learned society,” the RIN has a significant influence on government policy and direction. This was recognized by Lord Vallance, saying, “The Royal Institute has played a really important role in recent years to highlight the PNT opportunity and risk, to provide expertise, and to work with government on solutions.”
The RIN’s director, John Pottle, and RIN Fellows Ramsey Faragher, Guy Buesnel and Andy Proctor were all recognized during the seminar for their contributions to the organization’s resilient PNT efforts.
UK leading the west
While China is in the final stages of establishing a nationwide clock system integrated with eLoran and signals from space, and South Korea is following suit, the United Kingdom seems to be the only Western nation in the process of establishing a coherent and resilient national PNT systems-of-systems architecture.
Some nations have substantial fiber timing networks, Europe seems to be on the path to a timing backbone, and the United States has three eLoran transmitters on air. However, none have announced the type of integrated plans the UK has published.
When asked about this, one UK PNT technology and policy expert opined that his nation is so far ahead of Europe and the United States because “we are unencumbered by having our own GNSS.”
His idea is that GNSS involves a lot of time, effort and money. The kind of financial and emotional commitments needed for these huge projects makes it hard for many to come to grips with the limitations and vulnerabilities of GNSS and the need to implement complementary systems. Both government officials and GNSS industry lobbyists may tend to resist such efforts, he said.
Concerning the UK government’s investment in OneNav, he said it is still possible that the United Kingdom might also pursue a space-based capability. Rather than establishing the capability on its own, in his opinion, the government will be much more likely to look for a commercial subscription service.
“We will access GNSS when we can trust it, and may pay for other signals from space,” he said. “But we want a sovereign capability for the United Kingdom, and the future of resilient PNT is terrestrial.”
Containers, stillages, trailers or reusable transport packaging — non-powered assets such as these play a central role in smooth supply chains and logistics processes. For a long time, however, non-powered assets could hardly be digitized due to a lack of sufficient battery life, thus eluding efficient management.
To plan and control logistical processes and supply chains, companies usually needed a large buffer/reserve stock and sometimes a lot of telephone/administrative work to determine the exact location and condition of such assets. Thanks to power-saving Internet of Things and wireless technology paired with high-performance sensors for environmental conditions and intelligent firmware, sufficiently robust trackers are now available for efficient use in the mass market.
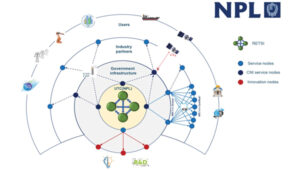
Figure 1: Integrated modeling tools help to model and track the flow of assets across operations and locations.
The basics: Thousands of tracker data at a glance
In order for companies to derive real benefits for their business from pure tracking, they need a management platform that can do more than display the trackers on a map. Depending on the requirements, tracking hardware can be equipped with sensors for temperature, humidity or tipping movements, for example.
A management platform must then ensure that the multitude of trackers can be efficiently commissioned and administered and that their collected data is made available for use. After all, large amounts of data are only valuable if important insights can be gained quickly and intuitively. The tracking application, therefore, needs powerful search and filter functions and visually meaningful maps, dashboards and panels.
Integration into existing systems
However, for the data collected via tracking to fully benefit the company’s supply chains and logistics processes, it needs to be integrated into the company’s existing IT systems, such as ERP systems or tools for data analysis and business intelligence.
The data exchanges between the business applications can be useful in both directions: on the one hand, precise localization and sensor data from the tracking platform enrich reliable enterprise resource planning via the ERP system; on the other hand, it can be helpful to make data from the ERP system available to the tracker management platform — for example, to evaluate the utilization of a trailer or to simply display the contents of a container via a mobile app on-site.
Technically, such data exchange can be realized through open APIs (application programming interfaces), which such a management platform should have. This enables the professional implementation of system integrations that are needed in the business IT of many companies — for example with SAP, Microsoft Azure or AWS.
Designing/modeling process flows and making route patterns transparent
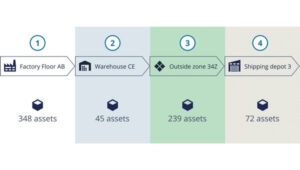
In order for companies to make their own processes around tracked assets transparent, a management platform needs tools that can be used to model and track the flow of assets across the different processes and, if applicable, locations (see Figure 1). Also important for this is the ability to define specific geographic areas of interest. Such geo-zones can then be used for inventory management, flow analysis or alerts. The mapping of load carriers or other assets to companies’ logistical processes and supply chains provides an accurate overview of how individual assets move from location to location, where they stop and for how long.
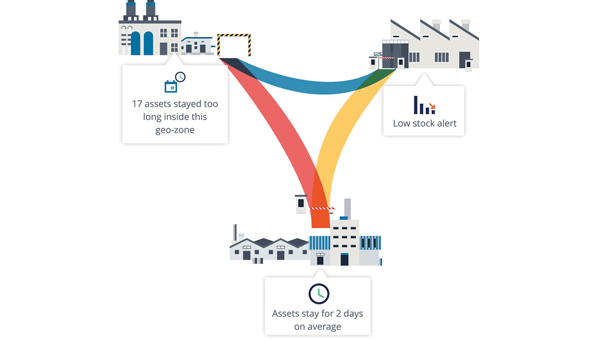
Based on the collected data, route patterns and travel times can be identified, rotation statistics with average and outlier analyses can be created (see Figure 2), and finally, planning and forecasts can be adjusted based on measured historical data. For appropriate visualization and evaluation, the tracking platform should provide the appropriate tools. This way, statistics can be generated for thousands of assets and/or an entire fleet, which can serve as a basis for further process optimization.
Figure 2: With a high-performance tracker management system, route patterns and travel times can be detected, and rotation statistics can be generated so that averages and anomalies can be identified.
Airbus example
Airbus develops, manufactures and delivers aerospace products, services and solutions worldwide, with more than 50,000 dedicated returnable transport packages circulating between sites and subcontractors. Thousands of returnable transport packages have been equipped with trackers and managed via a cloud-based platform over the past years. Airbus therefore benefits today from complete transparency. Inventory runs automatically, and stocks can be easily retrieved with their locations. The rotation capability of the packages has been improved, while their storage times and the circulating stocks have been reduced. Fleet capacity can also now be optimized, spare parts costs saved and subcontractor compliance better monitored.
The advantages at a glance
Precise inventory management of all mobile assets, from containers to returnable transport packaging to construction machinery.
Reliable condition monitoring: Continuous monitoring of environmental conditions such as temperature and humidity creates transparency — e.g., for compliance agreements.
Optimal process flows: Route patterns and turnaround times become transparent and anomalies easily identifiable, so that warnings can be sent in time and processes optimized overall.
Utilization monitoring: The utilization of each load carrier and each asset in a fleet can be precisely determined and optimized.
Predictive maintenance: Thanks to continuous monitoring, the maintenance of monitored assets can be planned and carried out in advance — before a breakdown interrupts important business processes.
Protection against theft: Lost or stolen assets can be easily recovered, so that financial damage can be minimized, especially in the case of expensive specialized assets.
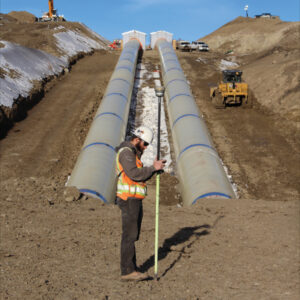
All construction work begins with surveying to map the site and generally ends with surveying to document what was done on it — called “as built.” Therefore, surveyors are the first to arrive at a construction site, well before the first heavy machinery, and the last ones to leave, well after the construction crews have left with their equipment. During construction, surveyors get to work any time there are changes in the plans.
Surveyors are not the only ones to use survey-grade GNSS receivers on a construction site, though. GNSS for machine control is increasingly common on excavators, graders, dozers and other heavy machinery. It enables operators to achieve accurate earthmoving and grading operations with minimal manual intervention, significantly improving efficiency and reducing rework by providing real-time positioning data based on 3D design models. Additionally, a dedicated display in the cab allows operators to see a visual representation of the machine’s position relative to the design model and to make adjustments in real-time.
This month’s cover story features case studies from four companies:
CHC Navigation (CHCNAV) on grading for an airport construction project in Shanghai, China.
ComNav Technology on a river flow monitoring system to mitigate the effects of flooding in Japan.
Nearmap on solving the stormwater challenges of a small town in Michigan.
Frontier Precision on the repair of a canal in Montana in very challenging conditions.
Construction of a building cannot begin until the ground is level and matches the design so that it can bear the weight of the planned structure. At times, part of the ground needs to be sloped to ensure proper drainage or to meet the aesthetic needs of the project. However, the ground at a construction site is often uneven and/or sloped the wrong way. Therefore, a critical phase of any AEC project is grading, which is a specialized phase of the construction process that uses machinery such as graders, bulldozers, excavators, and dump trucks to move and shape large amounts of earth.
Traditionally, grading involved the use of string lines and optical levels, which are still valuable for smaller projects. These tools provide a visual reference for achieving the desired slope and allow for manual adjustments as needed. Modern construction practices rely on laser levels — which provide accurate measurements, ensuring a consistent slope — and, increasingly, on GNSS receivers, which aid in precise grading, especially in large-scale projects.
In a recent project to build an apron — a paved area where aircraft are parked, loaded, unloaded, refueled and boarded, also known as the ramp, flight line or tarmac — as part of the expansion of Shanghai Pudong International Airport, the construction company adopted CHCNAV’s i93 GNSS receiver solution. The project, by a large state-owned construction company, began at the end of July 2024 and is expected to take two years to complete. By directly loading the designed triangulated terrain model (TTM) for surface stakeout, the project managers were able to visualize the cut-and-fill values at any location in real time. This approach doubled the stakeout efficiency and significantly improved the quality of site grading.
Project challenges and solution
The airport project covered approximately 360,000 m², demanding high-precision grading. Traditional surveying methods could only verify cut-and-fill heights at grid nodes, failing to effectively cover areas between these nodes. This limitation increased the risk of uneven construction and restricted the comprehensiveness of elevation data. Additionally, the traditional stakeout process was cumbersome and inefficient, requiring point selection before stakeout. To overcome these challenges, the construction team needed a surveying solution that could significantly enhance stakeout efficiency while improving grading precision and construction outcomes.
The construction team used the CHCNAV i93 GNSS receiver and LandStar field survey APP. By using the surface stakeout function for site grading, it was able to load the TTM generated from design data directly into the LandStar software, simplifying the grading process. The software enabled surveyors to obtain cut-and-fill values at any location in real time, thereby eliminating reliance on grid nodes and enabling dynamic verification across the entire site for higher grading precision. Lastly, the solution doubled the stakeout efficiency by reducing the steps of selecting feature points before stakeout.
Using CHCNAV’s Satellite Wide Area System (SWAS) corrections network, a global system that offers users fast and precise centimeter-level positioning services, the surveyor was able to achieve an elevation accuracy of -3 cm ~ +2 cm. SWAS covers most of the inhabited areas in China and is expanding its network globally. CHCNav’s satellite Precise Point Positioning service is being developed and tested; it will become part of the SWAS service in the future. The surveyor guides the site grading by comparing the difference between the elevation in the design plans and the measured elevation. Therefore, when the site grading is complete, it should match the design plans.
Conclusions
“The project involves large areas of earth excavation and levelling,” said Yang, the chief of the survey team. “In the past, we had to stake out all the points of the grid after getting the design drawings, and then calculate the elevation difference of each point. If there were some special points, we also had to calculate their positions in the grid. Now, in LandStar 8, we can directly convert the grid drawing into a TTM file and stakeout, which makes it easy for us to set the elevation difference at any point without the limitation of the grid. This increased efficiency accelerated the progress of the project and reduced our workload.”
The adoption of CHCNAV’s surveying and construction solution significantly accelerated the project’s site grading work. This task, which traditionally would have taken about one month to complete, was fully accomplished in just half a month. During the project acceptance phase, the results met all design requirements and passed inspection smoothly. The construction unit reported that the CHCNAV i93 GNSS receiver and LandStar field survey APP greatly enhanced the efficiency and accuracy of the site grading portion of the construction project.
It is essential to take effective measures to mitigate the effects of natural disasters — such as earthquakes or hurricanes — and to prevent them when possible, such as sometimes with floods. This involves multiple aspects, including the development and rehearsal of emergency plans, the construction and reinforcement of infrastructure, and the monitoring of environmental changes. By identifying potential disaster risks and taking preventive actions, the damage caused by these disasters can be significantly reduced and the resilience of communities and cities can be enhanced, thus better preparing for future catastrophes.
How can these disaster mitigation and prevention measures be specifically implemented? First, by creating detailed emergency plans and conducting regular drills, which ensures a quick and effective response during critical situations. Second, by reinforcing critical infrastructure, such as protective embankments and resilient systems, which strengthens the overall preparedness of both urban and rural areas. Moreover, monitoring environmental changes plays a pivotal role in prevention efforts. Real-time observation systems, including advanced sensors and data integration platforms, enable the early detection of potential risks. This facilitates timely preventive actions, minimizing losses with optimal efficiency and resource utilization.
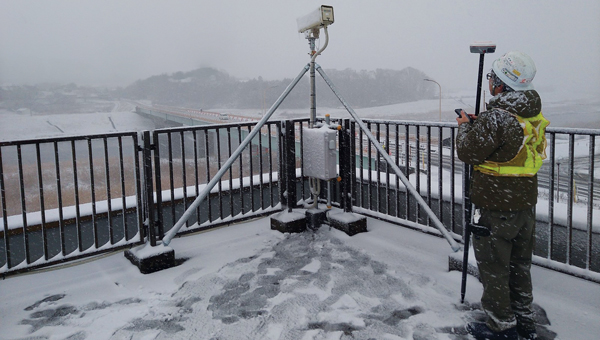
Mars Pro Laser RTK was used to precisely measure the positions of monitoring cameras in the Abukuma River basin.(Photo: Geosurf Corporation)
Monitoring systems
A key aspect of flood defense and disaster prevention is the establishment of monitoring systems and the enhancement of safety measures. In the Abukuma River basin, which flows through Fukushima and Miyagi prefectures in Japan, a flood monitoring system has been built that combines data from water level meters with real-time information on changes in water levels due to natural events such as typhoons. This provides residents with immediate visual updates to help them respond effectively.
ComNav Technology’s Mars Pro Laser RTK has played an important role in this flood prevention and disaster monitoring project. By using the device, which integrates advanced GNSS, IMU, and laser technologies, a team from Geosurf Corporation was able to accurately determine the locations for installing surveillance cameras, ensuring real-time monitoring of water flow conditions, and providing early warnings for natural disasters such as floods. The locations of these cameras typically include areas with a high risk of riverbank collapse, water level observation stations, and other critical spots that require close monitoring.
In the past, this task would have required using a total station. However, using Mars Pro’s very precise green laser, the crews were able to measure the locations of offset points that did not have a clear view of the sky, which is required to receive GNSS signals.
Centimeter-level accuracy
The green laser, which is visible in daylight, enabled the crews to achieve centimeter-level accuracy at any point within a range of 10 meters. They were also able to use its 120-degree tilt compensation feature to drive the stakes efficiently closer to the target point without worrying about leveling. During the RTK positioning process, the team used reliable correction information sources and precise post-processing analysis methods, ensuring that the measurement point consistency was maintained within 2 cm to 3 cm, thus ensuring high accuracy and consistency of the measurement results.
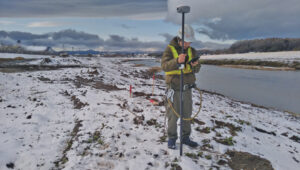
Positioning surveillance cameras in the Abukuma River basin required measuring not only their placements but also the reference points within their coverage areas. Beyond its convenience and reliability, the Mars Pro Laser RTK and its paired software, Survey Master, simplified the survey workflow by using wizard functions. Specifically, the procedure is to follow the instructions of the surveillance camera monitor to move onto the centerline and use the program’s Angle Offset Calculator to calculate the coordinates of a reference point at ±90 degrees to the line segment. Survey Master’s simple survey calculation tool eliminates the need to launch a CAD program in the field, making the staking more efficient.
For the correction information in RTK positioning, Geosurf Corporation used ichimil, a high-precision positioning service provided by Softbank. Geosurf also acquired raw data for post-processing at several locations at the same time and analyzed the measurement points using coordinate results from Japan’s Geospatial Information Authority.
The surveyor used Mars Pro Laser RTK and Survey Master software to measure the reference points within coverage areas of surveillance cameras. (Photo: Geosurf Corporation)
Conclusions
The monitoring system combines water level data collected from devices such as water level meters with changes in water levels caused by natural events such as typhoons, providing real-time visual information to residents. This allows them to stay informed about current water levels, identify potential flood risks early, and take appropriate preventive measures, effectively reducing disaster risks and safeguarding lives and property. More than 100 surveillance cameras have been installed so far in the Abukuma River and its associated watershed.
Through this project, Mars Pro Laser RTK not only enhanced emergency response capabilities but also showcased the versatility of laser RTK technology in disaster prevention and mitigation applications. Climate change is increasing the damage caused by typhoons and torrential rains worldwide. As a result, the demand for such monitoring systems is expected to grow. ComNav Technology plans to further improve user experience by integrating laser technology with additional sensors and developing more innovative tools to address future disaster prevention needs.
While surveyors are typically the first to begin working on a construction site, but they do not start completely from scratch. As a basemap for their measurements, they often use satellite and aerial imagery, the latter collected by planes and UAVs — the same imagery used in geographic information systems (GIS) by governments at every level and private companies to plan, build, and manage buildings and infrastructure. These data include high-resolution orthimages, which are taken pointing straight down at the ground and adjusted to have a constant scale of distance across them; oblique images, which can offer an alternative view of the landscape and structures where height is important; 3D datasets, including digital elevation models and models of buildings, collected using lidar; and AI-derived spatial information.
Additionally, historical imagery datasets document the evolution of land use over time and make it possible to compare conditions before and after natural disasters, such as floods and earthquakes, to expedite emergency response and reconstruction planning.
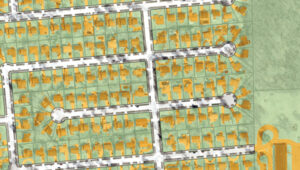
An aerial image of southfield, Michigan, from Nearmap’s natural pervious surface AI data layer. (Photo: Nearmap)
Stormwater utilities project
With a diverse population, more than 10,000 businesses, and a commitment to urban development, the City of Southfield, Michigan is known for its robust economy, thriving commercial centers, modern urban living and innovation. When it needed help to effectively manage its stormwater utilities, the city hired OHM Advisors. Founded in 1962 and with a multidisciplinary team of more than 700 experts, the firm provides consulting in the areas of architecture, engineering, planning, urban design, landscape architecture, surveying, and construction engineering. In turn, for this project, OHM Advisors used location intelligence from Nearmap, an aerial imagery company founded in 2007 that captures urban areas across the United States, Canada, Australia and New Zealand.
Initially, the city planned to have access to the Nearmap imagery for only a year, for use in its stormwater utilities project. However, once it realized how useful it would be across city departments and projects, it decided to continue buying it for the long term.
Aerial imagery
The City of Southfield is currently in the planning stages of considering a new initiative to assess stormwater fees based on the number of impervious surfaces — such as asphalt and concrete — which do not allow water to penetrate the ground, thereby contributing to increased runoff and straining municipal systems. However, the city is challenged by its limited budget for maintaining, let alone upgrading, its stormwater infrastructure. Additionally, the aerial imagery it had was old and one-time flyovers of the small city to update the imagery would have been prohibitively expensive, costing up $100,000.
By purchasing high-resolution aerial imagery (captured up to three times a year), geospatial data, and AI feature layers from Nearmap, as recommended by OHM, the city was able to efficiently map impervious surfaces and readily view, identify, and verify stormwater utilities at scale. This enabled the city to develop a highly accurate and equitable system for assessing fees based on near-real-time data. It also improved the precision and efficiency of its urban planning; enabled city planners to complete tasks remotely, spending less time in the field; and updated the imagery in its GIS.
Business impact
Using current aerial imagery, geospatial data, and AI data, Nearmap and OHM identified every impervious surface in the city, enabling Southfield to:
Accurately assess stormwater fees. Analysis of Nearmap imagery and AI data allowed OHM to tie impervious surface area to stormwater fees and establish a precise, data-backed fee structure that bolsters the city’s infrastructure funding.
Reduce costs. Nearmap offered a cost-effective alternative to traditional data collection, drastically reducing the city’s expenditure without sacrificing data quality.
Enhance urban planning. Access to Nearmap facilitated remote decision-making, allowing Southfield to optimize its urban planning.
Maintain consistent data. OHM and Nearmap led to the resolution of Southfield’s data discrepancies, ensuring reliable insights for future planning.
Conclusions
“Using the high-quality Nearmap AI data allowed the OHM Advisors’ GIS team to efficiently and effectively map out the impervious surfaces for the city,” said Mike Cousins, GISP, practice leader for GIS at OHM Advisors. “Having high-resolution and very recent imagery to pair with the impervious surface data helped with the analysis portion of the project at hand.” The collaboration between OHM Advisors and Nearmap marked a significant change in Southfield’s approach to stormwater management, illustrating the potential of advanced technology to improve urban governance.
The St. Mary Canal and siphon were completed in 1915 as part of the Milk River Project in North-Central Montana. The canal has delivered water to 110,000 acres of agricultural land in eastern Montana for 109 years. In June 2024, the siphon had a catastrophic blowout when both 90-inch siphon pipes failed, releasing 600 ft³ of water per second for more than 24 hours.
The stakeholders involved quickly went to work on a solution to replace the two siphon pipes. By mid-July, NW Construction, Inc. was brought on site to begin demoing and replacing the siphon. The company uses Frontier Precision as its supplier for all its surveying equipment. Utilizing a mix of GPS machine control, geospatial survey equipment, aerial drone surveys and CAD software, NW Construction will work through the blistering Northern Montana winter to restore the siphon in time for the 2025 irrigation season.
The harsh environment and speed of the project pose tough conditions for surveying. Winds regularly reach 60 mph with gusts up to 80 mph and temperatures go well below freezing for most of the winter. The surveyors on this project will have to overcome the challenges that come with this weather and the remoteness of the project.
The project has about six excavators, including two with tilt rotators, and four dozers, all equipped with GNSS machine control. “Everything we do is completely modeled for those guys through civil 3D and Trimble Business Center,” said Kenny Neskorik, project engineer for Northwest Construction. The GNSS receivers on the earth movers are running RTK as rovers and there is a single base receiver. “When we do any sort of concrete work for this project, we will also set up a robotic total station,” he said.
Additionally, the project uses a DJI Mavic UAV to collect aerial photogrammetry of such things as finished excavation and original ground stockpiles.
Requirements
The requirements for this project are atypical, Neskorik explained, due to its emergency nature. “The design and the construction are going on at the same time through two different entities,” he said. “My company is not the engineering firm stamping the plans. We’re the ones doing the work. I
could almost describe it as a design build, in which the contractor and the engineer meet in the middle to get the best product in the fastest way.”
The project’s biggest requirement is to get water back to the eastern part of the state by summer, when it will be needed to irrigate crops. “To do that,” Neskorik said, “we had to set control.” Because the project is only a few miles from the Canadian border, however, the power of radio broadcasts is restricted to only 2 Watts instead of the usual 35 Watts on RTK radios. “That really hurts your range to talk to your base,” he said. This required setting up several relay repeaters, especially since there’s almost no cell phone service in Montana
Challenges
An additional challenge is the solar cycle, which is nearing its peak. “We have noticed lots of Northern Lights, lots of auroras,” said Neskorik, “but we haven’t seen too many disruptions yet.”
Finally, the biggest challenge is the weather. “We’ve already had probably cumulatively two feet of snowfall,” said Neskorik. “Thankfully, some of that has already melted, but this area is one of the colder parts in the United States.” Browning, he pointed out, is just 30 minutes south of us, holds the world record for fastest temperature change in 24 hours — from 56 degrees Fahrenheit to negative 46 degrees. It’s not uncommon to see negative 50 degrees. “At that temperature, your batteries die really fast, you cannot use touch screens, and you have to drill to set stakes in the frozen ground is frozen. We’ve already experienced winds at nearly 80 miles an hour and that is pretty much how it goes for the entire winter. So, as you can imagine, it’s not an easy task flying a drone around here.”
Accuracy
“Our company standard for any excavator or dozer is an accuracy of one tenth of a foot,” said Neskorik. “We want our GPS rovers to have a vertical tolerance below 5/100s of a foot. Realistically, you’re probably getting a 1/10 of a foot. You cannot have any major fluctuations in the dirt because the pipe sits directly on it.” This all must happen in real time because there is no post-processing. “Everything is modeled and the machines are running on a model. We’re checking their grades as they’re doing the work.”
Notre Dame de Paris, the French capital’s cathedral, has reopened its doors five years after a devastating fire, showcasing its restored interior after extensive rebuilding work. The restoration, costing approximately €700 million ($737 million), was financed entirely by donations from around the world.
On April 15, 2019, Notre Dame tragically went up in flames, with the spire collapsing and the roof being destroyed. The following years were dedicated to rebuilding the cathedral, including the reconstruction of the spire and the restoration of stained glass and woodwork.
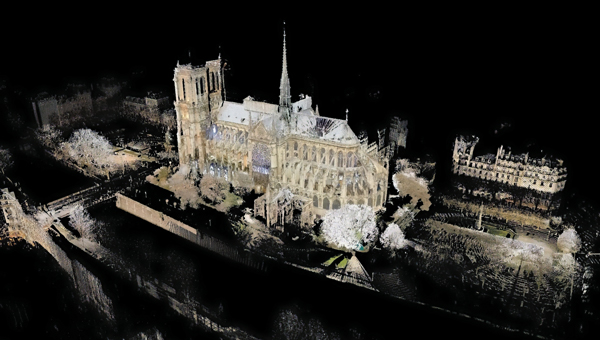
A crucial element in the restoration process was the point cloud data collected by Professor Andrew Tallon, an architectural historian from Vassar College, in 2010. Tallon’s project, which aimed to fully understand the Gothic structure and identify structural anomalies, involved creating a precise 3D model of Notre Dame using a Leica Geosystems terrestrial laser scanner.
This cloud of 1 billion points — with a TruView released by Leica Geosystems available to view here — proved to be indispensable for the digital recreation of the cathedral’s interior and exterior. Tallon’s laser scans were the only truly accurate as-built measurements of Notre Dame, translating point clouds into detailed representations of its buttresses, ribbed vaults, stained glass, ornate carvings and other architectural details.
Tallon, who died of cancer in November 2018, pioneered the use of laser technology to create a digital model of Notre Dame. Members of the restoration team and architectural historian Lindsay S. Cook — assistant teaching professor of architectural history at Pennsylvania State University, and a protégé of Tallon’s — said his work was critical to the cathedral’s rebuilding and refurbishing.
Tallon took some self-portraits as he mapped the cathedral. (Photo courtesy of the family of Andrew Tallon / Vassar College)
The value of point cloud data
While modern restoration efforts cannot fully replicate the artistry of centuries past, Tallon’s scans have been instrumental in reconstructing the Gothic cathedral, allowing architects to come remarkably close. Tallon’s groundbreaking work remained a vital resource for restoring the iconic cathedral to this day.
His meticulous 3D scans of Notre Dame provided architects with information crucial for the cathedral’s reconstruction, including:
Precise 3D models: Tallon’s precise 3D model of Notre Dame included intricate details of the cathedral’s architecture, such as flying buttresses, rib vaults, stained glass windows and ornate carvings. This level of detail was unmatched by any historical drawings or records, which often lacked precision.
Dimensional and formal reconstruction: Pascal Prunet, one of the architects tasked with rebuilding the cathedral, said in an interview with Lindsay S. Cook that the point cloud data provided an “exact trace” of the cathedral’s state at the time of scanning, allowing him and his team to reconstruct elements — such as the vaults — “without hesitation” regarding dimensions or forms. This was essential for accurately rebuilding complex structures such as flying buttresses and rib vaults.
Structural analysis: The scans revealed structural details that were previously unknown, aiding in understanding how the cathedral was originally constructed and how it changed over time. This information was vital for designing custom supports and ensuring structural stability during reconstruction.
Integration with modern technology: The point cloud data was integrated into Building Information Modeling (BIM) processes, which allowed architects to create a digital twin of Notre Dame.
Restoration guidance: The scans provided a highly detailed record of Notre Dame’s pre-fire condition, which helped restoration professionals select appropriate techniques for stabilizing and rebuilding various parts of the cathedral.
Tallon’s laser scans provided the only accurate as-built measurments of Notre Dame de Paris, capturing detailed representations of its architectural features. (Photo: Andrew Tallon (Vassar College / Columbia University))
Why precision matters
On Oct. 25, 2023, Philippe Villeneuve, architect in chief of historical monuments in charge of Notre Dame, and Pascal Prunet, a fellow restoration architect, delivered a Claflin Lecture at Vassar College in New York. They discussed their efforts to shore up, conserve and restore the cathedral since the devastating fire.
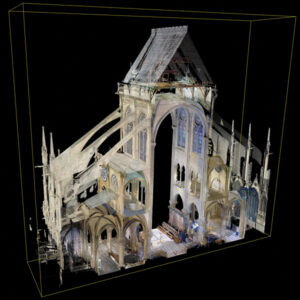
3D digital renderings were obtained from Tallon’s laser scans of Notre Dame Cathedral in Paris. (Photo: Andrew Tallon (Vassar College / Columbia University))
The two architects highlighted the crucial role Tallon’s laser scan of the cathedral played in their restoration process. They shared how this detailed digital model provided them with precise measurements and structural information, enabling Notre Dame to, in essence, “guide its own restoration.” By relying on this accurate data, the team could ensure its work remained faithful to the iconic cathedral’s original design and construction.
When speaking with Cook, Prunet shared, “At Notre Dame, we are doing an enormous amount of work, but we are not doing creative work; we are putting things back together again.” Villeneuve added, “What we’re doing isn’t very personal.” Tallon’s laser scan has enabled the architects to allow Notre Dame to “speak for itself,” according to Villeneuve.
Tallon had sent a copy of his point cloud to Villeneuve’s predecessor, Benjamin Mouton, before Mouton retired in 2013. After the 2019 fire, Marie Tallon saw that the architects had access to her late husband’s work. During their 2023 lecture and in a follow-up interview, Villeneuve and Prunet said Tallon’s scan — which Prunet called an “exact trace” of the state of the building at the time it was scanned — had been used in numerous ways since the fire.
For example, it aided the design of the wooden centering custom-made to cradle each unique flying buttress and rib vault and to rebuild the damaged vaults and the sole transverse arch destroyed when the tip of the spire separated from its base and fell westward, becoming a projectile that crashed into the nave.
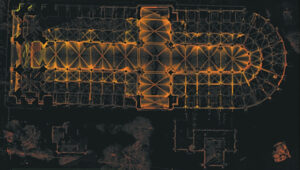
The point cloud data was integrated into Building Information Models (BIM) processes, which allowed architechts to create a digital twin of the cathedral. (Photo: Andrew Tallon (Vassar College / Columbia University))
“Andrew Tallon’s point cloud, well, it’s a bit like listening to a Mahler symphony,” said Prunet, alluding to the scan’s scale and complexity. Prunet continued, “It’s a recording,” but one that “needs to be decrypted.”
Tallon’s laser scan of Notre Dame has proven invaluable in the restoration process. This digital twin, created in 2015, offers unparalleled precision and detail, capturing the cathedral’s every nuance with accuracy up to 5 mm. This level of detail allowed the restoration team to address the structure’s complexities and make informed decisions about the rebuilding process, ultimately helping to preserve Notre Dame’s authenticity and historical integrity.