Tag: NAD 83

  • NGS releases beta tool for obtaining geodetic information

    NGS releases beta tool for obtaining geodetic information

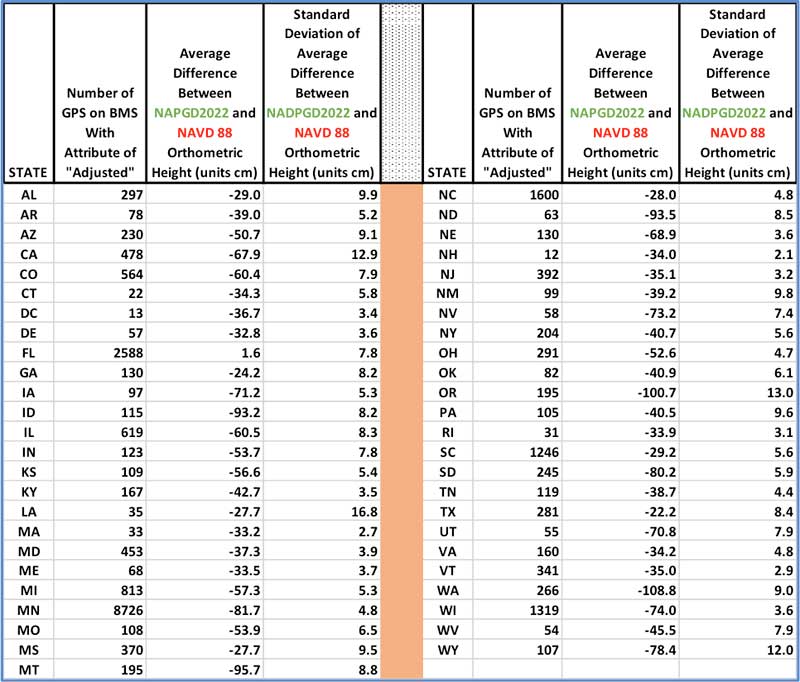
    NGS has developed a new beta tool for obtaining geodetic information about a passive mark in their database. This column will highlight some features (available as of Oct. 5, 2020) that may be of interest to GNSS users. It provides all of the information about a station in a more user-friendly format. The box titled “Passive Mark Lookup Tool” is an example of the webtool. The tool provides a lot of information so I have separated the output of the tool into several boxes titled “Passive Mark Lookup Tool — A through D.”

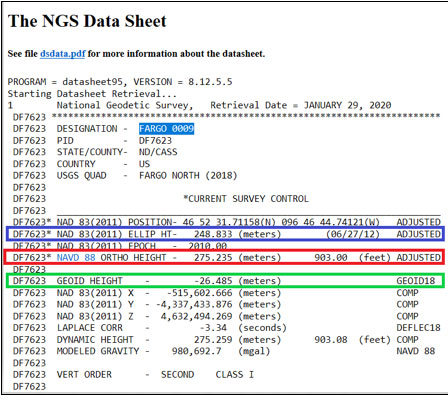
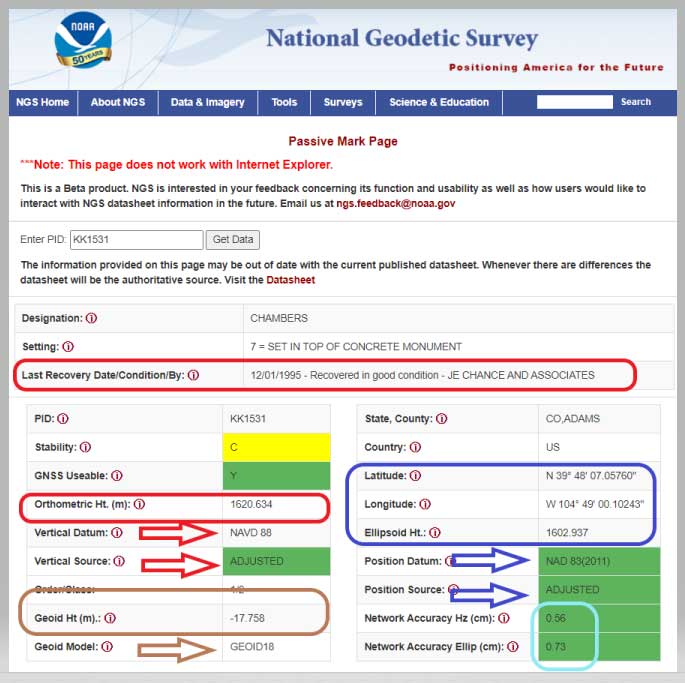
    I will highlight several attributes that I believe will be very useful to users, especially users of leveling-derived and GNSS-derived orthometric heights. I’ve highlighted several attributes in the box titled “Passive Mark Lookup Tool — A” that are important to users such as published coordinates, their datum and source, Geoid18 value, GNSS Useable, and the date of last recovery. All of these values are available on a NGS datasheet but, in my opinion, this provides the information in a more user-friendly format.

    Passive Mark Lookup Tool — A

    (https://beta.ngs.noaa.gov/datasheets/passive-marks/index.html)

    Image: National Geodetic Survey
    Image: National Geodetic Survey

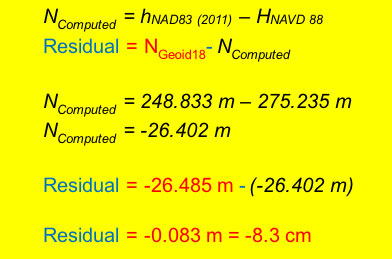
    One calculation that the user can easily compute for marks that have been leveled to and occupied by GNSS equipment, is the difference between the published leveling-derived orthometric height and the computed GNSS-derived orthometric height. This may indicate that the mark has moved since the last time it was leveled to or that its height coordinate has been readjusted since the creation of the published geoid model.

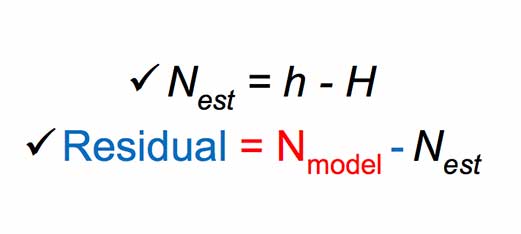
    The table below provides the calculation using the data from the box titled “Passive Mark Lookup Tool — A.” The calculation [HGNSS = hGNSS — NGeoid18; Difference = HGNSS — HNAVD 88] has been described in several of my previous columns (this one, for example).

    Data: National Geodetic Survey
    Data: National Geodetic Survey

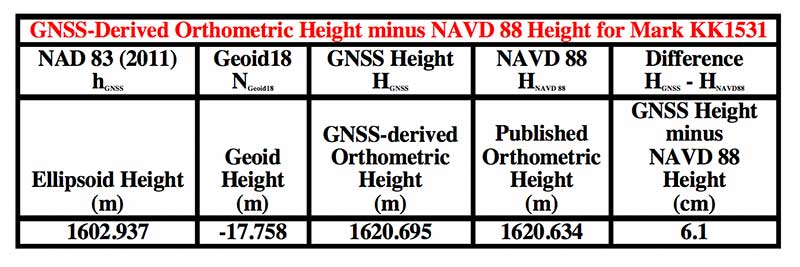
    In this example, the difference between the GNSS-derived orthometric height and the Published NAVD 88 height is 6.1 cm. NGS is looking for comments on this beta webtool so if users would like this computation added to the tool, they should send a comment to NGS using the link provided on the site (This is a beta product. NGS is interested in your feedback concerning its function and usability as well as how users would like to interact with NGS datasheet information in the future. Email us at [email protected].) So, the user should ask the question, did the station move since the last time it was leveled?

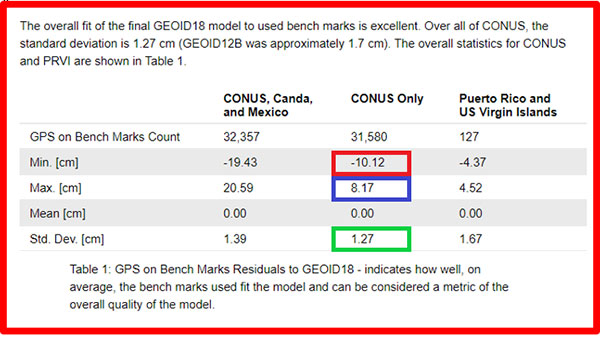
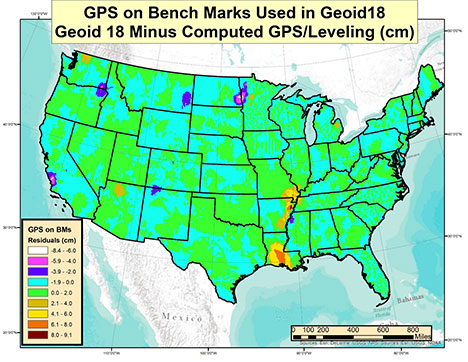
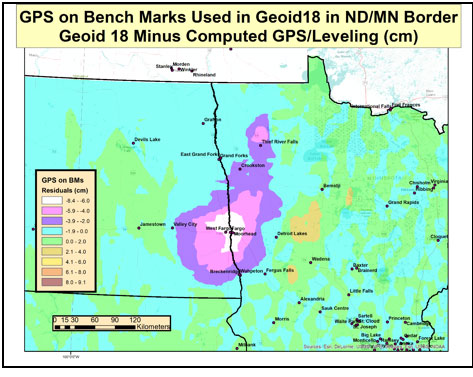
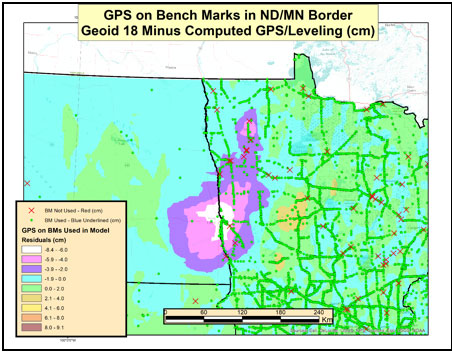
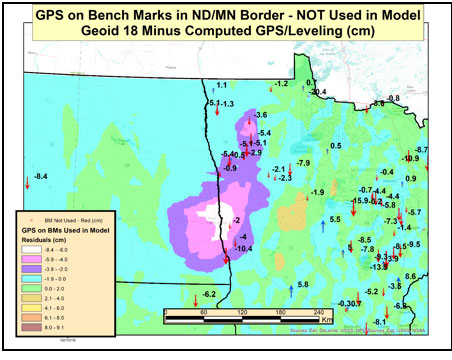
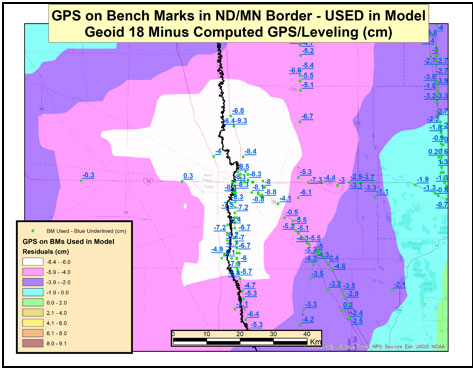
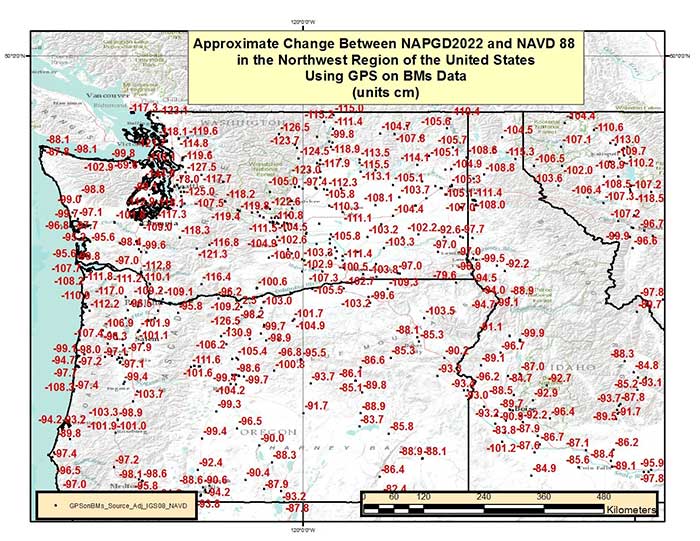
    Another attribute that would be nice to be part of this tool is which station was used to create the hybrid geoid model. As of Oct. 5, 2020, users have to go to the Geoid18 webpage to get the information. The Excel file and shapefiles provide whether the station was used to create the Geoid18 model. In the case of this example, KK1531, CHAMBERS, the mark was not used in the creation of Geoid18 so NGS felt that the station may have moved and/or the GPS on Bench Mark residual was large relative to its neighbors. See NGS’s technical report on Geoid18 for more information on the creation of Geoid18. The GPS on Bench Mark residual analysis was described in several of my previous columns (see “The differences between Geoid18 values and NAD 83, NAVD 88 values” and “NGS 2018 GPS on BMs program in support of NAPGD2022 — Part 6” for examples).

    The webtool provides a map depicting the location of the station, photos (if available), and previously published, superceded values of the mark. See the box titled “Passive Mark Lookup Tool — B.”

    Passive Mark Lookup Tool — B

    Image: National Geodetic Survey
    Image: National Geodetic Survey

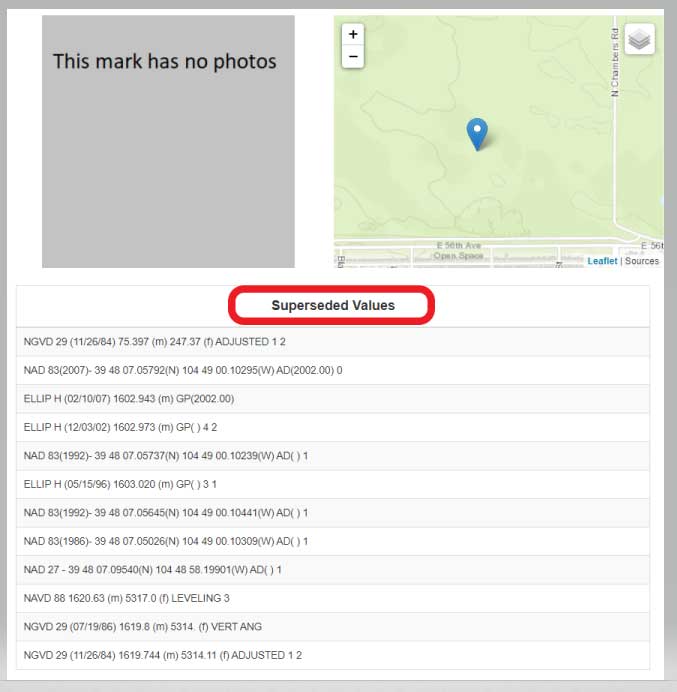
    In the example of Chambers, KK1531, no photos were available. It would be helpful if a user would provide photos to NGS when visiting this station. (Note: NGS has a webtool for users to submit recovery information about a mark as well as to provide current photos of the station.) The new Passive Mark webtool also provides information about the survey projects that the mark has been involved in such as leveling and GNSS projects.

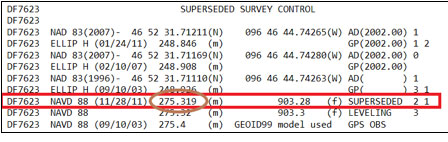
    In this example, mark CHAMBERS was leveled to in a 1984 first-order, class 2 leveling project (Leveling Line number L24838/6) and, in 1995, the mark was part of a GNSS project (GNSS Project GPS1010). It also provides all the descriptive text and recovery information (See boxes titled “Passive Mark Lookup Tool – C” and “Passive Mark Lookup Tool – D”).

    Passive Mark Lookup Tool — C

    Data: National Geodetic Survey
    Data: National Geodetic Survey

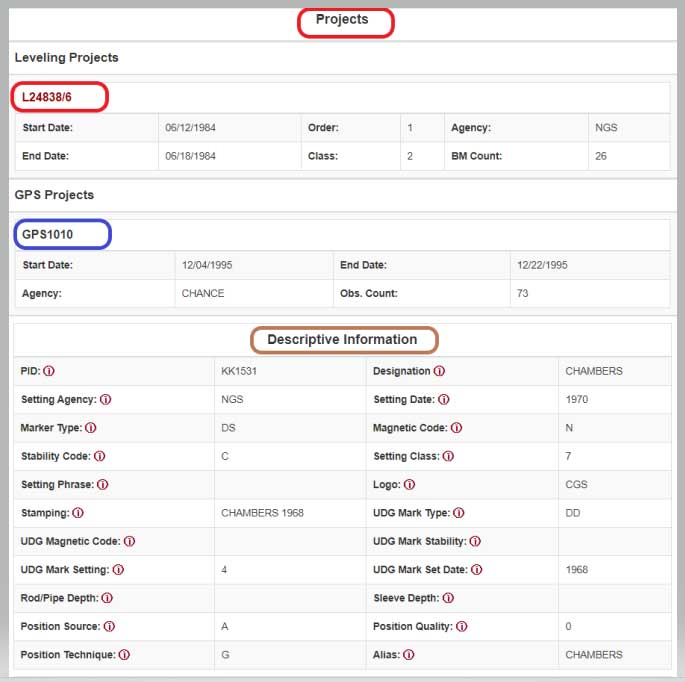
    Passive Mark Lookup Tool — D

    Image: National Geodetic Survey
    Image: National Geodetic Survey

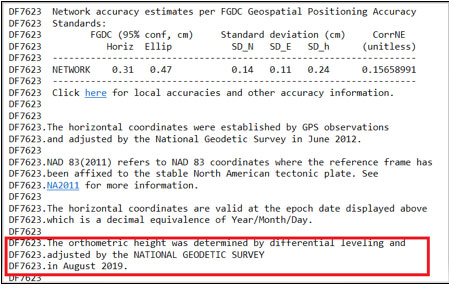
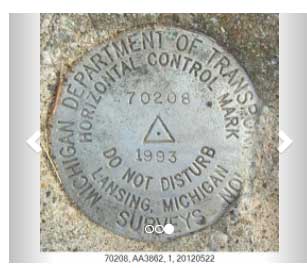
    I want to highlight a few other attributes of this webtool. The station, PID AA3862, has an interesting attribute that users should take note of; that is, the NAD 83 (2011) position source is NO CHECK. See box titled “Passive Mark Page for PID AA3862.”

    This means that the mark’s NAD 83 (2011) coordinates were determined without redundant observations. This is not a good survey practice but there are times that a project may contain check observations for some purpose or, more likely, the mark did contain other GNSS vector but they were rejected in the final adjustment. Either way, a good survey practice would be for users to verify the coordinates of these marks before using them.

    Passive Mark Page for PID AA3862

    Data: National Geodetic Survey
    Data: National Geodetic Survey

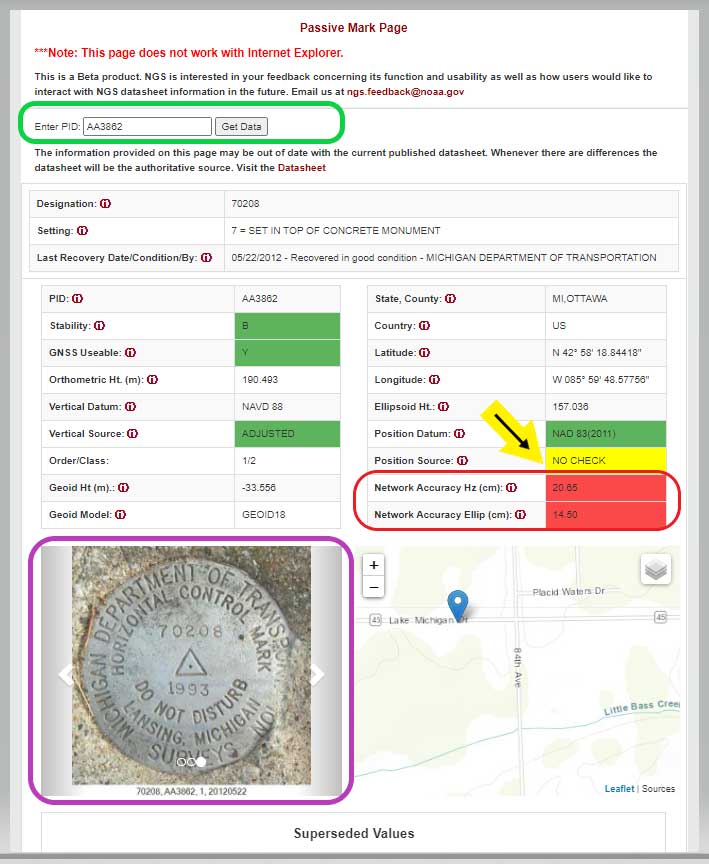
    As previously mentioned, the tool provides the location of the station on a map and photos if they are available. This is a really nice feature for anyone searching for the mark. The map can be enlarged as well reduced by clicking on the box. See boxes titled “Passive Mark Page for PID AA3862” and “Photos of Mark PID AA3862.” The box titled “Photos of Mark PID AA3862” provides all three photos of mark PID AA3862.

    Photos of Mark PID AA3862

    Photo: National Geodetic Survey
    Photo: National Geodetic Survey
    Photo: National Geodetic Survey
    Photo: National Geodetic Survey

    Photo: National Geodetic Survey
    Photo: National Geodetic Survey

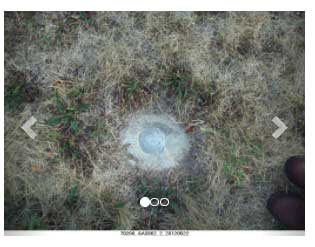
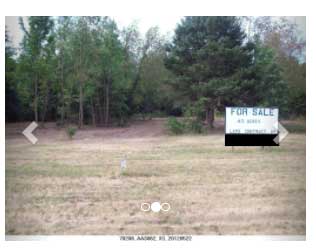
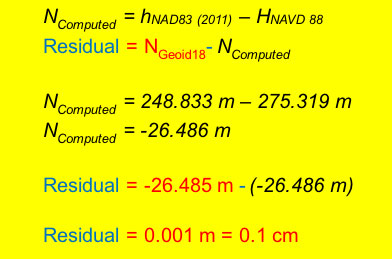
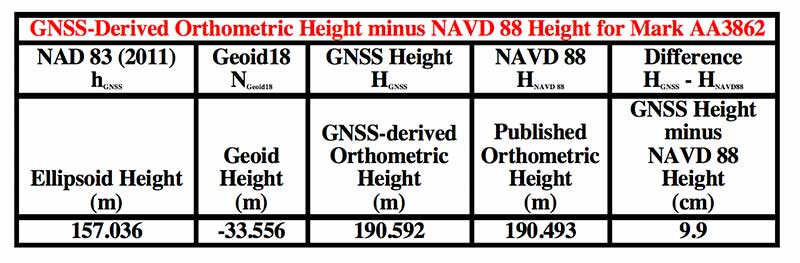
    It should be noted, according to the Geoid18 GPS on BMs dataset that users can download, this station, AA3862, was not used in the creation of Geoid18. The table below provides the difference between the GNSS-derived orthometric height and the published NAVD 88 height.

    In this example, the difference between the GNSS-derived orthometric height and the published NAVD 88 height is 9.9 cm. Also, the webtool provides the network accuracy values for the station. In this example, the horizontal network accuracy is 20.65 cm and the vertical network accuracy value is 14.50 cm (see highlighted values in box titled “Passive Mark Page for PID AA3862”). These are very large network accuracy values. This should be a flag to anyone that is using this station as control.

    Data: National Geodetic Survey
    Data: National Geodetic Survey

    As I previously mentioned, as a beta site, users should verify all information from the site. NGS is requesting feedback on this tool so they can improve it and make it an operational webtool. I encourage everyone to access the tool and check out a few of their favorite marks, and then send an email to NGS informing them of what you like, what you would like to change, and what you would like to see added to the tool.

    NGS is releasing this tool as a beta product to get feedback from users. As NGS states in the heading of the tool, they are interested in your feedback concerning its function and usability as well as how users would like to interact with NGS datasheet information in the future. Email NGS at [email protected].

    One last item that may be of interest to GNSS users is that NGS, working with the University Corporation for Atmospheric Research (UCAR), developed another online GNSS lesson (see box titled “New GNSS Lesson by NGS and UCAR”). These lessons are free but users must sign up to access the website and lesson.

    New GNSS Lesson by NGS and UCAR

    Image: National Geodetic Survey
    Image: National Geodetic Survey
  • The differences between Geoid18 values and NAD 83, NAVD 88 values

    The differences between Geoid18 values and NAD 83, NAVD 88 values

    My last column, December 2019, highlighted the National Geodetic Survey’s (NGS) new Geoid Monitoring Service (GeMS); and, that NGS’ will be publishing a gridded geoid model GEOID2022 that will contain two components: (1) Static Geoid model of 2022 (SGEOID2022) and (2) Dynamic Geoid model of 2022 (DGEOID2022). That’s what going to happen in 2022, but what about today? Since GEOID18 has been officially released for public use, it’s time to look at differences between the Geoid18 published value and estimated geoid values computed using information from NGS’ datasheet. This column will provide an analysis of the differences between the latest published hybrid Geoid18 values provided on NGS’ Datasheet and the computed geoid height value using the published NAD 83 (2011) ellipsoid height and NAVD 88 orthometric height. This is what a user will see if they computed differences using NGS’ datasheets published values. The question will always be asked, why is there a difference between the published Geoid18 value and the computed geoid value. This column will explain some reasons for the differences.

    It’s mostly good news but there are some issues that should be highlighted. This column will highlight issues on differences due to published heights that have changed since the database pull for Geoid18.

    First, it should be noted that NGS’ hybrid geoid models are different than NGS’ experimental gravimetric geoid models. My December 2018 column explains these differences.

    I would like to emphasize that, in my opinion, hybrid geoid models should be denoted as transformation models. Saying that, hybrid geoid models are related to “real” geoid models. Hybrid geoid model GEOID18 was computed based on NGS’ gravimetric geoid model xGeoid19b; therefore, GEOID18 is related to a gravimetric geoid model but its function is to estimate GNSS-derived orthometric heights consistent with NAVD 88 heights. As described in my previous columns, the GPS on Bench Marks (GPSBMs) data provide an estimate of the geoid height ‘N’ by differencing the ellipsoidal height ‘h’ from the orthometric height ‘H’: (N = h – H). These differences are then compared to the gravimetrically-derived geoid model. The box titled “Excerpt from Geoid18 Website Technical Details” provides a summary of the process from NGS Geoid18 web page technical details document.

    The figure in the box titled “GEOID18 Conversion Surface in cm” is the surface that represents the difference between NAVD 88 as a datum and the geopotential (geoid) surface used in the gravimetric geoid. This is the difference between the hybrid geoid and the gravimetric geoid with respect to NAD83 (GEOID18 – xGEOID19B). This surface has three essential components: a bias, a continental tilt, and local warping from the bench marks.

    Excerpt from Geoid18 Website Technical Details

    (https://www.ngs.noaa.gov/GEOID/GEOID18/geoid18_tech_details.shtml)

    Data: National Geodetic Survey
    Data: National Geodetic Survey

    Hybrid Geoid Model Construction
    The residuals obtained in equation 1 are contaminated with a continential tilt and bias that is estimated and removed with a simple two-dimensional planar surface. The bias-free and tilt-free residuals are ultimately used to determine a mathematical model using least squares collocation (LSC) and multiple Gaussian functions to describe the behavior seen at the bench marks. Once the relationship between the points is modeled, the model is used to generate a 1 arcminute regular grid for interpolation purposes. Figure 2 shows the final conversion surface. This surface represents the difference between NAVD 88 as a datum and the geopotential (geoid) surface used in the gravimetric geoid. This is the difference between the hybrid geoid and the gravimetric geoid with respect to NAD83 (GEOID18 – xGEOID19B). This surface has three essential components: a bias, a continental tilt, and local warping from the bench marks.

    GEOID18 Conversion Surface in cm

    Image: National Geodetic Survey
    Image: National Geodetic Survey

    Looking at the figure in the box, the bias and tilt between the hybrid geoid model (Geoid18) and the experimental gravimetric geoid model (xGeoid19b) are fairly obvious. It’s the local warping from the bench mark data that may cause some issues to surveyors or, at least at a minimum, raise some concerned by surveyors. The box titled “Plot of the GPS on Bench Marks Involved in Geoid18” provides a plot of the GPS on Bench Marks (GPSBMs) used in the generation of Geoid18. Users can download the list of GPSBMs stations from the NGS Geoid18 website. There were 32,357 stations used to generate the model. This was an increase of approximately 6,800 stations (26%) over the hybrid geoid model Geoid12B.

    Plot of the GPS on Bench Marks Involved in Geoid18

    Image: National Geodetic Survey
    Image: National Geodetic Survey

    The boxes titled “Number of GPS on Bench Mark Stations by State” and “Number of GPS on Bench Mark Stations by State in Northeast U.S.” provide the number of data points per state.

    Number of GPS on Bench Mark Stations by State

    Image: National Geodetic Survey
    Image: National Geodetic Survey

    Number of GPS on Bench Mark Stations by State in Northeast U.S.

    Image: National Geodetic Survey
    Image: National Geodetic Survey

    The box titled “Table of Number of Data Points per State” provides the number of stations per State in tabular form.

    Table of Number of Data Points per State

    Data: National Geodetic Survey
    Data: National Geodetic Survey

    The box titled “Summary of Overall fit of Geoid18” provides a summary of the fit of residuals of Geoid18 from the NGS GEOID18 technical details document. Looking at the CONUS overall values, the standard deviation is very low 1.27 cm which is a little better than Geoid12B (1.7 cm). It should be noted that there are some large outliers (minimum value of -10.12 cm and maximum value of 8.17 cm).

    Summary of Overall fit of Geoid18

    (https://geodesy.noaa.gov/GEOID/GEOID18/geoid18_tech_details.shtml)

    Data: National Geodetic Survey
    Data: National Geodetic Survey

    For this column, the file of bench marks provided on the NGS Geoid18 web page were combined with the published ellipsoid, orthometric, and Geoid18 heights from NGS’ datasheet. The difference between the published geoid height (Geoid18) and the estimated geoid height [published NAD 83 (2011) ellipsoid height minus NAVD 88 orthometric height] was computed using the following formula:

    Data: National Geodetic Survey
    Data: National Geodetic Survey

    The box titled “Plot of Differences Based on GPS on Bench Marks Used in Geoid18” depicts these differences based on the stations used to generate Geoid18.

    Plot of Differences Based on GPS on Bench Marks Used in Geoid18

    Image: National Geodetic Survey
    Image: National Geodetic Survey

    Most of the values depicted on the plot are within the +/- 2 cm which is what you’d expect because the standard deviation of the overall fit is 1.4 cm. One to two centimeters is a very reasonable difference between the modeled and computed values. The question someone may ask is, I thought the model should be good to 1.4 cm so why are there large residual values on the map? There are several reasons why some of these differences are large but each case needs to be investigated to determine why they are large. This column will address one region as an example and provide a method for others to investigate differences in their area of interest.

    The box titled “Plot of GPS on Bench Mark Differences at the ND/MN Border” depicts a very large difference between the modeled geoid model and the estimated geoid height along the ND/MN border. As indicated in the box, the difference exceeds 6 cm.

    Plot of GPS on Bench Mark Differences at the ND/MN Border

    Image: National Geodetic Survey
    Image: National Geodetic Survey

    The box titled “Plot of GPS on Bench Mark Stations in the ND/MN Border Region” depict the bench marks involved in the development of Geoid18. The green circles represent the GPSBMs stations used in the creation of Geoid18 and the red “x” denote the stations that were not used in the creation of the model. As indicated in the plot, there were a lot of GPSBMs stations in the State of Minnesota (11,011).

    Plot of GPS on Bench Mark Stations in the ND/MN Border Region

    Image: National Geodetic Survey
    Image: National Geodetic Survey

    The box titled “Differences on GPS on Bench Marks in ND/MN Border — NOT Used in Model” depict the values of the rejected GPS on BMs stations. These stations were not used to create the hybrid geoid model Geoid18. As the plot indicates there are several large differences. This is not really surprising since these stations were not used in the model.

    Differences on GPS on Bench Marks in ND/MN Border — NOT Used in Model

    Image: National Geodetic Survey
    Image: National Geodetic Survey

    The box titled “Differences on GPS on Bench Marks in ND/MN Border — USED in Model” depict the values of the GPS on BMs stations used to create the Geoid18 model. Some of these differences exceed 8 cm. You would expect these differences to be small since these stations were used to create the model. So, why are there large post-modeled residuals in the Fargo, ND, region of the United States?

    Differences on GPS on Bench Marks in ND/MN Border – USED in Model

    Image: National Geodetic Survey
    Image: National Geodetic Survey

    In August 2019, NGS performed a large leveling network adjustment in the Minnesota. The adjustment was performed after the Geoid18 database pull. The adjustment resulted in a 7- to 9-cm bias between the published height values and the superseded values. The August 2019 Minnesota leveling network adjustment heights were not used in the creation of Geoid18. The post-modeled differences presented in this column were generated using the published NAD 83 (2011) ellipsoid heights and current NAVD 88 orthometric heights from the NGSIDB. It was determined by NGS that the differences in the Fargo region were mostly due to crustal movement. Therefore, since the differences were due to movement, secondary adjustments will need to be performed to feather the 7- to 9-cm differences to maintain consistency between published NAVD 88 heights in the region. The secondary adjustments have not been completed as of the publication of this column so the residuals west of Fargo in North Dakota are small. These values will change after the secondary adjustment is completed and loaded into NGS’ database.

    As an example, I’ve highlighted the station Fargo 0009 (PID DF7623) in the area of Fargo, North Dakota (see box titled “Differences on GPS on Bench Marks Near Fargo, ND”). The difference (-8.3 cm) is between the published Geoid18 value and the computed geoid value using the published ellipsoid height and orthometric height from the NGS’ datasheet. The box titled “Excerpt from Datasheet for Station Fargo 0009 (DF7623)” provides the information from NGS datasheet for station Fargo 0009; the information used in the computations are highlighted in the box. The box titled “Computation of the Difference between the Modeled Geoid Value (Geoid18) and the Computed Geoid Value for Fargo 0009” provides the process used to compute all differences for this column.

    Differences on GPS on Bench Marks Near Fargo, North Dakota

    Image: National Geodetic Survey
    Image: National Geodetic Survey

    Excerpt from Datasheet for Station Fargo 0009 (DF7623)

    Data: National Geodetic Survey
    Data: National Geodetic Survey
    Data: National Geodetic Survey
    Data: National Geodetic Survey
    Data: National Geodetic Survey
    Data: National Geodetic Survey

    Computation of the Difference between the Modeled Geoid Value (Geoid18) and the Computed Geoid Value for Fargo 0009
    (Information from NGS Published Datasheet)

    Data: National Geodetic Survey
    Data: National Geodetic Survey

    So, why is this difference so large in this region? A stated above, NGS performed a readjustment in this region and superseded the heights that were used in the creation of the Geoid18 hybrid model. The Geoid18 hybrid model used the previously published orthometric heights, now provided in the superseded section of the NGS datasheet, because that was the current published height at the time of the data pull for the Geoid18 process. Therefore, if we substitute the superseded height from the datasheet into the equation the difference is reduced to 0.1 cm (1 mm). [See the box titled “Computation of the Difference between the modeled geoid value (Geoid18) and the computed geoid value for Fargo 0009 Using the Superseded NAVD 88 Value.”]

    Computation of the Difference between the modeled geoid value (Geoid18) and the computed geoid value for Fargo 0009 Using the Superseded NAVD 88 Value
    (Information from NGS Published Datasheet)

    Data: National Geodetic Survey
    Data: National Geodetic Survey

    This means if someone uses NGS’ OPUS web tool to compute a GNSS-derived orthometric height, the NAVD 88 GNSS-derived orthometric height will be about 8 cm different than the published stations in this region. This should not be an issue if the users follow published NGS Guidelines to estimate the NAVD 88 GNSS-derived orthometric height, and/or uses NGS Beta OPUS-Projects and NGS procedures to estimate the NAVD 88 GNSS-derived orthometric height. These processes will ensure that the height will be consistent with the current published NAVD 88 orthometric heights in the NGS database.

    The technical report on Geoid18 provides a good explanation on the stations used in the United States Gulf Coast region. See box titled “GPS on Bench Marks for GEOID18 in the Gulf Coast Region.”

    GPS on Bench Marks for GEOID18 in the Gulf Coast Region

    (https://www.ngs.noaa.gov/GEOID/GEOID18/geoid18_tech_details.shtml)

    There are areas of complex vertical crustal motion in the Texas/Louisiana Gulf Coast region of the United States which render many control station elevations in the region invalid. The selection of GPS on Bench Marks in this region was limited to the small number of marks where the leveling and GPS data agreed to minimize the influence of crustal motion in the hybrid geoid model. Figure 1 depicts the selection of stations used in the hybrid geoid model along the Texas/Louisiana Gulf Coast.

    Image: National Geodetic Survey
    Figure 1: GEOID18 Gulf Coast selected marks. (Image: National Geodetic Survey)

    As indicated in the box titled “GPS on Bench Marks for GEOID18 in the Gulf Coast Region” very few stations in Southern Louisiana were used in the creation of the hybrid geoid model. The box titled “Differences on GPS on Bench Marks in the Gulf Coast Region” depict the differences between the published Geoid18 value and the computed geoid value using the latest NAD 83 (2011) ellipsoid and NAVD 88 orthometric height. The plot indicates that there are many large differences. This is to be expected because the orthometric heights used in the creation of the hybrid geoid model are all superseded heights. This is because the only published heights in Southern Louisiana are GNSS-derived orthometric heights and leveling-derived orthometric heights were used in the creation of GEOID18.

    Differences on GPS on Bench Marks
    in the Gulf Coast Region

    Image: National Geodetic Survey
    Image: National Geodetic Survey

    Saying that, NGS performed a large GNSS network project in Southern Louisiana in 2016. At the time of the writing of this column, the GNSS-derived orthometric height from the 2016 project were not yet finalized.

    This column provided an analysis of the differences between the latest published hybrid Geoid18 values provided on NGS’ Datasheet and the computed geoid height value using the published NAD 83 (2011) ellipsoid height and NAVD 88 orthometric height. The column highlighted issues on differences due to published heights that have changed since the database pull for Geoid18. Future columns will address differences in other portions of CONUS.

  • Discussing the new North American-Pacific Geopotential Datum of 2022 — Part 1

    Discussing the new North American-Pacific Geopotential Datum of 2022 — Part 1

    On April 24-25, 2017, the National Geodetic Survey (NGS) hosted the 2017 Geospatial Summit in Silver Spring, Maryland, to discuss its plans for replacing the North American Datum of 1983 (NAD 83) and the North American Vertical Datum of 1988 (NAVD 88) in 2022.

    The summit was a day and a half long and provided an opportunity for NGS to share updates and discuss the progress of projects related to National Spatial Reference System (NSRS) Modernization. Stakeholders across the federal, public and private sectors also provided feedback and impacts of New Datums on their products and services.

    The absolute differences between the new vertical reference frame, North American-Pacific Geopotential Datum of 2022 (NAPGD2022), and NAVD 88 are going to be large but, in most regions of the country, the relative differences over small areal extents will be small.

    NGS is developing geodetic routines and tools to transform heights from NAVD 88 to NAPGD2022, and to facilitate the incorporation of geodetic leveling data into NAPGD2022 to establish NAPGD2022 heights. To prepare for the new datums and develop implementation plans, stakeholders should obtain an understanding of the differences between NAPGD2022 and NAVD 88.

    My previous columns provided figures that demonstrated the approximate differences between NAPGD2022 and NAVD 88 heights at a national level. (See figure 1.) This column will provide feedback from stakeholders that participated in the Geospatial Summit and, using NGS’ GPS on BMs dataset, a discussion on the differences between NAPGD2022 and NAVD 88 (and NGVD 29) at a local level.

    Figure 1 – Approximate Change Between NAPGD2022 and NAVD 88 Using GPS on BMs Data (units = cm). (Image: National Geodetic Survey)
    Figure 1 – Approximate Change Between NAPGD2022 and NAVD 88 Using GPS on BMs Data (units = cm). (Image: National Geodetic Survey)

    Information about the summit and Summit Documents can be downloaded here.

    Read an excerpt from website here.

    If you check on the tab titled “Summit Documents” you can download the agenda and documents provided to participates. Read excerpts from the summit here.

    The first day consisted of presentations by NGS leadership and personnel providing updates and discussing the progress of projects related to the NSRS modernization. The presentations by NGS employees can be downloaded from NGS’ presentations library at this web link. View an excerpt from NGS’ presentations library here.

    The afternoon of day 2 were presentations by partners and stakeholders. (See box titled “Excerpt from NGS 2017 Geospatial Summit Agenda – Afternoon of Day 2.”)

    Excerpt from NGS 2017 Geospatial Summit Agenda – Afternoon of Day 2
    Day 2 Afternoon Agenda from NGS’ 2017 Geospatial Summit
    Day 2: Tuesday, April 25, 20171:30 – 3:05 Impacts of New Datums on Programs and Partners (Part 1)
    Coastal Mapping Program and VDatum: Mike Aslaksen and Stephen White, NOAA/NGS
    Federal Emergency Management Agency (FEMA): Kimberly Pettit, FEMA
    U.S. Geological Survey (USGS): Kari Craun, USGS
    U.S. Army Corps of Engineers (USACE): Jim Garster, USACE
    National Geospatial-Intelligence Agency (NGA): Stephen Malys, NGA
    3:05 – 3:25 Break
    3:25 – 4:55 Impacts of New Datums on Programs and Partners (Part 2)
    Geospatial and Remote Sensing Customers: Amar Nayegandhi, Dewberry
    Geographic Information System (GIS) Customers: Kevin Kelly, Esri
    Global Navigation Satellite System (GNSS) Equipment Customers: Hamid Mahmoudabadi, Trimble Kyle Snow, Topcon
    State Government Partners: Gary Thompson, N.C. Department of Public Safety
    Local Government Partners: Vickie Anglin, Fairfax County Government, Virginia; Patrick Simon, Baltimore County Land Survey, Maryland
    4:55 – 5:00 Wrap-up and closing

    In order for consistency, NGS provided guidance and a set of template slides for guest presenters to use. Guest presenters were allotted 10 minutes to present and limited to four slides. The presentation by the guest presenters are not on NGS’ Presentations Library but I’ve been told that they will be available on the Summit website later this year. Gary Thompson, Chief of the North Carolina Geodetic Survey (NCGS), provided me a copy of his slides and gave me permission to include them in this column. (See box titled “Power point Slides Presented by Gary Thompson, Chief of NCGS, at the NGS 2017 Geospatial Summit.”) North Carolina has been very proactive in addressing the impacts of the new datums on NC products and services. North Carolina Geodetic Survey has established a North Carolina Geodetic Survey Advisory Committee that reviews NCGS products and services, and they have established the North Carolina 2022 Reference Frame Working Group to prepare for the new datums.

    Slide: National Geodetic Survey
    Slide: National Geodetic Survey

    Powerpoint slides presented by Gary Thompson, chief of NCGS, at the NGS 2017 Geospatial Summit

    All of the presentations by the invited guest speakers were interesting, and everyone followed NGS’ guidance which helped to focus the Summit on the main issues associated with a datum change. As expected, each stakeholder had their own set of issues and concerns about transitioning to a datum. The following are some common themes that I heard from the participants:

    (1) There are a lot of products and services that will be effected by a datum change,
    (2) An official transformation model between the old and new datum(s) published by NGS is critical for a successful transition to a new datum,
    (3) Guidance documents that are “easily” understood by “non-geodesists” is required for a smooth implementation of a new datum, and
    (4) More frequent geospatial summits and webinars are needed to provide updates on the status of the projects associated with NSRS modernization and to ensure user involvement in the process.

    I contacted a couple of the guest presenters to discuss their feedback on the New Datums. As NAVD 88 Program Manager, I collaborated with many of them during the development and implementation of the NAVD 88. As in the transition from NGVD 29 to NAVD 88, it’s not the conversion of coordinates that’s a problem; a good transformation tool should meet that requirement. Saying that, it was stated that many users rely on commercial and open source software to convert their data, so they would like NGS to collaborate with others to ensure that these software suppliers are using the appropriate algorithms/information in their products. The integration with legacy data referenced to older datums may be complicated for some products and services; therefore, the process of transforming each product and service will need to be addressed individually. If all data are in digital form with the appropriate metadata, then the transformation should be relatively easy to accomplish and maps with new contour lines or new base flood elevations referenced to the new datum could be generated. However, how these new maps are integrated with old maps is a different issue. I will address some of these potential issues in future columns.

    To prepare implementation plans, users must obtain a working knowledge of the differences between the old and new datums. As previous mentioned, the absolute differences between the new vertical reference frame, NAPGD2022, and NAVD 88 are going to be large but, in most regions of the country, the relative differences over small areal extents will be small. To evaluate the relative differences at the local level, the differences between NAPGD2022 and NAVD 88 (and NGVD 29) were computed for bench marks in the NGS’ GPS on BMs dataset. The NAD 83 (2011) latitude, longitude, and ellipsoid height of each station was transformed to the IGS08 reference frame using NGS’ HTDP web tool, and then the GNSS-derived orthometric height was computed using the following formula:

    Approximate NAPGD2022 GNSS-Derived Orthometric Height
    Equals
    IGS08 Ellipsoid Height minus xGeoid16b Geoid Height (referenced to IGS08).

    Figure 1 is a plot of the difference between the approximate NAPGD2022 height and the published NAVD 88 height for bench marks that are part of the GPS on BMs dataset and have the published attribute of “Adjusted.” It should be noted that these are only estimated changes because the final NAPGD2022 reference frame will not be exactly the same as the current IGS08 reference frame, but these estimates should serve the purpose of providing approximate changes for users to develop transition plans.

    Since some users are still converting NGVD 29 heights to NAVD 88 heights, the approximate change between NAPGD2022 and NGVD 29 is provided in figure 2. VERTCON values were used to convert the NAVD 88 published heights to NGVD 29 heights, and then the difference between the approximate NAPGD2022 orthometric height and the NGVD 29 orthometric height was computed.

    Figure 2 – Approximate Change Between NAPGD2022 and NGVD 29 Using GPS on BMs Data (units = cm). (Image: National Geodetic Survey)
    Figure 2 – Approximate Change Between NAPGD2022 and NGVD 29 Using GPS on BMs Data (units = cm). (Image: National Geodetic Survey)

    As shown in figure 2, the absolute differences between the new vertical reference frame, NAPGD2022, and NGVD 29 are also going to be large but, once again, in most regions of the country, the relative differences over small areal extents will be small.

    What does this look like in a local area? Figure 3 is a plot of the approximate change between NAPGD2022 and NAVD 88 in North Carolina and surrounding states, and figure 4 is plot of the approximate change between NAPGD2022 and NGVD 29 in North Carolina and surrounding states.

    Figure 3 – Approximate Change Between NAPGD2022 and NAVD 88 in North Carolina and Surrounding States Using GPS on BMs Data (units = cm). (Image: National Geodetic Survey)
    Figure 3 – Approximate Change Between NAPGD2022 and NAVD 88 in North Carolina and Surrounding States Using GPS on BMs Data (units = cm). (Image: National Geodetic Survey)
    Figure 4 – Approximate Change Between NAPGD2022 and NGVD 29 in North Carolina and Surrounding States Using GPS on BMs Data (units = cm). (Image: National Geodetic Survey)
    Figure 4 – Approximate Change Between NAPGD2022 and NGVD 29 in North Carolina and Surrounding States Using GPS on BMs Data (units = cm). (Image: National Geodetic Survey)

    Figure 5 provides a more detailed depiction of the change between NAPGD2022 and NAVD 88 along the North Carolina Atlantic Coast. The differences appear to vary by several centimeters but some of these differences are due to errors in published heights (both ellipsoid and orthometric). These differences can be used to develop a transformation model but the user will need to know the accuracy of the model, globally and locally.

    Figure 5 – Approximate Change Between NAPGD2022 and NAVD 88 along North Carolina Atlantic Coast Using GPS on BMs Data (units = cm). (Image: National Geodetic Survey)
    Figure 5 – Approximate Change Between NAPGD2022 and NAVD 88 along North Carolina Atlantic Coast Using GPS on BMs Data (units = cm). (Image: National Geodetic Survey)

    Figure 6 is a detailed depiction of the change between NAPGD2022 and NGVD 29 in the same area as shown in figure 5. Comparing figures 5 and 6, the reader should notice that the differences between NAPGD2022 and NGVD 29 are about 30 cm larger (more negative) than the differences between NAPGD2022 and NAVD 88.

    Figure 6 – Approximate Change Between NAPGD2022 and NAVD 29 along North Carolina Atlantic Coast Using GPS on BMs Data (units = cm). (Image: National Geodetic Survey)
    Figure 6 – Approximate Change Between NAPGD2022 and NAVD 29 along North Carolina Atlantic Coast Using GPS on BMs Data (units = cm). (Image: National Geodetic Survey)

    Figure 7 is the difference between NAPGD2022 and NAVD 88 in western North Carolina. The local difference in the NC mountains is around -35 cm which is about 10 cm different from the NC Atlantic Coast. Questions that users need to address include: What is the accuracy of the transformation model? And What is the accuracy of the product or service being transformed? The transformation model will not replace the original survey results but may be useful for transforming some products and services.

    Figure 7 – Approximate Change Between NAPGD2022 and NAVD 88 in the Western North Carolina Using GPS on BMs Data (units = cm). (Image: National Geodetic Survey)
    Figure 7 – Approximate Change Between NAPGD2022 and NAVD 88 in the Western North Carolina Using GPS on BMs Data (units = cm). (Image: National Geodetic Survey)

    Table 1 provides the average difference between NAPGD2022 and NAVD 88 (and NGVD 29) by State using the GPS on BMs dataset. This table shows that there are large differences between NAPGD2022 and both NGVD 29 and NAVD 88. No matter which datum the product or service is referenced to, it will probably need to be transformed to NAPGD2022.

    Table 1 – Average Difference Between NAPGD2022 and NAVD 88 (and NGVD 29) by State Using GPS on BMs Dataset (units = cm). Click to enlarge. (Date: National Geodetic Survey)
    Table 1 – Average Difference Between NAPGD2022 and NAVD 88 (and NGVD 29) by State Using GPS on BMs Dataset (units = cm). Click to enlarge. (Date: National Geodetic Survey)
    Average Difference Between NAPGD2022 and NAVD 88 by State Using GPS on BMs Dataset (units = cm). Click to enlarge. (Date: National Geodetic Survey)
    Average Difference Between NAPGD2022 and NAVD 88 by State Using GPS on BMs Dataset (units = cm). Click to enlarge. (Date: National Geodetic Survey)

    Table 2 provides the standard deviation of the average difference between NAPGD2022 and NAVD 88 by State. For example, North Carolina has a sample size of 1600 stations and its average difference is -28 cm with a standard deviation of 4.8 cm. Looking at figures 5 and 7, there appears to be a difference of 10 cm across the State. The States in the northwestern region of the United States have a larger difference between NAPGD2022 and NAVD 88 as well as a larger standard deviation. Oregon has a sample size of 195 stations and its average difference is -100.7 cm with a standard deviation of 13.0 cm, and Washington has a sample size of 266 stations and its average difference is -108.8 cm with a standard deviation of 9.0 cm. Figure 8 is a plot of the approximate change between NAPGD2022 and NAVD 88 in the northwest region of the United States.

    As mentioned previously, these differences will vary from station to station because of a bias and trend between the two datums and due to remaining errors in published heights (both ellipsoid and orthometric). As I have noted in previous columns, many of the large relative differences between stations in a local area could be due to an invalid NAVD 88 published height because the bench mark moved since the last time the height of the bench mark was adjusted and published, and/or an undetected error in an ellipsoid height due to a weak GNSS project design. Either way, in my opinion, most of these stations with large relative differences don’t accurately represent the current NAVD 88. NGS’ modernization of the NSRS will provide a more accurate and consistent reference frame, and improve the user’s ability to obtain a current and accurate orthometric height.

    Figure 8 – Approximate Change Between NAPGD2022 and NAVD 88 in the Northwest Region of the United States Using GPS on BMs Data (units = cm). (Image: National Geodetic Survey)
    Figure 8 – Approximate Change Between NAPGD2022 and NAVD 88 in the Northwest Region of the United States Using GPS on BMs Data (units = cm). (Image: National Geodetic Survey)

    This column highlighted some of the feedback provided by guest presenters at the NGS’ 2017 Geospatial Summit held on April 24-25, 2017, in Silver Spring, Maryland. The column also provided a discussion on the approximate differences between NAPGD2022 and NAVD 88 (and NGVD 29) at a national and local level. To prepare for the new datums and develop implementation plans, users should obtain an understanding of the differences between NAPGD2022 and NAVD 88. This column is the first in a new series of columns addressing topics associated with transitioning to the new North American -Pacific Geopotential Datum of 2022 (NAPGD2022).