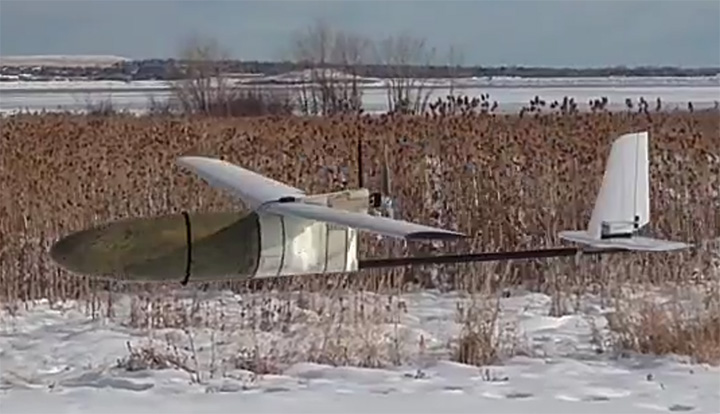
Joseph Cione, hurricane researcher at NOAA’s Atlantic Oceanographic and Meteorological Laboratory and principal investigator of NOAAs Coyote project, holds the UAV in front of NOAAs P-3 aircraft at MacDill Air Force Base in Tampa, Florida. (Photo: National Oceanic and Atmospheric Administration) (PRNewsfoto/Raytheon Company)
Developed for the military, Coyote is a small, expendable UAV that’s air- or ground-launched into environments too dangerous for manned aircraft. The system can fly for more than an hour and up to 50 miles from its host aircraft.
“Weather forecasters are able to better understand storm behavior and improve hurricane models based on the real-time information provided by our Coyotes,” said Thomas Bussing, Raytheon vice president of Advanced Missile Systems. “Coyote UAVs are collecting and delivering robust storm data that could ultimately save lives.”
In 2017, NOAA researchers deployed six Coyote UAVs to track and model Hurricane Maria. Launched from a NOAA WP-3D Orion hurricane hunter aircraft, the Coyotes flew directly into the storm, giving researchers an unprecedented view of Maria.
Traditional weather instruments are dropped from planes and capture only a snapshot of storm behavior, but Coyote’s winged design allowed it to linger and return to key areas of a hurricane to gather more data and transmit it near-real-time to researchers.
“We think unmanned technologies that explore dangerous and difficult to observe regions of the storm may improve our physical understanding, provide enhanced situational awareness and might ultimately improve the accuracy of hurricane intensity forecasts in the future,” said Joseph Cione, a hurricane researcher at NOAA’s Atlantic Oceanographic and Meteorological Laboratory and principal investigator of NOAA’s Coyote project. “The Coyotes we deployed in Hurricane Maria collected critical, continuous observations in the lower part of the hurricane, an area impossible to reach with manned aircraft.”
The Coyote UAV was first deployed in 2014, when NOAA launched four of the systems into Hurricane Edouard, a Category 3 storm. Scientists on board the aircraft collected meteorological data in both the eye of the storm and the surrounding eye wall.
Here in the U.S., this past summer saw an unprecedented number of emergency situations. Hurricanes blasted Texas, Florida, the U.S. Virgin Islands and Puerto Rico, leaving people stranded and without power, while wildfires ravaged the west.
So far this year, 15 separate weather and climate disasters have each caused at least $1 billion in damages in the U.S., according to the National Oceanic and Atmospheric Administration (NOAA), meaning, 2017 could tie 2011 for the most billion-dollar disasters. The USA Today chart shows those events.
In Oregon where I live, we experienced unprecendented smoky skies from wildfires — the hazardous air quality affected the health of many.
The silver lining? Growing expertise in the fields of disaster response, mapping, location awareness, UAVs and imagery. We continue to improve our ability to respond to disasters, such as with Waze traffic alerts for wildfire evacuations and UAVs that bring a virtual doctor to a crisis scene along with medicine. We use state-of-the-art technology to learn more about how, why and when disasters happen with tools such as UAVs that penetrate the mysteries of active hurricanes.
Aircraft to Provide Wildfire Measurements in Support of NOAA Fire Weather Forecasting
The U.S. National Oceanic and Atmospheric Administration (NOAA) has selected a small unmanned aircraft system (sUAS) for wildfire measurements and observations in support of its FIREX field mission and the fire weather forecasting initiative.
Black Swift Technologies will deliver to NOAA a tightly integrated system consisting of an airframe, avionics and multiple sensors capable of research-quality measurements of CO2, CO, aerosol, RH, p and T in wildfire plumes, as well as multispectral high-resolution maps of wildfires.
The SuperSwift sUAS will be operated by the University of Colorado’s Integrated Remote & In Situ Sensing Program (IRISS) in close collaboration with NOAA.
“One of the purposes of IRISS is to work with the science community to develop and deploy platforms which make primarily in situ measurements,” said Brian Argrow, IRISS director. “This naturally lead us to partnerships with NOAA on the science perspective, and to Black Swift Technologies for their sUAS technology and expertise. It’s a partnership that looks like a three-legged stool with the science interest of NOAA, the technology and engineering expertise of IRISS, and the unique sUAS platform designed by Black Swift Technologies, as the corresponding legs.”
The FireFOX sUAS is based on Black Swift’s commercially available SuperSwift airframe and SwiftCore Flight Management System — designed to be cost-effective, powerful and easy to operate in the field.
The SuperSwift is specifically engineered to meet the demands of high-altitude flights through strong winds and damaging airborne particulates typical of nomadic scientific field campaigns in harsh environments.
The SuperSwift sUAS has a forward-located, spacious, interchangeable nose-cone payload bay. (Photo: Black Swift)
“While there are many sUAS manufacturers for agencies like NOAA to consider, most are simply not suitable for scientific atmospheric measurements,” said Jack Elston, CEO of Black Swift Technologies.
The SuperSwift addresses NOAA’s requirements for endurance and operational radius (> 2 hours and between 30 to 60 km) sufficient for fire observations, its payload capability (up to 5 pounds), and its unique forward-facing payload bay, “ideal for atmospheric sampling and for easy instrument package swapping,” Elston said.
The ultimate goal of NightFOX is to perform nighttime in situ measurements of wildfire plumes and remote measurements of wildfire properties, with the measurement data used to improve fire weather forecasting.
Because of safety concerns and dangers associated with nighttime operations, manned aircraft flights are limited to daytime operations. Ground observations using a mobile laboratory provide detailed chemical information on fire plumes, but lack information on plume spatial distribution to put the point measurements in context.
UAS observations are the only technology capable of this task. sUAS observations can provide useful information for firefighting efforts by accurately detecting fire perimeter and identifying fire hotspots, but have not attempted to make measurements relevant to studying fire emissions or incorporate observations into fire forecast models.
“Our proposed work, if successful, will significantly advance the integration of UAS-based observations of wildfires into fire-weather modeling and forecasting,” said Ru-Shan Gao, principal investigator, Chemical Sciences Division, Earth Systems Research Laboratory, NOAA.
The collected data will also provide otherwise missing data for studying the impact of North American wildfires on the atmosphere and human health. It will ultimately support better land-management decisions and practices, contributing to NOAA’s core mission to advance understanding and prediction of the Earth system to enhance society’s ability to make effective decisions.
IRISS, a pillar of the CU Boulder Grand Challenge, is a multi-disciplinary team that leads the design, development and deployment of novel remote and in-situ sensing systems to exploit mobility enabled by aerospace systems to enhance data collection from the ground, in the atmosphere and from
space.
With its partners, IRISS explores commercial opportunities and fosters discussions on the ethical, legal, and social policy implications of new technologies and big-data collection.
The existence of a sUAS capable of carrying the necessary instruments routinely through harsh environments adds an invaluable contribution to the calibration and validation of data collected from ground- and satellite-based methods.
The innovations of the SuperSwift, including the total sensor suite, can be used for scientific research by federal and state public agencies and other state-funded laboratories to collect data on coherent atmospheric structures such as smog, volcano plumes, wildfire smoke, chemical fires, forest humidity, and studying oil and gas field flares for calibration/validation of satellite measurements.
“NOAA is interested in a UAS observational system (UASOS) that can use be used for fire-related measurements, and so in a sense what we want to know is when and where does the fire flow and ultimately what kind of fire and air quality will result regionally,” Gao said. “We want to monitor the fire and incorporate the remote and in situ measurements into a fire forecast model so ultimately we’ll be able to do better fire forecasts that will help firefighters better fight the fire and keep human and property losses to a minimum.”
The U.S. National Oceanic and Atmospheric Administration (NOAA) is seeking new members for its Hydrographic Services Review Panel, a federal advisory committee that advises the NOAA administrator on the agency’s hydrographic programs, products and technology.
“We depend on the perspectives of the people who rely on NOAA maritime products, especially for safety at sea or commercial efficiency, as we plan for improvements of our navigation data, services, and products,” said Russell Callender, Ph.D., assistant NOAA administrator for the National Ocean Service. “This panel is a vital part of our information gathering process to determine future priorities.”
The panel advises NOAA on hydrographic surveying, nautical charts, tides and currents, geodetic and geospatial measurements, and coastal preparedness.
Applicants should have expertise in one or more of the following fields:
marine navigation and technology,
port administration,
marine shipping or other intermodal transportation industries,
cartography and geographic information systems,
geodesy,
physical oceanography,
coastal resource management, including coastal preparedness and emergency response,
other related scientific fields.
Applications must be received by May 30;those received after the deadline will be kept on file and may be used for future panel vacancies. Members serve four-year terms, with meetings occurring at least twice a year.
Hurricane Fran at peak intensity on Sept.4, 1996. (Image: NOAA)
The Washington Post reported March 3 that the Trump administration proposes slashing the budget of the National Oceanic and Atmospheric Administration (NOAA) by 17 percent, cutting steeply into climate change research funding and satellite programs.
The Post cited a four-page budget memo it obtained. In the memo, NOAA’s Office of Oceanic and Atmospheric Research would lose $126 million, or 26 percent, of its funding, while NOAA’s satellite data division would lose $513 million, or 22 percent, of its funding.
The proposed cuts to NOAA would also eliminate funding for f smaller programs, including external research, coastal management, estuary reserves and “coastal resilience,” which seeks to bolster the ability of coastal areas to withstand major storms and rising seas.
NOAA is part of the Commerce Department, which would be hit by an overall 18 percent budget reduction from its current funding level.
Today, more than 16 years of space-weather data is publicly available for the first time in history. The data comes from space-weather sensors on board the nation’s GPS satellites.
The newly available data gives researchers a treasure trove of measurements they can use to better understand how space weather works and how best to protect critical infrastructure, such as the nation’s satellites, aircraft, communications networks, navigation systems and electric power grid.
A feature article providing an overview of the data that have been released was published today in Space Weather, a journal of the American Geophysical Union.
“Space-weather monitoring instruments developed at Los Alamos have been fielded on GPS satellites for decades,” said Marc Kippen, program manager at Los Alamos National Laboratory in New Mexico, which developed the space weather sensors. “Today, 23 of the nation’s more than 30 on-orbit GPS satellites carry these instruments. When you multiply the number of satellites collecting data with the number of years they’ve been doing it, it totals more than 167 satellite years. It’s really an unprecedented amount of information.”
An image illustrating the six orbital planes in which GPS satellites (“navigational satellites,” or ns) fly around Earth. This configuration shows the orbits just before the start of this solar cycle’s biggest geomagnetic storm, which occurred on March 17, 2015. The darkest orbital lines indicate the position of the satellites in that moment; the lightest lines indicate where they were 12 hours prior. (Credit: Los Alamos National Laboratory)
Extreme space-weather events have the potential to significantly threaten safety and property on Earth, in the air, and in space.
For example, the hazard of increased radiation exposure from charged particles released during a large solar flare could require that flights be diverted away from a polar route.
Similarly, sudden bursts of plasma and magnetic field structures (coronal mass ejections, or CMEs) from the sun’s atmosphere and high-speed solar wind could significantly disable large portions of the electric power grid. The resulting cascading failures could disturb air traffic control, disrupt the water supply, and interfere with life-saving medical devices.
In space, the charged particles measured by the Los Alamos-GPS sensors are the primary limit on how long a satellite can operate in space before succumbing to the damaging effects of radiation.
In extreme events those particles can cause malfunction of satellites or even catastrophic failure of entire satellite systems.
For example, in April 2010, a large magnetic disturbance resulted in a communications failure, causing a satellite to uncontrollably drift in space and presenting a hazard to nearby satellites.
Currently, scientists are unable to predict when these extreme events will occur, how strong they will be, or how severe the effects will be. The release of Los Alamos-GPS data enables new studies that will help answer these questions.
The Los Alamos-GPS sensors continuously measure the energy and intensity of charged particles, mainly electrons and protons, energized and trapped in Earth’s magnetic field. These trapped particles form the Van Allen radiation belts, which are highly dynamic—varying on time scales from minutes to decades. From GPS orbit (roughly 12,600 miles above Earth), satellite-borne sensors probe the largest radiation belt—consisting mainly of energetic electrons.
Each of the 23 sensors in the current GPS constellation makes detailed measurements of the belts every six hours. Together the sensors provide 92 complete measurements of the belts every day. The newly released measurements constitute a nearly continuous global record of the variability in this radiation belt for the past 16 years, including how it responds to solar storms. The data provides an invaluable record for understanding radiation-belt variability that is key to developing effective space-weather forecasting models.
Los Alamos has been anticipating greater awareness of the nation’s vulnerability to space weather since the 1990s, when it began aligning its space-weather research activities with its critical-infrastructure program. “This led to an awareness that we could expand the utility of our space-weather data to programs beyond the specific requirements they were designed for,” said Kippen, a co-author of the feature article.
The public release of GPS energetic-particle data was conducted under the terms of an October 2016 White House Executive Order. It culminates years of work between the Office of Science and Technology Policy and the National Security Council to coordinate interagency efforts aimed at improved understanding, prediction and preparedness for potentially devastating space-weather events. The specific goal of releasing space-weather data from national-security assets such as GPS satellites is to enable broad scientific community engagement in enhancing space-weather model validation and improvements in space-weather forecasting and situational awareness.
“The US DoD, the Office of Science Technology Policy, and the broader space weather enterprise deserve our support and thanks for this data release,” Delores Knipp, editor-in-chief of Space Weather, wrote in a blog post accompanying the feature article. “This cache of data will likely drive fundamental new developments in geospace research. The data release should be emulated by other nations as they invest in space-based global and regional navigation satellite systems.”
The U.S. Geological Survey (USGS) released six new sets of publicly available maps that show the diverse and complex range of seafloor habitats along 80 miles of the central California coast from the Monterey Peninsula north to Pigeon Point, according to a news release form the organization.
The new USGS publications, products of the California Seafloor Mapping Program, combine new and legacy data to reveal offshore bathymetry, habitats, geology and seafloor environments in high resolution. Environments range from the rugged granitic bedrock along the coasts of the Monterey Peninsula, to the bedrock reefs that form the surfing point breaks on the Santa Cruz County coast, to the smooth sand and mud in a large delta bar at the mouth of the Salinas River, and to the steep walls and sinuous channels of one of the largest underwater canyon systems in the world.
“The new high-resolution datasets and maps are stimulating research – scientists are excited,” said Sam Johnson, the USGS project lead. “Our stakeholders like to say that you can’t manage it, monitor it or model it if you don’t know what the ‘it’ is. Our seafloor mapping provides that important ‘it’ to the entire coastal community.”
Seamless onshore-offshore geologic maps incorporating subsurface data document the location and geometry of the San Gregorio fault and show how different strands of the fault extend through Carmel Canyon — across the continental shelf west of Santa Cruz and Davenport — and combine to uplift Año Nuevo State Park and Año Nuevo Island. A separate fault system to the east in Monterey Bay is part of an actively deforming wedge of the Earth’s crust caught between the converging San Andreas and San Gregorio faults, the organization said. The six new sets of California maps are Offshore of Pigeon Point, Offshore of Scott Creek, Offshore of Santa Cruz, Offshore of Aptos, Offshore of Monterey Canyon and Vicinity and Offshore of Monterey.
Each publication includes 10 map sheets, a pamphlet and a digital data catalog with web services. The web services are a new addition to the publications and all previous products in the map series, and can be viewed on smartphones. The USGS said the maps and data provide:
A foundation for assessing marine protected areas and habitats.
An understanding how marine species such as bull kelp, rockfish, crabs and sea otters use the seafloor.
Baselines for monitoring coastal change and sea-level-rise impacts.
Critical input data for modeling and mitigation of coastal flooding.
A framework for understanding coastal erosion and developing regional sediment management plans.
Contributions to earthquake and tsunami hazard assessments.
More accurate data for safer navigation.
Essential information for planning, siting or removing offshore infrastructure.
“These new seafloor maps – used in partnership with the USGS – will give us an additional tool to protect Californians, as well as fish and wildlife,” said John Laird, California’s secretary for natural resources and OPC chair. “The new maps will be used to analyze offshore faults and earthquake hazards. They will also help us identify sources of sand to replenish beaches – and will help establish a scientific baseline to track changes in habitat near shore over time. This investment will pay off for Californians in ways that we cannot even imagine now.”
As the Gulf Coast begins another hurricane season, researchers with the Conrad Blucher Institute for Surveying and Science (CBI) at Texas A&M University-Corpus Christi will be improving the data collection system to allow for more accurate planning and predictions for flooding and sea-level rise.
CBI has been awarded $1.35 million to enhance the National Spatial Reference System that helps model and predict sea level rise.
Forecasters are predicting a hurricane season with one or two major hurricanes, but flooding can still pose significant threat, especially to the vital infrastructure along the Gulf coast, which includes 10 of the 14 largest ports. The long-term stability of this region’s infrastructure is in question due to the impact of sea level rise and associated increases in risks of flooding. Growing Gulf coastal populations, up 32 percent from 1990 to 2008, compound the risks. Preparing for sea level rise, flooding and other impacts requires accurate data about what’s occurring at the water’s edge. Collection methods for this type of geospatial data will be enhanced through this project.
The funding, from the National Geodetic Survey, a project of the National Oceanic and Atmospheric Administration, provides the foundation for modeling along the northern Gulf of Mexico through the National Spatial Reference System.
The project focuses on an area that is most exposed to inundation from tropical storm surge and has a high risk of flooding and long-term effects of climate change and subsidence.
“We are excited to be part of this project to provide the latest geospatial data with information from tide gauges, sea level observations, land elevation reference points, and 3D positioning,” said Gary Jeffress, director of CBI. “This system will help local and regional leaders plan for improved resilience to the impacts of sea level rise and flooding and develop long-term strategies to address impacts along the northern Gulf of Mexico.”
The project will extend and improve monitoring stations from Texas to the Florida Keys to provide additional measurements, including more accurate data regarding elevations, 3D positioning, subsidence rates and sea level observations, that will establish ongoing monitoring of the relative sea-level change along the northern Gulf of Mexico in the coming decades.
Jeffress, Ruizhi Chen and James Rizzo, with CBI and Texas Spatial Reference Center, will lead the project for A&M-Corpus Christi. Researchers from University of Southern Mississippi, Louisiana State University and Florida Atlantic University are also partners in the project.