NV5 Geospatial, a large geospatial data company, provides services for airport projects across the United States and U.S. territories — mainly supporting airport planning and engineering firms that must meet FAA survey and mapping requirements for data collection at airports. “We generally are a sub-consultant to them, helping them achieve those survey standards for collecting the data and submitting it to the FAA,” said David Grigg, the company’s Aviation Program Director. Typically, this is around planning projects such as airport layout plans and master plans, but also engineering projects such as runway extensions and runway reconstructions.
As an example, Grigg cited the extension of a runway, which requires new flight procedures to be established. “Two survey missions are required for runway extensions. The primary mission is to establish control for the aerial imagery. Using the imagery, control and design data, we check for obstacles photogrammetrically. That data is sent to the FAA and procedures are developed. After construction is complete, we go back to the airport to survey the changed runway and navigational aids (NAVAIDS) to verify that what was designed was ultimately built.”
Another way in which NV5 Geospatial supports airport clients is by conducting obstruction studies around them for vegetation management. “That’s generally where we pull in the lidar surveys,” said Grigg. The FAA’s standards for relative and absolute positioning accuracy for trees are “rather generous” by surveying standards, he said. “We’re talking two to three feet vertically and twenty feet horizontally. It’s not like a typical mapping job where you’re guaranteeing it to one foot or better horizontally and half foot or better vertically.”
The FAA, he points out, has published guidance on how lidar may be used. “We mostly use aerial photogrammetry to support projects in the FAA’s airports GIS program. When we collect lidar at an airport, we do it to generate contours and to identify individual tree canopies. Our lidar-derived data is most often developed to benefit airports for tree mitigation not for FAA airports GIS survey projects.”
Image: NV5 Geospatial
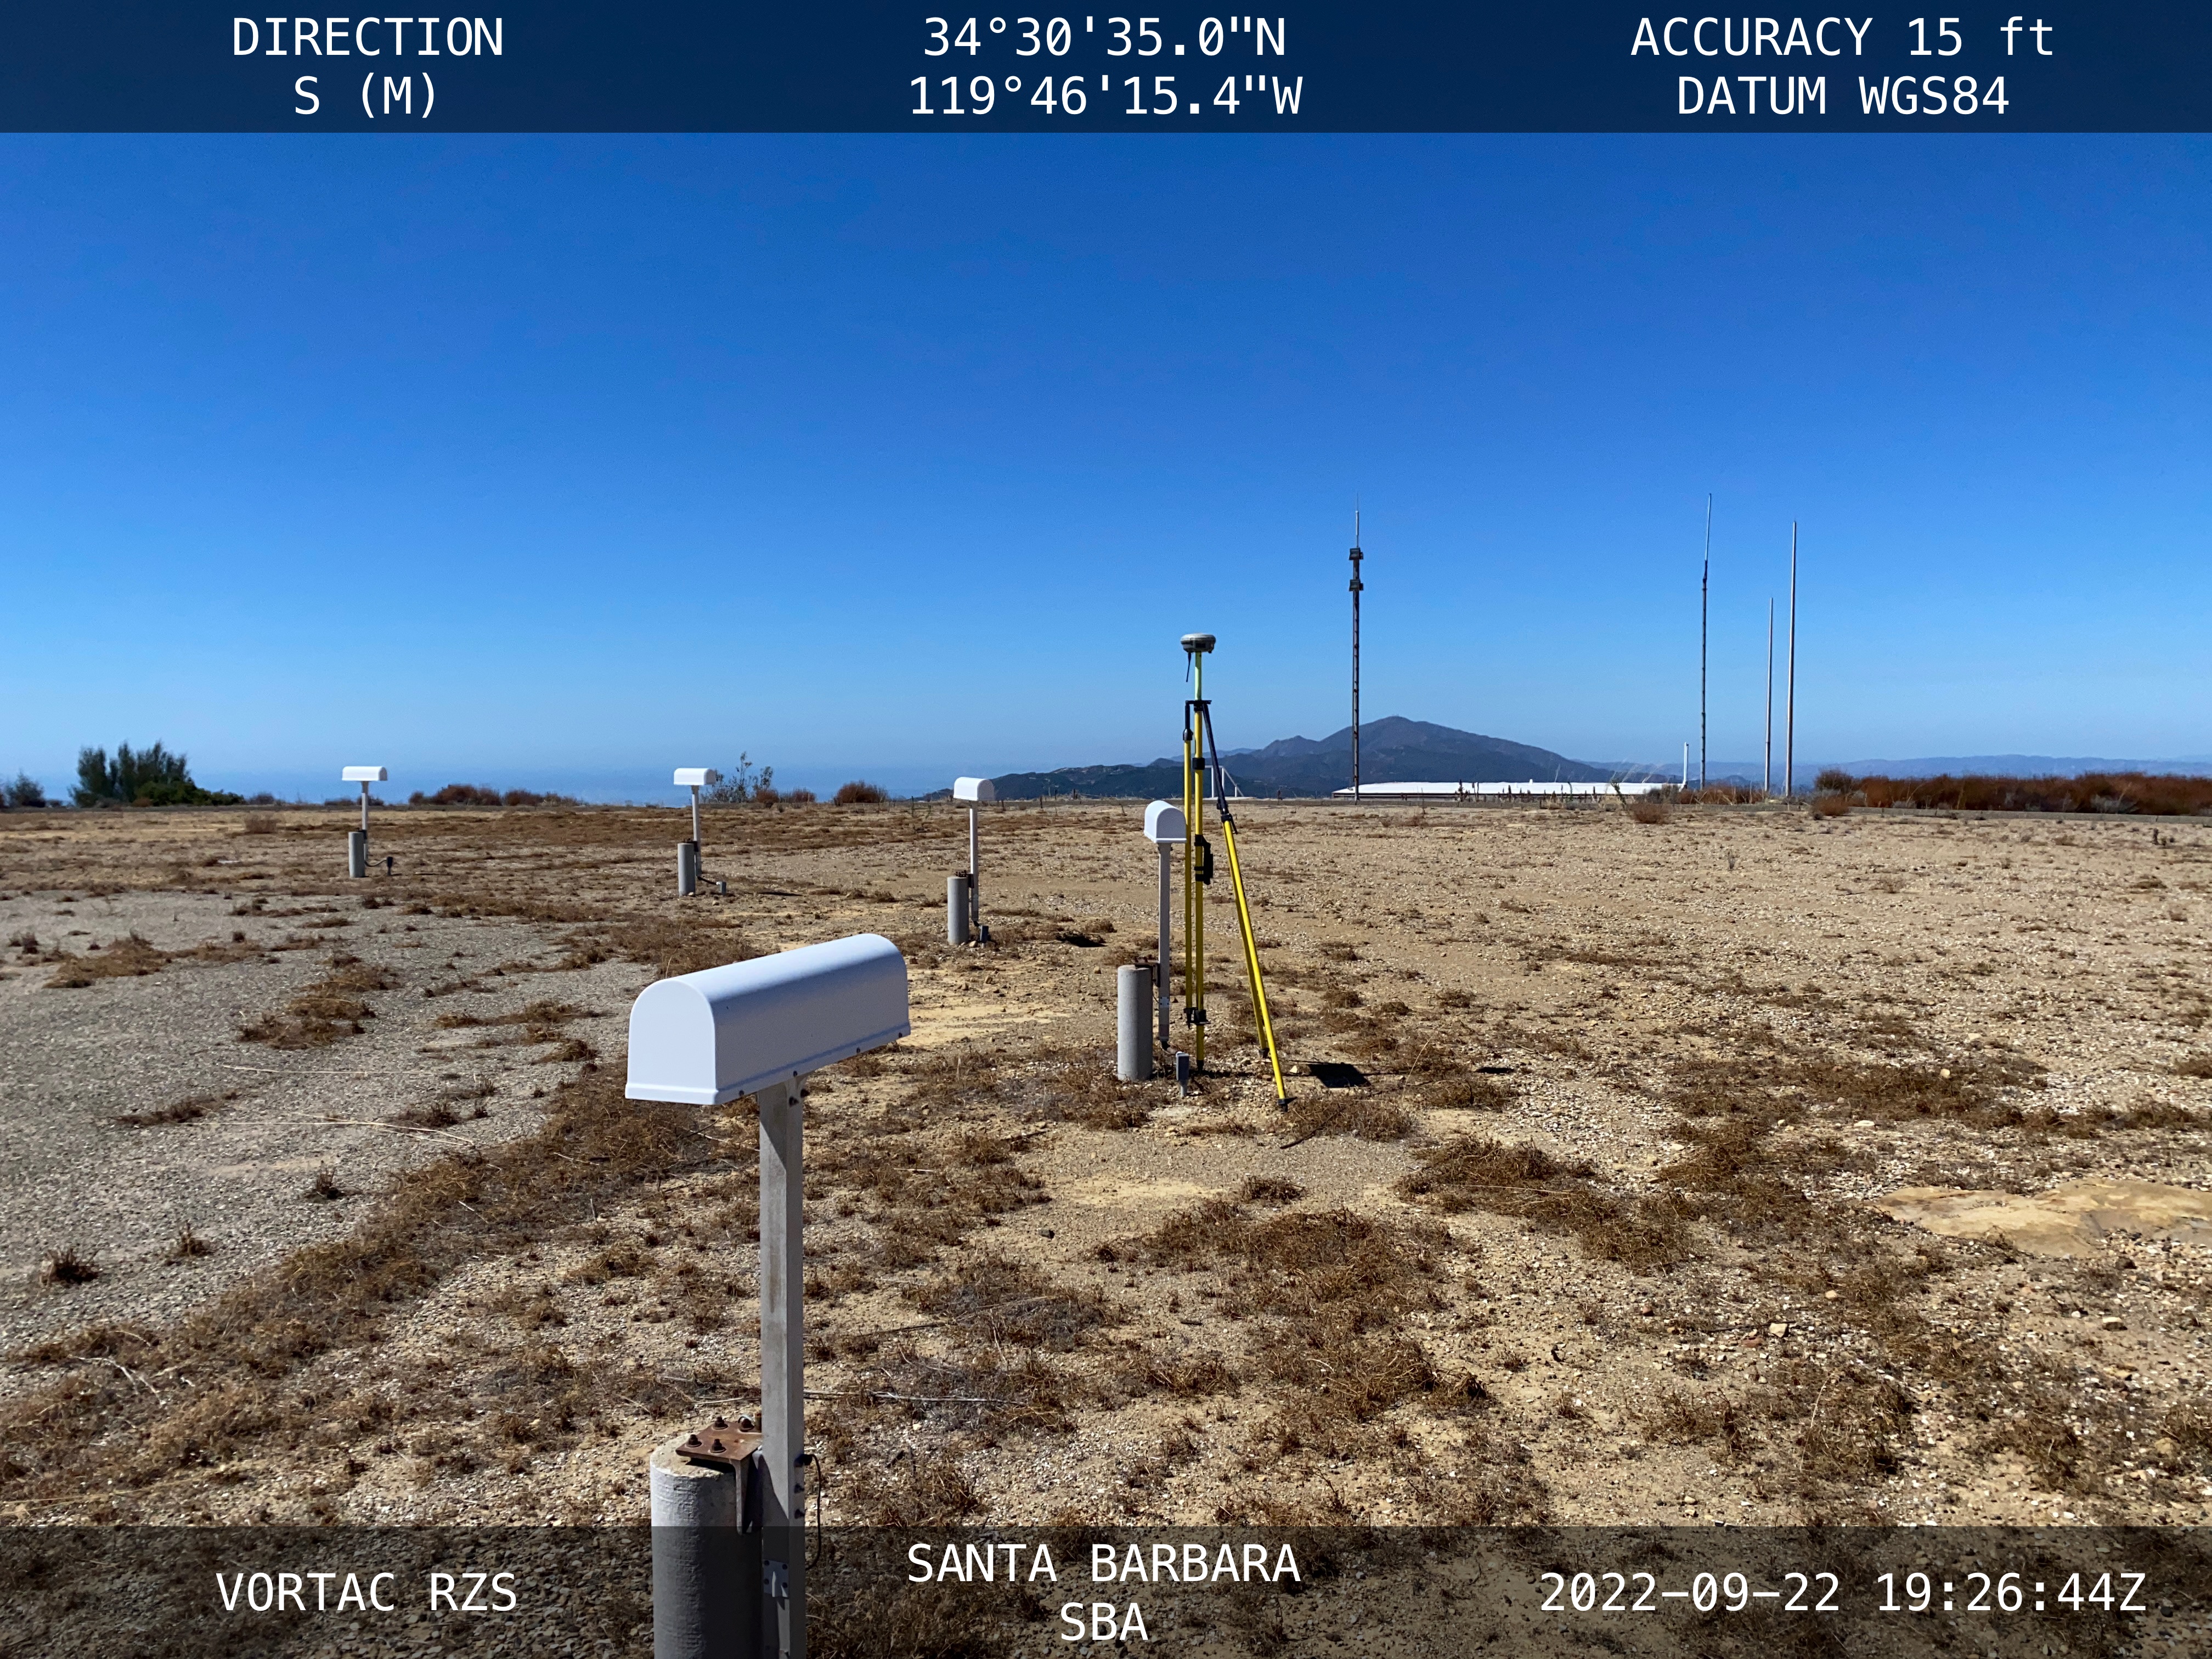
On the other hand, the FAA has strict requirements regarding metadata to document when, where, and how each control point is collected. “At the time of the survey, photographs are taken of the GPS units from different angles and cardinal directions,” Grigg said. “This is visual documentation for NGS that the surveyed point is at the location described. ”
Another challenge for surveyors working at airports is that they are required to pull back for incoming aircraft. “Obviously, you will have some logistical issues at busy airports,” said Grigg. Surveyors are required to have special lights and markings on any vehicles that enter the airport property to ensure ground and air visibility. Aircraft movement also impacts surveyors as they must move away from the runway safety area (RSA) for take-offs and landings. Busier airports are surveyed at night, when air traffic is reduced or runways are closed.
Image: NV5 Geospatial
A typical project for a small airport takes about nine months, while for bigger airports — such as Chicago O’Hare, Dallas-Fort Worth, or Hartsfield-Jackson Atlanta — they can take up to twice as long. “The large hubs update their master plan on a more reoccurring basis, such as every three to five years,” said Doug Fuller, NV5 Geospatial’s Airport Solutions Specialist. “As the airports get smaller, you start stretching out that timeframe.”
Airport survey requirements
[The following was written by NV5 Geospatial and only lightly edited by GPS World.]
Airports have surveys conducted for many different reasons. However, all survey types require the collection, classification and reporting of accurate data about the project. The methodology selected to gather the information is up to the professional surveyor’s judgment. Some features require observation through ground field methods, while others lend themselves to collection via remote sensing technologies.
All surveys start with a search for existing airport control, which are called Primary Airport Control Points (PACS) and Secondary Airport Control Points (SACS). These are points on the airport that have been adjusted by the National Geodetic Survey (NGS). This ensures that the survey is done on the National Spatial Reference System (NSRS).
A typical survey includes surveying the runway, the end points, any displaced thresholds, and a profile along the centerline of the runway. If the centerline marker is not in the correct location or if it is not there at all, the surveyor will make the necessary measurements to establish the proper location and set a new marker. Next the surveyor must locate all NAVAIDS and survey them at the proper location as described in FAA Advisory Circular 150/5300-18B.
After the NAVAIDS are located, the photo control survey will be done. This still requires the PACS and SACS to be the points of origin of the survey. The base requirement as described in FAA Advisory Circular 150/5300-16C is to survey ten photo control points and five check points. The check points are sent to NGS’s Online Positioning User Service (OPUS). This is used to check that the survey was done on the NSRS and that the compilation meets FAA standards.
The standards the surveyor must meet vary depending on the equipment type or photo control point. Examples of the accuracy requirements for the NAVAIDS are as follows:
Point
Horizontal
Vertical
Distance measuring equipment
+/- 1 ft
+/- 1 ft
Glideslope
+/- 1 ft
+/- 0.25 ft
Inner marker
+/- 10 ft
+/- 20 ft
Localizer
+/- 1 ft
+/- 0.25 ft
Runway end point
+/- 1 f ft
+/- 0.25 ft
Runway profile points
+/- 1 f ft
+/- 0.25 ft
Photo control
+/- 1 ft
+/- 1 ft
PACS and SACS
X
Y
Z
Ellip.
Inverse from PACS to SACS
surveyed relative to published
0.09 ft
0.09 ft
0.15 ft
0.13 ft
When surveying on airport property, the largest challenge is always accessing the runway safety area to locate the runway ends and profiles. At small airports Surveyors must work when the runway is not busy; at airports with FAA control towers when the runway is closed. Frequently this is done overnight. Other challenges include access to the FAA NAVAIDS. Some of them must be turned off to be surveyed and others require survey points on which it is not possible to set an instrument. When we are not able to occupy a point, we collect it by surveying multiple equidistant locations around the NAVAID and averaging them.
Image: NV5 Geospatial
NV5 Geospatial surveyors use a combination of real-time (R/T) and post-processing techniques. We also use OPUS with the PACS and SACS and the five check points. Once the PACS and SACS have been determined to be stable, the proper coordinates are applied to them and the R/T points are adjusted using Trimble Business Center (TBC). NV5 Geospatial uses Trimble TRM-R8s and we recently added TRM-R12i receivers to our equipment. We use ground control points to orient the photography and to calibrate the lidar.
In July 2020, my First Fix article discussed the Geodesy Crisis in the United States. In January 2022, Mike Bevis, collaborating with others, prepared a white paper titled “The Geodesy Crisis,” documenting the concern about the lack of trained geodesists in the United States. Since then, my November 2022 survey scene column highlighted that without investment in geodesy, the United States will not have the available skills and knowledge to develop new geodetic technologies and improve models to address challenges to society. In December 2022, Matteo Luccio discussed the urgent need for U.S. geodesists with Everett Hinkley, who works for the federal government, serves as a subject-matter expert on several high-level boards, and dubs himself a “concerned citizen geodesist.”
Well, things are starting to happen. NGS is soliciting grant proposals from eligible organizations to implement activities that modernize and improve the National Spatial Reference System (NSRS) and advance the science of geodesy in the United States. See the image below.
I realize that this is very short notice, but all Letters of Intent (LOIs) must be received no later than Wednesday, March 22, 2023. Full proposals do not have to be completed until April 24, 2023. The grant information and related material can be found here.
This is a great opportunity for institutions of higher education, state, local and Indian tribal governments to partner with industry and private consultants to advance the science of geodesy.
My February column explained why it is important to account for horizontal movement of marks everywhere, and not just in areas influenced by active crustal movement due to earthquakes such as Southern California.
It provided information about the NOAA CORS Network (NCN) rates of movement based on International Reference Frame of 2014 (ITRF2014) coordinates and horizontal velocity information. It highlighted reports from the National Geodetic Survey (NGS) that describe models that will facilitate users transferring coordinates between reference frames and dealing with intra-frame movement between marks based on surveys performed at different epochs.
NAPGD2022 orthometric heights will primarily be accessed through GNSS technology.
As I stated in my February column, this is not just a horizontal positioning issue. In this month’s column, I address estimates of vertical movement that will have to be accounted for in the new, modernized National Spatial Reference System (NSRS).
NAPGD2022 will provide gridded models for North America (that includes CONUS, Alaska, Hawaii, the Caribbean, Canada, Mexico, Central America and Greenland), American Samoa and Guam/Commonwealth of Northern Mariana Islands (CNMI). My previous columns have described the NAPGD2022 in detail. The revised NOS NGS 64 report mentioned that NAPGD2022 will be built upon ITRF2020. It states that NAPGD2022 will operate equally well in any of the four new terrestrial reference frames developed as part of the new, modernized NSRS in 2022.
As I stated in previous columns, orthometric heights in NAPGD2022 will be defined through GNSS ellipsoid heights and GEOID2022. This means NAPGD2022 orthometric heights will primarily be accessed through GNSS technology. GEOID2022 will be defined in a manner that best fits global mean sea level at the epoch of NAPGD2022.
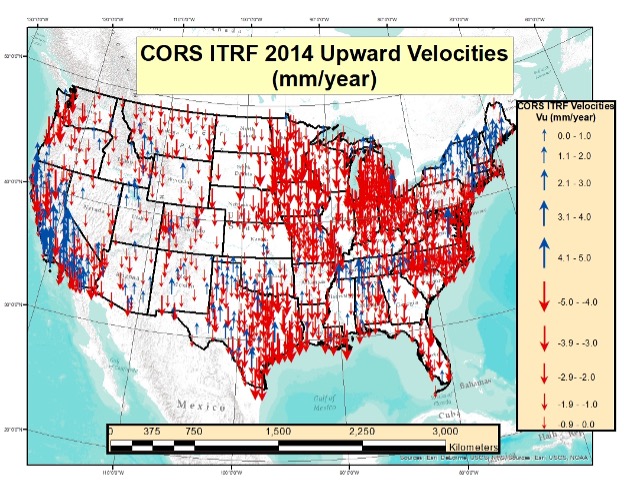
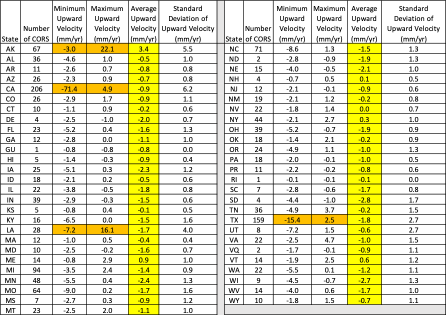
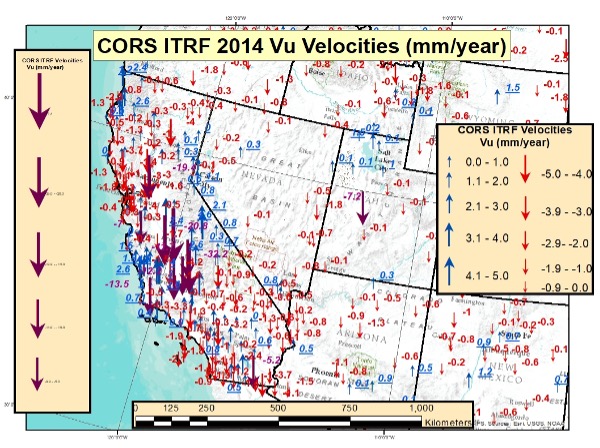
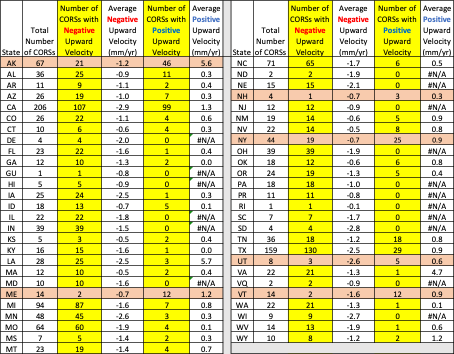
As in my previous column, to better visualize the potential size of the vertical movement, I used the CORS ITRF2014 coordinates and velocities from the NGS website to create plots depicting the upward velocity (Vu) values for CORS that are designated as operational and have computed velocities. [Note: I use the term upward because that is how it is reported on the NGS CORS website under the tab labeled “position and velocity.” The term upward velocity means movement in both directions — negative is downward and positive is upward.] The box below shows maximum, minimum, average and standard deviations of upward velocity values for each state and territory of the United States.
Table of ITRF 2014 Upward Velocities of US CORSs
The upward velocity values are not as systematic as the horizontal velocity values, and they are significantly smaller. I have highlighted the average value velocity column. As indicated in the table, the values vary from state to state, but they are all small relative to the horizontal movement values. (See my previous column for plots depicting the horizontal values.)
What is interesting is the range of values in some states. For example, Alaska and California have a very large range — understandable because of the active earthquakes and other movement that occur in these states. Also, Louisiana and Texas have a very large range due to local subsidence.
I decided to highlight the values for the conterminous United States (CONUS) in two separate plots. The box “Upward Velocities (Vu) Between +/–5 mm/year in CONUS” depicts upward velocities (Vu) between +/–5 mm/year in CONUS. The box “Upward Velocities Greater than Absolute Values of 5 mm/year in CONUS” depicts upward velocity values greater than +/–5 mm/year.
Upward Velocities (Vu) between +/- 5 mm/year in CONUS
Image: Dave Zilkoski
It’s obvious that most of the vertical movement values are between +/–5 mm/year in CONUS. There are some large values in California, Louisiana and Texas. This is highlighted in both plots.
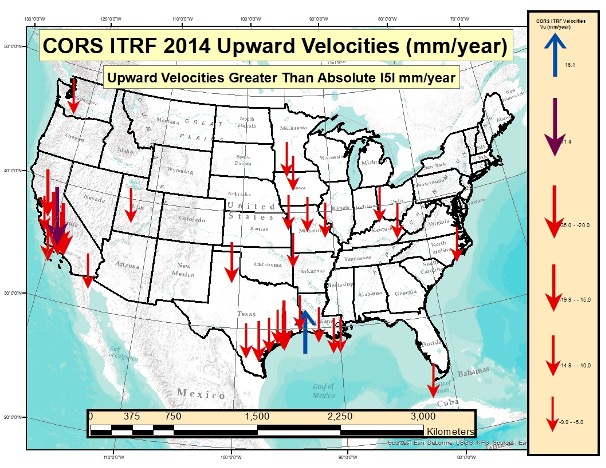
Upward Velocities (Vu) Greater than Absolute Values of 5 mm/year in CONUS
(Image: Dave Zilkoski)
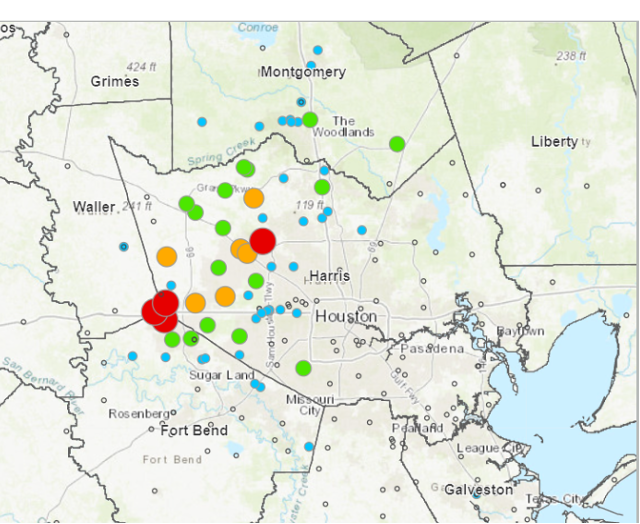
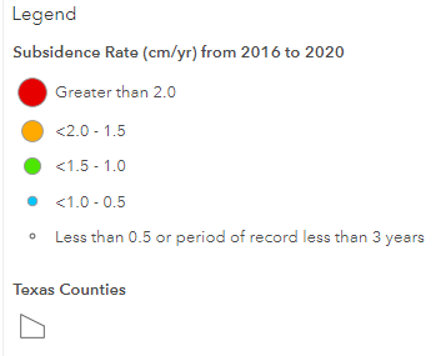
As indicated in the plots, some of the values exceed 10 mm/year. In five years, the heights of marks in these regions could potentially change by 5 cm. An example of the potential subsidence in the Houston-Galveston, Texas, region is depicted in the box below. As indicated in the plot, some marks are subsiding greater than 2 cm/year. That means in five years the marks in that region could have subsided more than 10 centimeters.
Estimate of Subsidence in the Houston-Galveston, Texas, Region
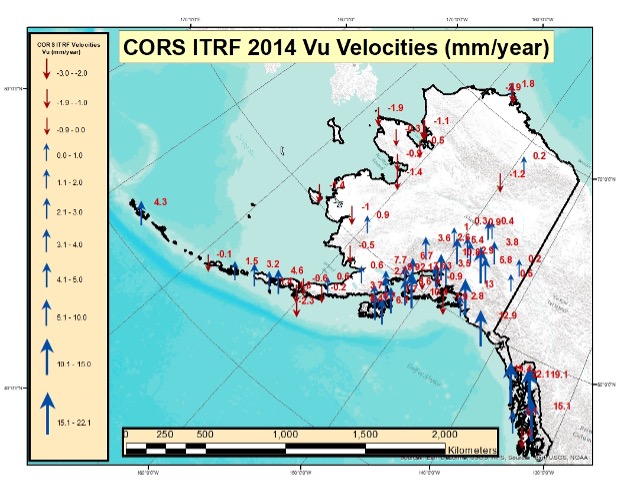
The box below depicts the values in Alaska. Most of these values indicate that the marks are uplifting. Some of these values exceed 10 mm/year. Once again, height coordinates in some regions will potentially change 5 cm in five years. I generated a separate plot for the southeastern region of Alaska. (See the box titled “Upward Velocities (Vu) in Southeastern Alaska.”)
Upward Velocities (Vu) in Alaska [All Values]
Image: Dave Zilkoski
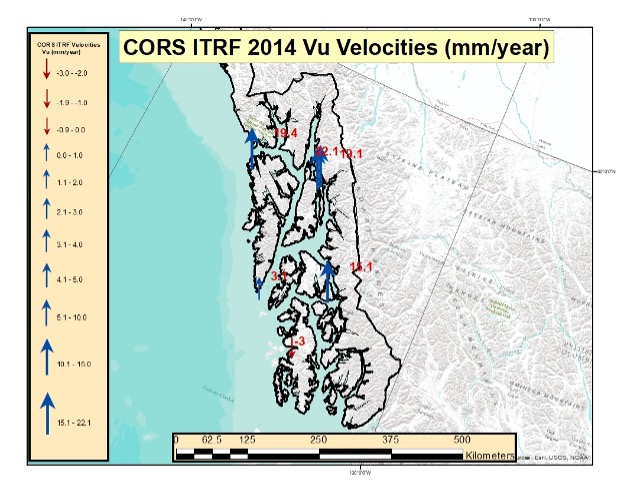
Upward Velocities (Vu) in Southeastern Alaska [All Values]
Image: Dave Zilkoski
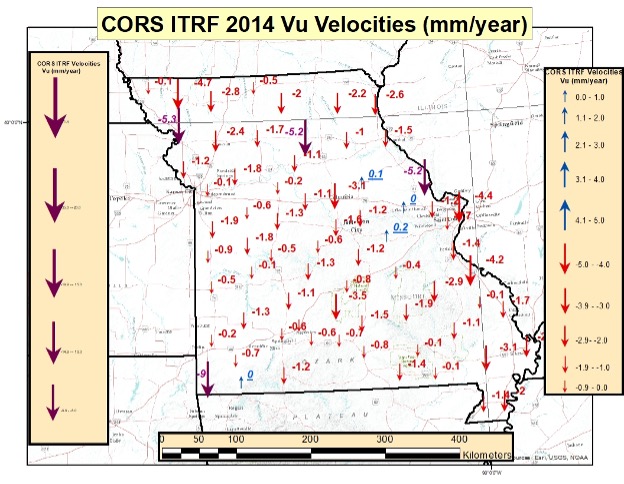
As I did in my previous columns, I prepared several plots that depict the upward velocities in various regions of the United States. See the boxes below for North Carolina, Missouri Southwest U.S. The plots indicate that the magnitude of the vertical movement varies from state to state, as well as within the states.
CORS ITRF 2014 Upward Velocities (Vu) in Missouri [All Values]
Image: Dave Zilkoski
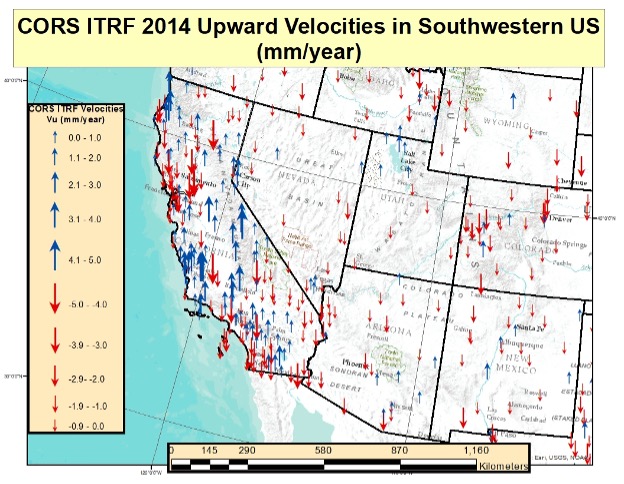
CORS ITRF 2014 Upward Velocities (Vu) in Southwest U.S. [All Values]
Image: Dave Zilkoski
CORS ITRF 2014 Upward Velocities (Vu) in Southwest U.S. [Values Between +/- 5 mm/year]
Image: Dave Zilkoski
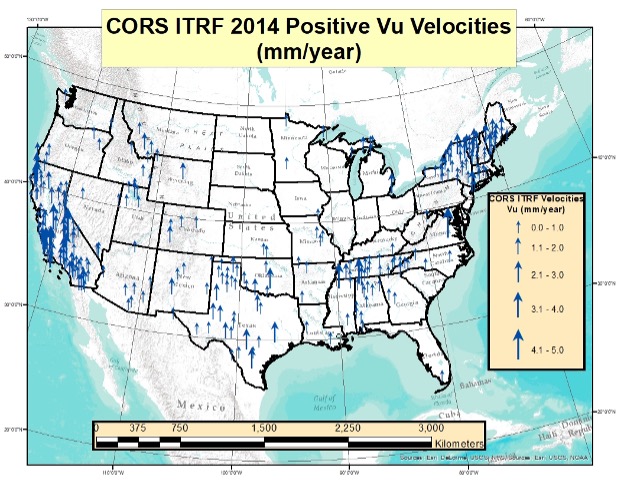
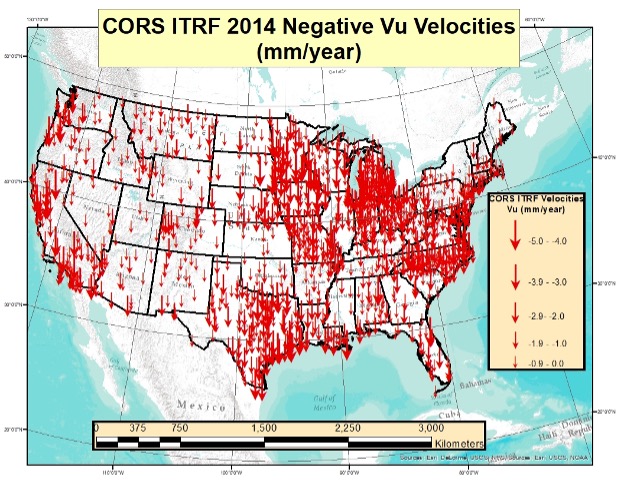
I also generated plots that separately depict the positive and negative upward velocities for the conterminous United States. There are more negative upward velocity values than positive values.
CORS ITRF 14 Positive Upward Velocities (Vu) in Conterminous U.S. (Values between 0 and 5 mm/year)
Image: Dave Zilkoski
CORS ITRF 2014 Negative Upward Velocities (Vu) in Conterminous U.S. (Values between -5 and 0 mm/year)
Image: Dave Zilkoski
The table below provides the number of CORS with negative upward velocity values and the number of CORS with positive values for every state and territory of the United States. I have highlighted the states and territories that have more positive values than negative values. As you can see, only six states have more positive upward velocities than negative values. Four of the six states are in Northeastern United States.
Table of ITRF 2014 Positive and Negative Upward Velocities for United States
So far, this column has only addressed the vertical movement at the NCN CORS. The values at the sites indicate the potential movement of marks in the area of the CORS. The rates are based on GNSS data and have an estimate of error associated with them.
I’m not sure how NGS will address the vertical movement effects in the new, modernized NSRS. That said, NGS will be monitoring the CORS and looking for trends to help describe the movement at the CORS. These trends will be an indication of what may be happening in the area.
In addition to the movement of individual marks, there are geophysical reasons for changes in the geoid. As I stated in previous columns, orthometric heights in NAPGD2022 will be defined through ellipsoid heights and GEOID2022. Therefore, changes in the geoid model will be very important to users estimating orthometric heights using GNSS.
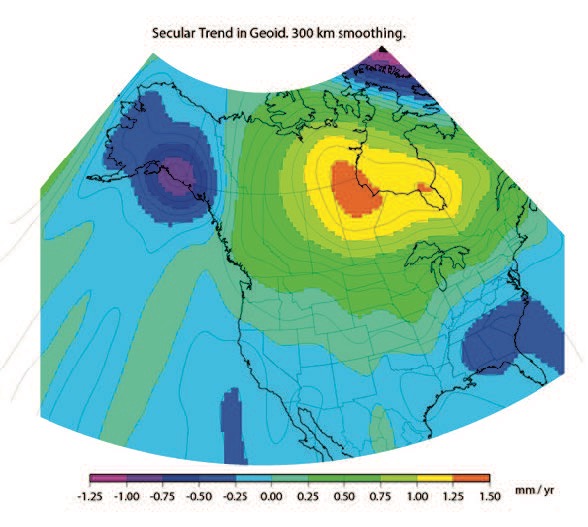
As stated in the NGS 64 report, NGS has set a goal of maintaining geoid accuracy at 1 centimeter (1 standard deviation) in both absolute and differential geoid undulations. Figure 13 from the NGS 62 Report depicts an estimate of the secular change in the geoid. As indicated in the plot, the changes are very small, ranging from –1.25 mm/year to 1.5 mm/year.
What I find interesting is the small negative change in the southeastern United States. There are other drivers for geoid changes. Future columns will address some of these changes and what it means to users.
Figure 13 from NOS NGS 62 Report
Image from NGS website: Blueprint 2 Revised NOAA_TR_NOS_NGS_0064.pdf
Figure 13 – Secular Geoid Change
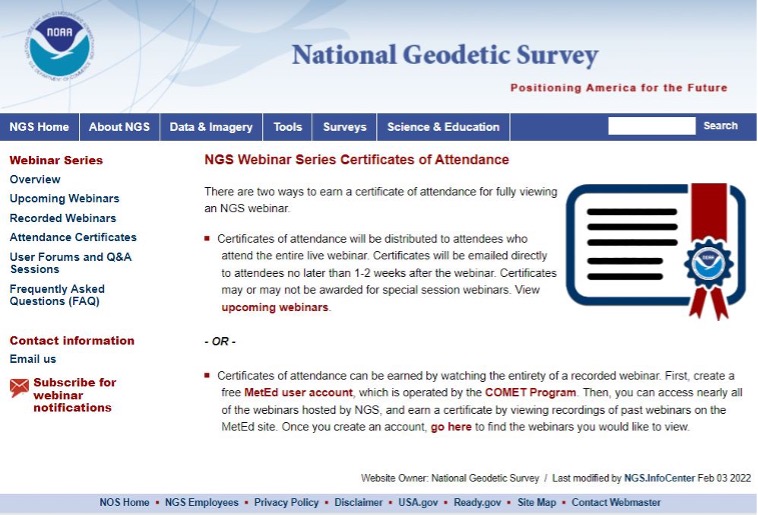
Lastly, I’d like to highlight a new service from NGS: “NGS Webinar Series Certificates of Attendance.” See the box titled “Ways to Earn a Certificate of Attendance.” Basically, users can earn certificates by viewing a webinar after it has been posted by NGS. This is very useful for users who could not attend the original webinar. I encourage all users to check out the site to find out more information about the new service.
Ways to Earn a Certificate of Attendance
Image from NGS website: https://geodesy.noaa.gov/web/science_edu/webinar_series/certificates.shtml
The National Geodetic Survey (NGS) has revised an important technical document on the modernized National Spatial Reference System (NSRS). Zilkoski explores a use case on flood mapping, discussing an Elevation Certificate example, Flood Insurance Rate Map and Flood Insurance Study. NGS has scheduled a webinar for April 8 to discuss the four use case examples.
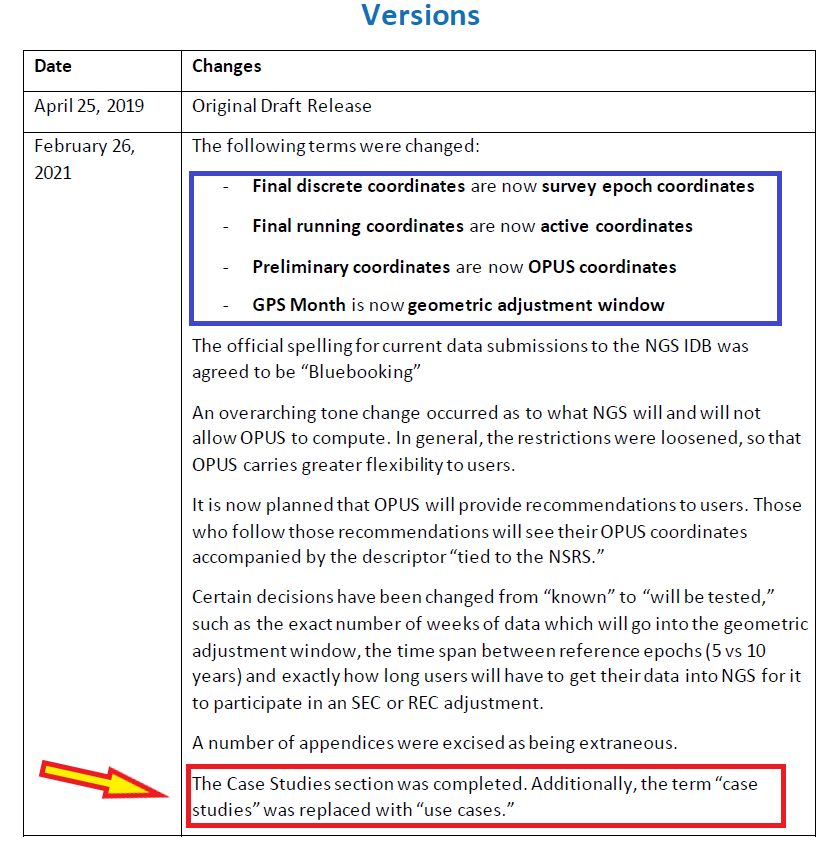
In February 2021, the National Geodetic Survey (NGS) revised NOAA Technical Report NOS NGS 67 Blueprint for the Modernized NSRS, Part 3: Working in the Modernized NSRS. Users can download the publication. See the box titled “NOAA Technical Report NOS NGS 67.”
This column will highlight one of the four use cases: “Use Case 1: Flood Mapping.” The case study discusses the Elevation Certificate (CE) example, Flood Insurance Rate Map (FIRM), and Flood Insurance Study (FIS).
The following is the scenario that NGS considered in this use case:
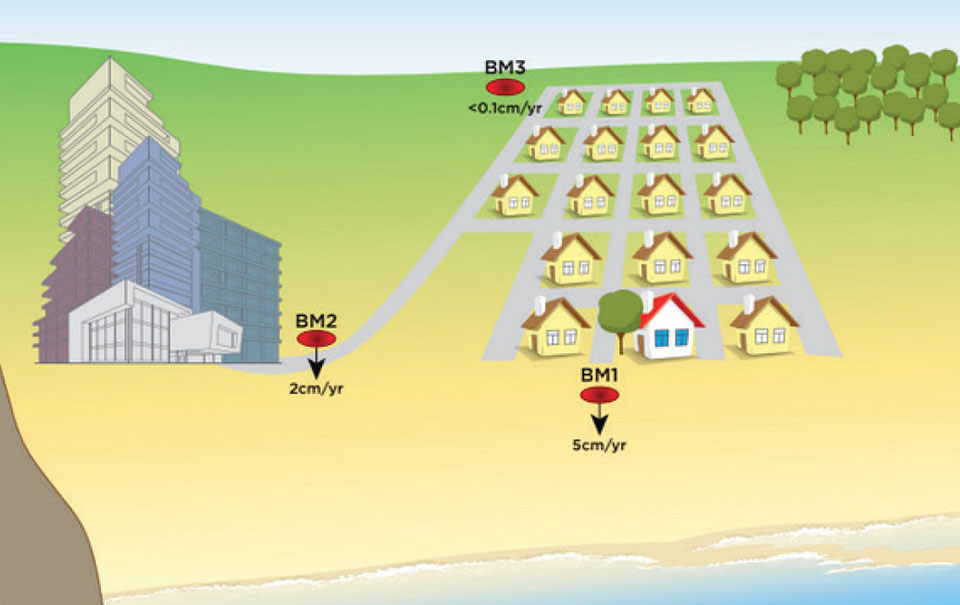
“This use case’s examples are set in an imaginary flood-prone coastal community experiencing non-uniform ground subsidence at the watershed scale (see Figure 10). Although many areas are not subject to this level of vertical motion, the full benefits of NSRS modernization are most apparent in this context. We illustrate differences in the use of the NSRS of today and the modernized NSRS with two common NFIP workflows. First, we consider steps anticipated in the certification of NAPGD2022 elevations for a NFIP Elevation Certificate. Second, we step into the shoes of a FEMA Mapping Partner to examine the ways future NSRS tools support more accurate mapping in Flood Insurance Rate Map (FIRM) and Flood Information Study (FIS) updates.”
I think this is a good scenario to use to demonstrate the full benefits of the NSRS modernization in areas of subsidence, but I believe there are important issues that will need to be addressed before the implementation of NAPGD2022 in flood mapping projects. I will highlight some of these issues later in the newsletter. First, let’s look at NGS example.
As depicted in figure 10 in NOS NGS 67 technical document, the area has three difference subsidence rates (<0.1 cm/yr., 2 cm/yr., and 5 cm/yr.). See the box titled “Diagram of fictional case study location for Use Case 1.” As NGS stated in the document, “Although many areas are not subject to this level of vertical motion, the full benefits of NSRS modernization are most apparent in this context.”
This may not be the typical situation of a flood mapping project but it should be noted that this type of high individual rates and large relative rate differences has occurred in the Houston-Galveston, Texas, region (see the following publications):
NGS’s example illustrates differences in the use of the NSRS today and the future NSRS with two common National Flood Insurance Program (NFIP) workflows. The example addresses surveyors performing a FEMA Elevation Certification using NAPGD2022 elevations, and the ways future NSRS tools support more accurate mapping in Flood Insurance Rate Map (FIRM) and Flood Information Study (FIS) updates.
It should be noted that according to the September 27, 2017, Office of Inspector General Department of Homeland Security OIG-17-110 report, FEMA’s goal is to review flood maps every five years.
“According to the National Flood Insurance Reform Act of 1994, FEMA must assess the need to revise and update all floodplain areas and flood risk zones identified once during each 5-year period. Thus, valid miles will expire every five years if not assessed. Failure to assess an NVUE compliant mile within the 5-year window will result in the mile being re-categorized as “Unknown” in the Needs Database. Unknown miles have not been subjected to the validation process to determine whether they reflect the current flood risk or are in need of restudy. In 2009, FEMA set a goal to attain 80 percent NVUE by the end of fiscal year 2014.” — Excerpt from Department of Homeland Security OIG-17-110 report
The modernized NSRS will help facilitate meeting this goal. This is described in NGS’s use case example:
NFIP products will primarily utilize the official NSRS reference epochs
“As the NFIP is structured today, NFIP products will primarily utilize the official NSRS reference epochs. Additionally, some NFIP products such as the EC form itself, as well as guidance, and technical references for FIRM and FIS preparation would benefit from updates that reflect changes to the NSRS. While the time-dependency and incorporation of a gravimetric geoid model will manifest as improved risk assessment reliability in inundation map products, we notably anticipate that NSRS modernization will have a limited impact on the basic structure of most recommended workflows associated with the NFIP of today. The most significant development is therefore the opportunity for FEMA’s National Flood Mapping Program (NFMP) to increasingly leverage the new capabilities of the NSRS to ensure that current, accurate ground elevation data is used, and to better incorporate relevant flood control structure and future conditions mapping data to support decision-making beyond the NFIP. Details of how the modernized NSRS can help FEMA achieve broader NFMP objectives and opportunities for data-driven case studies to explore this are described at the end of the use case.”
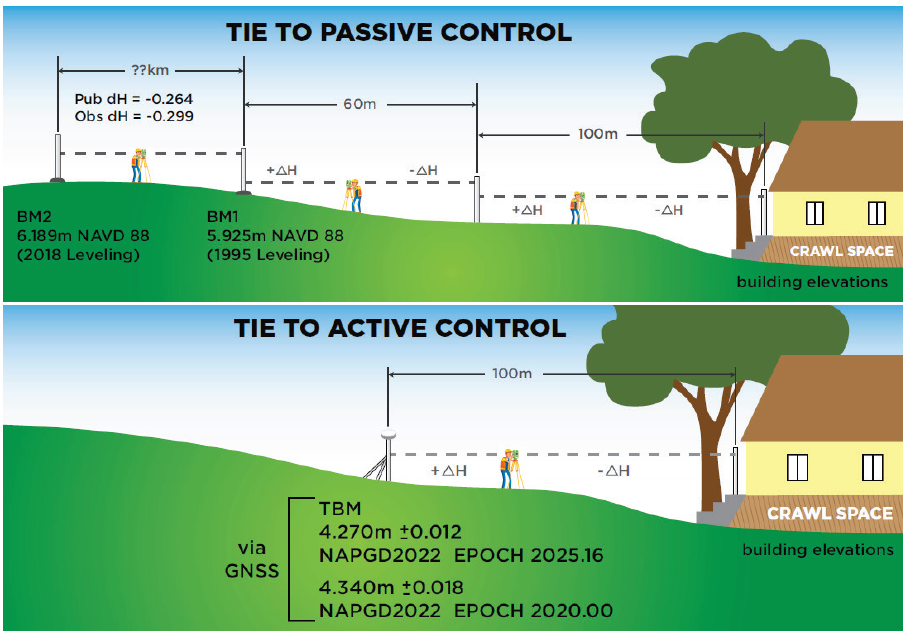
So, what does this really mean? The document uses two diagrams to explain how the new NSRS would be used to estimate a height for a FEMA Elevation Certificate (see box titled “Figure 11 from Use Case 1”). The top cartoon labeled “Tie to Passive Control” describes the process being performed today. That is, a surveyor locates the two closest marks that have published orthometric heights, follows the appropriate surveying procedures to ensure that the marks have not moved since the last time they were leveled to, and then performs the appropriate procedures to obtain the height for the Elevation Certificate. Depending on the location of the published orthometric heights in the area of the structure, this process could be very expensive. The lower cartoon labeled “Tie to Active Control” describes the process that will be used in the modernized NSRS using NADGP2022 heights. The user would occupy a temporary mark near the structure with GNSS to obtain a NAPGD2022 orthometric height computed using the appropriate ellipsoid height and geoid height value, and then perform the appropriate leveling procedures to obtain the height for the Elevation Certificate. This process will provide the most up-to-date height in the area.
Figure 11 from Use Case 1. Cartoon of Elevation Certificate field surveys based on establishing a tie to the NSRS via passive control leveling (top panel) and via active control with GNSS (lower panel). (Image: NGS)
There is an issue that should be noted here: the temporary mark determined using active control may provide the most up-to-date height at a particular location but that height may not be consistent with the heights used to establish the Base Flood Elevation (BFE). At first, someone would say, that’s good because it’s indicating that the flood hydraulics have changed on the floodplain map. However, without performing a detailed height analysis in the region, the user won’t really know whether the BFE value should be updated based on the current changes in topography in the floodplain region. In other words, if the entire region has subsidence at the same rate then the relative height difference hasn’t changed, and the new starting height may not be consistent with the published BFE on the FEMA Floodplain Map. In most floodplain mapping regions, the changes in heights are probably less than the accuracy of the maps but using the height of a mark that is not consistent with the BFE could place a homeowner’s house incorrectly in a flood zone. A good surveying practice would include occupying several marks with GNSS (or leveling between marks) that were involved in the creation of the flood insurance study and the generation of the floodplain map to ensure that the height used on the Elevation Certificate is consistent with the BFE. This is a good procedure to use for the current NSRS as well as the modernized NSRS. However, this is not economically practical using the current NSRS but could be in the new NSRS which is a major benefit of the modernized NSRS.
So, let’s look at the Houston-Galveston region using the latest information available.
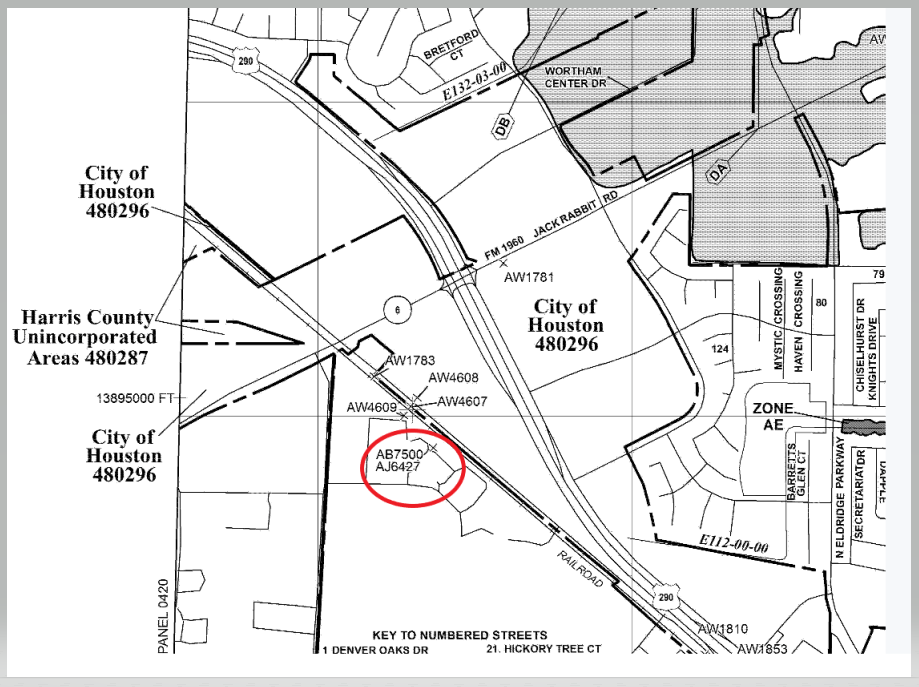
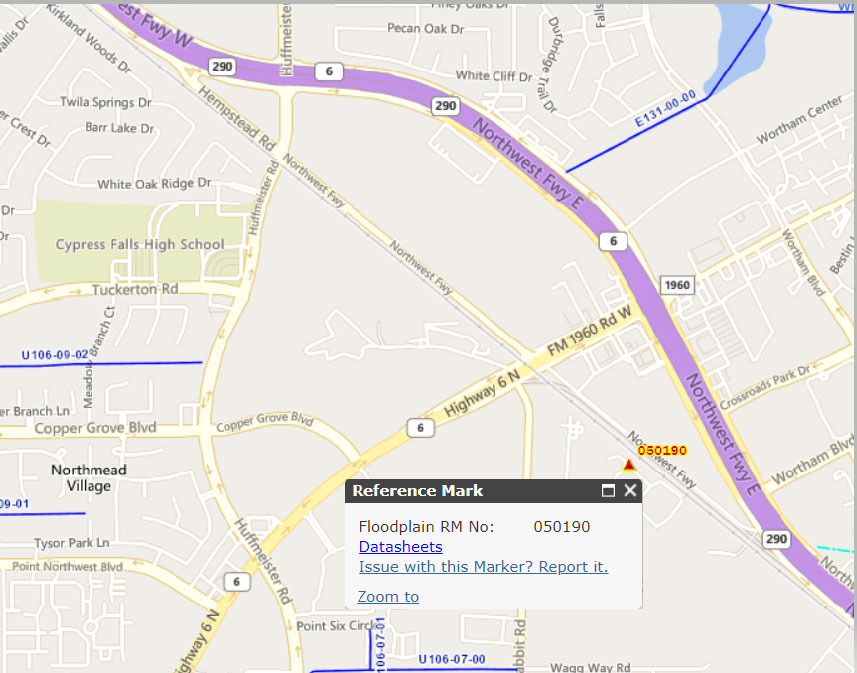
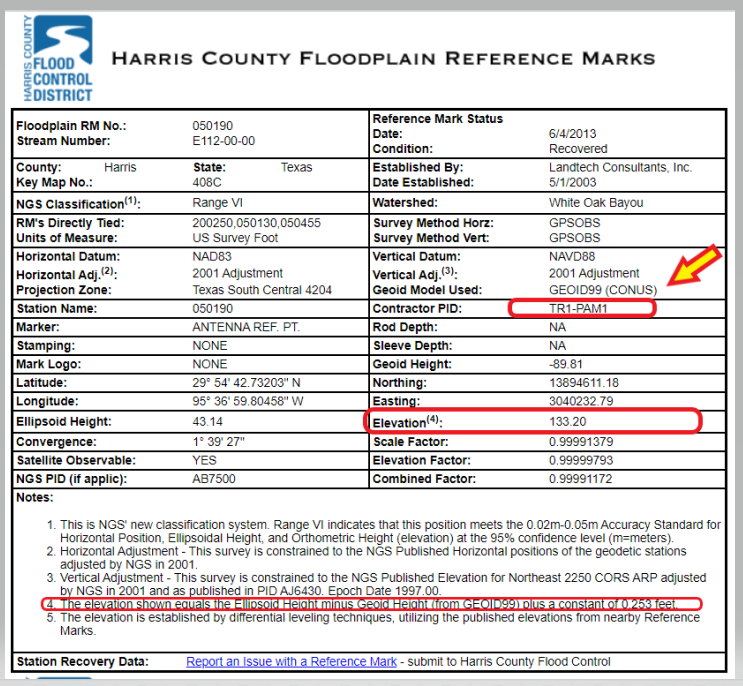
The box titled “Snapshot of Vertical Control from Harris County Floodplain Reference Marks Website” depicts the location of one of the reference marks, denoted as 050190.
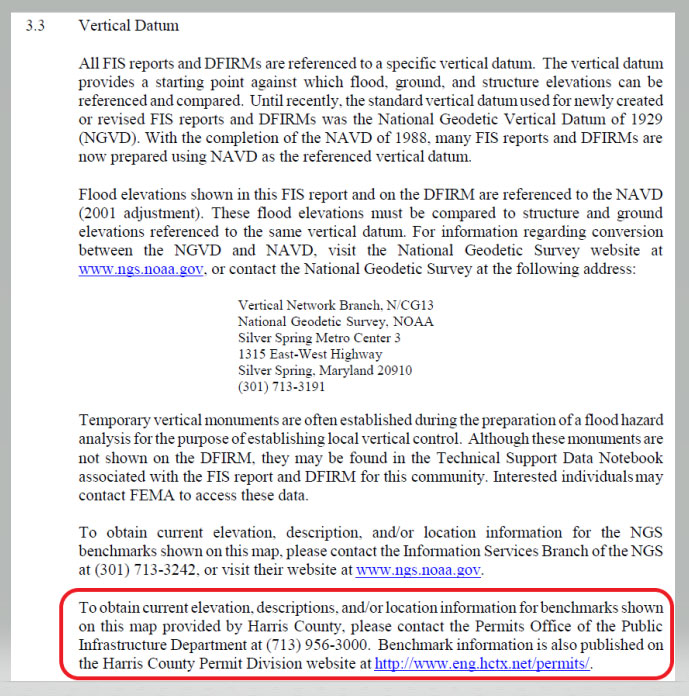
Clicking on the datasheets link, provides the information about the floodplain reference mark in the Harris County Flood Control District’s system (see the box titled “Harris County Floodplain Reference Mark Datasheet”).
It should be noted that the GNSS-derived orthometric heights were based on GEOID99 and the official hybrid geoid model published by NGS today is GEOID18. A GNSS-derived orthometric height computed using NGS’ webtool OPUS will use GEOID18 not GEOID99. The difference between GEOID99 and GEOID18 at this location is approximately 0.45 feet (0.138 meters). Users must ensure that they are using heights that are consistent with the BFE on the FIRM. The new NAPGD2022 will help to reduce issues associated with effects due to changes in geoid models.
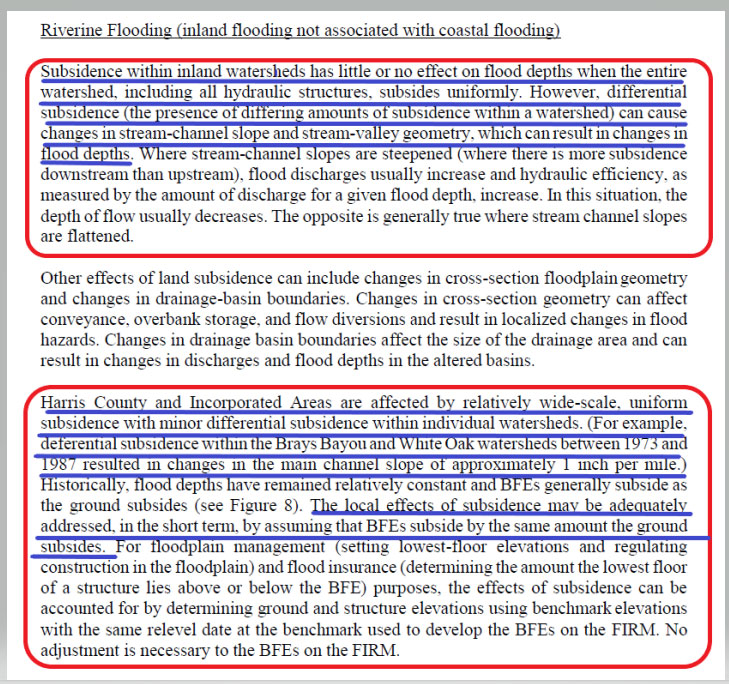
Page 113 from the November 15, 2019 Flood Insurance Study 48201CV001G addresses the issues associated with riverine flood in the region. (See the box titled “Page 113 from November 15, 2019 Flood Insurance Study 48201CV001G.”) The highlighted sections basically state that subsidence within inland watersheds has little or no effect on flood depths when the entire watershed subsides at the same rate. However, it also states that differential subsidence can cause changes in flood depths. The report goes on to say that the “Harris County and Incorporated Areas are affected by wide-scale, uniform subsidence with minor differential subsidence within individual watersheds.” It also states that “The local effects of subsidence may be adequately addressed, in the short term, by assuming that BFEs subside by the same amount the ground subsides.” The Houston-Galveston, Texas, region is a very complicated area due to the differential subsidence and numerous individual watersheds.
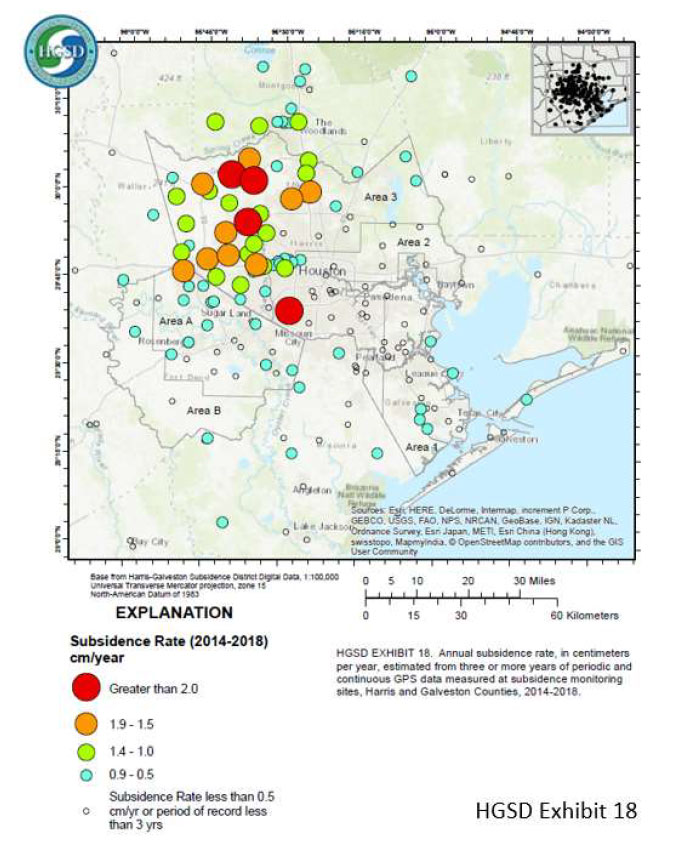
That said, let’s look some of the latest subsidence data in the region. The Harris-Galveston Subsidence District’s 2018 Annual Groundwater Report By Robert Thompson, William M. Chrismer, and Christina Petersen, PhD, P.E. provide some of the latest estimates of subsidence in the region. The box titled “HGSD Exhibit 18” depicts the locations of the GNSS sites used in the study. The plot provides the average compaction in centimeters over the past five years. The values range from 0.0 cm/year to greater than 2.5 cm/year.
HGSD Exhibit 18. This map shows the locations of the GPS sites throughout the area. The colored dots represent the average compaction over the past five years for each site, in centimeters. They range from 0.0 cm/year to greater than 2.5 cm/year. (Image: Harris-Galveston Subsidence District)
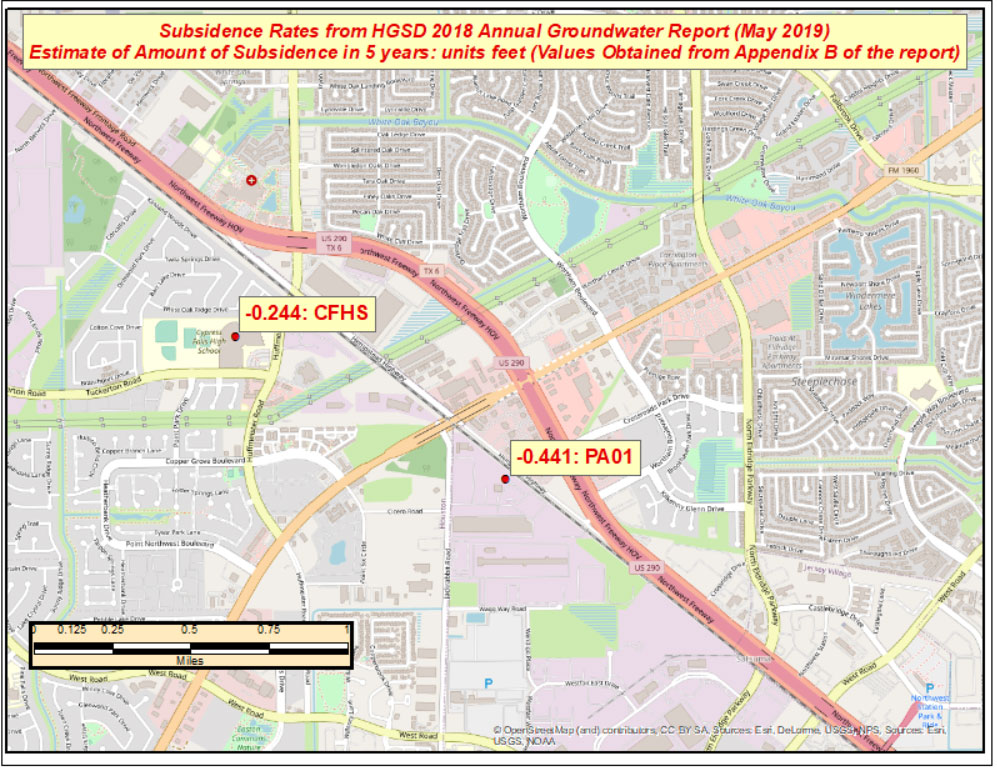
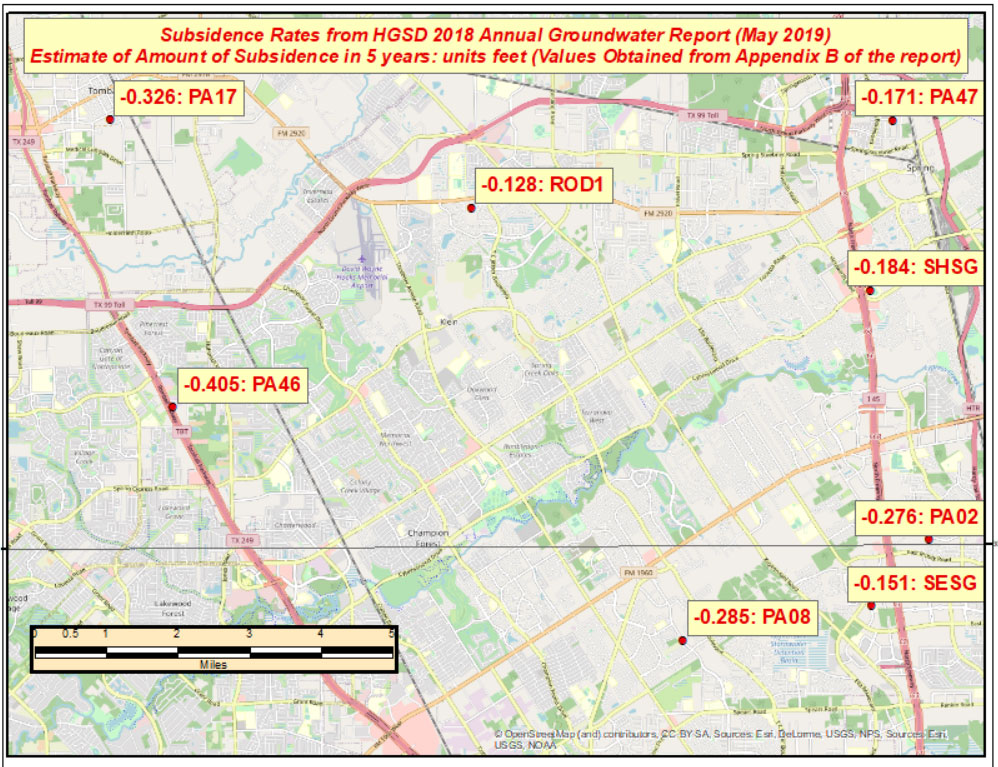
I used the information from Appendix B provided in the report to generate a few plots that show the estimate of subsidence in feet over 5 years. I’ve highlighted some marks that have large relative height changes. (Note: The units of the previous figure are centimeters; the units of the next several plots are feet.)
The relative height change between the two marks PA01 and CFHS, which are about 1.5 kilometers (approximately 1 mile) apart, is 0.197 feet in only 5 years. (See the box titled “Estimate of Amount of Subsidence in 5 Years at Pam 1– Units Feet.”)
The estimated relative height change between mark PA46 and ROD1, which are about 8 kilometers (approximately 5 miles) apart, is 0.277 feet in five years. (See the box titled “Estimate of Amount of Subsidence in 5 Years at Pam 46 – Units: Feet.”)
The effect of these large relative differences may not have any effect on the BFE on a particular watershed. These subsidence estimates are at a specific mark so they only provide information at a particular location. The new NAPGD2022 along with NGS’s webtools will enable users to economically obtain current, accurate heights in the entire region. Leveraging the capabilities of the new NSRS will help facilitate the implementation of FEMA’s goal of assessing the need to revise and update all floodplain areas and flood risk zones identified once during each five-year period.
This column highlighted the potential effects of subsidence on published heights in the Houston, Texas, region, which implies that most of the published heights based on older surveys in the region are not current or accurate.
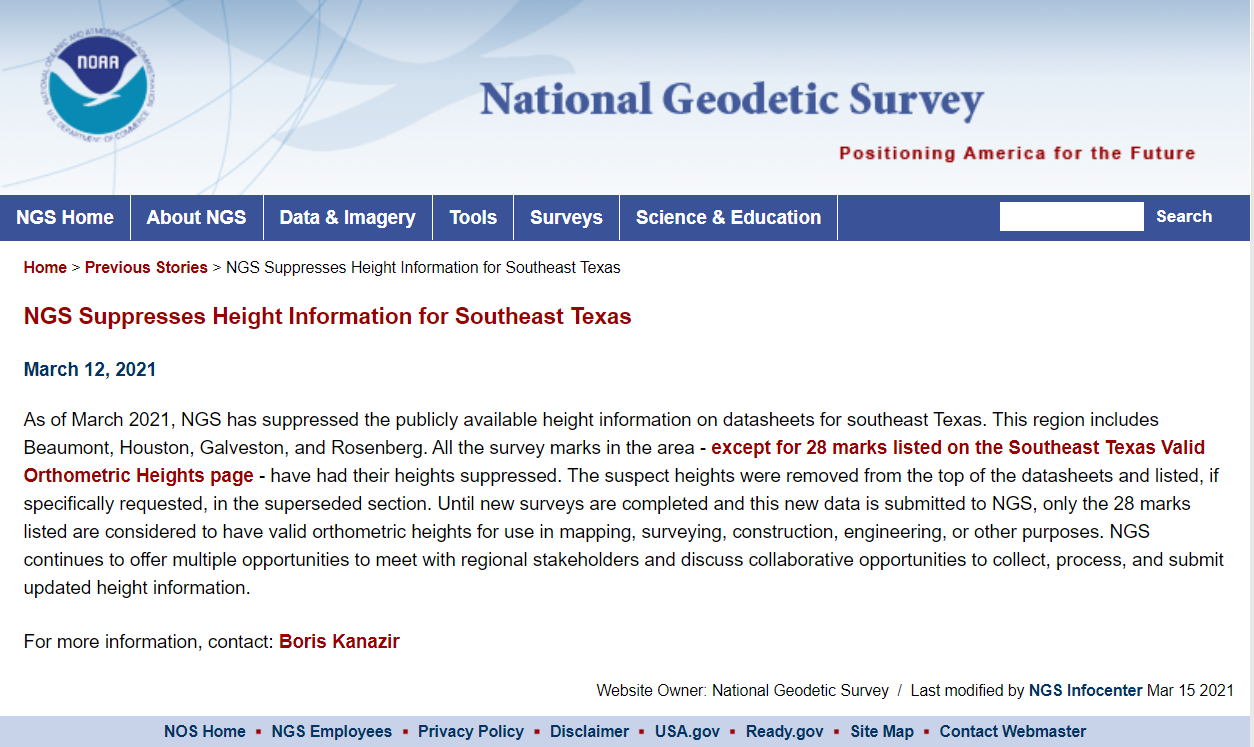
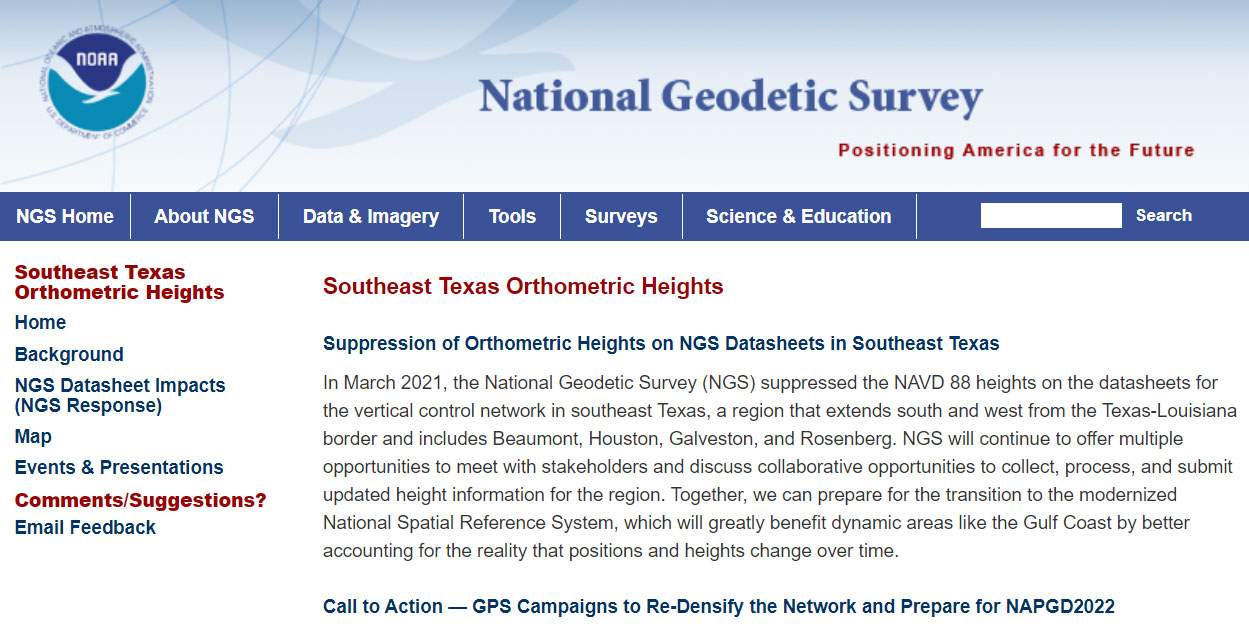
According to the announcement, only 28 marks will have publicly available orthometric heights on NGS datasheets in Southeast Texas. This NOAA website provides more information. See the box titled “NGS Southeast Texas Orthometric Heights.”
I would encourage everyone to check out the website to obtain a better understanding of what this suppression of published heights means to their operations. Future newsletters will address the suppression of the orthometric heights in Southeast Texas, and how users can help densify the network and prepare for the new, modernized NAPGD2022. Again, a benefit of the new modernized NSRS will facilitate the establishment of consistent, accurate NAPGD2022 GNSS-derived orthometric heights.
Lastly, NGS is convening the 2021 Geospatial Summit on May 4 and 5. The 2021 Geospatial Summit will provide updated information about the planned modernization of the National Spatial Reference System (NSRS). Register here.
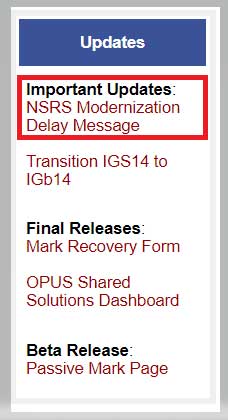
The National Geodetic Survey (NGS) recently announced two new items related to the modernized National Spatial Reference System (NSRS). First, it announced that there will be a delayed release of the modernized National Spatial Reference System (NSRS). See the box titled “Updates notices from NGS Homepage” for the link to the notice.
The box titled “Delayed Release of the Modernized NSRS” provides a summary of the notice. The announcement stated they are performing a thorough review of all tasks and will provide regular updates on their progress. What this means is that the modernized NSRS will not be completed by 2022. Even if it’s delayed a couple of years, it’s never too early to obtain an understanding of the new, modernized NSRS, and start preparing for the transition to the new NSRS.
NOAA’s National Geodetic Survey (NGS) is announcing a delay in the release of the modernized National Spatial Reference System (NSRS).
In 2007, NGS began planning for the modernized NSRS, acquiring its first airborne gravimeter, creating and initiating the Gravity for the Redefinition of the American Vertical Datum (GRAV-D) project and by 2008 had codified its modernization plans into a Ten Year Plan. At that time, the target completion date was 2018. By 2013, that date seemed unlikely, due to both the broadening of the GRAV-D coverage area and the experience of five years of operational planning and execution.
In 2013, NGS revised its 2008 Plan, and targeted 2022 as the date of the release of the modernized NSRS. This date was reinforced with a 2018 Strategic Plan revision. By 2017, confidence in hitting the 2022 target was high enough to reach final agreement with Canada and Mexico on a naming convention for certain components, to include “2022” in their names.
Since 2017, operational, workforce, and other issues have arisen and compounded, causing NGS to recently re-evaluate whether a successful roll-out by 2022 is possible. The most significant impacts have been in workforce hiring and retention, and in meeting GRAV-D data collection milestones, which underpin the NSRS modernization efforts.
NGS is currently conducting a comprehensive analysis of ongoing projects, programs and resources required to complete NSRS modernization and will continue to provide regular updates on our progress. To get the latest news on NSRS modernization and track our progress, subscribe to NGS News or visit our “New Datums” web pages.
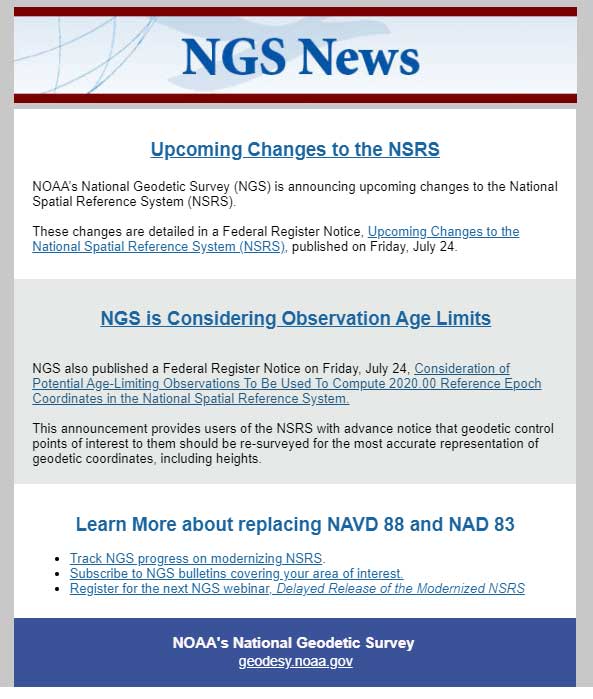
The second important announcement by NGS was that two Federal Register Notices related to the modernized NSRS were published on July 24. See the box titled “NGS News.”
Image: National Geodetic Survey
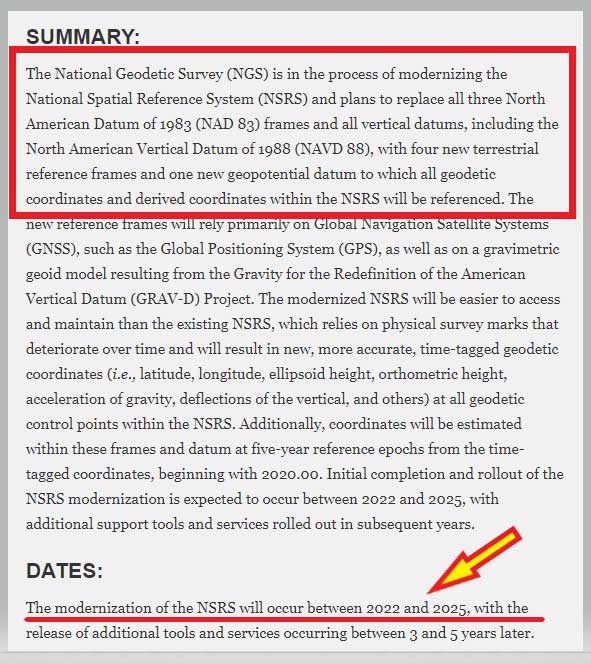
The first Federal notice was titled “Upcoming Changes to the National Spatial Reference System.” See the box titled “Federal Register Notice titled Upcoming Changes to the National Spatial Reference System” for the summary. This announcement provides a statement about the new, modernized NSRS and that it’s going to be published between 2022 and 2025. The information about the modernized NSRS shouldn’t be new to anyone that’s been reading my newsletters, but the Federal Notice makes it official and NGS provides dates of when the modernization will be rolled out.
Federal Register Notice titled “Upcoming Changes to the National Spatial Reference System”
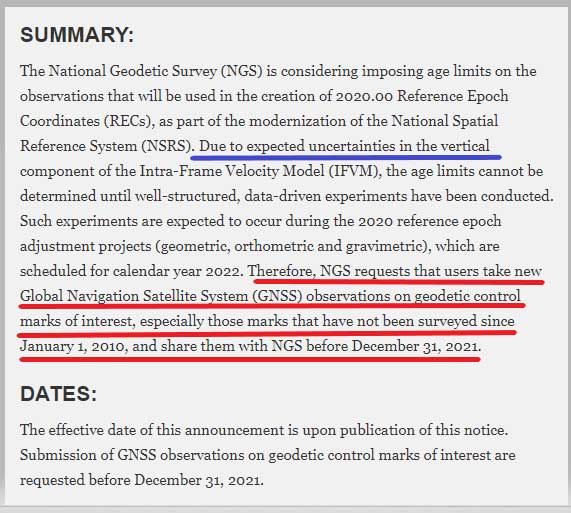
The second Federal Notice was titled “Consideration of Potential Age Limiting Observations To Be Used To Compute 2020.00 Reference Epoch Coordinates in the National Spatial Reference System.” This is a very important notice that users of NGS published coordinates should read and understand. NGS is considering imposing data age limits that will be part of the new, modernized NSRS. See the box titled “Imposing Age Limits of Data in 2022” for a summary of the Federal Register Notice announcement.
My last column highlighted that in the modernized NSRS the only way to get “into the datum” will be through a GNSS survey. It noted that leveling projects generate relative height differences not absolute heights. It emphasized that in the new modernized, time-dependent NSRS, the absolute height will be provided by up-to-date GNSS data; and the relative height differences between leveling marks will be provided by the leveling data. Many of my previous newsletters have explained different aspects of the new NSRS and how it may affect the surveying and mapping community products and services. As the Federal Register Notice implied, at this moment, NGS expects large uncertainties in the vertical component of the Intra-Frame Velocity Model (IFVM) which will translate into the GNSS-derived height Limiting the age of data will help to reduce the amount of uncertainty in the vertical component based on older data. Saying that, this could have an impact on users that rely on coordinates established using data acquired prior to 2010. NGS is requesting that users take new GNSS observations on all stations of interest that haven’t been occupied since the year 2010. The supplementary information in the Federal Register notice contains some very important statements. I have highlighted several statements in the box titled “Supplementary Information from Imposing Age Limits of Data in 2022.”
NGS hasn’t decided on the date of the age limit but the notice states that “For instance, it is unlikely that such an age-limit will be fewer than 10 years.” This is why NGS recommends the following “that users take new GNSS observations on geodetic control marks of interest that have not been surveyed since January 1, 2010, and asks the users to submit the observations to NGS before December 31, 2021.” Another important item in the supplemental information section is that NGS is enhancing the OPUS-Projects tool to include real-time kinematic and real-time network (RTK/RTN) observations. This should help to facilitate users submitting data on marks of interest so that they will have 2020.0 Reference Epoch Coordinates (REC).
Supplementary Information from Imposing Age Limits of Data in 2022
SUPPLEMENTARY INFORMATION:
In 2017, the National Geodetic Survey (NGS) announced its plans to estimate RECs on a five-year cycle in NOAA Technical Report NOS NGS 67, 2019, starting with the first reference epoch at 2020.00, as part of the modernization of the NSRS. In the Technical Report, the exact observations to be used for this estimation were listed as “To Be Determined.” NGS is considering imposing age limits upon the observations that will be used, particularly because of expected uncertainties in the vertical component of the IFVM. These age limits cannot be determined until additional well-structured, data-driven experiments are conducted. Such experiments are expected to occur during the 2020 reference epoch adjustment projects (geometric, orthometric, and gravimetric), which are scheduled for calendar year 2022.
However, since the cut-off for new observations to enter those adjustment projects is December 31, 2021, any decision to age-limit input observations will come too late for submissions to impact the 2020 RECs. While the cut-off for age-limited observations is unknown, certain assumptions are safe to make. For instance, it is unlikely that such an age-limit will be fewer than 10 years. Older observations may be used in the estimation of 2020 RECs, but this cannot be guaranteed. As such, NGS requests that users take new GNSS observations on geodetic control marks of interest that have not been surveyed since January 1, 2010, and asks the users to submit the observations to NGS before December 31, 2021. Users may either (a) submit existing unsubmitted observations through the OPUS-Share tool or (b) conduct new GNSS observations and submit the data to NGS via the OPUS-Share tool.
In order to increase the submission of GNSS observations on marks, NGS is prioritizing the finalization of an expanded OPUS-Projects tool, which will allow real-time kinematic and real time network (RTK/RTN) observations to be submitted, rather than the standard four-hour observations required in OPUS-Share. Initial roll-out of this new tool is expected to occur during calendar year 2020.
This action is designed to increase both the number and the coordinate accuracy of geodetic control points, which in the modernized NSRS will have an estimated 2020.00 REC. Historically, NGS has combined data across multiple decades to estimate geodetic coordinates, yet such efforts have not fully accounted for the lack of information about vertical motion of geodetic control points throughout the years. Since height information is critical to the understanding of floods, failure to compute heights accurately can have negative impacts on property and lives. NGS views periodic re-surveys of geodetic control points, rather than the estimation of coordinates from observations that are years (or even decades) old, as the most effective way to maintain accurate and up-to-date knowledge of geodetic coordinates, including heights. As such, this announcement provides users of the NSRS with advance notice that geodetic control points of interest to them should be re-surveyed for the most accurate representation of geodetic coordinates, including heights.
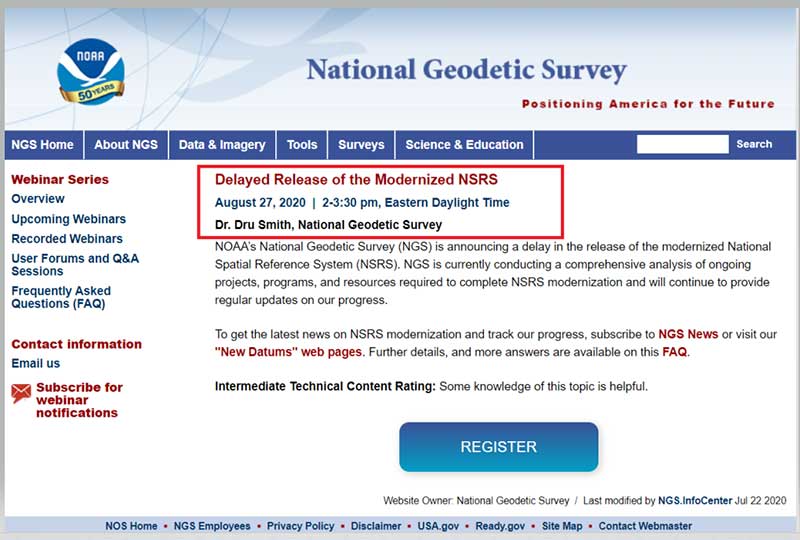
NGS has scheduled a webinar for August 27, 2020, to discuss the delayed release of the modernized NSRS. See the box titled “Webinar on Delayed Release of the Modernized NSRS” for the announcement and web link to register for the webinar. I would encourage all users of the NSRS to register for this webinar.
Many users are probably wondering if the delay in the new, modernized NSRS will change the dates of other deadlines. The FAQs webpage addresses some of these questions. I have highlighted a few FAQs in the box titled “Questions from NGS FAQ Website.”
How will the delay affect the GPS on Benchmarks Phase II deadlines?
The deadline for submittal of GPSonBM data for the 2022 Transformation tool will remain December 31, 2021
If SPCS2022 zone designs are completed before other parts of NSRS modernization, will SPCS2022 be released sooner?
No. SPCS2022 is explicitly defined with respect the four 2022 terrestrial reference frames (not NAD 83), and SPCS2022 will be released along with the roll-out of those frames. If the frames are rolled out prior to other parts of the NSRS modernization, the frames will be accompanied by SPCS2022 (see the previous FAQ about phased roll-outs).
However, complete definitions of all SPCS2022 zones will be made available as soon as they are finalized. NGS expects that to occur by the end of 2021. Providing zone definitions early will give software vendors, database administrators, and others ample time to adopt and test them in their systems. Doing so will ensure SPCS2022 is available for immediate use upon roll-out of the 2022 terrestrial reference frames.
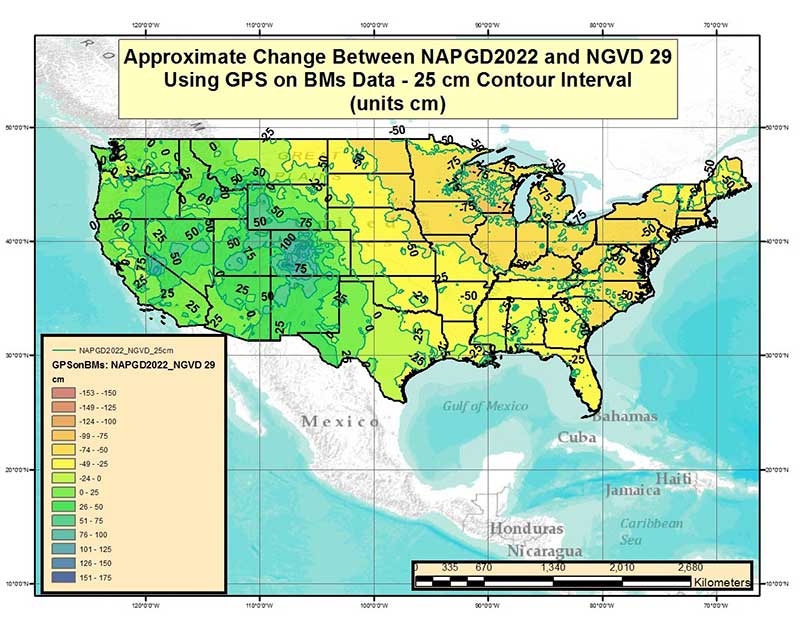
My projected height change seems to return me to NGVD 29 heights. Is this a coincidence?
This is coincidental. It so happens that, in some areas of the country the actual orthometric height in a region happens to be numerically closer to NGVD 29 than NAVD 88. NGVD 29 itself has biases and tilts which make it as inappropriate of an estimate of true orthometric heights as NAVD 88
[NOTE: I have heard this question from many of my readers so I provided an approximate estimate of the differences between NAPGD2022 orthometric heights and NGVD 29 height values in my June 2017 Survey Scene column. See figure below labeled “Figure 2 from June 2017 Survey Scene Newsletter.”]
Image: National Geodetic Survey
Figure 2 from June 2017 Survey Scene Newsletter
Future newsletters will address updates on the modernized NSRS as they become available to the user community.
Ask anyone what time means to them, and they will give you a different answer. Benjamin Franklin famously stated that “time is money.” Time for the surveyor can mean being out in the field retracing a boundary, drafting a plat or working with a client to help them see their goals achieved. Just like any other profession, time can be a friend or foe for the surveyor. We seem to run out of it more than we have an excess of it. Either way, time marches on as we go about our business.
Time, however, is changing the surveyor’s world and how we go about our methods of measurement. While it seems like a crazy concept, time is the major component requiring changes to geodetic procedural processes and how we will determine our locations in the future.
We will continue to see advances in hardware and software along with new interfaces and ways to collect and display survey data almost daily, and we will continue to deal with adaptation. However, surveyors must be ready for the next big challenge: a national horizontal and vertical adjustment of the National Spatial Reference System (NSRS) into a new standard. The North American Terrestrial Reference Frame of 2022 (NATRF2022.) is currently being developed by NGS and will replace NAD83 and NAVD88. Most surveyors will ask why we are getting ready for a historic change in datums. Easy — it’s all about time.
Expanded Variables
Just as early travelers thought the Earth was flat and learned it wasn’t through exploration and science, we are learning more everyday regarding how our world is changing. To get a better understanding of how our world is changing, NGS and the geodesy community have expanded the environmental variables of geographic location to areas including gravity, geoid undulations and geopotential data, plate tectonics and crustal evolution, and additional GNSS data analysis through satellites and continuously operating reference station (CORS) installations.
By introducing new attributes affecting coordinate data, including horizontal motions induced directly or indirectly by adjoining tectonic plates, horizontal motions induced by Global Isostatic Adjustment, other horizontal motions and all vertical motions in their entirety (per NGS NOAA Technical Report NOS NGS 62), data captured will be used to create an Intra-Frame Velocity Model (IFVM). Data following this format will be now be used to monitor the movement of survey positions from implementation forward. The key factor in which all the data is centralized is time.
My GPS World colleague David Zilkoski presented a thorough explanation (“NGS to Replace NAVD88 in 2022: What GNSS Users Need To Know) of the nuts and bolts behind the changes. Here are the basic reasons behind the new adjustment as provided by NGS:
NAD 83 and NAVD 88, although still the official horizontal and vertical datums of the National Spatial Reference System (NSRS), have been identified as having shortcomings that are best addressed through defining new horizontal and vertical datums.
Specifically, NAD 83 is non-geocentric by about 2.2 meters. Secondly, NAVD 88 is both biased (by about one-half meter) and tilted (about 1 meter coast to coast) relative to the best global geoid models available today. Both of these issues derive from the fact that both datums were defined primarily using terrestrial surveying techniques at passive geodetic survey marks. This network of survey marks deteriorate over time (both through unchecked physical movement and simple removal), and resources are not available to maintain them.
The new reference frames (geometric and geopotential) will rely primarily Global Navigation Satellite Systems (GNSS) such as the Global Positioning System (GPS) as well as an updated and time-tracked geoid model. This paradigm will be easier and more cost-effective to maintain.
Plate tectonics
These proposed changes to the NSRS, however, are based upon how much we have learned about our changing Earth using GNSS equipment and data collection. Time, as it turns out, is a big factor in how we measure and document locations. A point that is determined exactly here on this day at a specific moment will have moved due to plate tectonics and other variables to there over a period of time.
New Vertical Component
Another aspect of the datum change will be the definition of a new vertical component. Surveyors are familiar with the establishment of NGVD29 based upon mean sea level, and also NAVD88 being based upon the benchmark at Father Point/Rimouski, Quebec, Canada with reference to the International Great Lakes Datum of 1985. What science has taught us in the years beyond NAVD88 is that there is a greater force at play when it comes to the vertical piece of geolocation: gravity.
Yes, gravity keeps us on the ground and causes water to flow downhill, but the development of gravitational studies has led to incredible discoveries of how gravity affects elevation. It was always assumed that the gravitational pull on the earth was uniform worldwide, but with the development of instruments that can measure and map the variations in gravity, NGS will be redefining the vertical datum through a program called GRAV-D. NGS is currently flying in various portions of the U.S. and is scheduled to be completed by 2021 in order to roll out with the new horizontal program in 2022.
So, it turns out that time has been affecting not just our productivity but also our positions on the earth. Another famous quote by Paulo Coelho does hold true: “Time neither moves nor is stationary. Time changes.” Time has passed since this article began; did you feel the earth move?
What about our survey monuments and state plane coordinates?
For many surveyors, the main question is simple: why now? What is so bad with our existing NAD83 and NAVD88 datums?
Map courtesy of GISGeography, at http://gisgeography.com/state-plane-coordinate-system-spcs/
The reason is very simple; staying current with our favorite tool in the toolbox: GNSS. Surveyors have always been about “monuments” and perpetuation of data from established points located on the face of the Earth with published and/or known values. This concept has become even more important to the surveying community once the proliferation of geographic-based and state plane coordinate data was published for all to utilize. I touched on the surveyor’s use and data collection/perpetuation of location values in a past column (GPS World November 2016). As long as NGS updated the national database with more information and a simple adjustment every so often, life was good and simple.
But now we have worlds colliding; static monuments with published horizontal and vertical values in one corner, while in the other corner is the new paradigm of ever shifting crustal plates and changing positional values monitored by GNSS data through satellites and a network of CORS located worldwide.
This situation makes me harken back to one of my favorite “Ghostbusters” lines from Bill Murray’s character, Dr. Peter Venkman: “Human sacrifice, dogs and cats living together – mass hysteria…”
Okay, maybe it won’t be quite that bad but there will be many surveyors that will have trouble wrapping their minds around the new concept of “moving monuments.” Our reliance on state plane coordinate systems (SPCS) is at an all-time high with the sharing of data by various parties being more seamless than ever. The notion that a permanent monument’s positional values will be constantly changing is a head-spinner to most.
NGS has also stated that their new system and procedures will not maintain data values for SPCS (see NGS State Plane Flyer). There are currently 125 SPCS zones and 3235 county systems throughout the US and territories in place that rely on NGS data as the main framework, so having tools for reference and conversion in place will be crucial. Thus, it will be a herculean task to create a procedure/process to easily pass coordinate values between our many static systems worldwide and the new dynamic but very robust system underway from NGS.
Based upon information currently available about the NAD2022 system, it would be more efficient for all those who use geolocation data to modify their thinking to adapt to a dynamic coordinate system. However, this is a similar situation to early scientists and geographers throwing out all references to flat-earth maps and atlases. For surveyors in the twilight of their careers, these are radical items to consider and a far cry from the standardized chain and theodolite. (Maybe there will be mass hysteria…)
The good news is that we have very intelligent people in the surveying and geodetic community who are working on solutions for the masses. The beauty of newer technology is how quickly hardware and software can be adapted to fit these new data conditions. Getting the word out on these changes and educating our profession will be a key factor to its success.
Further Refinement of Coordinate Systems
While the use of GNSS has enabled the discovery of time as a significant variable in geolocation, it has also expanded out coverage area of coordinate systems to much larger areas. Distances that could not be computed prior to GNSS are now easily attained and large projects can be managed within a common coordinate system. County, regional and state agencies can now create large-scale GIS databases that utilize a single coordinate system as well.
However, there are two differing tracks being formed with the continued development of the new datum by NGS. While the new datum will become more precise and predictable, there are movements in opposing camps to make changes in user coordinate in the furthest possible ways: statewide single zone system versus county/regional low distortion projection (LDP) systems. They both have their strengths and weaknesses, and will depend on the application of the user to choose the appropriate system.
Most states currently have two or more zones so there potential to combine all zones into one, but a major drawback will be the loss of accuracy away from the defining points. For GIS users, this accuracy will more than adequate and will allow the merging of data from across the state into one unified system.
Surveyors, however, are an interesting bunch in that they accept only the most accurate AND precise measurements. The growing use of LDP is rapidly changing the implementation and management of coordinate system in smaller areas such as counties and regional DOT districts.
However, both systems have a place in our surveying and mapping world. NGS has stated that while they will help with transformation software and apps, it will leave the decision of legislative standards to each state. It will be paramount that each state study what makes the most sense for its users and pass the appropriate legislation.
“The days are long but the years are short”
As I look back and realize how much has changed with modern technology and overall knowledge of our profession, it is with much anticipation how much more will change with advancements we don’t even know about yet. The electronic distance meter (EDM) was revolutionary for many surveyors and I’ve waxed poetic about my feelings regarding RTK GNSS in past columns (GPS World May 2016). Once again, however, technology and information based upon its use has revolutionized our data system.
As a profession, surveyors have embraced GNSS use and data collection from the early implementation of the system. And while the advances of UAV use, laser scanners and LiDAR along with software improvements have revolutionized data collection, these proposed coordinate improvements by NGS will bring more potential quality information into the surveyor’s hands.
And while time is money as Mr. Franklin famously stated, 2022 is just around the corner. A good friend of mine is famous for saying: “Good coordination begins with good coordinates.” The work performed by NGS is helping us do just that. The entire surveying, mapping and geodetic community has lots to accomplish to be ready for the changes from NGS. Let’s get to work.
By Charles Curry / Presented at ION ITM, January 2017
On Jan. 26, 2016 alarms occurred on GPS timing receivers around the globe. This article tells the story as experienced by the Chronos support team over a four-day period, dealing with nearly 5,000 alarm events from many different GPS timing receivers worldwide. It examines whether the alarms were service-affecting or if the equipment switched to a resilient fallback status. This event was not without precedent. The last time such an event happened to the GPS transmission was Jan. 1, 2004, and coincidentally SVN23 was also to blame then. A major network event happened to GLONASS on April 1, 2014. These qualify as “Black Swan Events” first proposed by Nassim Nicholas Taleb in his 2001 book, Fooled by Randomness. This was a unique event with unique impact across the globe. Chronos supports many thousands of GPS-based timing receivers for more than 100 clients in more than 50 countries. This article also reviews more recent work to understand what caused the event and how it manifested itself.
National Spatial Reference System Access in 2022
By Daniel Roman, NOAA / Presented at ION ITM, Jan 2017
In 2022, the National Geodetic Survey will implement a new datum to replace both the North American Datum of 1983 (NAD 83) and the North American Vertical Datum of 1988 (NAVD 88). This datum will provide the primary access to the National Spatial Reference System (NSRS) through GNSS and a geopotential model. Foundation CORS sites will provide a backbone network to ensure that the U.S. contributions to the ITRF solutions remain robust. In turn, these sites will also provide the connection to the densified network of CORS stations to provide local access. RTN and RTK surveys will provide an additional layer of access for improved local resolution. Velocities will be taken into account to provide tie back to survey points. Passive control (benchmarks) will become secondary access to the NSRS with conversion models being provided to ensure backward compatibility to NAD 83 and NAVD 88.
As the Gulf Coast begins another hurricane season, researchers with the Conrad Blucher Institute for Surveying and Science (CBI) at Texas A&M University-Corpus Christi will be improving the data collection system to allow for more accurate planning and predictions for flooding and sea-level rise.
CBI has been awarded $1.35 million to enhance the National Spatial Reference System that helps model and predict sea level rise.
Forecasters are predicting a hurricane season with one or two major hurricanes, but flooding can still pose significant threat, especially to the vital infrastructure along the Gulf coast, which includes 10 of the 14 largest ports. The long-term stability of this region’s infrastructure is in question due to the impact of sea level rise and associated increases in risks of flooding. Growing Gulf coastal populations, up 32 percent from 1990 to 2008, compound the risks. Preparing for sea level rise, flooding and other impacts requires accurate data about what’s occurring at the water’s edge. Collection methods for this type of geospatial data will be enhanced through this project.
The funding, from the National Geodetic Survey, a project of the National Oceanic and Atmospheric Administration, provides the foundation for modeling along the northern Gulf of Mexico through the National Spatial Reference System.
The project focuses on an area that is most exposed to inundation from tropical storm surge and has a high risk of flooding and long-term effects of climate change and subsidence.
“We are excited to be part of this project to provide the latest geospatial data with information from tide gauges, sea level observations, land elevation reference points, and 3D positioning,” said Gary Jeffress, director of CBI. “This system will help local and regional leaders plan for improved resilience to the impacts of sea level rise and flooding and develop long-term strategies to address impacts along the northern Gulf of Mexico.”
The project will extend and improve monitoring stations from Texas to the Florida Keys to provide additional measurements, including more accurate data regarding elevations, 3D positioning, subsidence rates and sea level observations, that will establish ongoing monitoring of the relative sea-level change along the northern Gulf of Mexico in the coming decades.
Jeffress, Ruizhi Chen and James Rizzo, with CBI and Texas Spatial Reference Center, will lead the project for A&M-Corpus Christi. Researchers from University of Southern Mississippi, Louisiana State University and Florida Atlantic University are also partners in the project.
On September 29, North America’s largest real-time GNSS network, Leica Geosystems’ SmartNet, became the first network to adopt the draft NGS RTN Guidelines across multiple states, and can now provide an accurate tie to the new NAD83 (NA2011) National Spatial Reference System. For the first time, SmartNet users throughout the U.S. are working within a common frame of reference.
The Leica Geosystems SmartNet, which provides real-time positioning to more than 2,000 subscribers in 17 U.S. states and four Canadian provinces, became the first network to adopt the draft National Geodetic Service’s (NGS) RTN guidelines across its entire network. “This is huge for our subscribers,” said Director, Reference Station Operations Wendy Watson, “We are now providing centimeter-level accuracy, on a common frame of reference, everywhere in our network. That’s never been done before, and we’re proud to be first.”
The adjustment was a significant technical challenge, and will require some adaptations by current SmartNet subscribers. “It’s critical for subscriber and all their field crews to understand the effects of this adjustment in the field,” said Watson, “It affects all SmartNet users and all SmartNet stations. For most of the US subscribers there will be minor shifts in their positional data but in some areas like California the shift is greater. To compensate for these changes in the field, users will need to perform a transformation, localization, or calibration, and tie to existing control. We’ve provided webinars on this, which are archived at our site, and SmartNet representatives are happy to answer any and all questions. And also, we have a complete suite of online tools to assist users at http://adjustment.smartnetna.com.”
The SmartNet Adjustment Launch commenced on Saturday, September 29, at 9:00 p.m. ET and the SmartNet network was only down for the weekend—service resumed without a hitch on Monday, October 1, at 12:00 a.m.
“All SmartNet stations are now positioned to ensure an unprecedented level of internal precision and consistency between themselves, while at the same time providing an accurate tie to the new NAD83 (NA2011) National Spatial Reference System,” Watson explained, “By implementing the draft NGS RTN Guidelines, we positioned all of our stations to provide the requisite 2 cm horizontal and 4-cm vertical accuracy to the NSRS, while at the same time achieving the 1 cm level internal consistency needed to provide the high-precision and high-quality network corrections our users have come to expect. While we understand this change may have its challenges short term for some of our users, getting our entire network on the same, NGS-approved basis will improve the quality and consistency of everyone’s work.”


 Our reliance on state plane coordinate systems (SPCS) is at an all-time high with the sharing of data by various parties being more seamless than ever. The notion that a permanent monument’s positional values will be constantly changing is a head-spinner to most.


