Tag: natural disasters

  • Wingcopter drones conduct aerial surveys in Japan

    Wingcopter drones conduct aerial surveys in Japan

    Wingcopter’s authorized partner in Japan, ITOCHU Corporation, has signed a Memorandum of Understanding (MOU) to collaborate on the practical use of Wingcopter’s long-range drones in aerial surveying together with PASCO Corporation and YellowScan Japan.

    The companies initially plan to use the Wingcopter 198 in disaster management where drone-based surveying is playing an increasingly important role,

    • to create hazard maps and monitor ground deformation as part of effective pre-disaster prevention,
    • to gather information and assess damage in the event of a disaster, and
    • to measure terrain changes and develop recovery plans during post-disaster restoration.

    According to Wingcopter, carrying out these tasks is easier and less risky with fixed-wing drones such as the Wingcopter 198 than with traditional human or aircraft-based methods.

    About 70 percent of Japan’s land consists of mountainous and hilly terrain, with steep slopes and short, fast-flowing rivers. Conventional multicopter droneswould not be suitable for such tasks as they are limited in range and coverage compared to the Wingcopter 198.

    Image: Wingcopter
    Image: Wingcopter

    Under the MOU, YellowScan Japan’s advanced lidaer scanner Voyager will be used on the Wingcopter 198. By integrating this technology with PASCO’s extensive expertise in operational quality and safety in aerial surveying, it is possible to carry out long-distance and large-area surveys that were previously difficult to achieve without manned aircraft. 

    In a single 45-minute flight, the Wingcopter 198 can scan 1,000+ hectares, simultaneously capturing lidar and RGB data, allowing the system to generate an exceptionally high point density and precision. This makes it suitable even for demanding applications.

    The collaboration also promotes automation and labor savings in surveying tasks, contributing to sustainable development in the surveying industry and reducing disaster risks.

  • Lifesaving GPS technology aids in natural disasters

    Lifesaving GPS technology aids in natural disasters

    By Alex Damato, Acting Executive Director, GPS Innovation Alliance

    Alex Damato
    Alex Damato

    It can be easy to take GPS for granted as the average driver and smartphone user continues to enjoy convenience, entertainment and navigation from this technology, enhancing nearly every part of our daily lives. While we may not enjoy its benefits every day, one important use case keeps us and our environment safer: GPS has become a vital part of modern emergency response.

    Many Americans across the nation are preparing for the impending hurricane season or the threat of other natural disasters, such as wildfires and earthquakes. GPS will play a critical role in recovery and response efforts. When natural disasters occur, accurate and actionable location information helps save lives and restore critical infrastructure as quickly as possible.

    GPS has fundamentally improved access to information that can help the public prepare for these natural disasters, rather than waiting for them to strike. This information is more critical than ever. For example, California’s Oak fire spread to almost 20,000 acres and is part of a larger trend in California that has destroyed 14,700 buildings and killed 36 people over the past two years. Farther north, 530 wildfires in Alaska burned areas larger than the state of Connecticut in the state’s worst fire season in recent history.

    Photo: Alextov//iStock/Getty Images Plus/Getty Images
    Photo: Alextov//iStock/Getty Images Plus/Getty Images

    In addition to helping the public face natural disasters, GPS helps firefighters plan their operations more efficiently and enables them to receive real-time information on the location of the wildfires they are fighting. With real-time mapping, planning and operations, fire chiefs can respond immediately to areas where wildfires are dangerously advancing.

    In turn, GPS protects our first responders by preventing firefighters from getting caught in unpredictable fires they would have otherwise not known were heading their way.

    Firefighters use IGNIS drones to help prevent wildfires from starting or safely contain them with backburns. IGNIS relies on GPS for tracking, safety and control, which in turn helps firefighters avoid the dangers associated with being near prescribed burns. Without GPS, resources to help firefighters would not be deployed as efficiently — wildfires could spread even more quickly as a result, causing even more damage to our homes and infrastructure.

    Beyond wildfires, GPS technology is critical to emergency response and weather safety. GPS data allow emergency responders to better locate callers and reduce the incidence of misrouting to outside jurisdictions. Using GPS data, a caller can be located in close proximity to his or her actual location. By reducing rates of misrouting and accurately pinpointing emergency locations, GPS helps reduce response time by taking away the need to reroute calls and search for callers’ locations.

    In a recent experiment, NASA-commissioned researchers used GPS signals to better predict a hurricane’s maximum wind speed, which could help federal agencies and forecasters better predict the danger of hurricanes and provide more actionable information to determine whether to issue evacuation orders.

    The GPS Innovation Alliance (GPSIA) is proud to support the role of GPS as a critical enabling technology for public safety, disaster response and relief efforts. With GPS, precise real-time location information is at the fingertips of both consumers and first responders from pre-disaster planning efforts to post-disaster recovery. While GPS has already fundamentally improved modern emergency response systems, GPSIA will continue to advocate for the continued growth of these lifesaving GPS-enabled technologies and applications through rigorously developed technical rules, interference protections, and a predictable spectrum environment.

    Many of us have grown accustomed to the ease of GPS-enabled technologies, from smartphone to fitness trackers. At GPSIA, we’re also particularly proud of the role GPS plays in the many other life-saving ways the technology is being used and are committed to continuing this critical work.

  • PAR Government rebrands GIS situational awareness solution

    PAR Government rebrands GIS situational awareness solution

    Sit(x) running on an iPhone. (Photo: PAR Government))
    Sit(x) running on an iPhone. (Photo: PAR Government))

    PAR Government, a provider of geospatial and decision support solutions for 57 years, has rebranded its TeamConnect cloud-based situational awareness suite as Sit(x). The commercial Sit(x) solution is designed for enhanced collaboration among government and civilian public safety organizations. PAR Government Systems Corporation (PGSC) is a wholly owned subsidiary of PAR Technology Corporation.

    The Sit(x) solution enables individuals and teams to communicate directly by text or symbology and share real-time full-motion video (FMV), geographic information system (GIS) layers, imagery, GPS-derived locations, raster maps, photos and documents.

    To complement the Android and Windows support already available in Sit(x), PAR is offering a free iOS app, giving Apple smartphone users access to the technology.

    “The Sit(x) name better reflects the ability to provide effective situational awareness for any situation,” said Mark Kozak, PAR Government vice president of Product Innovation. “This results in faster, more informed decision making at the command level and in the field.”

    Sit(x) is a TAK server-as-a-service solution based on the Team Awareness Kit (TAK) situational awareness technology that PAR Government developed for the U.S. defense and intelligence community under contract to the Department of Defense. This technology has been deployed under demanding conditions by every branch of the U.S. armed forces over the past decade.

    PAR Government created the Sit(x) TAK server-as-a-Service offering specifically to enable real-time communication and information sharing between non-connected public safety personnel during rapidly evolving multi-jurisdictional situations, both planned and unexpected. These include large public gatherings, such as sports events or concerts, and emergency incidents related to terror attacks or natural disasters.

    “Sit(x) can save lives, time, and resources by federating unrelated police and fire departments, U.S. government agencies, volunteer search-and-rescue groups, and even private security firms to collaborate as one coordinated entity during a major event,” Kozak said. “Due to its TAK lineage, Sit(x) opens the lines of communications between civilian public safety and the U.S. military, as well as our allies, with no export restrictions.”

    The PAR Government Sit(x) offering is a subscription to the Sit(x) TAK Server-as-a-Service software suite in the cloud. Ready in minutes, Sit(x) scales to handle teams of any size and is protected with end-to-end secure connectivity. The suite provides complete lifecycle management – event preparation, rehearsal, training, dynamic response, post-mission playback and analysis, and new response simulation.

    The investment by subscribing agencies is minimal because there is no computer hardware to purchase, and the end-user applications are available from the Google Play Store or Apple App Store for free. All server operations and software maintenance are managed 24/7 in the cloud by PAR.

  • The surveyor and augmented reality – ready for the future

    The surveyor and augmented reality – ready for the future

    Photo: ipopba/iStock / Getty Images Plus/Getty Images
    Photo: ipopba/iStock / Getty Images Plus/Getty Images

    The surveying profession has experienced a plethora of advancing technology over the past two decades and it does not look like there will be a slowdown any time soon. From robotic total stations to laser scanning to the use of multiple GNSS constellations, the profession is constantly adapting these emerging technologies into a useful tool for daily applications. For most practicing surveyors, it is a challenge to keep up with not just the hardware of these advancements, but also with software, which is being developed in parallel. Have you tried to open and draw a simple figure in any of the industry standard CAD programs lately?

    The complexity of these programs, while advancing the capability of many technical professions, forces even the casual user to maintain a regular habit of software education and training. While it may seem primitive to say that a practitioner is a “practicing” surveyor, on-the-job training never stops. Just when the profession thinks there are no more significant advancements, something comes out of left field that truly blindsides us. (See the adoption of UAVS by the surveying profession compared to the public sector…) What do I think will be one of the next “big things” to revolutionize surveying? The technology is already here, and we need to seriously get on board with adoption before we miss another opportunity to highlight the expertise of the profession.

    VIRTUAL REALITY and AUGMENTED REALITY (VR & AR)

    First, we need to know that virtual reality (VR) and augmented reality (AR) are different, even though many people use these terms interchangeably. The differences are as follows:

    Virtual Reality (VR)

    • VR is a virtual world generated by computers and programming.
    • VR is a closed environment that is fully immersive.
    • VR requires a device (specialized glasses and/or a headset).
    • Users in the VR experience are limited by the programming and their computer’s abilities.
    • The VR experience may be based upon real-world conditions but is a fictional setting.
    • Users of VR can travel and experience conditions in real and fictitious places.
    • VR can allow users to have experiences that are not physically possible in the real world.
    • VR is 75% virtual + 25% real (industry “rule of thumb”)

    Augmented Reality (AR)

    • AR is typically based on actual physical places.
    • AR is an open environment that is partly immersive.
    • In AR, the user controls the environment.
    • AR combines virtual elements and experiences with real world conditions.
    • Experiences in AR can be accessed by computer, tablet, and smartphones.
    • AR is useful for product visualization and evaluation.
    • AR is 75% real + 25% virtual (industry “rule of thumb”)

    It is important to know these difference between the two technologies in order to implement the correct one for the task at hand. However, both will play an important in surveying for generations to come.

    Photo: Georgijevic/iStock / Getty Images Plus/Getty Images
    Photo: Georgijevic/iStock / Getty Images Plus/Getty Images

    USES OF VIRTUAL REALITY TECHNOLOGY FOR SURVEYING

    One of the surveyor’s biggest responsibilities is to complete an accurate site conditions model by topographic methods. Once the topographic survey is completed, site designers will utilize this information to create a unique project that works with the existing site conditions. Advances in CAD software and technology allow engineers and architects to design in 3D and blend the new site with the existing conditions, drainage, and utilities. These designs can be further refined into virtual reality models to give the project’s stakeholders a better indication of what the final product will be when construction is completed.

    The key takeaway here is that the surveyor is responsible for delivering the existing conditions model. A model that accurately represents the subject site but in digital form enables the design of the project to be more efficient and realistic to meet the client’s expectation. Surveyers, however, will not use virtual reality as much as augmented reality, for many good reasons.

    USES OF AUGMENTED REALITY TECHNOLOGY FOR SURVEYING

    AR is still in its infancy. Because surveyors have an interest in the existing and proposed conditions of sites, the use of AR becomes an important tool for the future. Merging proposed information with existing site conditions can become the norm, but like many emerging technologies, the profession will need to learn how to embrace it.

    To get a better idea of how the technology works and why surveyors need to consider using it, let us look at an application that showcases AR: Pokémon Go. Yes, the smartphone game app that took the world by storm in 2016 and captivated many “trainers” to search the streets for Ultra Balls and characters. (There are still more than 100 million active players worldwide.) Players of all ages have continued to search for elusive items and characters in a high-tech scavenger hunt that is constantly changing, and all based upon the real world around us. By merging a real-time view with game entities at random geographic locations, players move about our world using one of the best examples of AR.

    How does this apply to the surveying profession? Surveyors could utilize AR in everyday tasks but that would require having a fully developed 3D design model that could merge with the existing conditions in their visual device. There are a variety of devices for utilizing AR, including smartphones and tablets. Many of the new data collectors running Windows and Android operating systems can also be used for incorporating AR into the field operation. Here are some examples of AR how can be utilized for surveying tasks:

    • While construction staking, AR can be used to assist with structure and improvement location. A quick visual check can help confirm staking calculations are consistent with engineering design.
    • Use AR to visually check installed improvements, including curbs, utility structures, and paving. Any deviation from the proposed design should be quite evident.
    • When establishing property corners, AR will help the field crew quickly determine whether the calculated location is accessible. This can be used for staking out pre-calculated boundary points and/or proposed lot corners in a new subdivision.

    Photo: AnnaFrajtova/iStock / Getty Images Plus/Getty Images
    Photo: AnnaFrajtova/iStock / Getty Images Plus/Getty Images

    Here are a few ideas as to how surveyors could utilize AR in everyday tasks in the future:

    • As public utilities are becoming more available within GIS shape files with geographic locations, they could be utilized with AR to help visually establish locations in the field. Mainline utilities and service lines would become easier to physically verify using AR.
    • Another GIS shapefile entity, the parcel line layer, could be used to help the surveyor understand where the property owner believes the line(s) to be as opposed to the actual monumented location.
    • All reference monuments and benchmarks established by public agencies using geographic location information could enhance the “treasure hunt” of confirming local datum points.

    SURVEYING USING AR TO PROTECT THE PUBLIC

    Geospatial information has revolutionized our world, so using AR to help when trouble strikes can potentially be a lifesaver. Recently, an oceanfront condominium in Florida collapsed due to structural failure. While the age of the structure precluded it from having any digital geographic location data, any new similar development could be measured and recorded to assist with future emergency needs. Almost all new development has digital surveying, engineering, and architecture and must use local horizontal and vertical datums. Using the proposed information and verifying with post-construction record drawings, the digital record can be created.

    It doesn’t take a design flaw to create a public hazard. For instance, a gas leak could render any building, such as the Florida condo, susceptible to catastrophic damage. By having a digital model of the underground structure, emergency crews could use AR to help locate potential open spaces in the building. As is the case with installing fire suppression systems and emergency exits, the cost to create a digital model of a completed building will be well worth it to save lives.

    Underground utility corridors within cities, campuses, or manufacturing facilities could also utilize geospatial locations to establish a digital map for future use with AR. It will take time and significant cost to map existing facilities, yet it should be required for new sites to provide this information for emergencies and for use when designing expansions within the site. Having this utility information to use with AR during the design phase could lead to identifying potential problems before construction starts.

    Photo: 1001nights/E+/Getty Images
    Haiti after an earthquake. (Photo: 1001nights/E+/Getty Images)

    Another reason to plan for future safety is how much uncertainty we face in today’s society. At press time, we are coming up on the 20th anniversary of 9/11. We also just watched Haiti suffer another devastating earthquake. The 2021 hurricane season has also been very active, so that danger looms large, too. Disasters happen all the time with little to no warning. Our world is much more advanced than we were at the turn of the century, so we can use these advancements to map our infrastructure. Let us hope we never need to use the digital information for another disaster akin of 9/11. Instead, let us use it to ensure that we can get to someone in a remote spot if necessary.

    THE ROAD TO FUTURE MAPPING AND AUTOMATION

    As previously discussed, establishing a digital twin of our world could help provide a better map for establishing parcel ownership, reducing construction conflicts, and offering better planning tools for future expansion. Will it be completed within my lifetime? No, and I doubt it will be done within the next couple of generations after me.

    We can, however, get a significant start on capturing the necessary information to begin the process of digitization. Technology has exceeded my expectations just within the past decade, so I can only hope that more advancements will help with building this digital beast. More architects and engineers are utilizing BIM (building information modeling) for 3D design and collaboration. Most municipalities and counties have built some form of GIS that uses one of the standard geographic datums. Surveyors have fully embraced GNSS technology so state plane and national geographic coordinate systems have become the norm. In addition, we are seeing a wide number of consultants use autonomous vehicles (aerial, hydro, and terrestrial) with photogrammetry, LiDAR, and SLAM remote sensing. Another bit of good news is that computing power is higher than ever and that storage space is cheap for all this data. We should also include how 5G has expanded our reach and, with cloud storage, we can work from just about anywhere. We can do so much more than most of us ever dreamed of, so we need to leverage that into creating a digital entity that can be helpful.

    Photo: RyanJLane/E+/Getty Images
    Photo: RyanJLane/E+/Getty Images

    HOW TO IMPLEMENT THE LATEST TECHNOLOGY

    Augmented reality is one of many new technologies surveyors need to introduce into their toolbox. Many of you may be asking where to begin; my answer, depending on your age, may offend you.

    Hire a Gen Zer. Really.

    As a Gen Xer, I have come to realize my limitations on technology and being able to fully implement it. The Z generation, while lacking the experience of us wily old guys, see things much differently. The smartphone/tablet/computer, and even the latest data collectors, are designed with them in mind. They grew up playing computer games based in virtual reality, developed excellent hand-eye coordination, and find efficient ways of getting things done. Our surveying world is almost completely digital (when is the last time a client only wanted paper copies of a plat?), so now is the time to make the leap and ditch the drafting table. We have as much to learn from them as they do from us. Together, we can get the surveying profession ready for the next generations. It has been a great profession for us, so let us hand it off to the Z generation. They will (eventually) be glad we did.

  • Diving into real-time geospatial threat intelligence

    “Crime is common. Logic is rare. Therefore, it is upon the logic rather than upon the crime that you should dwell.”

    “Data! Data! Data!” He cried impatiently. “I can’t make bricks without clay.”

    — Sherlock Holmes, “The Adventure of the Copper Beeches,” Sir Arthur Conan Doyle


    Watson is to Holmes what information is to intelligence. Watson could listen to the client story, observe the situation, and recite to Holmes all the relevant facts, but he lacked the ability to string together the seemingly random pieces of information into a coherent chain of events leading to the correct hypothesis. A computer can become a Watson, but it takes a human to be Sherlock; however, a human misguided by cognitive biases will end up as Inspector Lestrade, always coming to the wrong conclusion.

    When it comes to data, the analogy of drinking from a fire hose is an understatement. Consider that a digital image can be terabytes in size and every day millions of images are taken. Facebook generates 4 petabytes of data daily, and each day there are 500 million tweets and 306 billion emails. Additionally, there are 20 billion connected devices. Combined, the world creates 2.5 quintillion bytes of data every day. If a grain of sand represents a byte of data, then every three days more data is created than there are grains of sand on the Earth, and it is only increasing.

    Somewhere in all that data are signals. Real-time threat intelligence systems are looking for those signals before the next huge event occurs. It is a high-stakes hunt for Leviathan, except that Leviathan is only a packet of sand traveling at lightspeed through a cloud obscured by dust.

    Nellis Air Force Base takes part in Red Flag 15-2 at its Combined Operations Center in 2015. (Photo: Senior Airman Thomas Spangler/U.S. Air Force.)
    Nellis Air Force Base takes part in Red Flag 15-2 at its Combined Operations Center in 2015. (Photo: Senior Airman Thomas Spangler/U.S. Air Force.)

    Interpreting a Signal

    The massive volume, variety and velocity of continuously flowing data far surpasses the ability of humans to process. It exceeds the bandwidth most systems can handle. And it quickly overwhelms the capacity to store, manage and act on the information in a timely and cost-effective manner. Resources are not infinite. The best model to handle an overwhelming amount of data is the human brain. Humans are biological sensors. Every moment of every second of our lives, our bodies are receiving an endless stream of stimuli from internal and external sources. Most of this stimuli registers at an unconscious level, and as long as the stimuli is normal and expected, it goes unnoticed by the conscious mind. If, however, any discomfort is experienced, the conscious mind is notified. Then that becomes the focus until normalized. Externally, the same applies to computer data systems. Normal conditions are ignored, but if there is something unusual, such as a loud constant noise, or a colder than normal temperature, it draws all the processing attention.

    In the realm of intelligence that is basically how things function. Algorithms are written to learn the normal patterns of life and to identify specific events, words, names, etc. As long as data is within normal parameters, it gets little attention, but as soon as an anomaly exceeds a threshold or something triggers the algorithm, it will immediately be brought to the attention of the intel center. An example can be viewed on the Global Incident Map dashboard. I encourage you to sign up for a free 72-hour membership. If you want to see what real news looks like, this would be a sampling. The number of real incidents that happen across the country and around the world that you never hear about, many of them hair-raising and all of them open source, add to the few stories the media has been able to tell about cyber attacks. Scroll down the page. There are many filters, but I recommend turning them all off to see the full extent of information. Clicking on an incident will drill down into the actual source so you can read about it more thoroughly.

    Below is the U.S. Army’s real-time critical incident dashboard called the Joint Analytic Real-Time Virtual Information Sharing System (JARVISS). It tracks and monitors activity near U.S. Army installations and standalone assets of interest around the world.

    Another dashboard for cyberattacks is Check Point, which shows just how aggressive cyberthreats are throughout world. Here, you can see the patterns of coordinated attacks. A war is underway. The soldiers are cyberwarriors. No country is safe. View the Live Cyber Threat Map.

    Photo:
    JARVISS is designed to target criminal activity and provide natural disaster information in and around Army installations and stand-alone facilities, as well as COVID-19 threats. (Image: Steve Gardner/U.S. Army}

    Fast Analysis in Real Time

    Monitoring this information, analysts look for connections. If a plane veers off its flight path, the local operations center is notified. An automatic query shows if any critical-infrastructure assets or other important structures and facilities are in the area. The analyst can immediately find out the type of aircraft, the call sign, who the plane is registered to and who filed the flight plan. Weather radar can be overlaid to see if that is a possible reason for the deviation. Incident reports can be displayed in real time within the area of interest, along with social media feeds and other sources of communication. Traffic patterns can be displayed.

    The important question that needs to be answered is whether this is a potential threat. Is there a connection to anything going on anywhere else? A dossier is developed on the person who filed the flight plan, the one who is assumed to be the pilot and the person or organization to which the plane is registered. All of this is being done in a matter of minutes, while the airplane either returns to its flight path or continues its diversion. The air traffic control tower is contacted to share information on the aircraft and its deviation. If the tower does not have an answer, it will radio the pilot for an answer. The passenger and crew manifest also are analyzed. All the data that can be pulled together — including the remaining fuel burn and the aircraft performance limitations — are analyzed.

    Patterns emerge from the data. These patterns lead backwards to a cause and forward toward the end result. Finding those clues in the data requires a team of specialists from six primary intelligence disciplines.

    • An imagery intelligence analyst brings in the live-streams and remote sensing.
    • A human intelligence analyst seeks motivating factors and ways to deescalate the situation.
    • A measurements and signatures intelligence specialist defines the operating limitations and the mechanics and science particular to the scenario.
    • An open-source intelligence analyst accesses and queries open-source data sets to provide clues.
    • A signals intelligence specialist focuses on the communications and electronic signatures.
    • A geospatial intelligence analyst brings it all together and provides spatial context through the map the team uses that shows the events unfold in real time.

    These analysts and sometimes many others will collect all these pieces of information and turn them into intelligence that decision-makers can use to take action. That is the purpose of intelligence; as CIA veteran Richard Heuer stated, “Intelligence seeks to illuminate the unknown.”

    Fortunately, most alerts turn out to be false positives, but every one of them is treated as if it were “the one.” These false positives turn out to be excellent, real-world exercises that hone the skills of the team and wire the brain for speed. These events can last mere minutes or several hours. It’s an adrenaline rush.

    To explore live streaming data feeds, Esri has a growing volume of data in its ArcGIS Living Atlas.


    “My mind rebels at stagnation. Give me problems, give me work, give me the most abstruse cryptogram, or the most intricate analysis, and I am in my own proper atmosphere…”
    — Sherlock Holmes, “The Sign of the Four,” Sir Arthur Conan Doyle


    William Tewelow works for the Federal Aviation Administration. He is a graduate of a management fellowship program. While on special assignment to the U.S. Department of Transportation William led the project to crowdsource the National Address Database for the White House Open Data Partnership. He is a Geographic Information Systems Professional (GISP) and a Maryland Scholar STEMnet Speaker. He has a degree in Geographic Information Technology and Intelligence Studies from American Military University and is currently earning a degree in Organizational Leadership. William retired from the U.S. Navy after serving 23 years as a Geospatial and Imagery Intelligence Specialist, a Naval Aviator, a Meteorologist, and a Tactical Oceanographer. He was among the first in the nation to earn a Geospatial Specialist Certification from the U.S. Department of Labor while working at NASA Stennis Space Center in Mississippi. He is married, enjoys traveling, solving problems, playing with data, and fascinated by new technology and historical context. His favorite quote is, “A man’s mind changed by a new idea can never go back to its original dimension.” ~ Oliver Wendell Holmes

  • NASA program aids with disaster relief efforts

    NASA program aids with disaster relief efforts

    Satellite imagery and mapping have proven to be critical technologies when it comes to disaster relief efforts.

    The NASA Earth Science Disasters Program has harnessed these technologies to help communities and governments recover from natural disasters like earthquakes, hurricanes and more.

    “[The goal of the program is to] try to prevent natural disasters or limit their impact and also help people recover from them more quickly,” Jeremy Kirkendall, senior GIS administrator for the NASA Disasters Program, told GPS World in an exclusive interview at the 2019 Esri User Conference in San Diego. “We provide the products free to anyone to use, and data is only available if there is a good satellite pass.”

    When a natural disaster strikes, researchers at the NASA Disasters Program will take satellite imagery of the affected location and create a map to show what the area looks like from an aerial perspective. Authorities who request this information can then compare the disaster map with maps of what the area looked like before the disaster took place.

    “We do take requests from agencies or governments for disasters if they need help if data is available,” Kirkendall said. “We’ll create the products that show where the earthquake damage happened, where the fire burned or where the flooding is, and then users take that — combined with their local information — to determine what needs to be checked.”


    For example, the NASA Disasters Program was able to map out the magnitude 6.4 July 4 Southern California earthquake.

    “The earthquake that happened on July 4 caused a lot of deformation to the ground, so we mapped out that surface deformation and shared that information with other emergency managers, the Federal Emergency Management Agency, National Guard and U.S. Navy,” Kirkendall said. “You can look at things like roads, utilities, underground pipes for natural gas or geothermal wells, or fiberoptic cables. Then when you provide the product to these end users, they can overlay it with utility and infrastructure information to identify what’s the most at risk and what needs to be investigated.”

    Sometimes, when a natural disaster occurs over a longer period of time, data is mapped throughout the duration of the occurrence, as well. This can help with search-and-rescue missions, infrastructure repairs and post-disaster analysis.

    “We will create products during responses that can last a long time, like for Hurricane Florence or the flooding that recently happened in the Midwest,” Kirkendall said. “We’ll keep turning out flood products day after day when there’s good satellite passes that show that information.”

    Kirkendall added that the National Guard has used the live data, along with 911 calls, to find individuals trapped in flooded houses. The data also serves as a tool for post-disaster analysis to understand where damage occurred, ways to fix it and how to prevent it from happening again.

    “The program itself is gearing toward a resiliency effort, where we can provide these products when communities says, ‘We get flooded here all the time, over and over,’” Kirkendall said. “That’s where we need to be prepared to fix something. We need to do something to prevent that.”

  • OGC hosts disaster preparedness workshop

    The Open Geospatial Consortium (OGC) is hosting the second Disasters Concept Development Study Workshop July 24-25 at the NOAA Auditorium in Silver Spring, Maryland.

    Organized by OGC, the workshop is sponsored by the Department of Homeland Security, the Federal Geographic Data Committee, the U.S. Geological Survey (USGS) and other government agencies.

    The workshop is part of the OGC’s Disaster Concept Development Study, and will shape future activities to be led by OGC regarding disaster preparedness and response, and to inform development of potential disaster spatial data infrastructures (SDI).

    According to NOAA, in 2017 in the United States there were 16 major natural disasters with costs that exceeded 306 billion dollars, shattering previous annual records.

    The workshop asks whether more lives can be saved and damages reduced by providing better discovery and access to data that will improve mitigation, preparedness, response and recovery from disasters.

    The ability to effectively share, use and reuse geospatial information and applications across and between governments and non-government organizations in support of disaster response and resilience depends on having a spatial data infrastructure in place when disaster strikes.

    The OGC is bringing together key stakeholders in the natural hazards disaster communities to advance the emerging Disaster SDI by conducting a study and developing a set of pilots over the coming years. OGC’s Disasters Interoperability Concept Development Study (CDS) will assess the current state of data and product exchange technologies as used in disaster planning, response, and recovery. The information gained in the CDS will aid in developing a series of future pilots that will in turn advance the state of SDIs that support disaster risk reduction across the globe.

    For more information on the Disasters Concept Development Study, visit the website or email [email protected].

    For more information on the Disasters CDS Workshop, including the agenda and how to register, visit the event page on the OGC website. Registration for the workshop is free but mandatory.

  • Airbus Releases Satellite Imagery of Nepal Earthquake

    Following Nepal’s devastating magnitude 7.8 earthquake on Saturday, Airbus Defence and Space has acquired Pléiades satellites imagery to support the International Charter and Copernicus Emergency Management Service. The data acquired will assist in assessing the damage and help rescue organizations in the delivery of humanitarian aid.

    The before and after Pléiades images over Kathmandu (full image can be downloaded here) show the devastation caused by the earthquake. The below “before” Pléiades image was acquired on Nov. 29, 2014, and the “after” Pléiades image was acquired on April 27, 2015, two days after the earthquake.

    Kathmandu, viewed by Pléiades satellites, before and after the earthquake. (Image: Airbus Defence & Space)
    Kathmandu, viewed by Pléiades satellites, before and after the earthquake. (Image: Airbus Defence and Space)

    The Airbus Pléiades 1A and Pléiades 1B satellites operate as a constellation in the same orbit, phased 180 degrees apart. The identical twin satellites deliver high-resolution optical data products and can revisit any point on the globe, according to Airbus.

    UPDATE:

    Esri has created a Nepal Earthquake Swipe Map, which allows users to compare the pre- and post-earthquake images from Airbus Defence & Space to explore damage around Nepal. This map includes several bookmarks to help users navigate around key points of interest and landmarks that were damaged or destroyed.

    Esri-Nepal-Swipe-W

  • President’s 2016 Budget Proposes $1.2 Billion for USGS

    The U.S. president’s fiscal year 2016 budget request for the U.S. Geological Survey (USGS) is $1.2 billion, an increase of nearly $150 million above the FY 2015 enacted level. According to a statement from the USGS, the FY16 budget “reflects the vital role the USGS plays in advancing the president’s ongoing commitment to scientific discovery and innovation to support a robust economy, sustainable economic growth, natural resource management, and science-based decision-making for critical societal needs.”

    The budget request includes increases that ensure the USGS is at the leading edge of earth sciences research,” the statement continued. “It includes robust funding for science to inform land and resource management decisions, advance a landscape-level understanding of ecosystems, and develop new information and strategies to support communities in responding to climate change, historic drought, water quality issues, and natural hazards. The budget also funds science to support the nation’s energy strategy, to help identify critical mineral resources, and to address the impacts of energy and mineral development on the environment.”

    “The USGS has a strong 136-year legacy of providing reliable science to decision-makers,” said Suzette Kimball, acting USGS director. “This budget request recognizes our unique capabilities with multi-disciplinary earth science research and will allow the USGS to meet societal needs for our nation now and in the future.”

    Below are breakdowns of how the budget will address particular areas, according to the USGS.


    Meeting Water Challenges in the 21st Century

    The FY16 budget provides an increase of $14.5 million above the FY 2015 enacted level for science to support sustainable water management.  Meeting the nation’s water resource needs poses increasing challenges for resource managers, who must contend with changes in the frequency and magnitude of floods and droughts. As competition for water resources grows for activities such as farming, energy production, and community water supplies, so does the need for information and tools to aid decision-makers. The budget provides increased funding across several USGS mission areas to support resource managers in understanding and managing competing demands related to water availability and quality and to enable adaptive management of watersheds to support the resilience of the communities and ecosystems that depend on them. This includes a $3.2 million increase for science to understand and respond to drought, a $4 million increase for water use information and research, a $2.5 million increase to study ecological water flows, a $1.3 million increase for stream flow information, and a $1.0 million increase to advance the National Groundwater Monitoring Network.

    Powering Our Future and Supporting Sustainable Energy and Mineral Development 

    The 2016 USGS budget provides $9.6 million in program increases across the energy, minerals and environmental health portfolio for science to support the sustainable development of unconventional oil and gas resources, renewable energy sources such as geothermal, wind, and solar, critical minerals such as rare earth elements, and to address the environmental impacts of uranium mining.

    Specifically, the budget includes a program increase of $1 million for mineral resources science to continue life-cycle analysis for critical minerals such as rare earth elements and to develop new science and tools to reduce the impacts of minerals extraction, production, and recycling on the global environment and human health. A life-cycle analysis will trace the flow of critical minerals from generation and occurrence through the consequences of human activity to ultimate disposition and disposal. The nation faces key economic decisions within each stage of the resource life cycle.  Scientific understanding is an essential input to these decisions. The program change will support new workforce capability to address the main thrusts of the president’s four working groups in the Office of Science and Technology Policy that are currently focused on critical and strategic materials essential to national security, economic vitality, and environmental protection.

    Responding to Natural Hazards

    The budget provides an increase of more than $6.6 million above the FY 2015 enacted level for natural hazard science.  This includes an increase of $4.9 million to expand the Global Seismic Network used for worldwide earthquake monitoring, tsunami warning, and nuclear treaty verification monitoring and research in partnership with the Department of Energy and the Department of Defense. It also includes  a $1.7 million increase to support space weather (solar flare) geomagnetic monitoring. The increase will also support the installation and operation of rapid-deployable streamgages and expand the library of flood-inundation maps to help manage flood response activities.The proposed increase will also support landslide, wildfire, and sinkhole response capabilities as well as provide disaster scenario planning products for emergency managers. Included in the request is funding to build on investments to continue development of an earthquake early warning system, with the goal of implementing a limited public warning system for the U.S. west coast by 2018, as well as continued investments in volcano monitoring networks and science.

    Building a Landscape-Level Understanding of Our Resources

    The budget includes $15.6 million to expand, enhance, and initiate ecosystem science activities to increase the understanding of the nation’s landscapes and how they work. This includes budget increases of $6.7 million in support of critical landscapes. Specifically it provides a $4.2 million increase for the Arctic, a $1 million increase to study sagebrush landscapes that provide habitat for survival of greater sage-grouse, and a $1.5 million increase that supports science for Puget Sound, Columbia River, and the upper Mississippi River.

    USGS research will continue to support restoration of other priority ecosystems, such as Chesapeake Bay, Everglades, Great Lakes, California Bay Delta, and the Gulf Coast. The budget request also provides an increase of $2.2 million for research on invasive plants and animals that cause significant economic losses in the U.S. and transmit diseases to wildlife and people, and $1.6 million to study the decline of insects, birds, and mammals that pollinate agricultural and other plants. Finally, the budget increases funding by $5.1 million to support coastal resilience to hazards and adaptation to long-term change from sea-level rise and coastal erosion.

    Foundations for Land Management

    The president’s budget request includes an increase of $37.8 million to provide data and tools to help land and resource managers make informed decisions across the landscape and provide data and information to the public for use in a wide variety of applications. The budgets of USGS and NASA provide complementary funding to sustain the Landsat data stream, which is critical to understanding global landscapes. An increase of $24.3 million in the USGS budget supports the ground system portion of the Sustained Land Imaging Program, including funding for ground systems development for a Thermal Instrument Free Flyer, Landsat 9 (a rebuild of Landsat 8), and to receive data from internal partners. The increase also will enhance the accessibility and usability of data.  Specifically, the budget includes a $4 million increase for Landsat science products for climate and resource assessments.

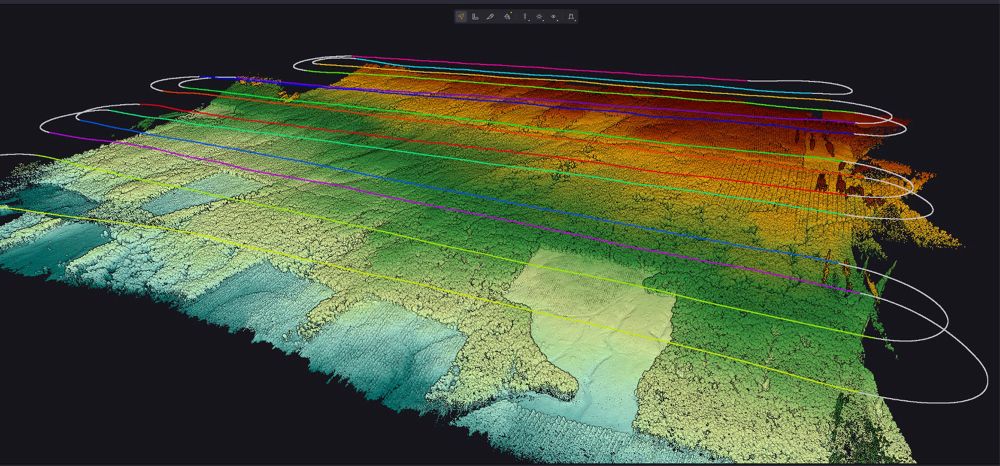
    The budget provides increases for other foundational data and tools needed to support landscape-level understanding.  For example, an increase of $3.7 million will expand three-dimensional elevation data collection using ifsar (interferometric synthetic aperture radar) for Alaska and lidar (light detection and ranging) elsewhere in the U.S. in response to growing needs for high-quality, high-resolution elevation data to improve aviation safety, to understand and mitigate the effects of coastal erosion, storms, and other hazards, and to support many other critical activities. A $1.8 million increase will enhance understanding of the benefits of the nation’s ecosystem services, and a $1.1 million increase for the Big Earth Data Initiative will make high-value data sets easier to discover, access and use. The accessibility and usability of these data are critical for land management, hazard mitigation, and building a landscape-level understanding of our resources.

    Supporting Community Resilience in the Face of a Changing Climate 

    The USGS plays an important role in conducting research and developing information and tools to support communities in understanding, preparing for, and responding to the impacts of global change. The budget includes an increase of $32 million above the FY 2015 enacted level for science to support climate resilience and adaptation. Climate change requires the nation to prepare for more intense drought, heatwaves, wildfire, flooding, and sea level rise. These challenges are already impacting infrastructure, food and water supplies, and physical safety in communities across the nation.

    Understanding potential impacts to communities, ecosystems, water, plant and animal species, and other resources is crucial to federal, state, tribal, local, and international partners as they develop adaptive and resilient strategies in response to climate change. The budget includes a $6.8 million increase in science for adaptation and resilience planning, an increase of $2.3 million for the USGS to provide interagency coordination of regional climate science activities across the nation, an increase of $8.7 million to support biological carbon sequestration, and an increase of $11 million for the USGS to support the community resilience toolkit, which is a web-based clearinghouse of data, tools, shared applications, and best practices for resource managers, decision-makers, and the public.

  • CoreLogic Natural Hazard Risk Summary Covers 2014 Disasters

    CoreLogic, a global property information, analytics and data-enabled services provider, has released its annual Natural Hazard Risk Summary and Analysis detailing the most significant natural disasters of 2014 and providing projections for 2015. The report provides a look at the year’s hurricanes, floods, hailstorms, tornados, wildfires, sinkholes, earthquakes, tropical cyclones and typhoon events in the U.S. as well as an international snapshot of the hazard events that imposed significant damage across the globe.

    Among key findings in the U.S., the CoreLogic 2014 Natural Hazard Risk Summary and Analysis notes:

    • Just as 2013 experienced a decline in the damage caused by major hazards in the U.S. when compared with 2012, this year experienced a continuation of similarly low overall damage totals. Not since 2012 when Superstorm Sandy devastated parts of the northeast coast has the U.S. experienced a single natural hazard event that has totaled in the tens of billions of dollars in damage.
    • The 2014 hurricane season marked the second consecutive year of low tropical storm and hurricane activity in the Atlantic Ocean. With only eight named North Atlantic storms, six formed into hurricanes and just two of the six developed into a major hurricane (defined as developing into a Category 3 or larger).
    • Reasons for the below-normal hurricane impact in 2013 and 2014 can be attributed to the continuing high levels of wind shear in the Atlantic that impede the development of tropical cyclones, along with more stable atmospheric conditions in the Atlantic which subdue the formation of clouds and thunderstorms necessary for the development of tropical cyclones.
    • The amount of flood-related losses that occurred in the first half of the year was dominated by flash flood events that caused a disproportionally large share of property loss in the flood category. Flash flooding was not limited to one region of the U.S, and many happened in large metropolitan areas such as Detroit, Long Island, N.Y., and Phoenix.
    • The amount of damage attributed to flooding in 2014 is approximately $4.2 billion in losses for the year, which is below the long-term historical average of $5.3 billion annually.
    • It is possible that the U.S. may still have two to three years of near-average flood-related damage before the next catastrophic loss occurs, based on projections from historic data. Analysis indicates that 2015 flood losses could total between $5-6 billion, with flash flooding events continuing to account for a large percentage of overall annual damage.
    • This year is on track to have the fewest number of tornadoes recorded in the past decade with just 720 tornados verified through August and an additional 128 storm reports filed through November.
    • Overall hail fall across the U.S. this year covered the greatest geographical area of any year since at least 2006. According to CoreLogic hail verification technology, 934,948 square miles, or 18.6 percent of the continental United States, were impacted by hail of 0.75 inches or greater
    • Looking ahead to 2015, if the number or geographical extent of storms producing larger, damaging hail returns to near or above recent norms, we will likely see a more severe hail season in 2015 and possibly higher insurance claims volume in comparison to 2013 and 2014.
    • This year has had the lowest amount of acreage lost to wildfire in the past 10 years. The number of fires in 2014 is slightly above the 2013 year-to-date total, but the amount of acreage lost to wildfire this year is only 85 percent of last year’s total.
    • Early drought forecasts for 2015 indicate the likelihood of a continuation of drought conditions in the west. The accumulation of higher levels of dry fuel mean that the elevated risk for wildfires seen over the past few years will continue.
    • Across the globe, the year 2014 is trending towards becoming the warmest year on record, with temperatures through the first 10 months of 2014 recorded as the warmest yet.

    For a copy of the 2014 CoreLogic Natural Hazard Risk Summary and Analysis, which includes maps, charts and images, visit this link.


  • CoreLogic Releases Natural Catastrophe Platform and Risk Models

    corelogic-australia-earthquake
    Historical earthquakes across Australia.

    CoreLogic, a  global property information, analytics and data-enabled services provider, has released a new version of its EQECAT natural catastrophe modeling platform, which contains three new proprietary risk models that quantify and analyze the potential financial impact of catastrophic natural hazards in peak exposure regions across the globe. The expansion of natural catastrophe risk analysis includes modeling for earthquake and tsunami events in Japan and earthquake events in Singapore, as well as for European windstorms, including a North European offshore wind farm risk model.

    EQECAT, which was acquired by CoreLogic in December 2013, first introduced its natural catastrophe risk modeling platform RQE (Risk Quantification & Engineering) in January 2013 that includes more than 180 natural hazard models for 96 countries and territories spanning six continents. Loss calculations simulate 300,000 years of losses to provide comprehensive and highly credible estimates of risk exposure to earthquakes, tropical cyclones and windstorms, severe convective storms, brushfires, winter storms and flooding.

    “This release of the RQE v15.0 platform not only advances the innovative and industry-leading science that is the hallmark of EQECAT risk models, but also demonstrates the commitment CoreLogic has to delivering timely enhancements and new platform features to our clients,” said Paul Little, head of EQECAT.

    The additional catastrophe risk modeling delivered through the new RQE v15.0 platform includes:

    • The European Windstorm Model, which introduces the ability to analyze offshore wind farm turbines that are rapidly expanding in Europe as a result of major investments in alternative energy. The “Eurowind” model extends over the North Sea, Irish Sea, Baltic Sea and Atlantic Ocean, and gives insight into loss caused by wind storms. In addition, the windstorm model includes two views of frequencies — the empirical model based on the historical record from 1960 to present, and the analytic model with a continuous 1200-year simulation of an Earth System Model (ESM) driven by climatic background conditions to characterize the frequency and severity of European windstorms. The European Windstorm Model also now incorporates Spain and Portugal, extending the existing coverage to 24 countries and provides analysis of extratropical cyclone risk. Expanded capabilities also include access to Global Climate Model research used to help determine the frequency and scale of European windstorms.
    • The Japan Earthquake Model, which provides the most current view of earthquake risk across the country based on December 2013 research released by the Japanese government and national research organizations. This model accounts for previously un-modeled very large magnitude events with updated seismic source zones and increased maximum magnitudes. New damage and loss data from the 2011 Great East Japan (Tōhoku-oki) earthquake prompted a complete review and update to model vulnerability functions, including major changes to performance -based effects of deep building foundations and base isolation. For the first time, CoreLogic introduces tsunami as a sub-peril, offering both a fully probabilistic and a scenario-based tsunami risk model, using 30-meter digital elevation maps for more granular and precise risk evaluations for a complete view of earthquake and tsunami risk across Japan.
    • The Singapore Earthquake Model, which accounts for the increased probability of a near-term large-magnitude earthquake on the Sunda (Java) megathrust fault. This fault zone is one of the most active on Earth and largely influences earthquake risk in Singapore. This new model accounts for seismic risk factors specific to Singapore, such as soft soils that amplify intermediate-period ground motions from distant large earthquakes and the existence of reinforced concrete high-rise buildings.

    “Combining more than 30 years of collected data from CoreLogic with EQECAT natural catastrophe models allows us to deliver a more comprehensive, highly credible analysis of key drivers of hazard risk at various levels of exposure around the globe, from across regional borders to individual site levels,” said Mahmoud Khater, chief science officer for catastrophe modeling.

    The updated EQECAT RQE v15.0 platform also offers significant enhancements to user interface, reporting options and workflow management tools. Enhancements include a more comprehensive view of exposure data with expanded filter options, event-specific hazard intensity reports for individual locations, and analysis of annual exceedance probability refined by region and sub-peril to show drivers of portfolio losses, among other capabilities.

  • AT&T Ready For Hurricane Season as Part of Disaster Recovery Program

    AT&T’s Network Disaster Recovery (NDR) program, as the first private company certified by the Department of Homeland Security for private-company voluntary disaster preparedness, is committed to maintaining and restoring the AT&T global network when natural disasters strike, the company said.

    Despite predictions, no one is certain when the next tropical storm or hurricane will ravage the coastline. With $600 million invested in the NDR program, AT&T’s arsenal of equipment includes more than 320 technology and equipment trailers that can be quickly deployed, making it one of the nation’s largest and most advanced disaster programs.

    “Staying connected during severe weather events is critically important to consumers, businesses and our emergency management officials,” said Sonia Perez, president, AT&T Louisiana. “That’s why AT&T invests a tremendous amount of resources in our network reliability and disaster response capabilities.”

    The Network Disaster Recovery team works closely with other AT&T response teams, local AT&T network personnel, regional Emergency Operations Centers and Local Response Centers to fortify network facilities and equipment, and stage technicians and resources near the storm impact area. In the event of damage, teams are poised to restore and maintain service until permanent repairs can be made.

    AT&T also conducts readiness drills and simulations throughout the year to ensure its networks are prepared and its personnel are ready to respond at a moment’s notice. Since its inception in 1991, the NDR has responded to more than 20 catastrophes across the U.S.

    Response equipment readied in the wake of an event includes:

    • Mobile cell sites and mobile command centers
    • Emergency communications vehicles
    • A self-sufficient base camp, complete with sleeping tents, bathrooms, kitchen, laundry facilities, on-site nurse and meals ready to eat (MREs)
    • Hazmat equipment and supplies
    • Technology and support trailers to provide infrastructure support and mobile heating ventilation and air conditioning
    • Internal and external resources for initial assessment and recovery efforts.

    Consumers and businesses also should have a plan in place. When preparing for an evacuation or shelter-in-place, remember these tips:

    • Keep your wireless phone batteries charged at all times. In case of a power outage, have alternate means of charging your phone available, such as an extra battery, car charger or device-charging accessory. Sales tax holidays are a great time to stock up on cell phone accessories for your household.
    • Keep your wireless phone dry. The biggest threat to your device during a hurricane is water, so keep your equipment safe from the elements by storing it in a baggie or some other type of protective covering, such as an Otterbox phone cover.
    • Have a family communication plan in place. Designate someone out of the area as a central contact, and make certain that all family members know who to contact if they get separated. Most importantly, practice your emergency plan in advance.
    • Forward your home number to your wireless number in the event of an evacuation. Because call forwarding is based out of the telephone central office, you will get incoming calls from your landline phone even if your local telephone service is disrupted at your home. In the unlikely event that the central office is not operational, services such as Voicemail, Call Forwarding, Remote Access call forwarding and call forwarding busy line/don’t answer may be useful.
    • Track the storm and access weather information on your wireless device. Many homes lose power during severe weather. If you have a working wireless device that provides access to the Internet, you can watch weather reports through services like AT&T U-verse Live TV or keep updated with local radar and severe weather alerts through My-Cast Weather, if you subscribe to those services.
    • Take advantage of location-based mapping technology. Services such as AT&T Navigator and AT&T FamilyMap can help you seek evacuation routes or avoid traffic congestion from downed trees or power lines, as well as track a family member’s wireless device in case you get separated.

    Keeping the lines open for emergencies

    During evacuations, the storm event and its aftermath, network resources will be taxed. To help ensure that emergency personnel have open lines, keep these tips in mind:

    • Text messaging. During an emergency situation, text messages may go through more quickly than voice calls because they require fewer network resources. All of AT&T’s wireless devices are text messaging capable. Depending on your text or data plan, additional charges may apply.
    • Be prepared for high call volume. During an emergency, many people are trying to use their phones at the same time. The increased calling volume may create network congestion, leading to “fast busy” signals on your wireless phone or a slow dial tone on your landline phone. If this happens, hang up, wait several seconds and then try the call again. This allows your original call data to clear the network before you try again.
    • Keep non-emergency calls to a minimum, and limit your calls to the most important ones. If there is severe weather, chances are many people will be attempting to place calls to loved ones, friends and business associates.

    Small Business Tips:

    • Set up a call-forwarding service to a predetermined backup location. Set up a single or multiple hotline number(s) for employees, employees’ families, customers and partners, as appropriate, to call so that all parties know about the business situation and emergency plan.
    • Back up data to the Cloud. Routinely back up files to an off-site location. Services such as Mobile Workplace are a suggested solution for small businesses.
    • Outline detailed plans for evacuation and shelter-in-place plans. Practice these plans (employee training, etc.). Establish a backup location for your business and meeting place for all employees.
    • Assemble a crisis-management team and coordinate efforts with neighboring businesses and building management. Be aware that disasters affecting your suppliers also affect your business. Outline a plan for supply chain continuity for business essentials.
    • Consider a back-up cellular network. Services like AT&T Remote Mobility Zone, allows organizations to protect their critical communications by installing small cell sites at the businesses’ locations. If a disaster disables primary communications networks, the back-up cellular network can help keep your company connected.

    Additional information and tips for disaster preparedness can be found at www.att.com/vitalconnections.