Trimble introduced today the Trimble Geo 5 and Juno 5 handheld GNSS devices, further extending Trimble’s portfolio for data collection, maintenance and inspection applications. The Geo 5 and Juno 5 series are both optimized for GIS field workflows, including Trimble’s TerraSync field software available on all Trimble GIS platforms.
Since 1994, the Trimble GeoExplorer line of GNSS handhelds has been used for professional GIS data-collection applications. While the GeoExplorer 6000 series is the most capable Trimble handheld for GIS data collection, not all customers require the larger screen and innovative Floodlight technology of the 6000 series. The Geo 5 provides the essential functions for all day, submeter productivity in a smaller package, Trimble said.
The Trimble Juno product line is used worldwide for maintenance, inspections and asset management applications. With the addition of the Juno 5 series, Trimble is providing a rugged handheld that delivers the capabilities and convenience of a smartphone, Trimble said. The Juno 5’s slim, ergonomic design is thinner and lighter than other rugged computing products in its class today and provides a more advanced feature set than the Juno 3 series.
“Whether users are engaged in initial data-collection tasks or inspection of assets, it is critical they have a complete solution they trust,” said Daniel Wallace, general manager of Trimble’s GIS Data Collection Division. “Now with two platforms in both the Geo and Juno families, customers can confidently choose a handheld that best fits their needs. Trimble TerraSync software is the unifying workflow that brings these choices together, so customers can always trust the quality of their data throughout the complete lifecycle of a field management project.”
Complete with wireless communications options, integrated cameras and bright, sunlight-readable screens, both devices are built for work in the field and rugged enough to withstand shock, vibration, water and dust.
Esri, PCI Geomatics, MDA, and RapidEye announced their new Natural Resources Imagery Grant Program. The grant program will provide software, data, and training for detecting and analyzing land-cover change through the combined use of geographic information system (GIS), image processing, and remote-sensing technologies.
According to the announcement, the program is designed to foster innovative approaches that solve natural resources management problems, the Natural Resources Imagery Grant Program will provide 20 grants valued at $100,000 each. The grant includes the following:
Esri GIS software and training
PCI Geomatics imagery processing and analysis software and training
“GIS and image processing are mission-critical technologies in natural resources management,” said Jack Dangermond, president, Esri. “This grant opportunity will help organizations expand their existing imagery or GIS infrastructure and more efficiently support sustainable land-use management.”
Companies, educational institutions, nongovernmental organizations (NGOs), state and regional governments, or tribal governments within the United States may apply. Eligible projects are those that focus on remotely sensed imagery beyond the visible spectrum. Preferred projects will also demonstrate increased efficiency, productivity, or accuracy.
“Technology leaders and innovators should be presented with opportunities to advance their resources projects,” said Terry Maloney, president and CEO, PCI Geomatics. “This imagery grant program will bring solutions to the natural resources industries through inventive and operational use of satellite imagery.”
Applications for the Natural Resources Imagery Grant Program will be accepted beginning in September 2012 and ending November 16, 2012. Learn more at esri.com/imagerygrant.
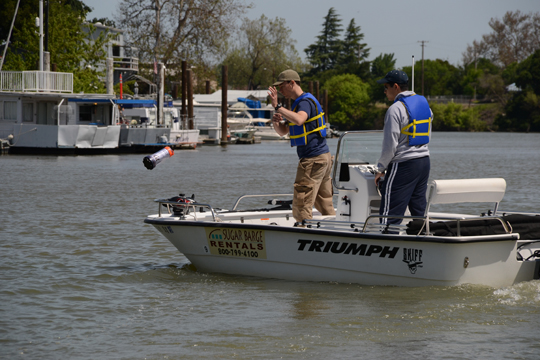
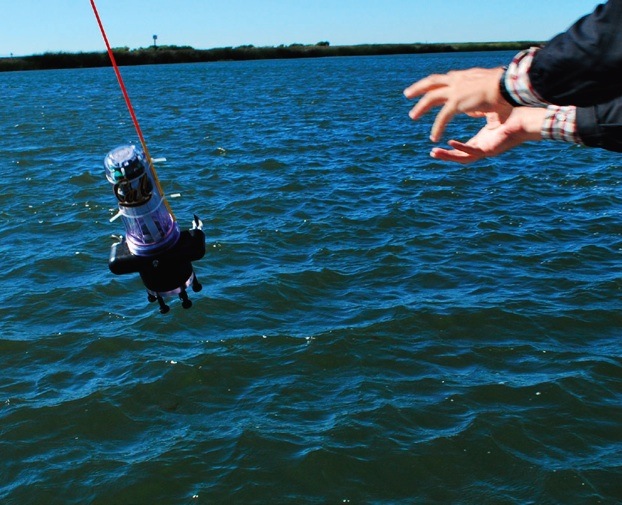
UC Berkeley researchers have developed a method to provide real-time, high-resolution data in hard-to-map waterways, using GPS. Tossing a robot is Andrew Tinka, with Kevin Weekly. (Photo courtesy of Jérôme Thai.)
By Tracy Cozzens
A fleet of 100 robots equipped with GPS and sensors were released May 9 into California rivers to measure water flow, salinty levels, and pollution. The Floating Sensor Network is a project by the University of California, Berkeley, to improve the way water quality and flows are monitored.
About two-thirds of California’s fresh water is in the Sacramento-San Joaquin river system where the test took place. This water supplies about two-thirds of the state’s population with drinking water and irrigation. The initiative is led by associate professor Alexandre Bayen at the Center for Informatin Technology Research in the Interest of Society (CITRIS).
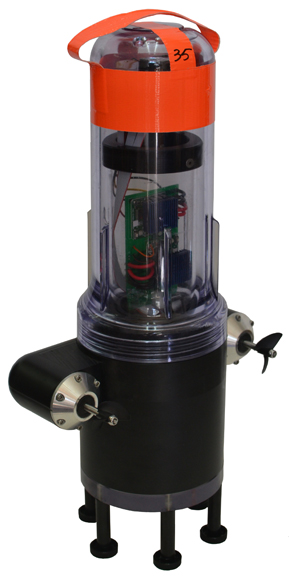
The robots each have a sensor to test salinity and a GPS unit from a smartphone. Some have propellers so they can maneuver around obstacles and reach specific destinations. The robots also sent Tweets to @fsnandroid61.
The robots drifted through the area of the river being measured, then were retrieved by boat. “One advantage of our real-time communication system is that we can see where all our sensors are on a map, which makes it very easy to chase them down and retrieve them,” said graduate student researcher Andrew Tinka.
With the first test completed, the team’s efforts over the summer have two priorities, Tinka explained. “First, we’re using the flow data that we gathered on May 9 to understand how this ‘mobile’ data can be best used for river hydrodynamics studies. We’re learning how to turn the individual traces of water that each sensor gives us into a big-picture view of the entire river region, sort of how like meteorologists take the data from a few weather stations and turn it into an overall view of what the weather is doing over a large area. Second, we’re working with other hydrodynamics research groups to expand the use of this kind of mobile sensor. We’re loaning our equipment to other groups, doing pilot projects with others, and basically trying to get these sensors into researchers’ toolboxes throughout the water community.”
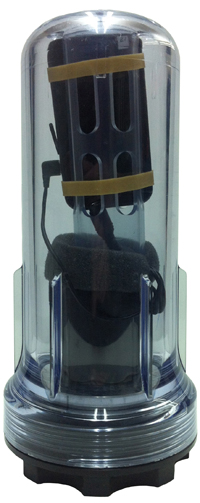
There are two types of devices in the fleet, active and passive. The active sensors have a twin-propeller drive system that lets them move through the water to avoid obstacles or stay in the correct region of the river. “We developed the internal electronics for this device ourselves,” Tinka said. “We integrated a Magellan AC12 GPS receiver along with a Gumstix embedded computer and a Motorola GSM module. Our passive sensors don’t have a propulsion system; they do exactly what the water does. We developed this system with a focus on cost and ease of assembly.” The team used a waterproof consumer smartphone, the Motorola Defy, for the GPS positioning, computation, and comunications.
So far, the test has proven the usefulness of such a network. The devices were developed to be easily deployable, especially where a lot of flexibility is needed, such as in disaster response. “The ability to quickly and easily put these sensors into new inland environments, by just about any method (throw them from a boat, drop them from a helicopter, toss them from a dock or a bridge) makes them a really useful new tool,” Tinka said.
photos courtesy of Jonathan Beardphotos courtesy of Jonathan Beard
A hundred robots, 40 with propellers, were released into the Sacramento River near Walnut Grove (photos courtesy of Jonathan Beard).
UC Berkeley researchers have developed a method to learn about the quality, volume, speed, and direction of the flow of salt walter and freshwater through the Sacramento Delta. (Photo courtesy of : University of California, Berkeley.)
Swarms of robots equipped with GPS and sensors were released May 9 into California rivers to measure water flow, salinty levels, and pollution, reports OurAmazingPlanet.com. The Floating Sensor Network is intended to change the way water quality and flows are monitored in the Sacramento-San Joaquin river system.
At the University of California, Berkeley, a group of 100 robots was released into the Sacramento River near Walnut Grove. About two thirds of California’s fresh water is in the river system, supplying about two-thirds of the state’s population with drinking water and irrigation. The initiative is led by associate professor Alexandre Bayen at the Center for Informatin Technology Research in the Interest of Society (CITRIS).
The robots each have a sensor to test salinity and a GPS unit from a smartphone. Some have propellers so they can maneuver around obstacles and reach specific destinations. The robots are also sending Tweets, to @fsnandroid61.
Watch Electrical Engineering Graduate Student, Andrew Tinka, describe the project:
F4Devices, a subsidiary of F4 Tech and strategic partner with BAP Precisions, Taiwan, has introduced a new generation of high-precision GNSS devices for GIS field applications, the Flint rugged handheld. With the new Flint handheld, field workers requiring a rugged mobile handheld device have a unit that is lightweight, compact, rugged, and cost-effective, the company said. The Flint fits well into GIS field data collection markets such as municipalities, oil and gas and forestry, F4Devices said.
The Flint handheld offers a unique, one-of-a-kind combination of flexible GPS configurations, ranging from 1 to 3 meters to sub-meter accuracies, while supporting geotagging with the 5 megapixel autofocus camera as well as Wi-Fi, Bluetooth, and 3G data. There are two versions to choose from, the S812H (includes GPS, Bluetooth, Wi-Fi and 5 MP camera) and the S852H (includes GPS, Bluetooth, Wi-Fi, 5 MP camera and 3G data).
“The new Flint handheld impresses, from the first moment you see it. The ruggedness of the device, IP65, in this small of a package while achieving the GPS accuracies we have been able to achieve is something to acknowledge as a leader in its class,” said Brian Holley, director of Distribution for F4Devices. “Add in its high-resolution, sunlight-readable VGA screen, extendable data storage and Microsoft Office Mobile standard on all units, this makes it even more impressive.”
The Flint handheld is specifically designed for field professionals looking for a rugged, dependable feature-rich device, said F4Devices. The camera button is located as if the user was holding a camera. Combined with the GPS, it provides a powerful solution for precise geotagging. In tough environments, whether it is extreme weather or high multi-path, the Flint handheld is up to the challenge, the company said.
The F4Devices Flint is shock-proof, dust-proof, and waterproof. The battery supports the field users’ needs with at least 10 hours of performance.
F4Devices, along with BAP Precisions, is focused on supporting solutions providers by working with them directly to integrate their applications with the Flint handheld. Any feature or application in the Flint handheld is accessible to software engineers for full and complete integration, allowing a fully developed solution to be offered to their clients, the company said. API’s are available for solutions providers to access and communicate with the features they require.
The 3G data modem in the Flint handheld allows field users to stay in touch remotely, increasing productivity. This also allows real-time communications with the office for critical information upload. This also provides a level of safety for field users by easily staying in touch with supervisors or persons in charge.
The Earth’s surface is constantly shifting, being deformed as earthquake faults accumulate strain, and slip or slowly creep over time. Not long ago, scientists relied solely on seismometers to monitor the earth’s movements. Today, GPS has taken prominence as an indispensible tool.
PANGA, the monitoring network covering the Pacific Northwest, uses GPS to monitor this movement by measuring the precise position (within 5 millimeters or less) of stations near active faults relative to each other. By determining how the stations have moved, ground deformation can be determined.
If the plates near the coast or the Cascade Mountains move even a few centimeters, the scientists at PANGA know within seconds. The network is still being built, but eventually it’s expected that PANGA will be able to sense earthquakes faster and more accurately than traditional seismometers, and issue alerts to warn citizens of impending activity.
“GPS is helpful in distinguishing magnitude 8 from M9 earthquakes quickly,” explained Rex Flake, PANGA. “By design, seismometers only record high-frequency energy that becomes saturated during strong ground motion. Moreover, seismic data ‘clip’ at high magnitudes whereas GPS become more accurate. Seismographs are mainly intended to detect very small to moderately large earthquakes. GPS gives actual ground motions that in theory could be incorporated very quickly into tsunami models and warning systems. That is one of the things we are working on now.”
Volcano Watch. “A more speculative application is that some (not all by any measure) large earthquakes are preceded by slow creep events,” said Andrew Miner, PANGA. “While not really good enough to predict an earthquake, I think if we saw a very large transient creep event it would at least ring alarm bells. Unfortunately though, earthquakes are by their nature just not very predictable, at least to the level of a day or week that people could reasonably act on. On the bright side, volcanoes are reasonably predictable, and GPS is also an important tool in monitoring them. We work with the Cascade Volcano Observatory on several monitoring projects.”
PANGA is one of a series of earthquake monitoring networks stretching along the West Coast. The Pacific Northwest Geodetic Array is run by the PANGA Geodesy Laboratory at Central Washington University (CWU) in Ellensburg, and includes 300 continuously operating, high-precision GPS receivers located throughout the Pacific Northwest. Sixty more stations are expected to be installed this year. Trimble, Leica, Topcon, and Javad are the main receivers used in the region.
Data from these receivers is continuously downloaded, analyzed, archived, and disseminated. About one third of PANGA’s GPS stations are telemetered in real-time back to CWU, where the data are processed using NASA’s Jet Propulsion Laboratory’s GIPSY/OASIS II software for high-precision data analysis, and Trimble’s RTKNet Integrity Manager software for real-time analysis. The data provide relative positioning of several millimeters across the Cascadia subduction zone and its metropolitan regions. These real-time data are used to monitor and mitigate natural hazards arising from earthquakes, volcanic eruptions, landslides, and coastal sea-level hazards.
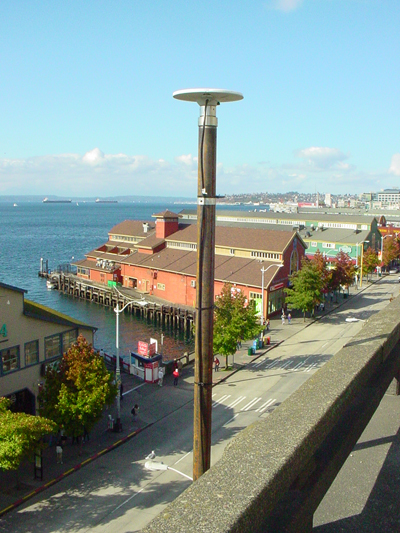
Sagging Bridges. The data are also used to monitor man-made structures such as Seattle’s sagging Alaska Way Viaduct, the State Route 520 and Interstate 90 floating bridges, and dams throughout the Cascadia subduction zone, including those along the Columbia River. For instance, for the S.R. 520 bridge, PANGA teamed up with Washington State Department of Transportation (WSDOT) to monitor movement of the 520 bridges during wind storms and seismic events.
The receivers continuously monitor and record structural deformation with about a millimeter precision. Raw GNSS satellite phase and pseudorange estimates are acquired and processed continuously into receiver positions estimated every 5 seconds and delivered with 10 and 30-second latencies. Daily-averaged receiver positions computed with predicted and post-processed satellite orbit and clock corrections are provided with 1-6 day latencies.
Seattle’s aging Alaska Way viaduct is one of several major man-made structures being monitored by PANGA’s GPS Network. (photos courtesty of CWU Geodesy Lab.)
Tremor Slips. The Northwest is at the forefront of earthquake-related GPS research, in large part because the area provides a lot to learn from GPS monitoring, Flake said. “For example, when we started it was strongly suspected but not definitely known that the Cascadia subduction zone was locked over parts of its surface and a major earthquake threat. Thanks to GPS monitoring we now have a pretty good idea not only exactly where it is locked, but also when parts of it do slip or creep.
“One important discovery made with GPS data, along this line, was that of the Episodic Tremor Slip (ETS) events that occur here in the Northwest U.S.,” Flake said. “Since the time duration of ETS motion takes place on the scale of days to weeks, these earthquake events were unrealized by traditional seismic detection methods.”
GPS data shed light on this peculiarly predictable earthquake phenomenon. “With these GPS data we can measure strain accumulation within the continental crust (where people live) and calculate the residual that can be expected to rebound in a large subduction zone earthquake,” Flake said.
“Even more detailed than that, we can use GPS data from past ETS events to constrain the locked zone of the subducting crustal plate by inferring the amount of slip at depth that best reproduces the observed GPS recordings — important in determining possible magnitude and location of the megathrust earthquakes (Mw = 8 to 9) that will someday occur. This is of obvious concern to society and is a major reason that we lead the geodetic applications of GPS research.”
Data Online. PANGA maintains a website that integrates daily GPS measurements from about 1,500 stations along the Pacific/North American plate boundary, ranging from Alaska to the U.S-Mexico border. Cleaned, network solutions from several arrays are merged and grouped into regional clusters.
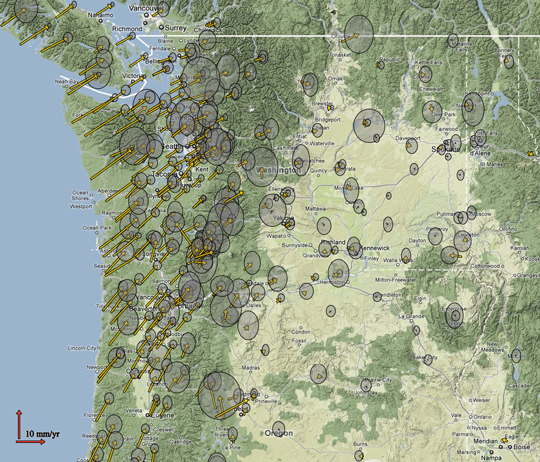
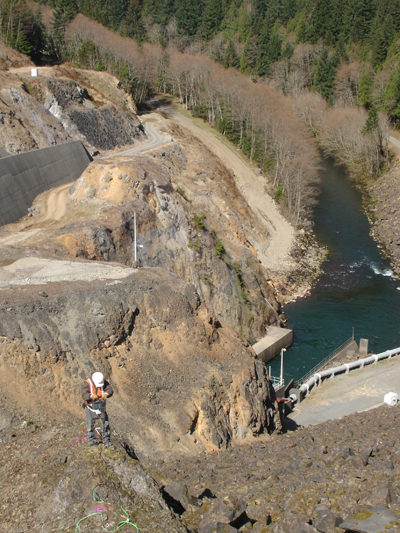
Arrow on a Velocity Field Map of Oregon and Washington represent ground motion as measured by GPS at each particular location. The grey circles are 2 sigma error ellipses (click to enlarge.) (photos courtesty of CWU Geodesy Lab.)The PANGA team constructs a bedrock drill-brace geodetic monument at Howard Hanson Dam east of Auburn, Washington. (photos courtesty of CWU Geodesy Lab.)
By Jürgen Rossmann, Petra Krahwinkler, and Markus Emde
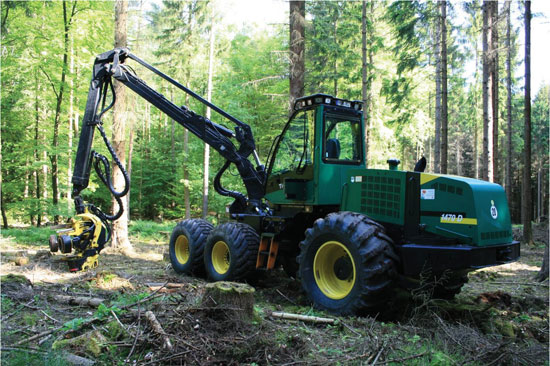
Modern machines such as wood harvesters can automatically cut trees and remove branches, but an expert is still needed to plan a thinning and to mark the trees to be felled. The process can be accelerated if the forest ranger can virtually mark trees to be cut, using geographic coordinates instead of colored crosses sprayed on the stems. This requires the robotic wood harvester to be able to locate itself accurately to enable automatic navigation to the next tree for cutting.
Absorption of the GPS signal in the forest canopy leads to poor results, however, with errors up to 50 meters and more. Furthermore, the canopy may cause interruptions and signal loss for several seconds. The performance can be even worse on a moving vehicle, where the signal may even get lost until the vehicle reaches an open area or stops.
Other approaches use differential GPS (DGPS) sensors as their main source of position information. However, our experiments using a high-precision DGPS sensor showed that its accuracy is not even close to sufficient for navigating to a single tree. As the DGPS suffers from the same canopy-related disturbances and shielding, it cannot benefit from its theoretical advantages. In pratice, the DGPS system did not update its position at all when signal reception became too weak.
A different approach was needed. We found it in the framework of the Virtual Forest, more precisely in the semantic modelling of forests, where techniques are being developed to delineate single trees from remote sensing data, such as airborne laser scanner data. Along with the trees and their geo-coordinates, the height and the diameter at breast-height are determined. This data can be used to generate a tree map, which can be used for navigation. The map has a mean error between 0.5 and 1.5 meters, which is still below the mean tree distance of about 2.5 meters.
Visual GPS. The idea of Visual GPS is to bring current developments in the field of robotics into the forest and combine them with information on forest inventory so that the result outperforms other navigation approaches. A matching algorithm is run based on a tree map, generated from remote sensing data, and the tree group, which was detected by one or more laser scanners.
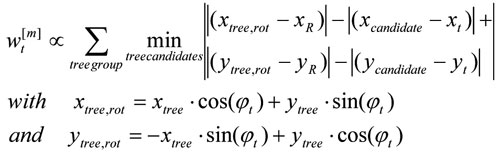
We then implemented a particle filter algorithm, as it enables considering different kinds of distributions. Particles are also called random state samples, and each particle is a hypothesis as to what the true world state might be.
In the initialization, particles are distributed uniformly. An importance weight wt is calculated for each particle, incorporating the measurements as described below. A sampling step rejects particles with a low importance weight and replaces them with new particles, which are distributed according to the previous map. This process is repeated until the particle distribution concentrates at one point, and the particle with the highest weight is returned as the result (see Figure 1).
Figure 1. Particle concentration after resampling; wood harvester at center.
A single tree as a landmark cannot be associated with its corresponding tree in the map. However, patterns of tree positions can be matched. We chose a square area to guarantee even particle distribution and short calculation time. Each particle represents a hypothesis for the position of the vehicle and is tested for its probability to represent that position.
To make the approach more robust against faulty tree maps, we implemented a rotation variant approach, determining vehicle heading along with its position. This enhanced the probability measure used in the propagation step. Instead of embracing only the distances of the trees to the reference point, their relative position is used, considering the heading wt of the current particle:
This approach directly calculates vehicle heading, but the sensitivity towards rotation, which results from the new probability measure, leads to a higher number of particles that must be used during the initialization step.
Global Search. Experiments on a test area with about 22,700 trees proved that the algorithm worked reliably for tree groups containing 20 or more trees, and for position errors of the magnitude of the mean tree distance. Similar tree groups could not be found within the forest. However, the calculation time was too long to be used for navigation.
Local Search. To overcome the high calculation time, we reduced the number of particles. The initial position is estimated with an ordinary GPS sensor. Although the GPS measurement is faulty in the forest, it can limit the search to a restricted area. Machines most often start at the edge of a forest stand, at a forest road, or a canopy opening. At these spots the canopy usually is transparent, and GPS sensors work with higher precision. Therefore, they provide a good initialization for the algorithm.
Robotic wood harvester.
In the following steps, the previous position can be used instead of the output of the GPS sensor for determining the search area. The previous position provides a better initial pose estimation than the GPS sensor and therefore gives the opportunity to further decrease the search area.
To reduce the number of trees for which the distance has to be calculated, trees with a distance from the initial pose estimation smaller than the sum of the estimation of the maximal position error and the maximal distance of the trees in the scanned tree group from the reference position are extracted from the tree map.
Another way to reduce the search area is to estimate vehicle orientation. This is difficult for machines such as wood harvester, which moves slowly and stops frequently when cutting trees. Therefore, small lateral position differences result in large orientation deviances, as the difference vector does not directly point into the direction of the movement any more. Another approach is to use sensor fusion and mount a compass onto the vehicle. During particle initialization, the angle can be restricted to the domain of uncertainty around the compass orientation. However, mounting a compass onto a wood harvester proved to be a serious problem, as the harvester’s massive metal body disturbs the compass measurement.
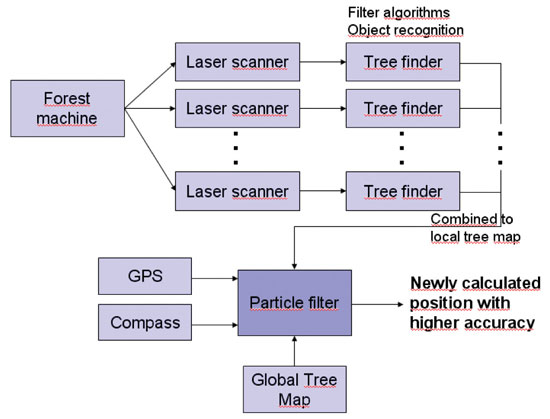
Figure 2 shows the workflow of the complete system.
Figure 2. Navigation system components.
Results
The simple criterion presented here proved to be reliable in the vast majority of cases. Problems can occur when the tree group contains trees that are not part of the tree map (false positive). This can happen due to missing trees in the tree map or faulty tree cognition in the local laser scanner measurement. In the first case, the understory might not have been detected in the airborne laser scanner data. In the second case, other objects like the harvester’s aggregate might have been mistaken for a tree.
The case of trees not detected in the local laser scanner measurements but contained in the tree map (false negative) does not create problems in the pose estimation step. The algorithm searches for a corresponding tree for each unit in the tree group. For a false positive, no corresponding tree can be found, whereas a false negative is simply not considered. However, if the size of the tree group is too small, the estimation errors grow. The minimum number of trees depends on the search area radius. A size of 20 trees proved to generate reliable pose estimations even during the global search. Dropping below 15 trees, the number of faulty position increases rapidly as more similar patterns can be found.
Single faulty positions can be filtered with respect to the movement constraints of a harvester. The velocity is very low, and the orientation cannot jump. In the experiments, cycle times of about 0.5 seconds were reached on a standard PC. As forest machines do not demand very short calculation time, the algorithm proved to run fast enough to allow identification of single felled trees onboard real machines. One application of the algorithm was to support a navigation assistant to the next tree, similar to navigation systems in cars.
To evaluate system accuracy on a real wood harvester, a surveyor’s office was instructed to measure the vehicle’s position at seven distinct locations. At each position, the sensor input data was written to file for several seconds. This data was evaluated, and for each location more than 45 pose estimations were calculated. The mean value of the position error amounted to approximately 0.55 meters.
Future Work
Reliability can be enhanced by using a detailed digital ground model and the cabin tilt in order to detect the area where the laser beams hit the ground, and therefore avoid the detection of false positives. Similarly, the position of the aggregate, which can be measured by integrating sensors in the hydraulic cylinders of the crane, can be cut from the laser scanner measurements and ignored during tree detection, further reducing the amount of false positives in the tree group. With the integration of an outlier rejection step for false positives in the detected tree groups that ignores trees for which no corresponding candidate tree can be found, a more accurate importance factor can be calculated.
Another task is the integration of the algorithm with a Kalman filter to allow real-time performance of the algorithm. Therefore, the Kalman filter is initialized with the pose estimation of the particle filter algorithm, which is also used for continuous checks of the current position estimate, thereby combining two algorithms with different advantages. The Kalman filter allows real-time execution and therefore speeds up the overall navigation algorithm. The particle filter algorithm can periodically check the position estimated by the Kalman filter and correct it. Furthermore, it provides a strong method to cope with two main problems in mobile robotics: the data association problem and the kidnapped robot problem.
Simultaneously, a mapping and map-correction algorithm could be integrated into the system so that understory trees, which cannot be detected using remote sensing data, and deciduous trees, which are more difficult to delineate in airborne laser scanner data, can be added to the tree map.
Jürgen Rossmann is head of the Institute of Man-Machine Interaction at the RWTH Aachen University, where Petra Krahwinkler and Markus Emde are research scientists.
At this moment, National Aeronautics and Space Administration (NASA) satellites outfitted with advanced sensors are gathering masses of data about phenomena that affect all of us: rainfall patterns, solar irradiation, and tropical deforestation, to name a few. Even great volumes of data, however, aren’t worth much unless they inform decision making. That’s why NASA’s Applied Sciences Program seeks to integrate Earth science research findings into decision support systems serving “applications of national priority,” and to document the resulting improvements in the performance of those systems.
To complete its ambitious decision support goals, the agency enlists some outside help. In February, the NASA Science Mission Directorate issued a request for proposals (RFP) entitled Research Opportunities in Space and Earth Sciences — 2007 (ROSES-2007). Academic, private, federal, public, and nonprofit organizations are invited to apply, and the program encourages applications from teams that comprise multiple organizational sectors and types of expertise.
In particular, said Lawrence Friedl of the Applied Sciences Program, the program is “hoping to build more private-sector involvement.” He explained that it’s a low-risk opportunity for companies with limited geospatial experience to learn “how other Earth observation data can be blended with datasets the private sector is already familiar with [such as high-resolution imagery]. It’s a way to get different parts of the community talking to each other . . . making connections, trying out unfamiliar technologies.” Ultimately, that cross-pollination effort will result in the development of new products and services.
NASA also teams with other federal agencies for benchmarking purposes, encouraging its partners to run their decision support processes without and with Earth observation data, quantifying benefits of the addition. In the case of homeland security, partner agencies include the Department of Defense (DoD), the National Oceanic and Atmospheric Administration (NOAA), and the Federal Emergency Management Agency. According to Friedl, limited staff forced a focus on the civil sector when the project began, but “over the past year, we have been increasing our interaction with the DoD side and intelligence communities.”
Homeland security is one of the 12 “applications of national priority” identified by NASA; the list also includes public health, disaster management, air quality, and energy management. NASA sensors contribute to homeland security by monitoring water supplies and checking for airborne toxins. Friedl gave the example of dispersion modeling, which enables the Department of Homeland Security to predict patterns of air movement in a particular city, as well as the downwind effects after a contamination incident.
Interested organizations should note that full proposals are due May 25, 2007, and project selection announcements are planned for September. Successful proposals will be awarded grants of approximately $240,000 to $320,000 per year for three years, beginning in 2008. This is the fourth such RFP in recent years, said Friedl, and the solicitation process is slated to continue on an annual basis.