My last column, December 2019, highlighted the National Geodetic Survey’s (NGS) new Geoid Monitoring Service (GeMS); and, that NGS’ will be publishing a gridded geoid model GEOID2022 that will contain two components: (1) Static Geoid model of 2022 (SGEOID2022) and (2) Dynamic Geoid model of 2022 (DGEOID2022). That’s what going to happen in 2022, but what about today? Since GEOID18 has been officially released for public use, it’s time to look at differences between the Geoid18 published value and estimated geoid values computed using information from NGS’ datasheet. This column will provide an analysis of the differences between the latest published hybrid Geoid18 values provided on NGS’ Datasheet and the computed geoid height value using the published NAD 83 (2011) ellipsoid height and NAVD 88 orthometric height. This is what a user will see if they computed differences using NGS’ datasheets published values. The question will always be asked, why is there a difference between the published Geoid18 value and the computed geoid value. This column will explain some reasons for the differences.
It’s mostly good news but there are some issues that should be highlighted. This column will highlight issues on differences due to published heights that have changed since the database pull for Geoid18.
First, it should be noted that NGS’ hybrid geoid models are different than NGS’ experimental gravimetric geoid models. My December 2018 column explains these differences.
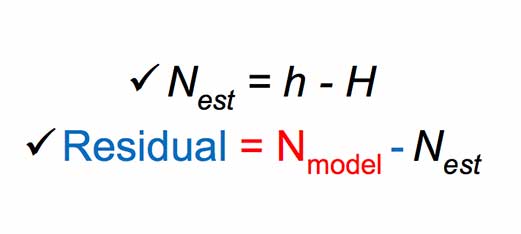
I would like to emphasize that, in my opinion, hybrid geoid models should be denoted as transformation models. Saying that, hybrid geoid models are related to “real” geoid models. Hybrid geoid model GEOID18 was computed based on NGS’ gravimetric geoid model xGeoid19b; therefore, GEOID18 is related to a gravimetric geoid model but its function is to estimate GNSS-derived orthometric heights consistent with NAVD 88 heights. As described in my previous columns, the GPS on Bench Marks (GPSBMs) data provide an estimate of the geoid height ‘N’ by differencing the ellipsoidal height ‘h’ from the orthometric height ‘H’: (N = h – H). These differences are then compared to the gravimetrically-derived geoid model. The box titled “Excerpt from Geoid18 Website Technical Details” provides a summary of the process from NGS Geoid18 web page technical details document.
The figure in the box titled “GEOID18 Conversion Surface in cm” is the surface that represents the difference between NAVD 88 as a datum and the geopotential (geoid) surface used in the gravimetric geoid. This is the difference between the hybrid geoid and the gravimetric geoid with respect to NAD83 (GEOID18 – xGEOID19B). This surface has three essential components: a bias, a continental tilt, and local warping from the bench marks.
Excerpt from Geoid18 Website Technical Details(https://www.ngs.noaa.gov/GEOID/GEOID18/geoid18_tech_details.shtml) 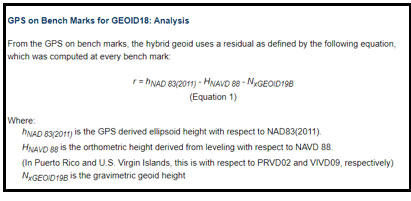 Hybrid Geoid Model Construction |
GEOID18 Conversion Surface in cm
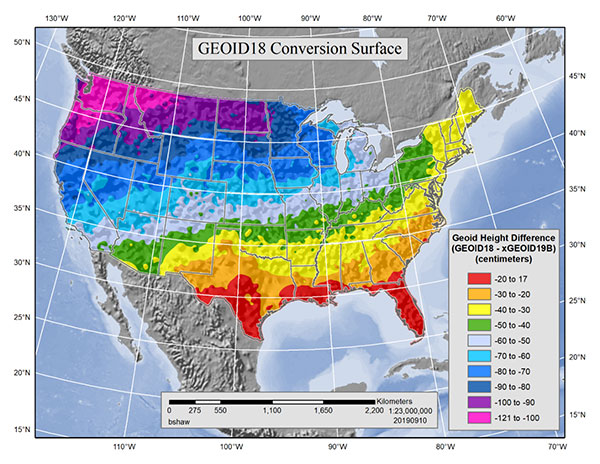
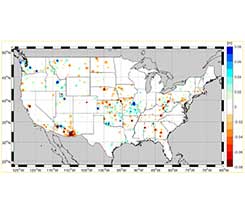
Looking at the figure in the box, the bias and tilt between the hybrid geoid model (Geoid18) and the experimental gravimetric geoid model (xGeoid19b) are fairly obvious. It’s the local warping from the bench mark data that may cause some issues to surveyors or, at least at a minimum, raise some concerned by surveyors. The box titled “Plot of the GPS on Bench Marks Involved in Geoid18” provides a plot of the GPS on Bench Marks (GPSBMs) used in the generation of Geoid18. Users can download the list of GPSBMs stations from the NGS Geoid18 website. There were 32,357 stations used to generate the model. This was an increase of approximately 6,800 stations (26%) over the hybrid geoid model Geoid12B.
Plot of the GPS on Bench Marks Involved in Geoid18

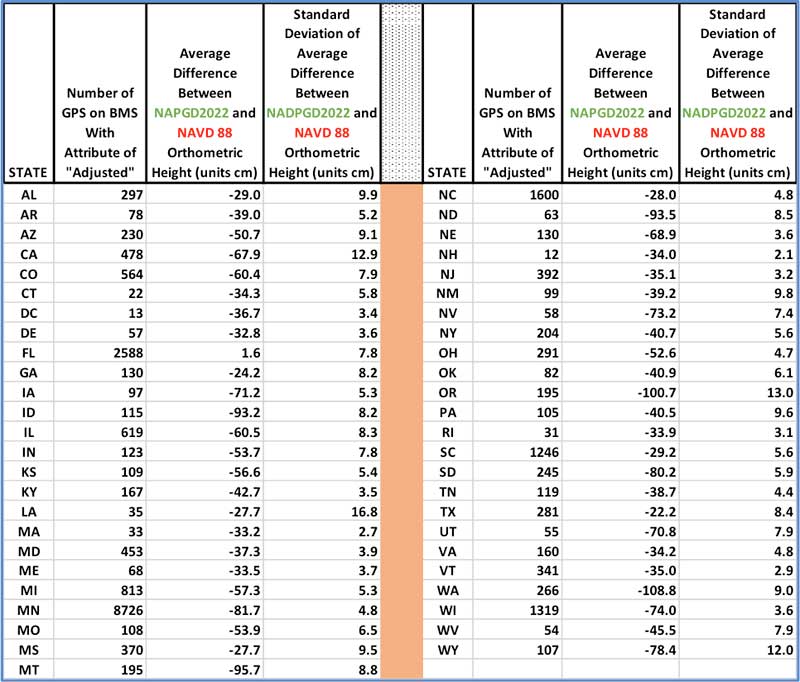
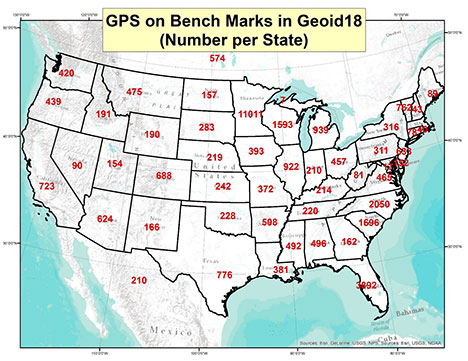
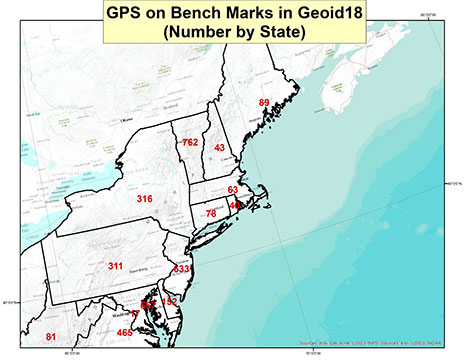
The boxes titled “Number of GPS on Bench Mark Stations by State” and “Number of GPS on Bench Mark Stations by State in Northeast U.S.” provide the number of data points per state.
Number of GPS on Bench Mark Stations by State
Number of GPS on Bench Mark Stations by State in Northeast U.S.
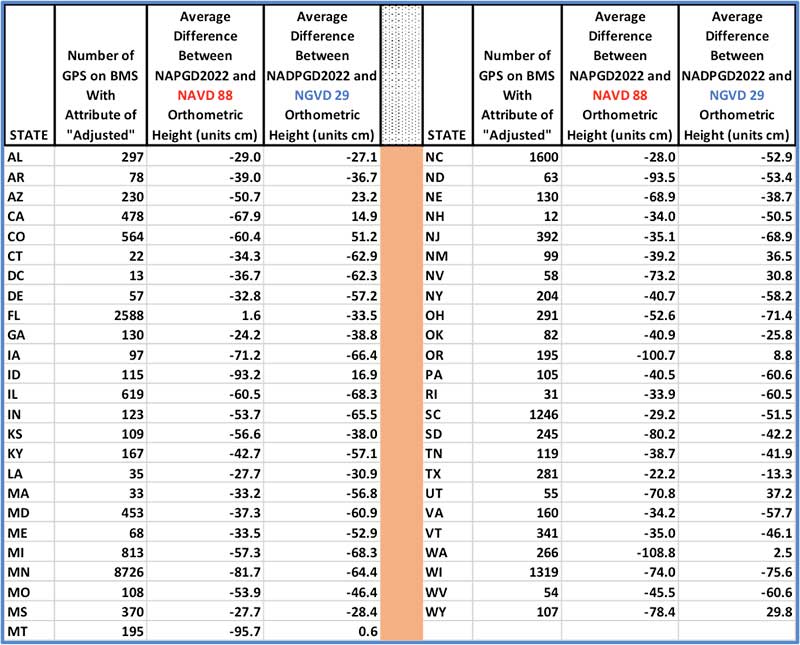
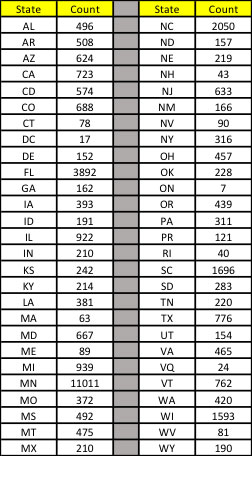
The box titled “Table of Number of Data Points per State” provides the number of stations per State in tabular form.
Table of Number of Data Points per State
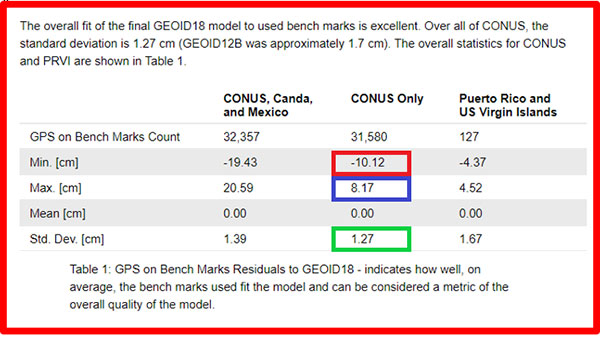
The box titled “Summary of Overall fit of Geoid18” provides a summary of the fit of residuals of Geoid18 from the NGS GEOID18 technical details document. Looking at the CONUS overall values, the standard deviation is very low 1.27 cm which is a little better than Geoid12B (1.7 cm). It should be noted that there are some large outliers (minimum value of -10.12 cm and maximum value of 8.17 cm).
Summary of Overall fit of Geoid18
(https://geodesy.noaa.gov/GEOID/GEOID18/geoid18_tech_details.shtml)
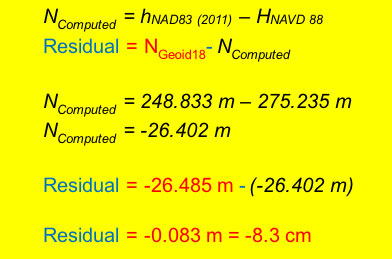
For this column, the file of bench marks provided on the NGS Geoid18 web page were combined with the published ellipsoid, orthometric, and Geoid18 heights from NGS’ datasheet. The difference between the published geoid height (Geoid18) and the estimated geoid height [published NAD 83 (2011) ellipsoid height minus NAVD 88 orthometric height] was computed using the following formula:
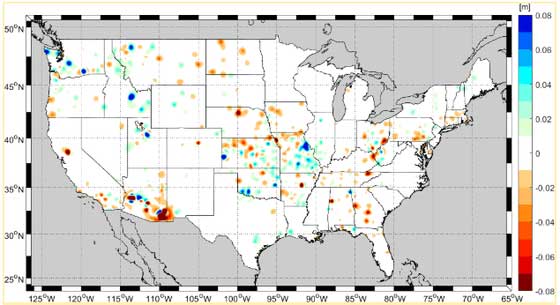
The box titled “Plot of Differences Based on GPS on Bench Marks Used in Geoid18” depicts these differences based on the stations used to generate Geoid18.
Plot of Differences Based on GPS on Bench Marks Used in Geoid18
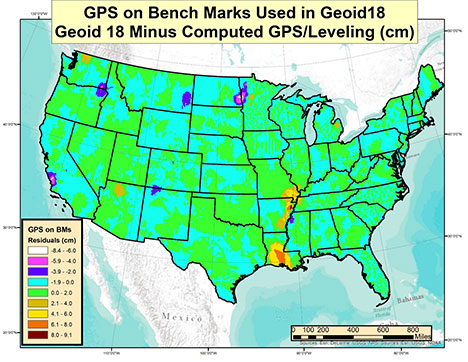
Most of the values depicted on the plot are within the +/- 2 cm which is what you’d expect because the standard deviation of the overall fit is 1.4 cm. One to two centimeters is a very reasonable difference between the modeled and computed values. The question someone may ask is, I thought the model should be good to 1.4 cm so why are there large residual values on the map? There are several reasons why some of these differences are large but each case needs to be investigated to determine why they are large. This column will address one region as an example and provide a method for others to investigate differences in their area of interest.
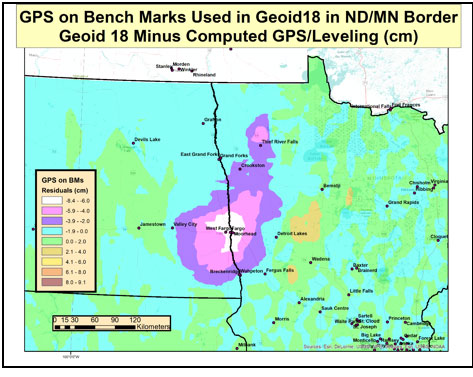
The box titled “Plot of GPS on Bench Mark Differences at the ND/MN Border” depicts a very large difference between the modeled geoid model and the estimated geoid height along the ND/MN border. As indicated in the box, the difference exceeds 6 cm.
Plot of GPS on Bench Mark Differences at the ND/MN Border
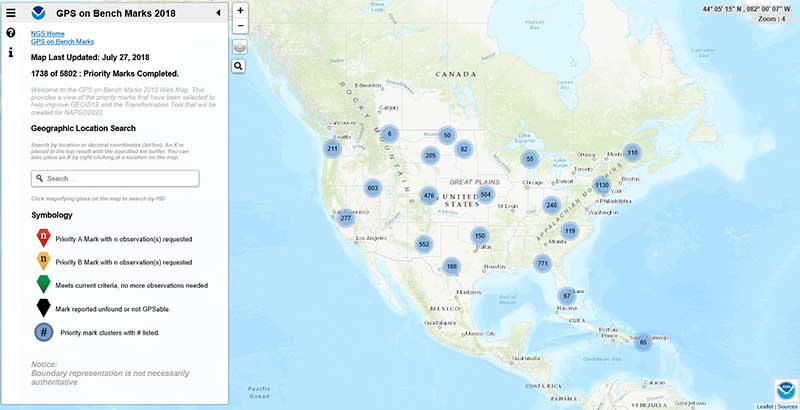
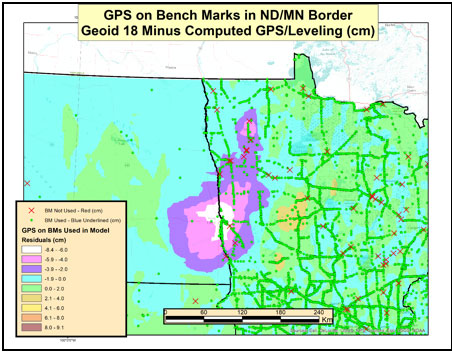
The box titled “Plot of GPS on Bench Mark Stations in the ND/MN Border Region” depict the bench marks involved in the development of Geoid18. The green circles represent the GPSBMs stations used in the creation of Geoid18 and the red “x” denote the stations that were not used in the creation of the model. As indicated in the plot, there were a lot of GPSBMs stations in the State of Minnesota (11,011).
Plot of GPS on Bench Mark Stations in the ND/MN Border Region
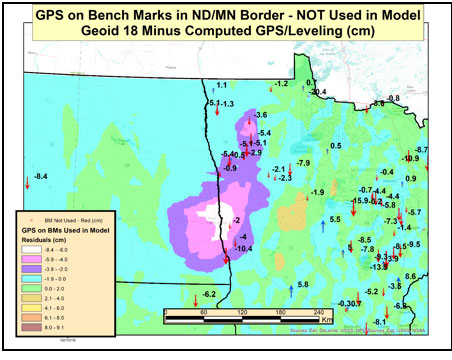
The box titled “Differences on GPS on Bench Marks in ND/MN Border — NOT Used in Model” depict the values of the rejected GPS on BMs stations. These stations were not used to create the hybrid geoid model Geoid18. As the plot indicates there are several large differences. This is not really surprising since these stations were not used in the model.
Differences on GPS on Bench Marks in ND/MN Border — NOT Used in Model
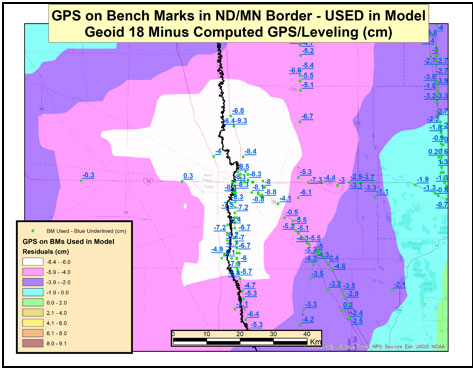
The box titled “Differences on GPS on Bench Marks in ND/MN Border — USED in Model” depict the values of the GPS on BMs stations used to create the Geoid18 model. Some of these differences exceed 8 cm. You would expect these differences to be small since these stations were used to create the model. So, why are there large post-modeled residuals in the Fargo, ND, region of the United States?
Differences on GPS on Bench Marks in ND/MN Border – USED in Model
In August 2019, NGS performed a large leveling network adjustment in the Minnesota. The adjustment was performed after the Geoid18 database pull. The adjustment resulted in a 7- to 9-cm bias between the published height values and the superseded values. The August 2019 Minnesota leveling network adjustment heights were not used in the creation of Geoid18. The post-modeled differences presented in this column were generated using the published NAD 83 (2011) ellipsoid heights and current NAVD 88 orthometric heights from the NGSIDB. It was determined by NGS that the differences in the Fargo region were mostly due to crustal movement. Therefore, since the differences were due to movement, secondary adjustments will need to be performed to feather the 7- to 9-cm differences to maintain consistency between published NAVD 88 heights in the region. The secondary adjustments have not been completed as of the publication of this column so the residuals west of Fargo in North Dakota are small. These values will change after the secondary adjustment is completed and loaded into NGS’ database.
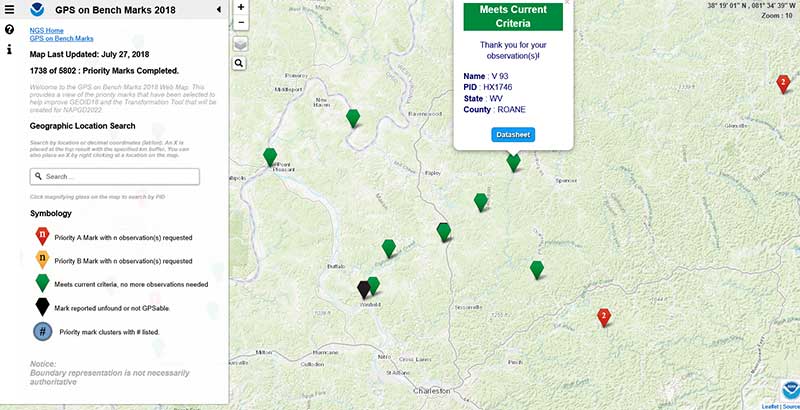
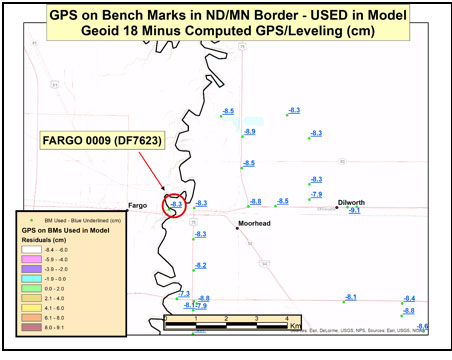
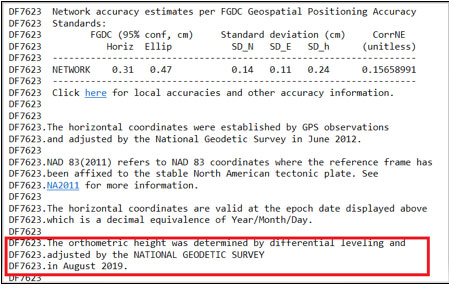
As an example, I’ve highlighted the station Fargo 0009 (PID DF7623) in the area of Fargo, North Dakota (see box titled “Differences on GPS on Bench Marks Near Fargo, ND”). The difference (-8.3 cm) is between the published Geoid18 value and the computed geoid value using the published ellipsoid height and orthometric height from the NGS’ datasheet. The box titled “Excerpt from Datasheet for Station Fargo 0009 (DF7623)” provides the information from NGS datasheet for station Fargo 0009; the information used in the computations are highlighted in the box. The box titled “Computation of the Difference between the Modeled Geoid Value (Geoid18) and the Computed Geoid Value for Fargo 0009” provides the process used to compute all differences for this column.
Differences on GPS on Bench Marks Near Fargo, North Dakota
Excerpt from Datasheet for Station Fargo 0009 (DF7623)
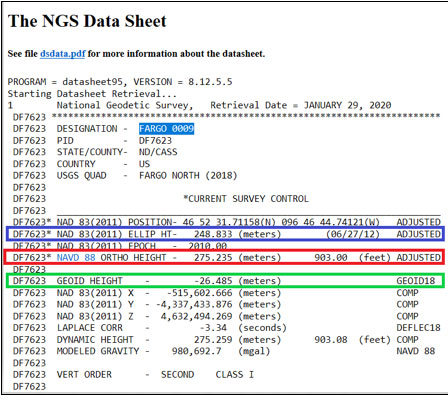
Computation of the Difference between the Modeled Geoid Value (Geoid18) and the Computed Geoid Value for Fargo 0009
(Information from NGS Published Datasheet)
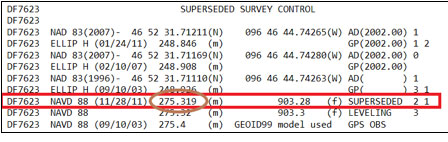
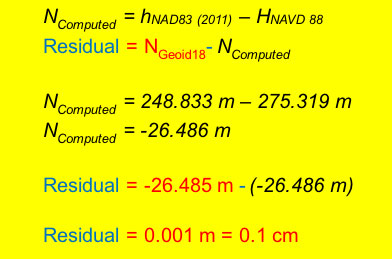
So, why is this difference so large in this region? A stated above, NGS performed a readjustment in this region and superseded the heights that were used in the creation of the Geoid18 hybrid model. The Geoid18 hybrid model used the previously published orthometric heights, now provided in the superseded section of the NGS datasheet, because that was the current published height at the time of the data pull for the Geoid18 process. Therefore, if we substitute the superseded height from the datasheet into the equation the difference is reduced to 0.1 cm (1 mm). [See the box titled “Computation of the Difference between the modeled geoid value (Geoid18) and the computed geoid value for Fargo 0009 Using the Superseded NAVD 88 Value.”]
Computation of the Difference between the modeled geoid value (Geoid18) and the computed geoid value for Fargo 0009 Using the Superseded NAVD 88 Value
(Information from NGS Published Datasheet)
This means if someone uses NGS’ OPUS web tool to compute a GNSS-derived orthometric height, the NAVD 88 GNSS-derived orthometric height will be about 8 cm different than the published stations in this region. This should not be an issue if the users follow published NGS Guidelines to estimate the NAVD 88 GNSS-derived orthometric height, and/or uses NGS Beta OPUS-Projects and NGS procedures to estimate the NAVD 88 GNSS-derived orthometric height. These processes will ensure that the height will be consistent with the current published NAVD 88 orthometric heights in the NGS database.
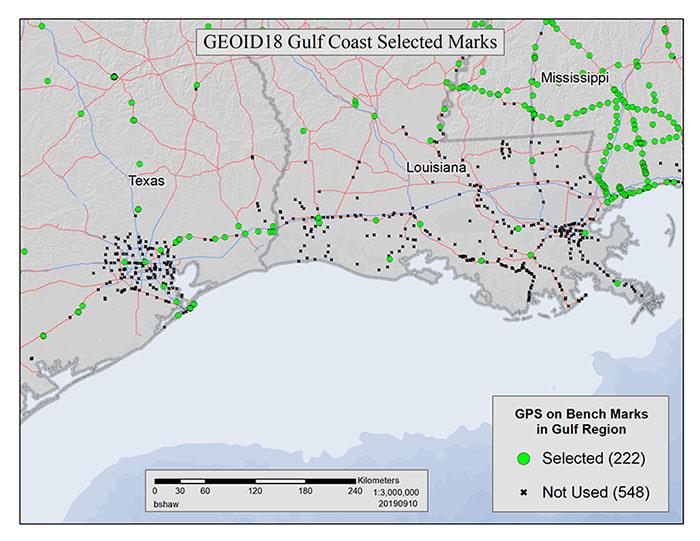
The technical report on Geoid18 provides a good explanation on the stations used in the United States Gulf Coast region. See box titled “GPS on Bench Marks for GEOID18 in the Gulf Coast Region.”
GPS on Bench Marks for GEOID18 in the Gulf Coast Region
(https://www.ngs.noaa.gov/GEOID/GEOID18/geoid18_tech_details.shtml)
There are areas of complex vertical crustal motion in the Texas/Louisiana Gulf Coast region of the United States which render many control station elevations in the region invalid. The selection of GPS on Bench Marks in this region was limited to the small number of marks where the leveling and GPS data agreed to minimize the influence of crustal motion in the hybrid geoid model. Figure 1 depicts the selection of stations used in the hybrid geoid model along the Texas/Louisiana Gulf Coast.
As indicated in the box titled “GPS on Bench Marks for GEOID18 in the Gulf Coast Region” very few stations in Southern Louisiana were used in the creation of the hybrid geoid model. The box titled “Differences on GPS on Bench Marks in the Gulf Coast Region” depict the differences between the published Geoid18 value and the computed geoid value using the latest NAD 83 (2011) ellipsoid and NAVD 88 orthometric height. The plot indicates that there are many large differences. This is to be expected because the orthometric heights used in the creation of the hybrid geoid model are all superseded heights. This is because the only published heights in Southern Louisiana are GNSS-derived orthometric heights and leveling-derived orthometric heights were used in the creation of GEOID18.
Differences on GPS on Bench Marks
in the Gulf Coast Region
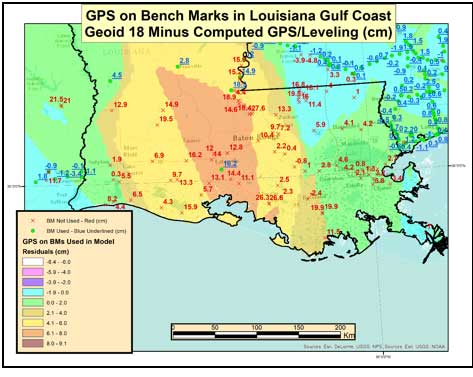
Saying that, NGS performed a large GNSS network project in Southern Louisiana in 2016. At the time of the writing of this column, the GNSS-derived orthometric height from the 2016 project were not yet finalized.
This column provided an analysis of the differences between the latest published hybrid Geoid18 values provided on NGS’ Datasheet and the computed geoid height value using the published NAD 83 (2011) ellipsoid height and NAVD 88 orthometric height. The column highlighted issues on differences due to published heights that have changed since the database pull for Geoid18. Future columns will address differences in other portions of CONUS.