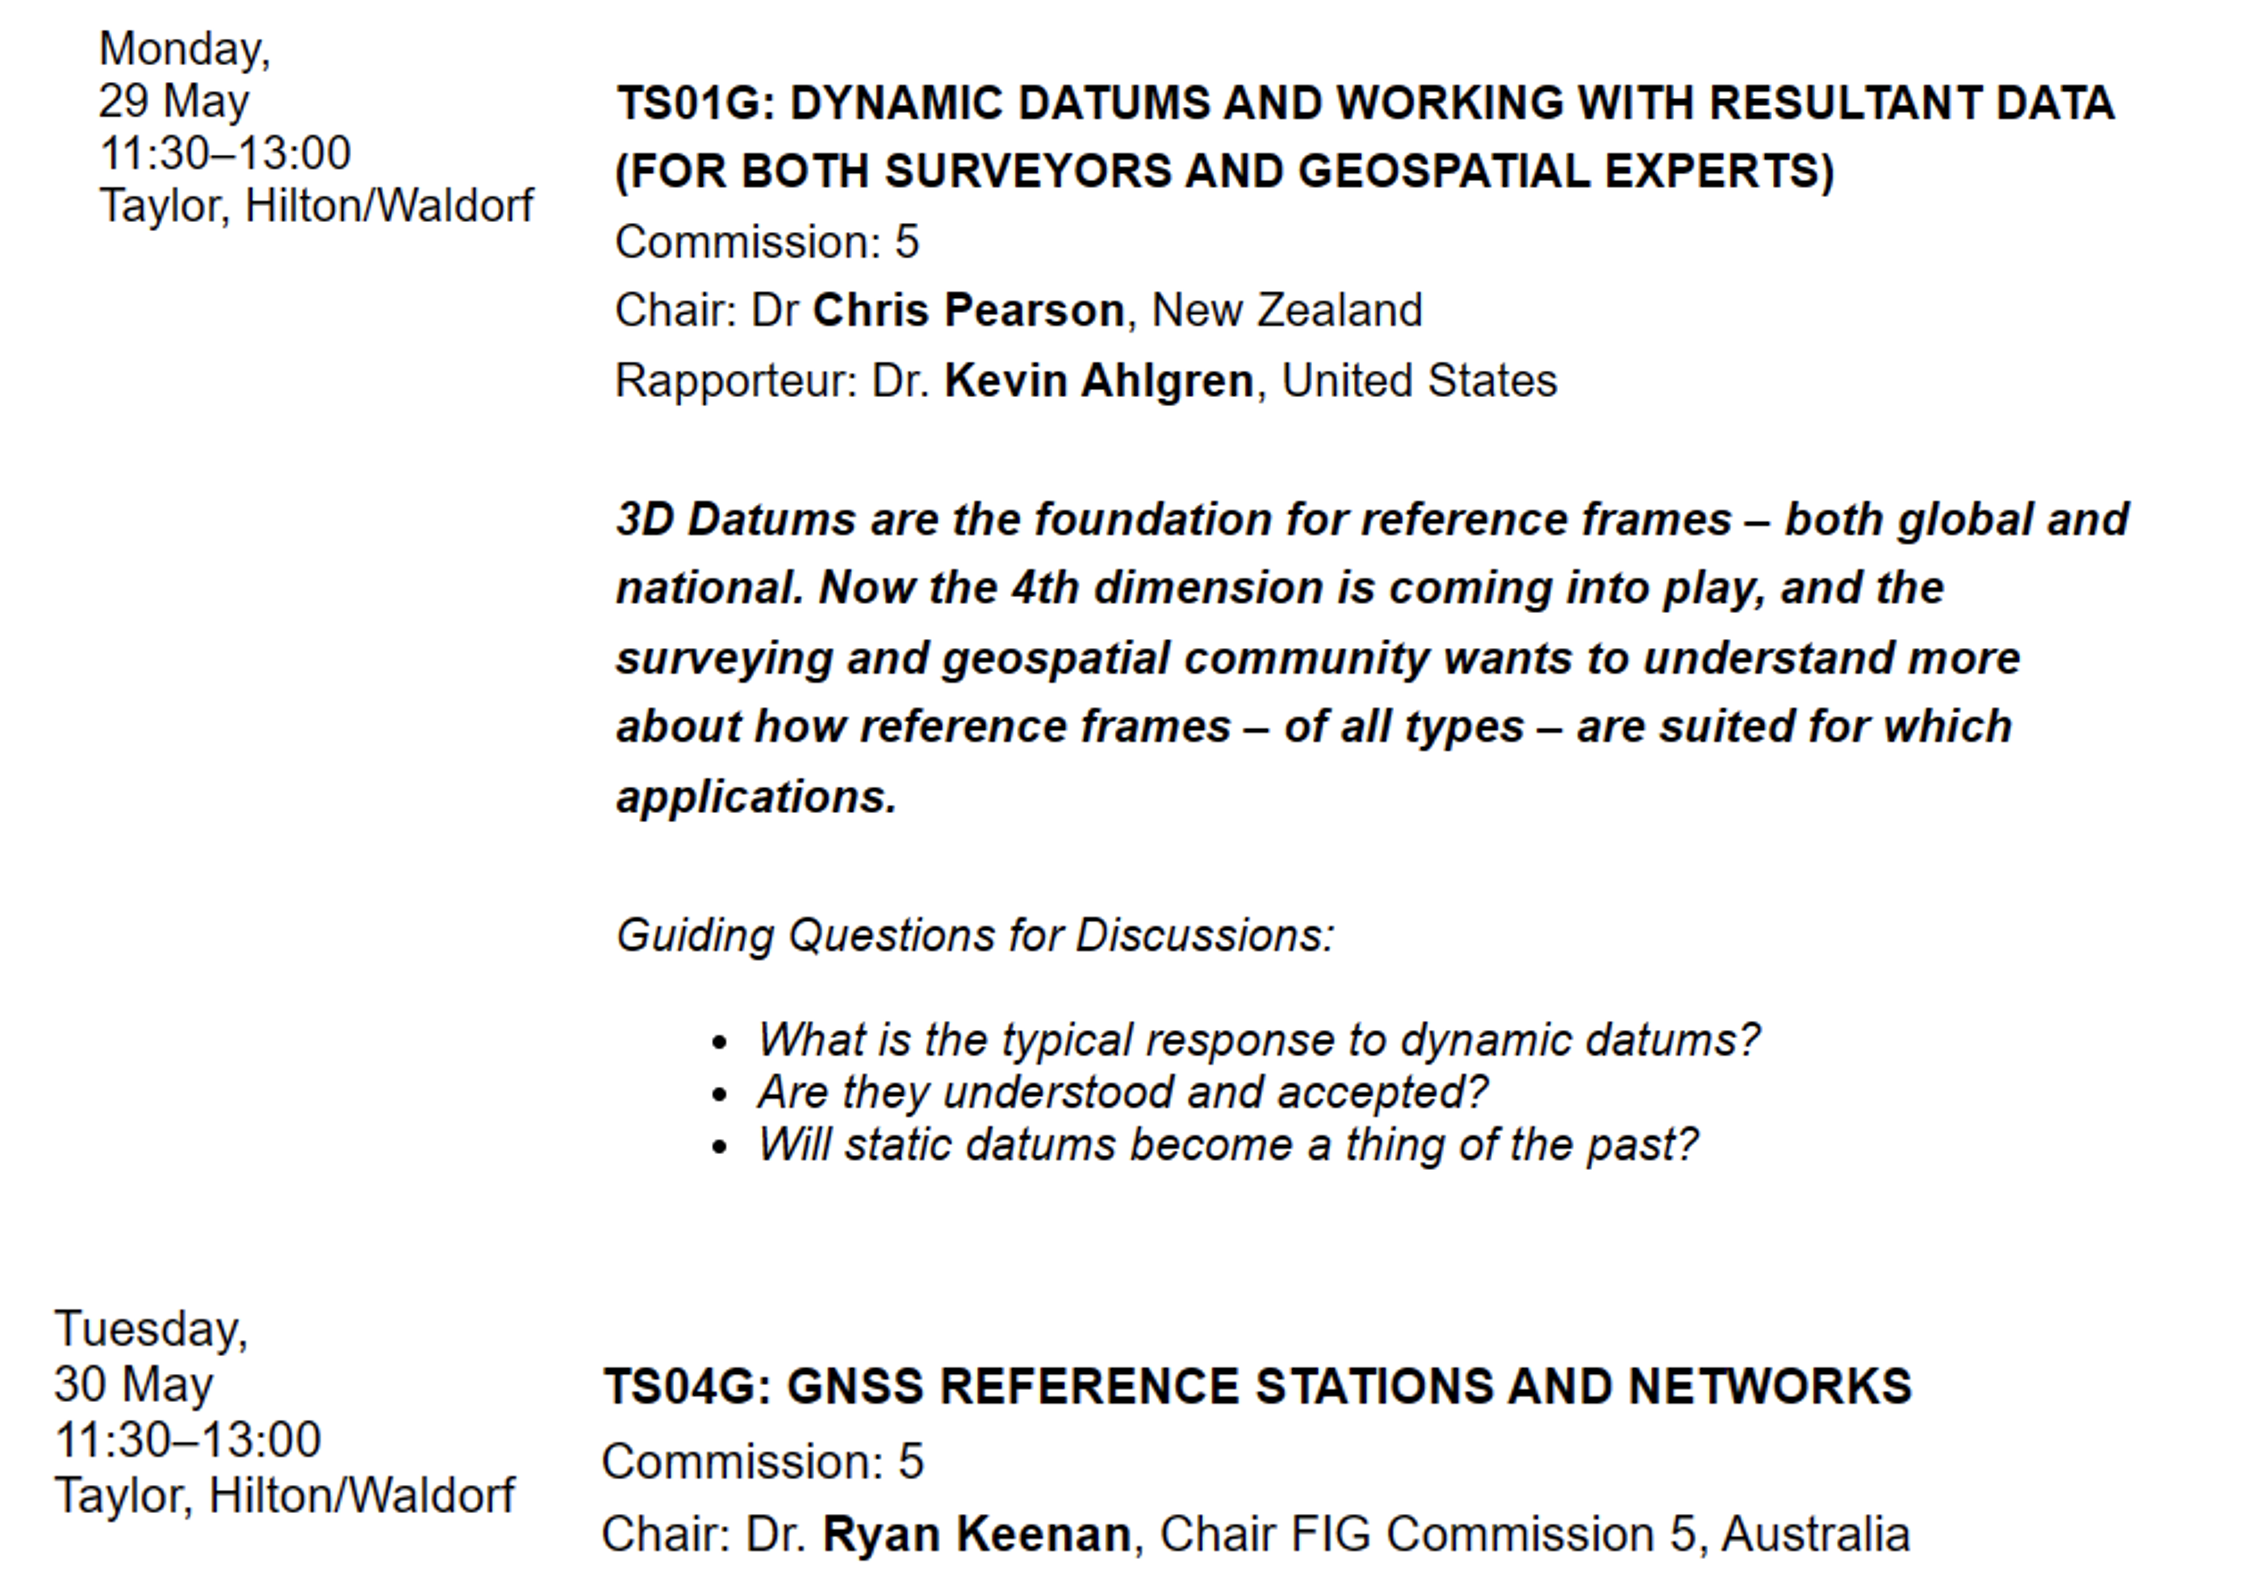
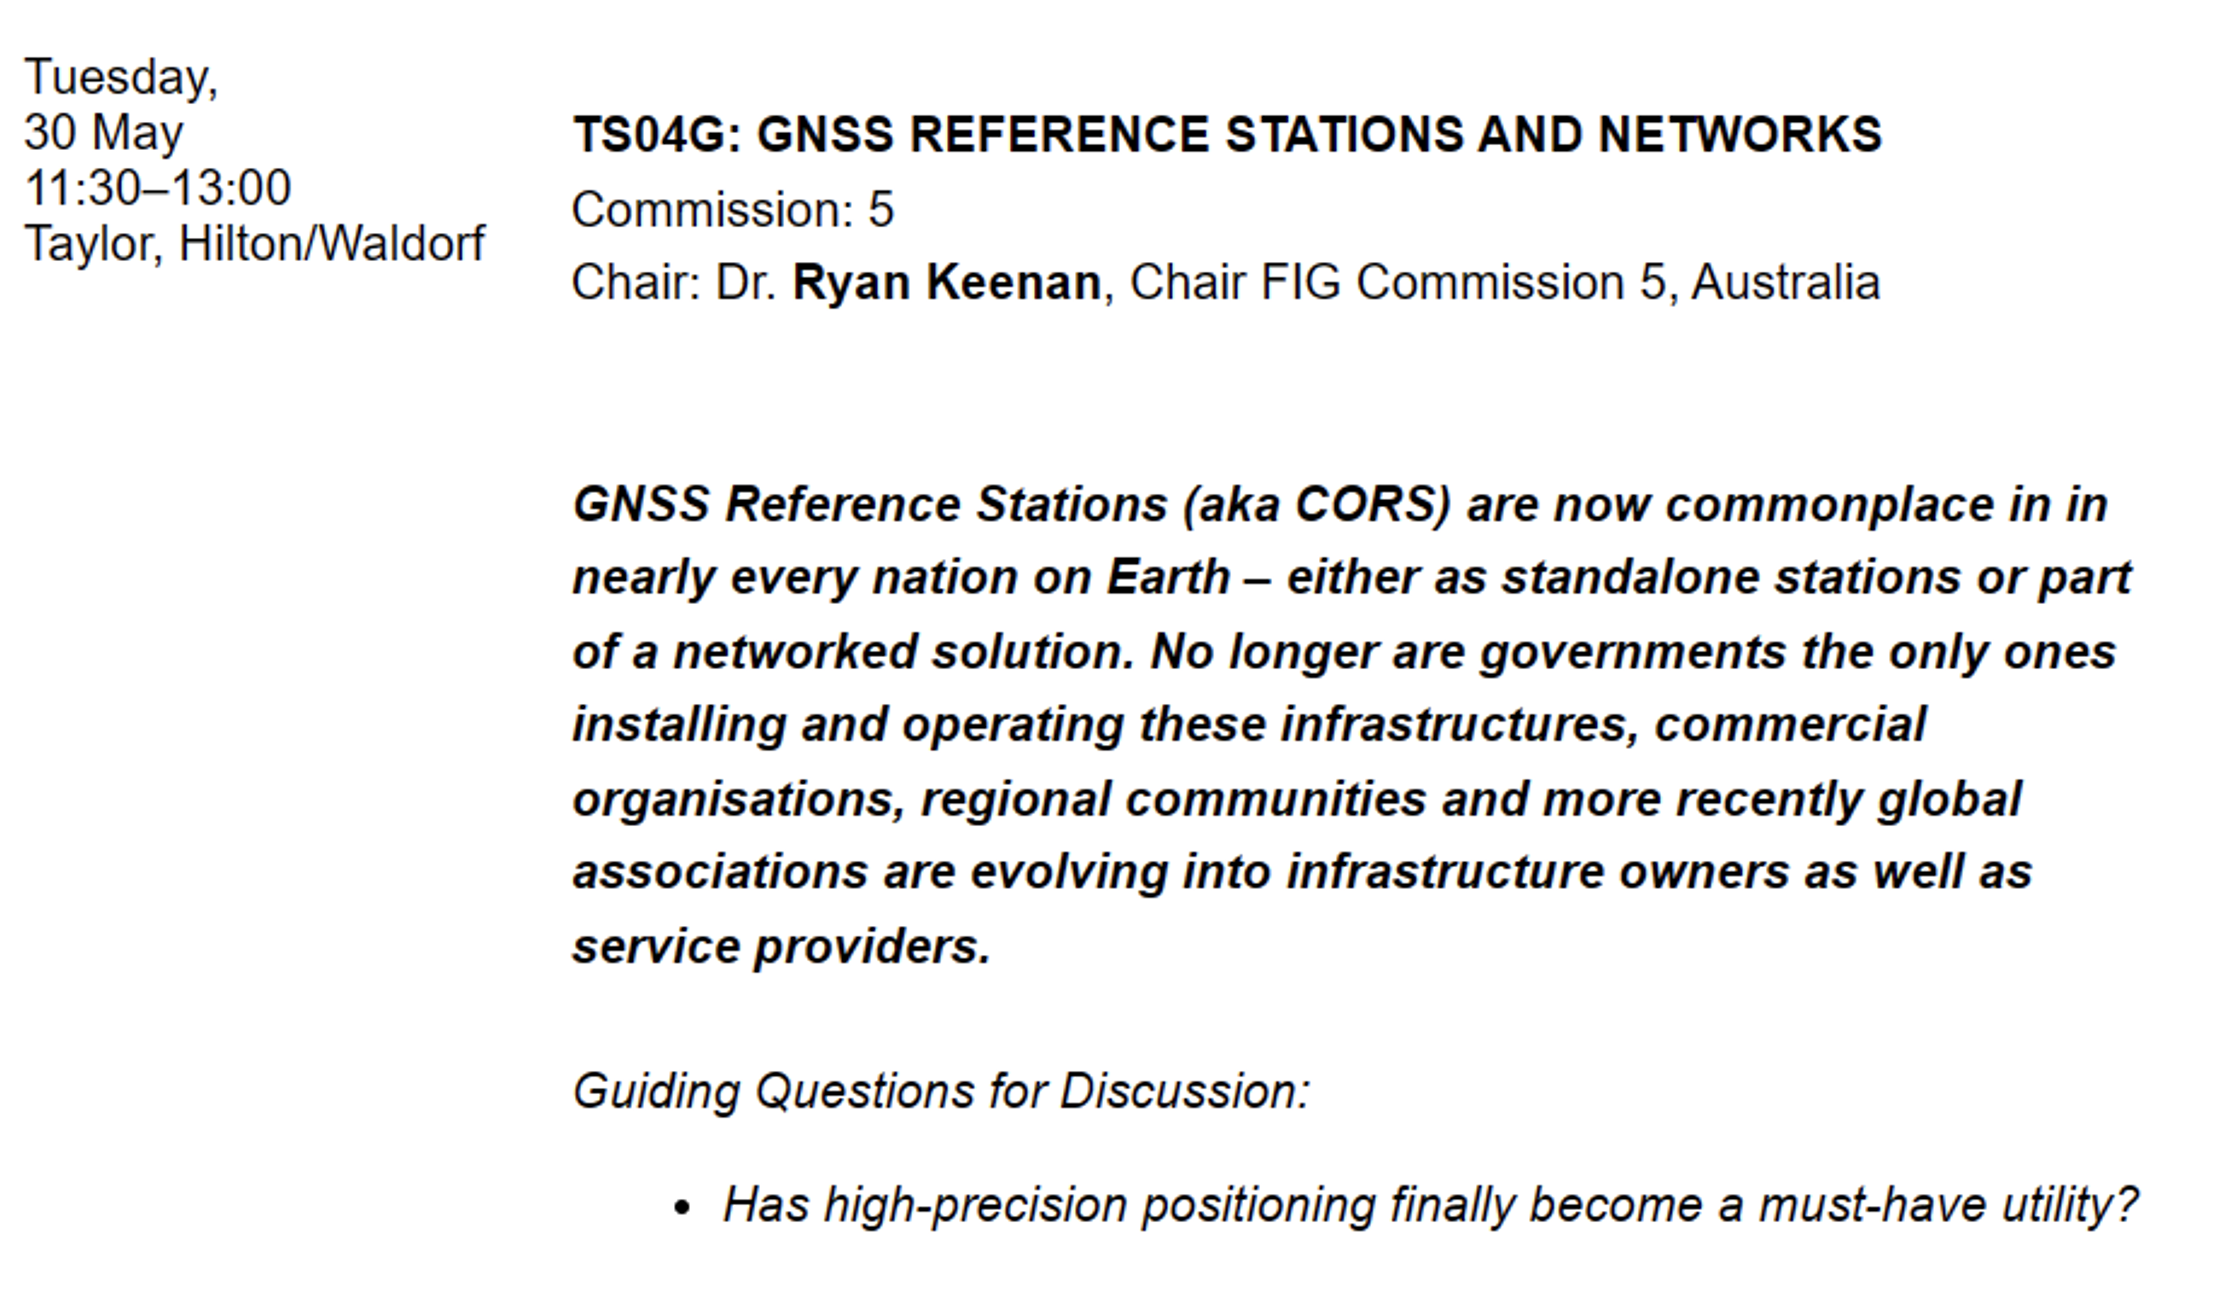
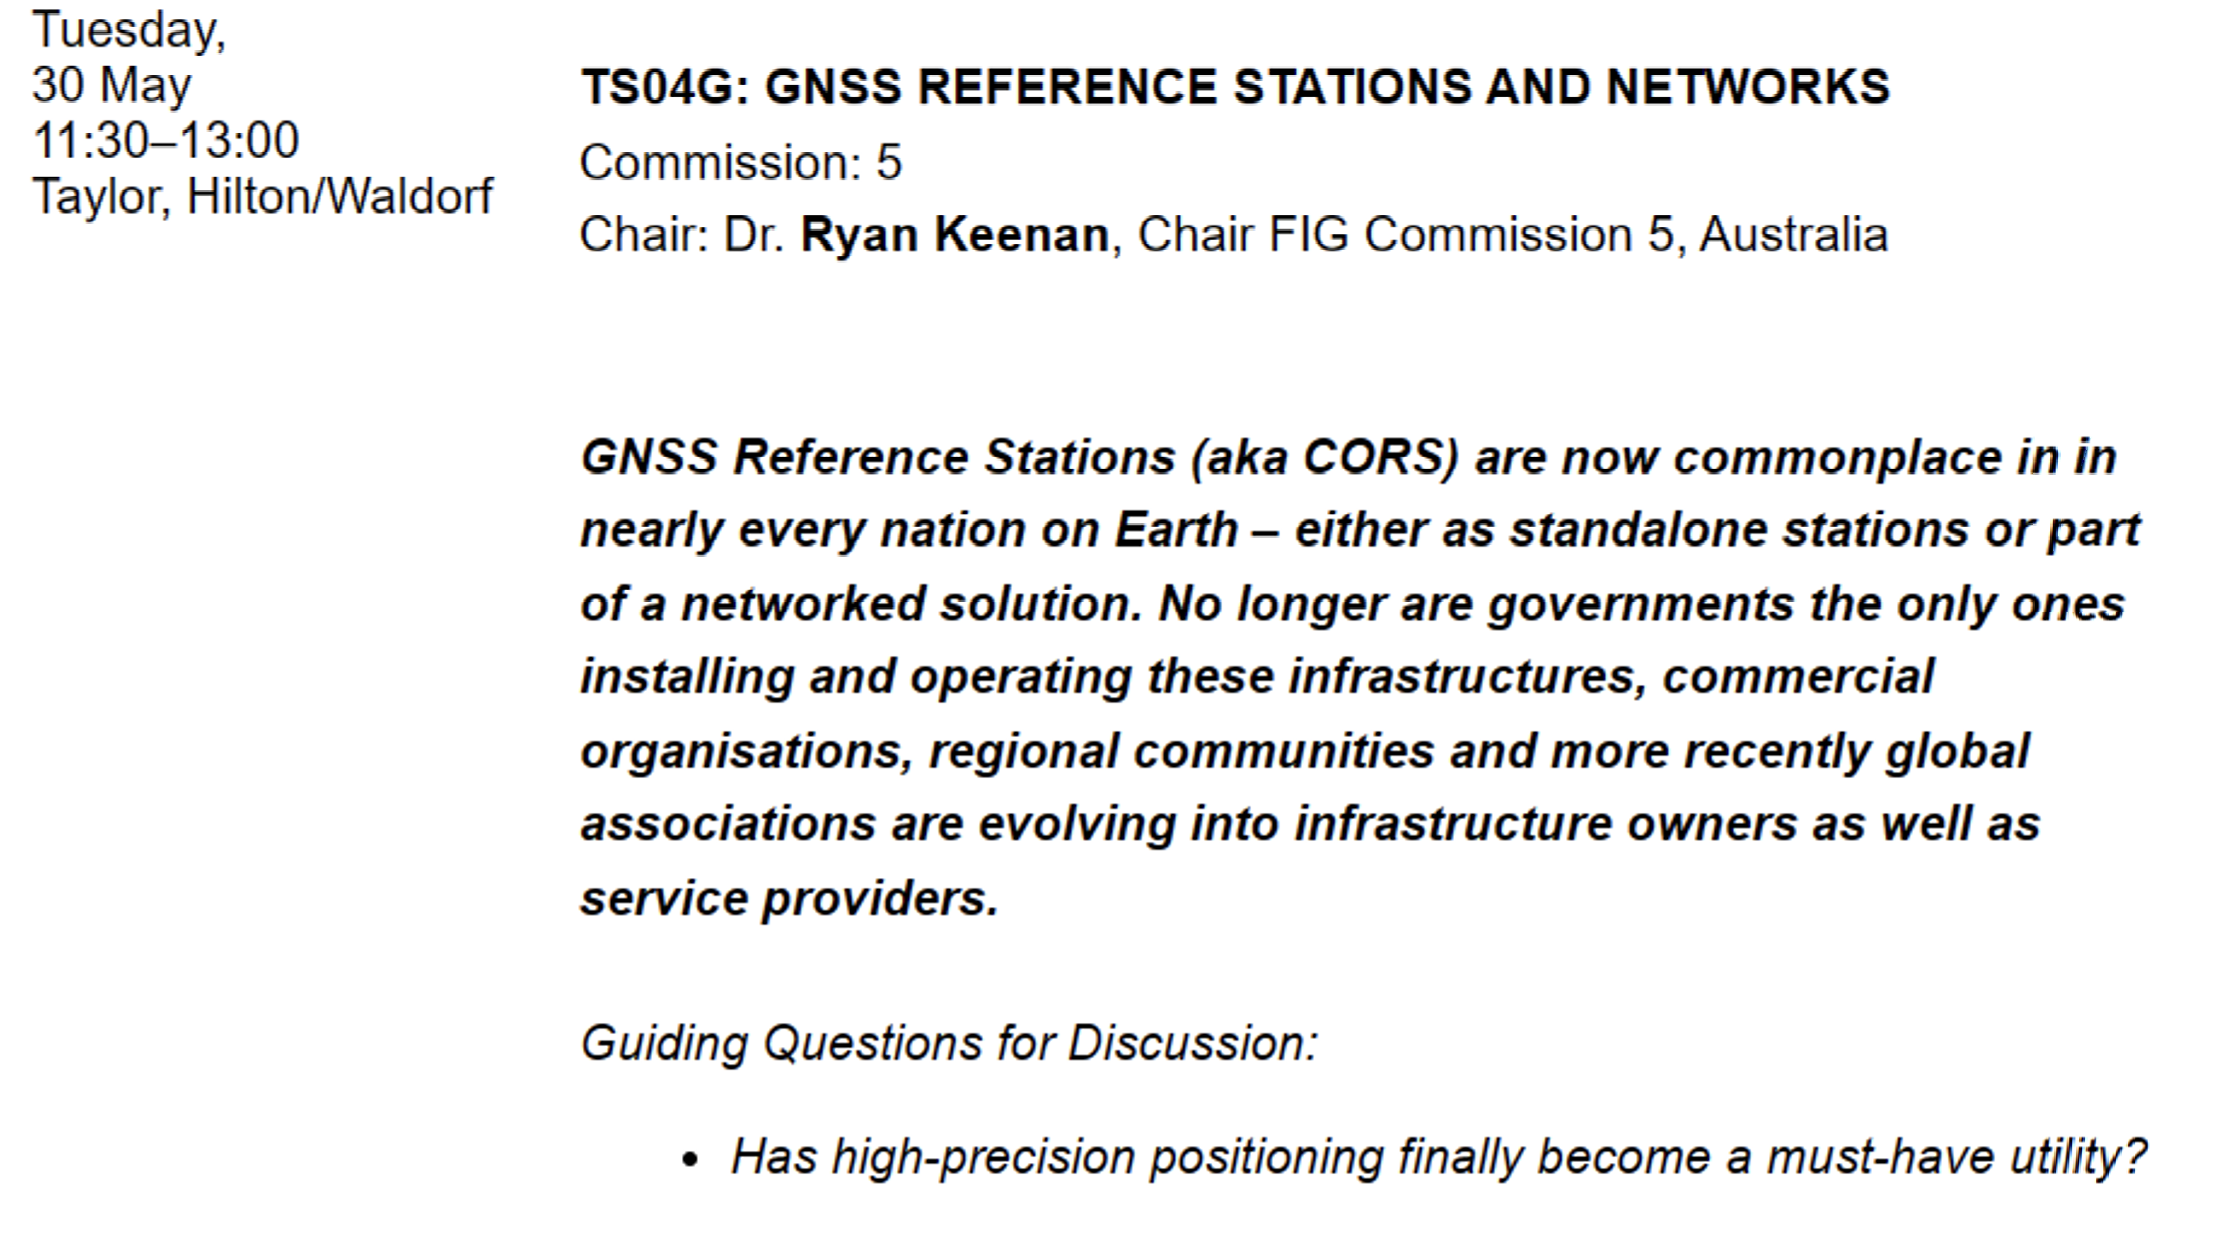
Anyone reading my previous columns knows that I have been highlighting the new, modernized, National Spatial Reference System (NSRS) of the National Geodetic Survey (NGS). During the 2023 Fédération Internationale des Géomètres (FIG) Working Week held on May 28 – June 30, in Orlando, Florida, NGS held an all-day session addressing various topics related to the NSRS modernization project.
More than 30 NGS staff members supported two days of sessions that included a day on the NSRS modernization, sessions for the Young Surveyors Network, and FIG Commission 5 meetings, which focused on meeting the highest accuracy levels for positioning and measurement.
Juliana Blackwell, director of NGS, kicked off the third plenary session tackling the global challenges, with a presentation titled “The Modernized U.S. National Spatial Reference System — Aligning National Geospatial Data to the Globe.”
Blackwell highlighted the importance of geospatial data from many different sources being interoperable and defined within a modern reference frame. She noted that NGS is part of the National Oceanic and Atmospheric Administration (NOAA), the mission of which is to understand and predict changes in climate, weather, ocean, and coasts. This includes a mandate to define, maintain and provide access to the NSRS.
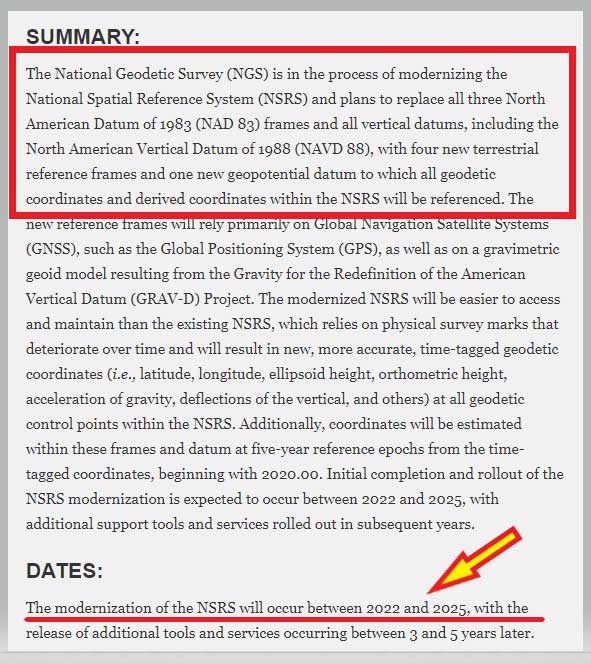
NGS’s NSRS modernization project has been underway for a decade and is nearly complete. Blackwell explained that the new NSRS will align critical U.S. geospatial data assets within global data inventories and enable improved analysis and modeling of climate changes and impacts to society and the environment. The modernized NSRS will enable data integration of new and old technologies, adopts modern standards, and empowers growth in new fields and applications.
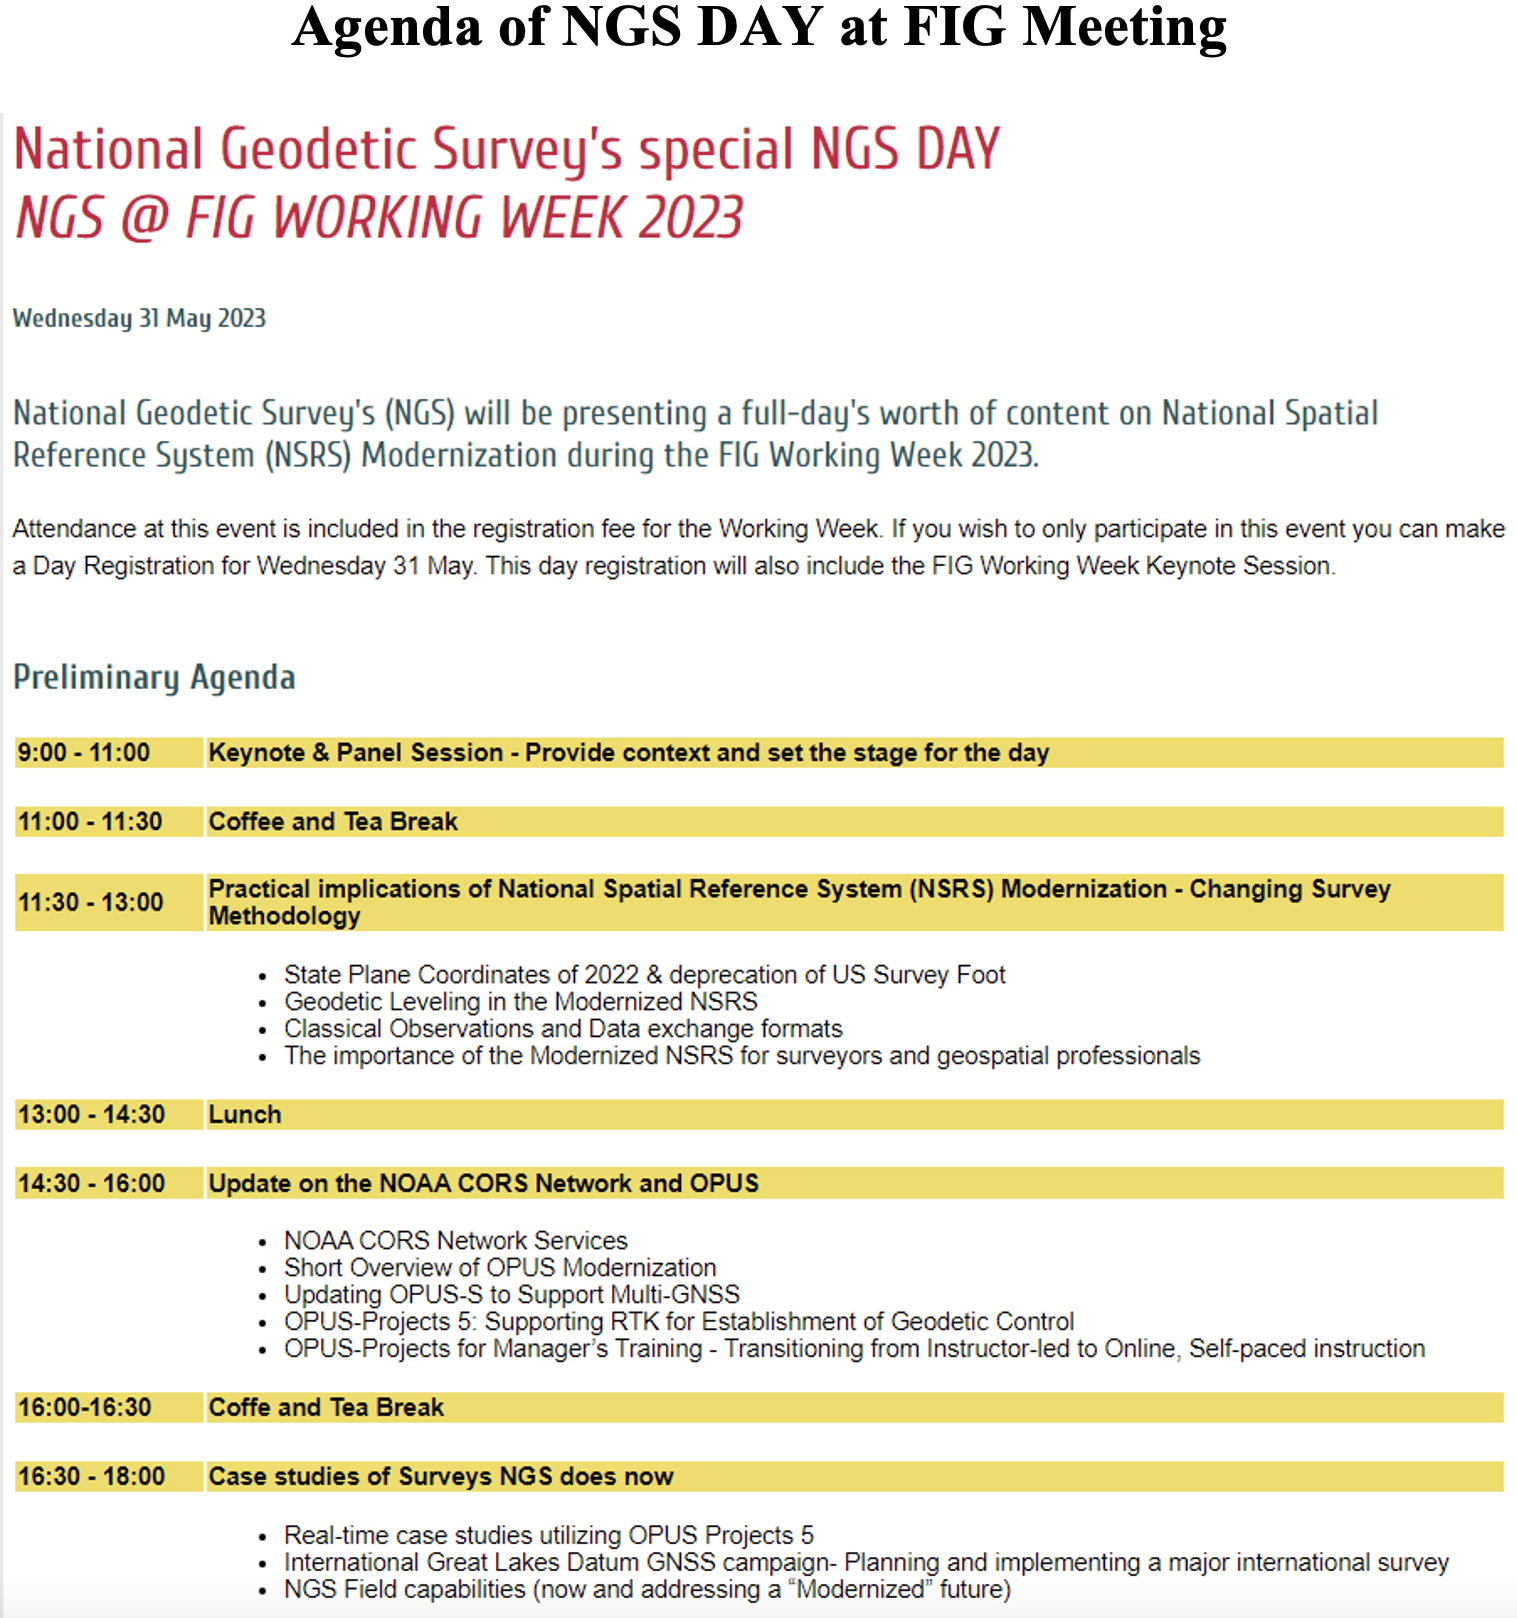
The remainder of the presentations during the all-day event covered three themes: the practical implications of NSRS modernization — changing survey methodology; an update on the NOAA CORS Network and the Online Positioning User Service (OPUS); and case studies of surveys — what NGS does now and how they will change.
Many of these topics have been discussed by NGS during their webinar series, but during these presentations NGS provided the latest information on many of the activities associated with the modernization of the NSRS. This venue allowed for participants to ask questions as opposed to typing them in a box. Also, the NGS employees that participated in the FIG working week were available for discussions before and after the session. I enjoyed my discussions with old colleagues as well as meeting some new NGS employees.
The session titled “Practical Implications of NSRS Modernization — Changing Survey Methodology” addressed the following topics:
practical impacts of the modernized NSRS
Canada’s implementation of the modernized frames
changes afoot: State Plane 2022 and Retirement of the U.S. Survey Foot and
preparing for the modernization of the NSRS.
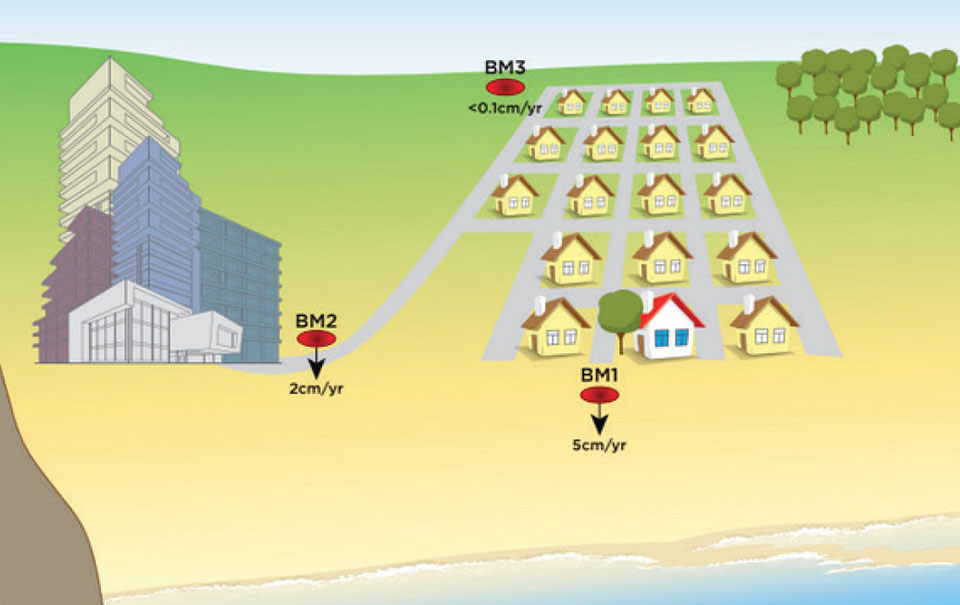
Dru Smith, NSRS modernization manager, started by explaining the practical impact of the modernized NSRS and why it is needed. He mentioned that the current NSRS was defined in the pre-GNSS era and that it has failed to keep up with emerging requirements, such as accurately measuring sea level rise.
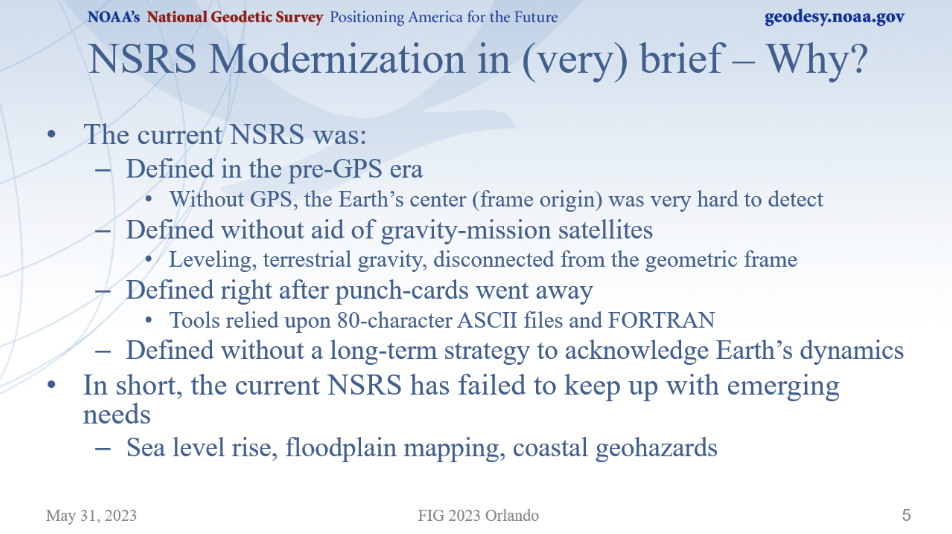
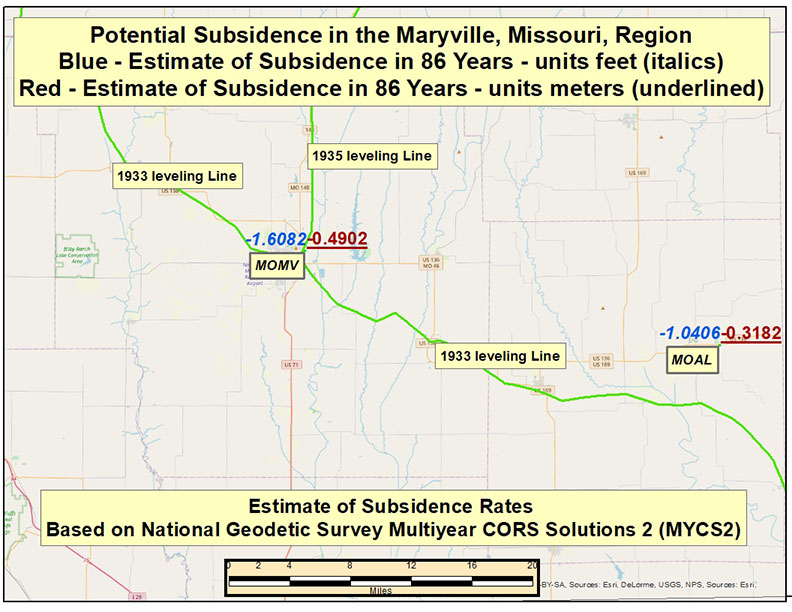
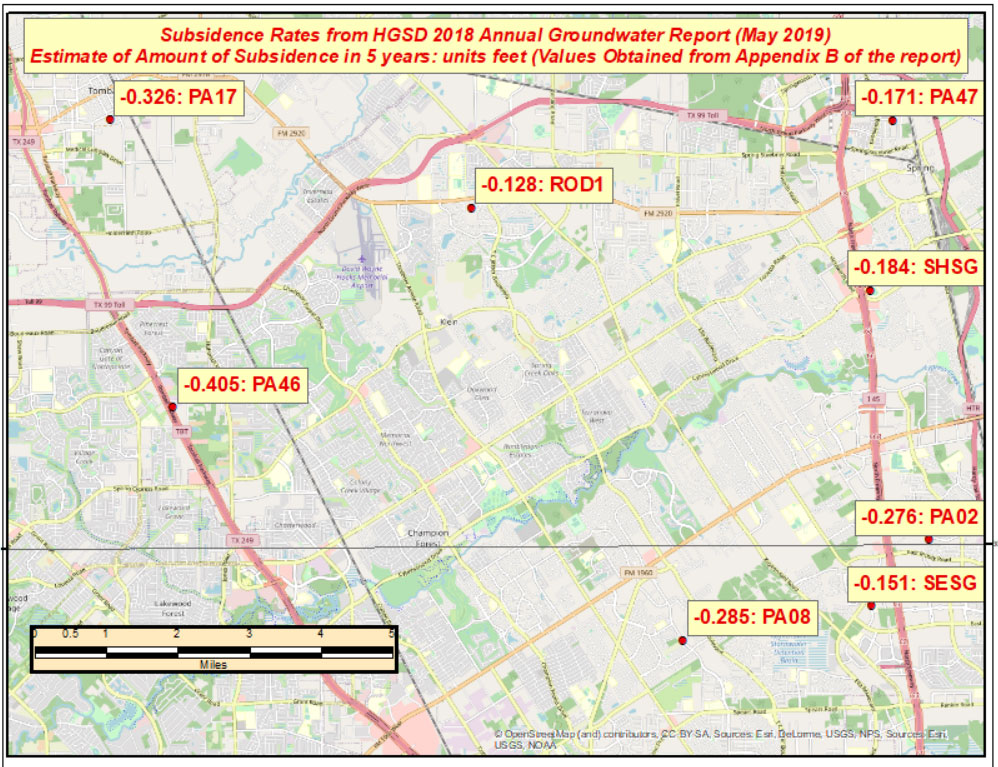
He highlighted the practical implications of the modernized NSRS, such as that every latitude, longitude, and ellipsoid height will change from its NAD 83 values in the +/-2-meter range, and every orthometric height will change from its NAVD 88 values in the +/-2-meters median range.
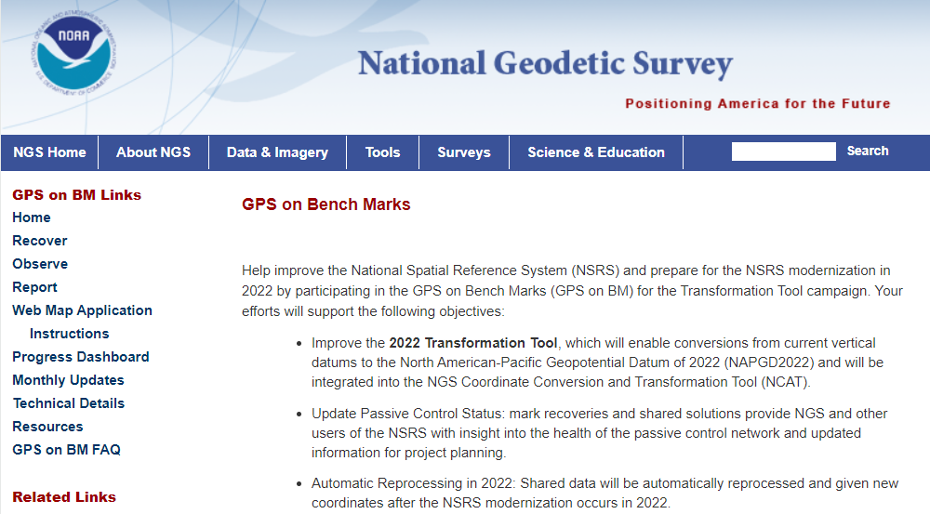
He mentioned that the published coordinate functions of the NOAA CORS Network (NCN) will be the primary geodetic control of the NSRS. He noted that NGS is working on the integration of web-based tools to improve consistency and reduce confusion, such as enhancements to NGS’s OPUS to ingest digital data from surveying instruments directly into OPUS 6 via a Geodetic Data Exchange (GDX) format. This would include raw measurements from GNSS receivers, levels, total stations, and gravimeters. The talk titled “Augmenting Data Exchange Formats for OPUS of the Future” by Ryan Hardy, discussed the GDX format in more detail.
As with the International Terrestrial Reference Frame, the modernized NSRS will have a time-dependency component. It will be built into the new NSRS, but users will have the ability to disengage from it.
Smith provided a timeline of the project for the next couple of years, which can be referenced in the image below. NGS plans to release data and support tools on their BETA website during 2024 and 2025.
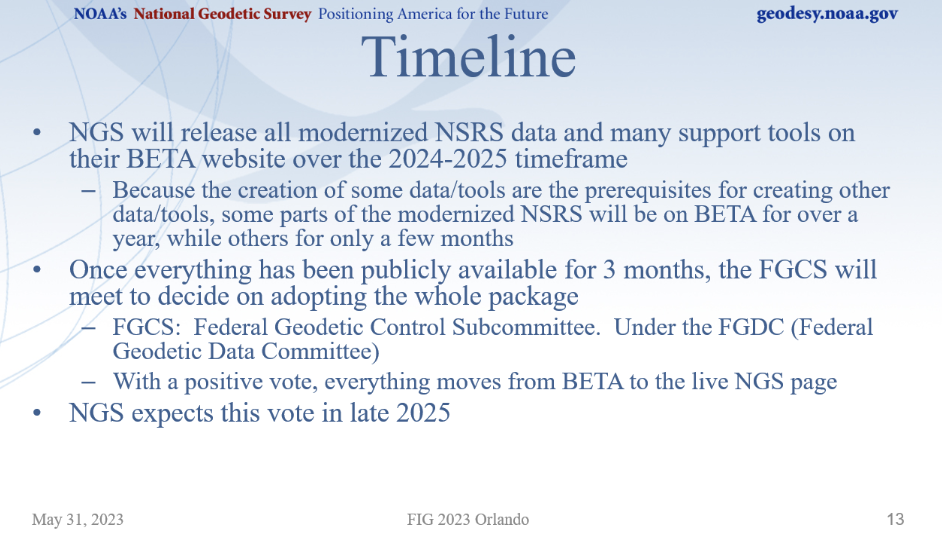
Smith discussed how some products will be released early for users to test and evaluate how the new NSRS products will affect their products and services, and to be ready for their customers after the new NSRS is released for publication. Products scheduled for early releases (Alpha Release), include SPCS2022, EPP2022, and GEOID2022.
He emphasized that Alpha products, by definition, can be one or more of the following:
- incomplete
- inaccurate
- buggy
- subject to change without notice
As such, their early release is primarily for users to see the “big picture” such as formats of data and the general direction that NGS is taking.
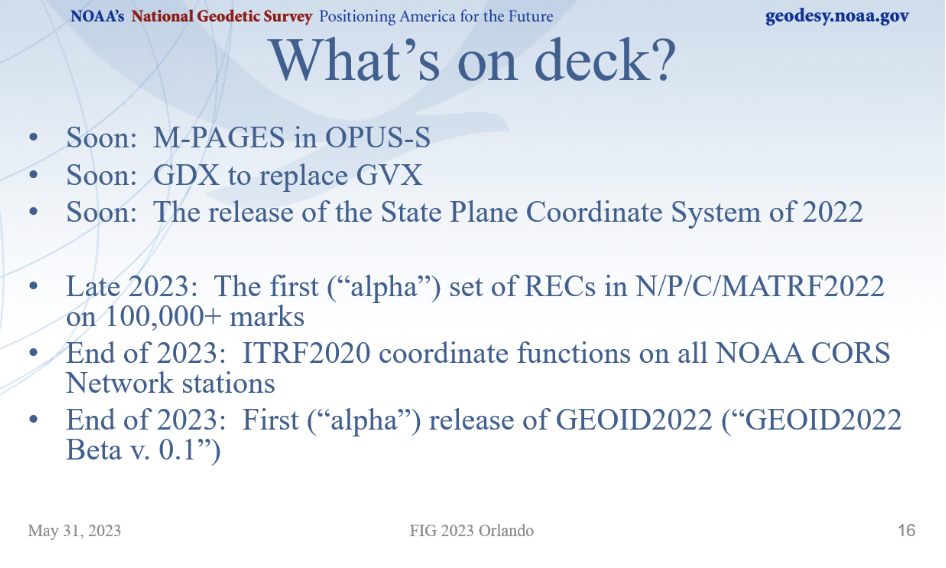
He provided a list of new products that will be announced soon, and some alpha products tentatively planned for release in 2023.
Michael Dennis did a nice job of discussing the State Plane Coordinate System of 2022 (SPCS 2022) and the retirement of the U.S. Survey Foot. He mentioned that the U.S. Survey Foot was superseded by the international foot on December 31, 2022. His presentation gave a brief overview on the status and rollout plans for SPCS2022, along with how and why NGS will continue to support the U.S. Survey Foot in the existing NSRS (but not in the modernized NSRS).
See the image below for the number of zones for each state.
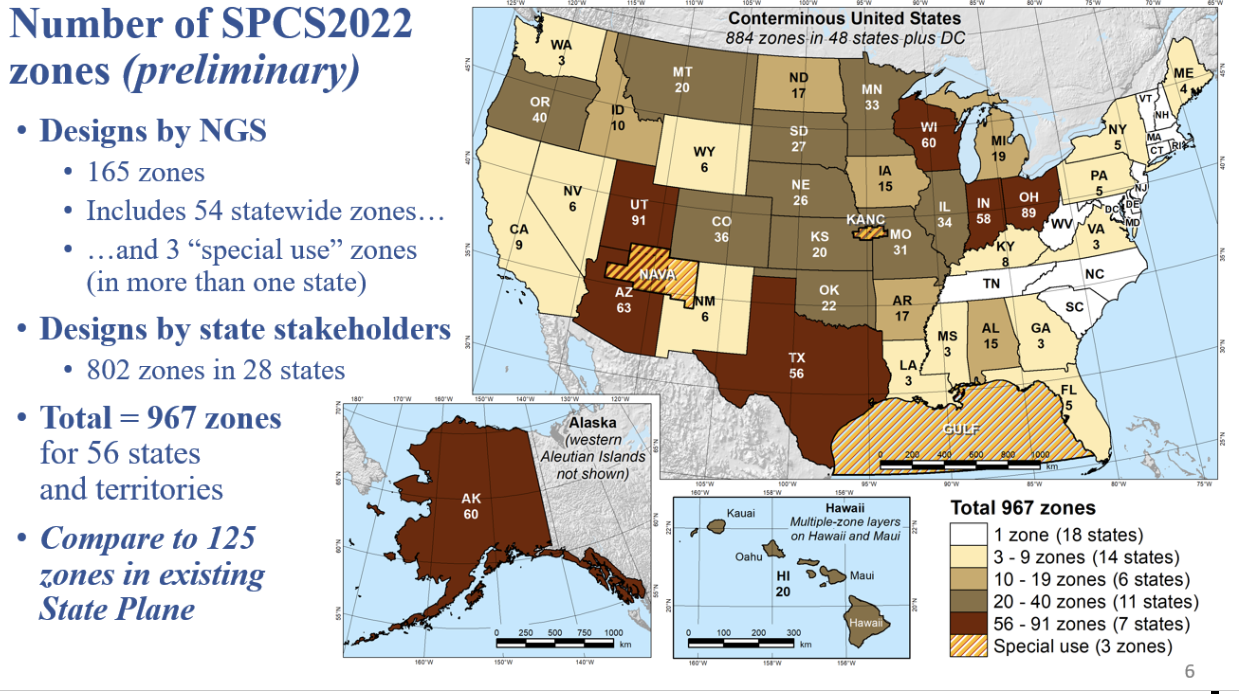
The SPCS2022 will be an alpha product released soon. Part of the alpha product will have options to view maps depicting the different zones in each state.
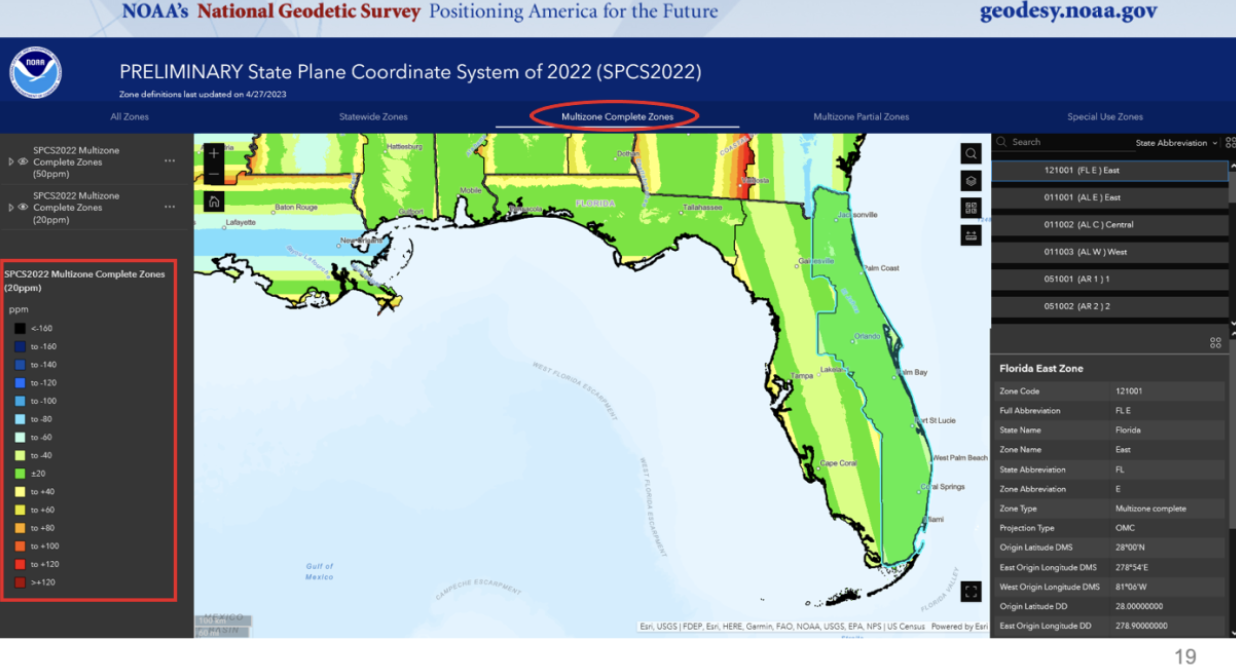
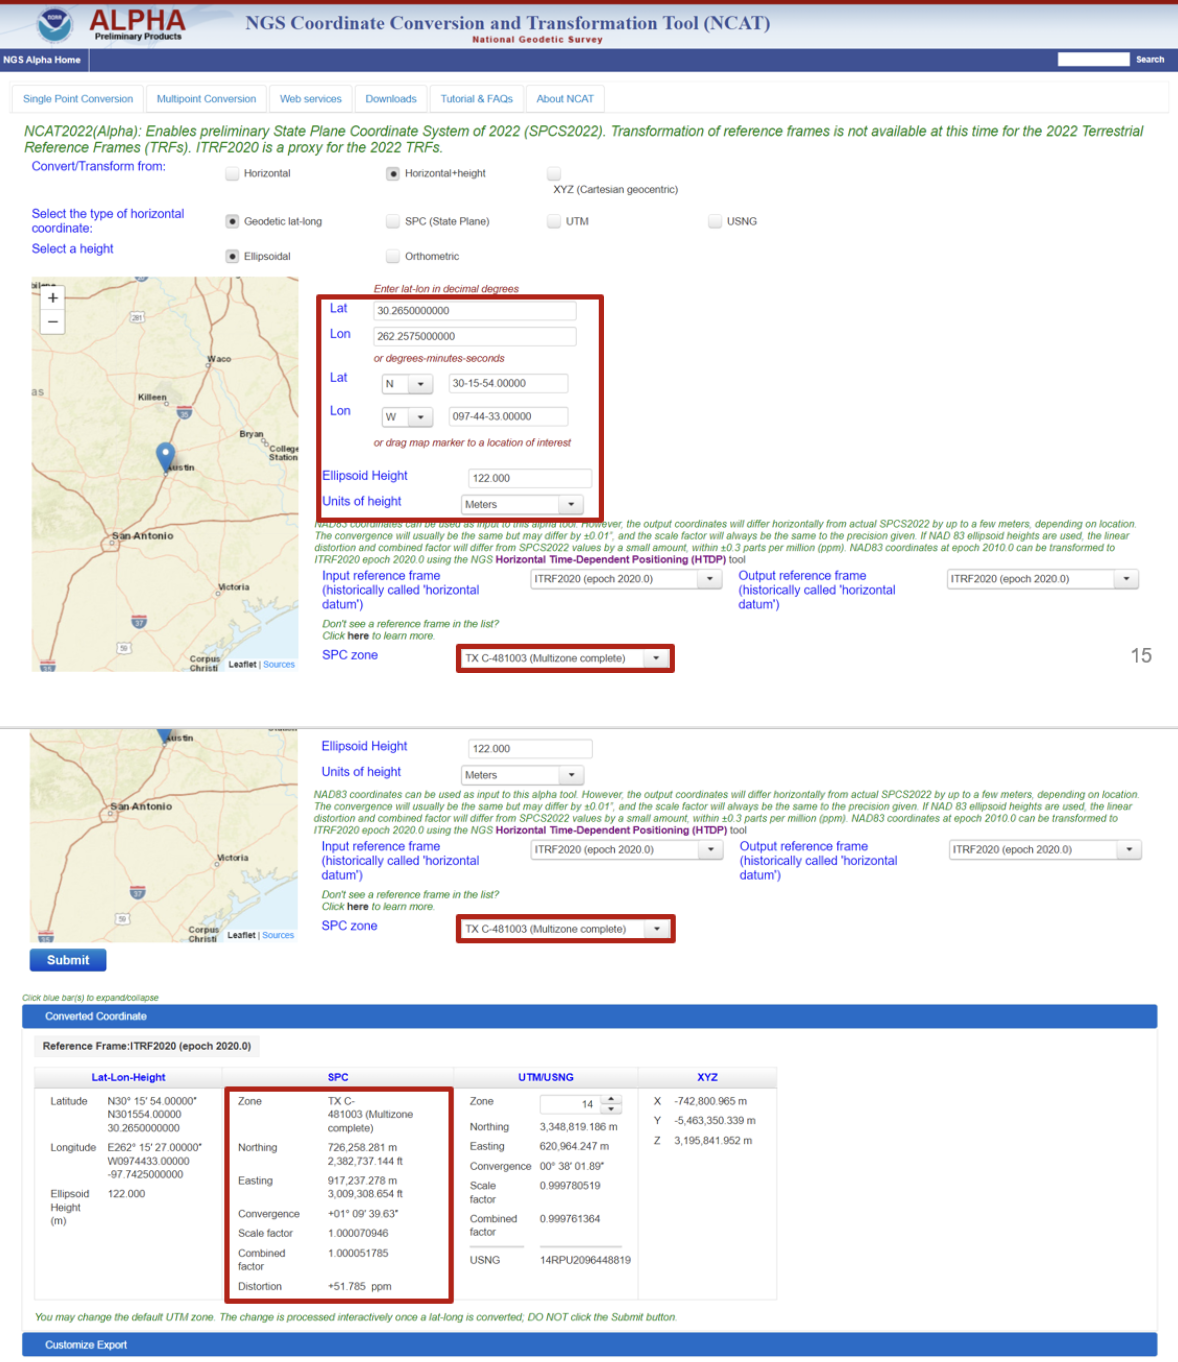
When NCAT2022 is released in alpha product it will contain the SPCS2022.
Representatives from the Canadian Geodetic Survey presented and participated in the discussions.
The session titled “Update on the NOAA CORS Network and OPUS” addressed the following topics:
- the NOAA CORS Network (NCN) services
- updating OPUS-S to support multi-GNSS
- OPUS -Projects 5: supporting RTK for establishment of geodetic control
- OPUS projects for manager’s training – transitioning from instructor-led to online, self-paced instruction and
- augmenting data exchange formats for OPUS of the future.
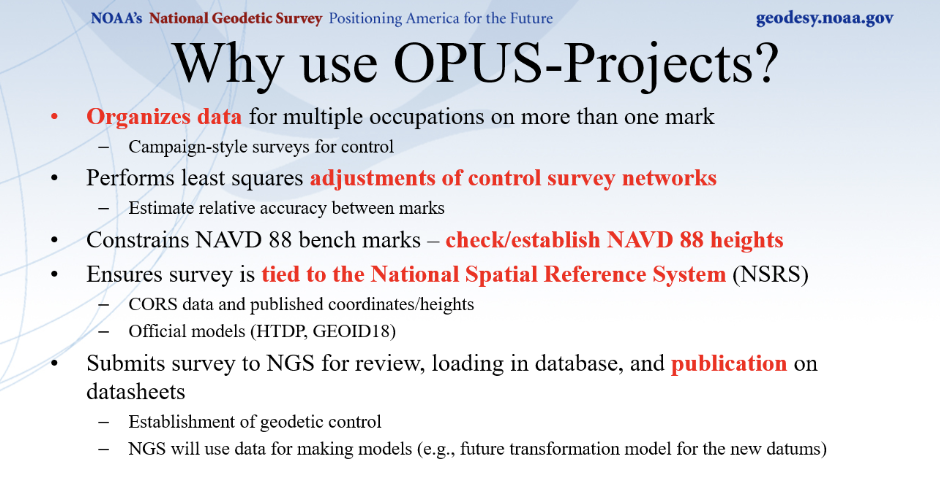
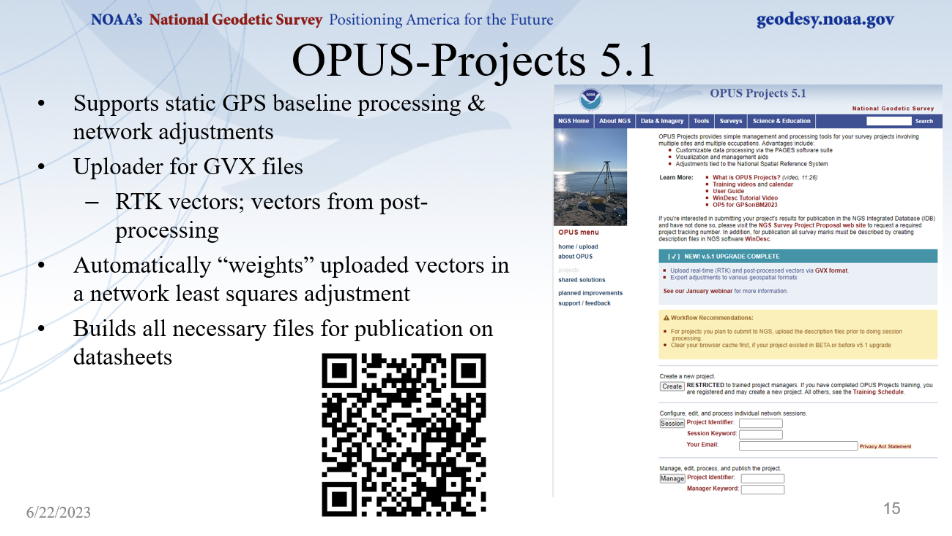
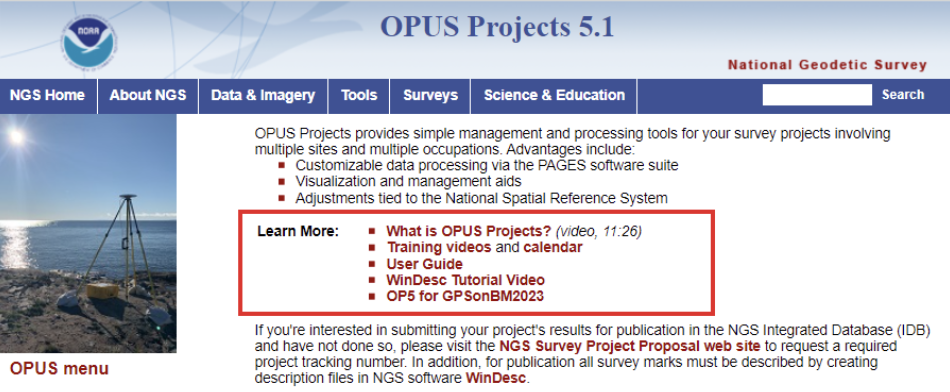
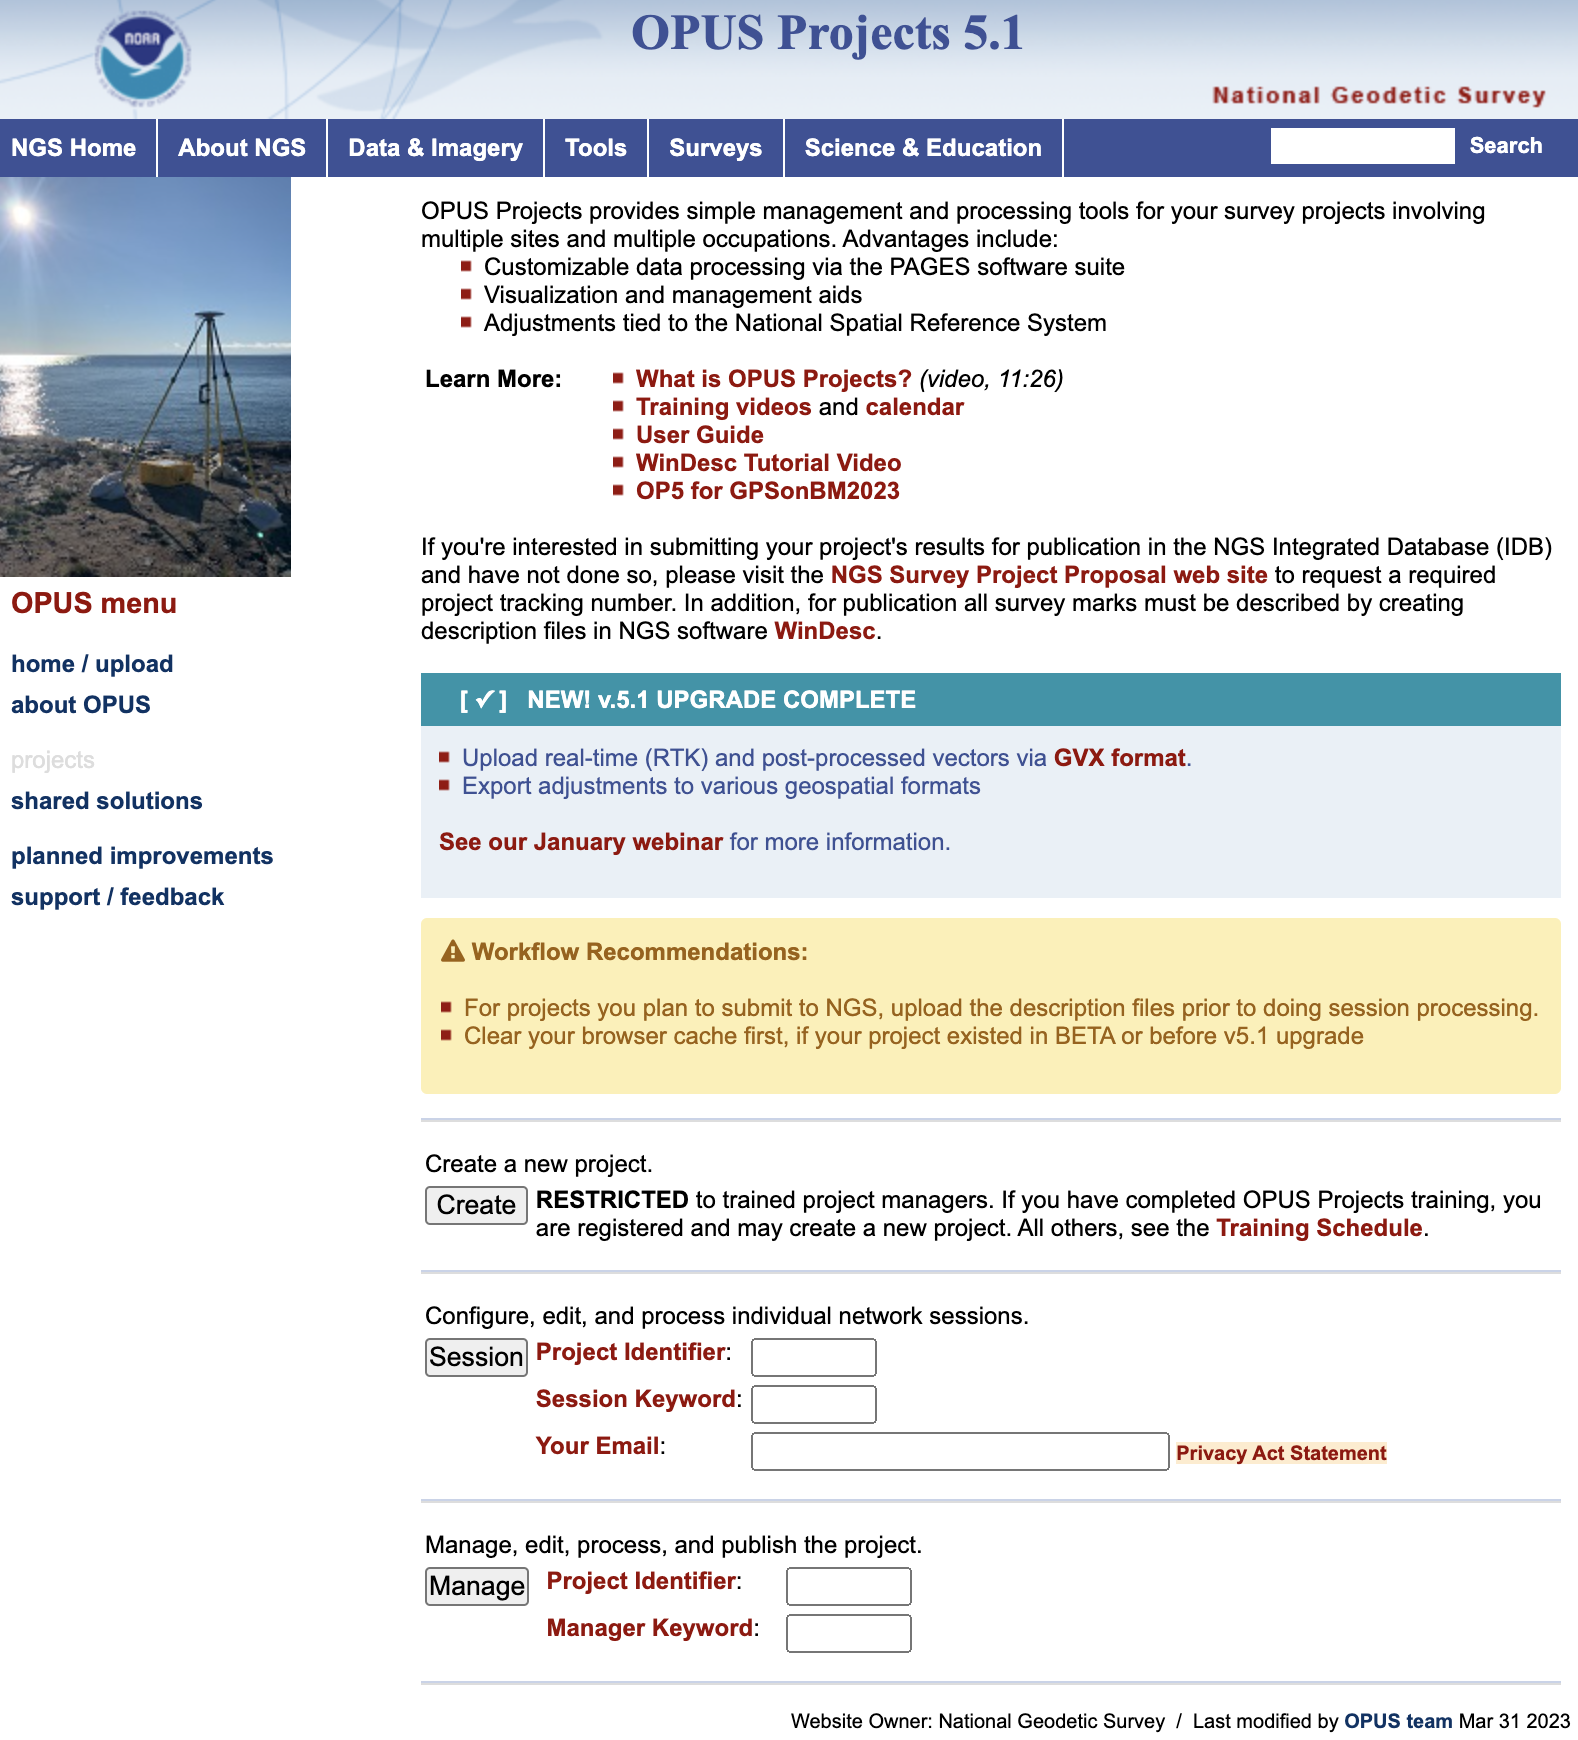
Dan Gillins gave a presentation on the advantages of using NGS’s OPUS-Projects 5 web routine. OPUS-Projects make it easier for users to submit a GNSS project to NGS for publication. I discussed OPUS-Project 5.1, when it was released as a Beta product, in my October 2021 column.
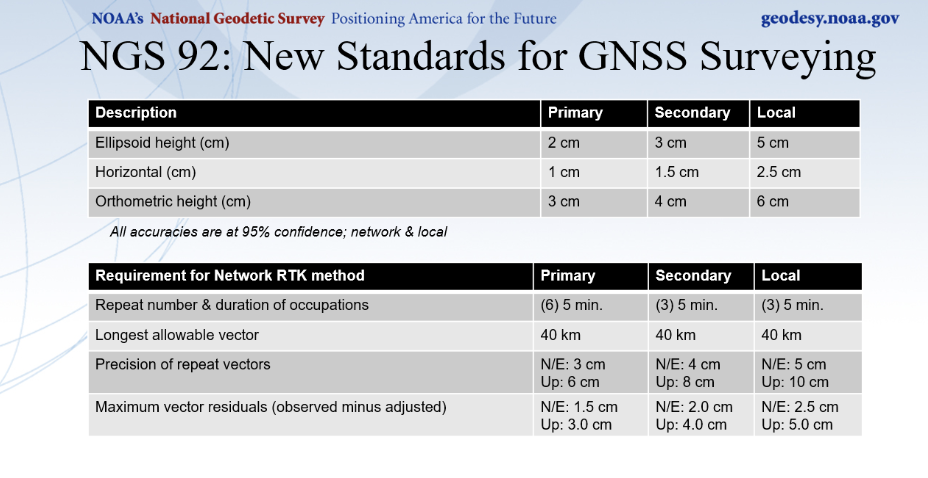
Gillins mentioned that a new publication providing guidance to meet standards for GNSS surveying is being reviewed and will be available soon. I discussed these new standards in my May 2023 column.
Another presentation titled “OPUS-Projects for Manager’s Training – Transitioning from Instructor-Led to Online, Self-Paced Instruction” by Erika Little, described how NGS is transitioning to providing OPUS projects training on an online, self-paced instruction site. NGS has training material available for OPUS-Projects.
Ryan A. Hardy gave a talk describing the new Geodetic Data Exchange (GDX). As previously mentioned, GDX is an XML-based data format that will be the input format for OPUS. GDX will be the successor to the GNSS Vector Exchange (GVX) format. GDX currently supports GNSS, classical, and leveling measurements.
The GDX structure will have the following fields[[these are clearly the names of database fields; if it were a list of different types of information, we would not put them in all caps and would not use the underscores]]:
- SOURCE_DATA
- PROJECT_INFORMATION
- PERSONNEL
- UNITS
- EQUIPMENT
- POINTS
- MEASUREMENT_SETTINGS
- MEASUREMENTS
- REDUCTIONS
- OBSERVATIONS
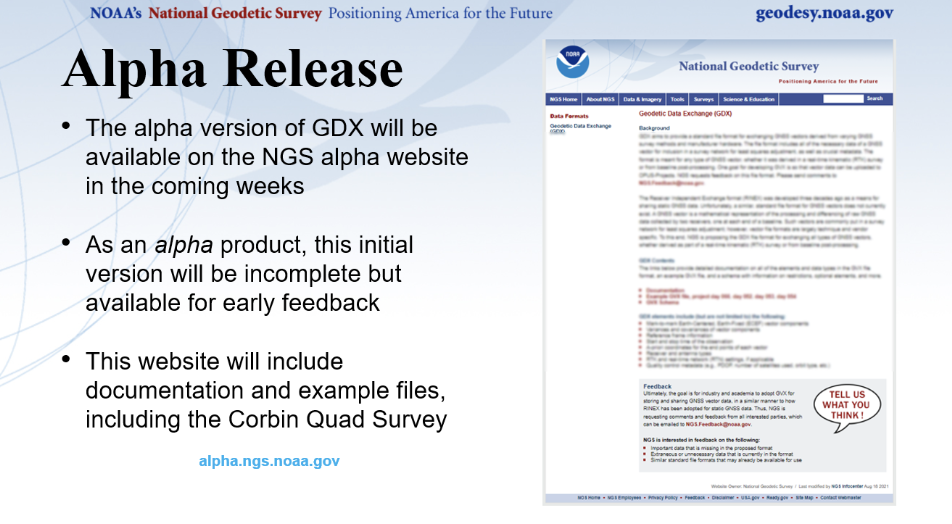
NGS is planning to release an alpha version of GDX soon.
The session titled “Case Studies of Surveys — NGS Does Now and How They will Change” addressed the following topics:
- implementing NGS OPUS-Projects’ GVX feature to align RTK vectors to the NSRS to establish geodetic control for FirstNet indoor mapping
- IGLD: a case study for leveraging digital tools to enhance QA/QC on large scale static GNSS observation campaigns
- geodetic leveling in the modernized NSRS and
- NGS field operations: modernizing in many ways.
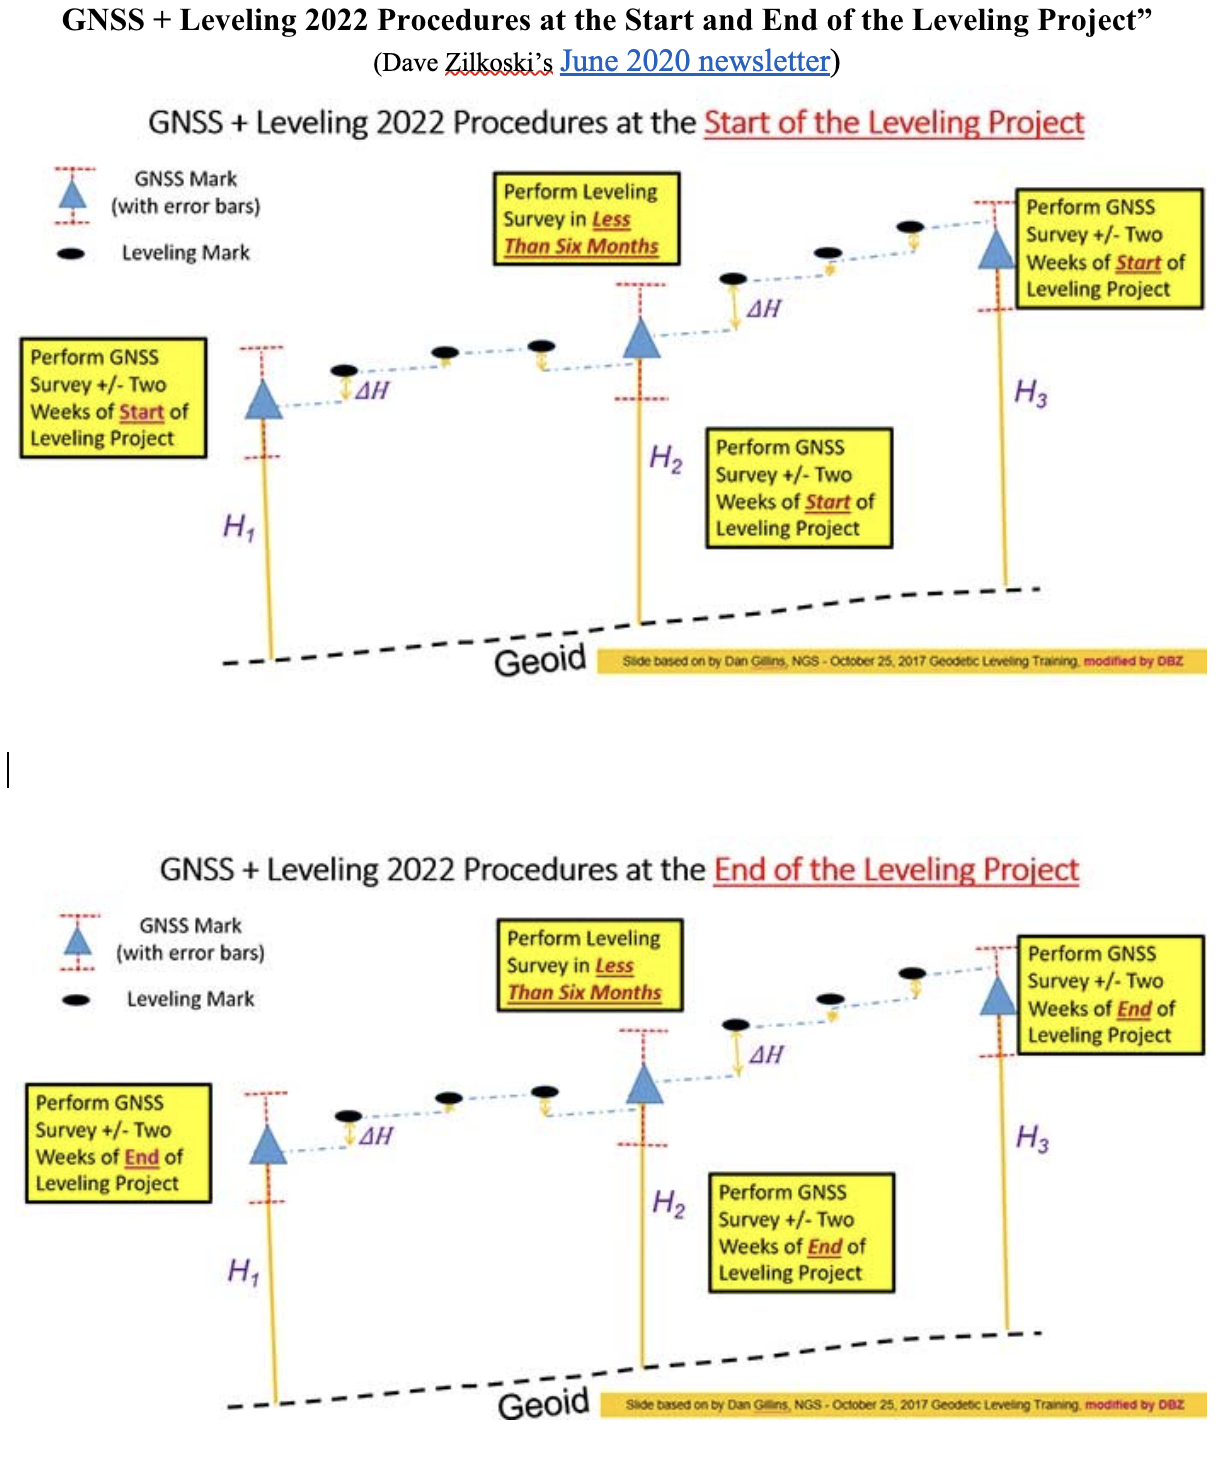
Ben Erickson gave a good presentation on leveling in the new NSRS, a topic about which I am very interested in knowing more[[Please avoid dangling participles, prepositions, conjunctions, and modifiers.]]. I discussed the new procedures in my June 2020 column.
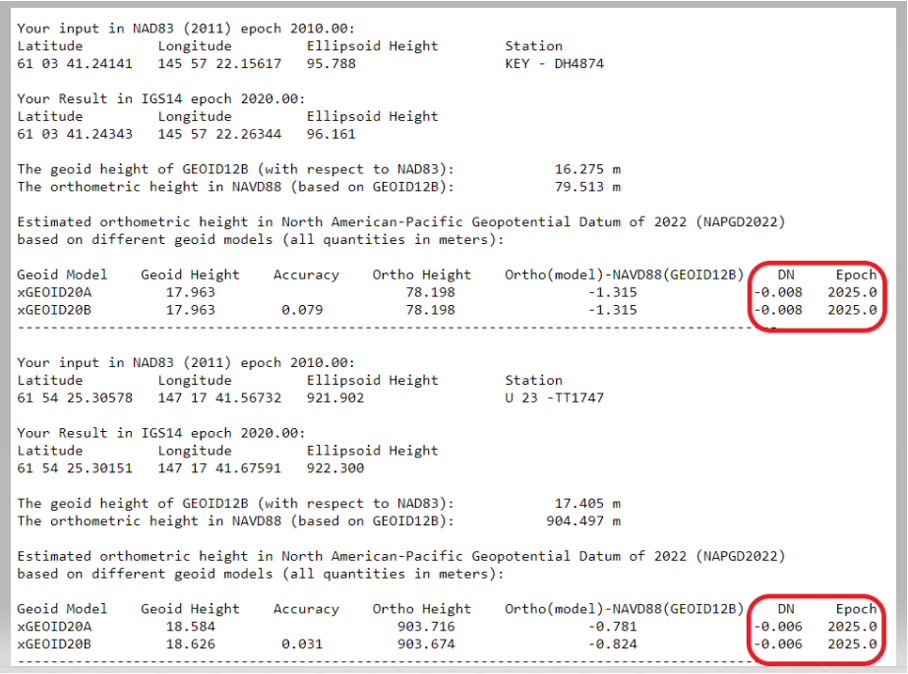
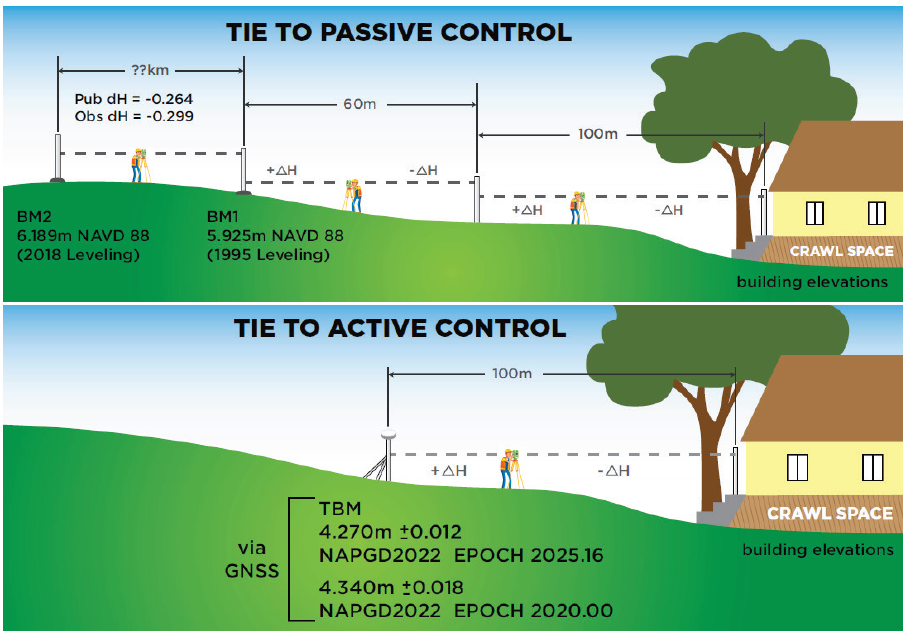
One major change is that leveling surveys will require GNSS occupations to ensure that orthometric heights computed in leveling surveys are up to date and are connected to the NSRS through the NOAA CORS Network. The network accuracy is obtained through GNSS data and a high-accuracy geoid model, and the local accuracy is provided through the leveling data. Specific procedures will be required to incorporate leveling data in the North American Pacific Geopotential Datum (NAPGD2022).
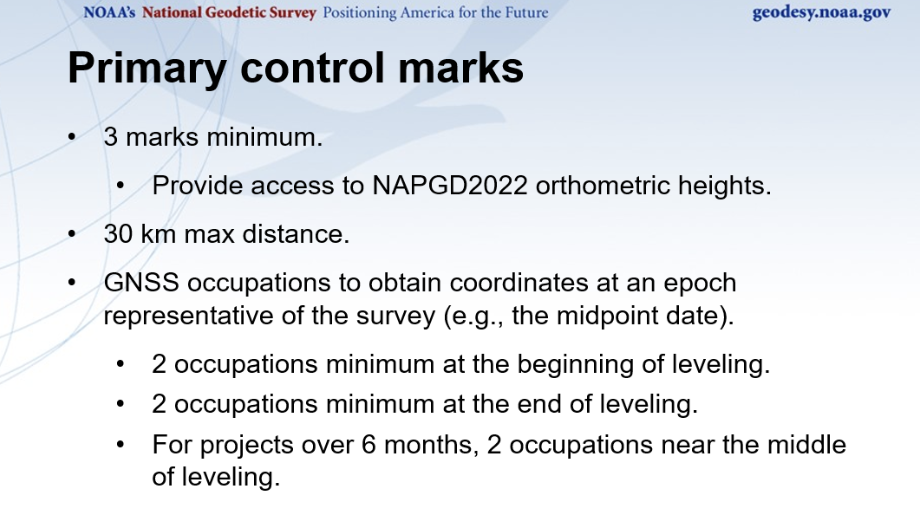
I discussed these procedures in more detail in my June 2020 column. The image below provides a conceptual diagram that illustrates what this means to a typical leveling project.
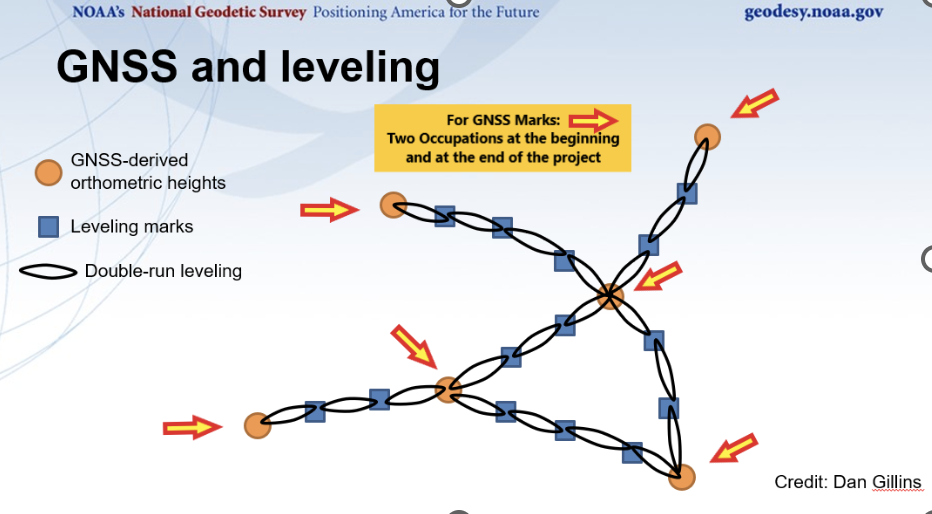
Erickson provided a diagram of a level network that contained a loop, which can be referenced below.
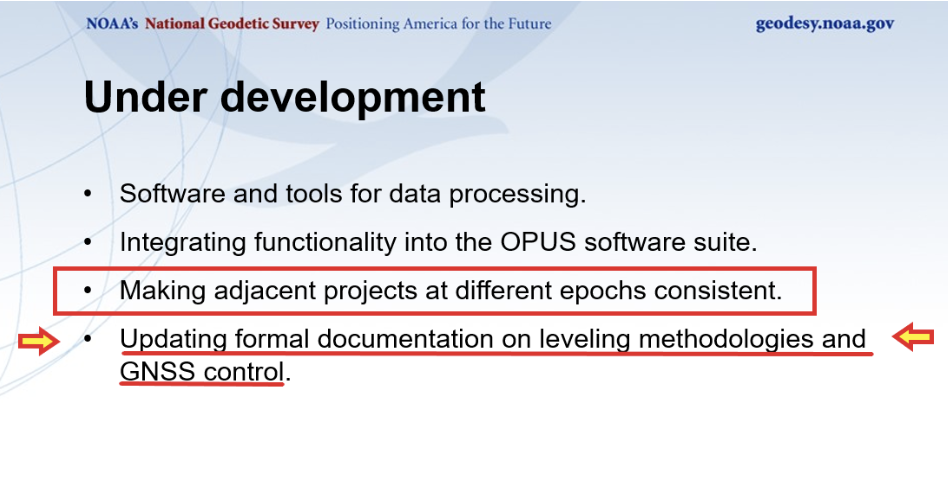
I have worked with leveling data for most of my career and I am pleased to know that NGS is going to provide tools to incorporate leveling data into the new, modernized NSRS. When performing leveling projects, there is a requirement to level to previously established benchmarks that were within a certain distance from the project. This helped to ensure that different leveling projects were consistent with each other. NGS stated that making adjacent projects at different epoch consistent is under development, and their plans include updating leveling documentation to explain the leveling methodologies and GNSS control.
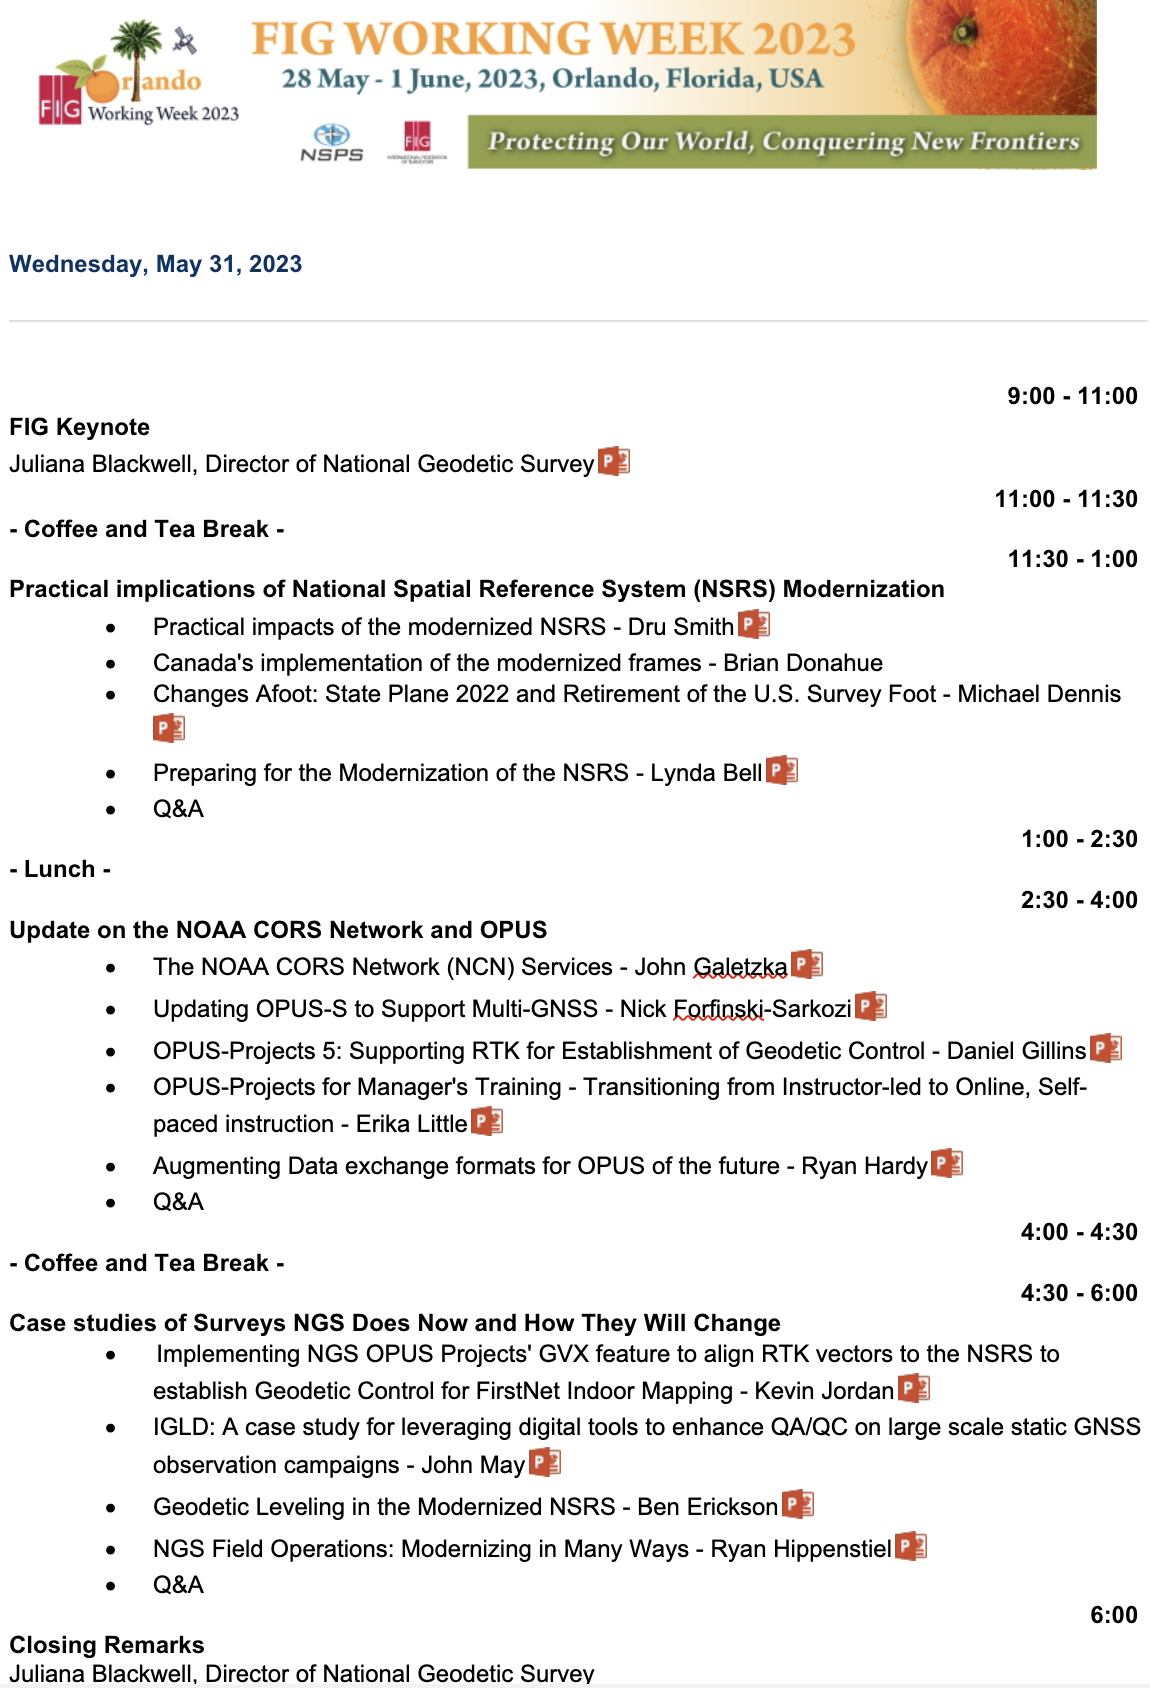
I have only highlighted a few of the presentations. It was an all-day session, and a lot of information was presented on the new, modernized NSRS. The presentations can be downloaded from the NGS website at https://geodesy.noaa.gov/datums/newdatums/fig-2023.shtml. I would encourage everyone to download the presentations to obtain the latest information on NGS’s modernization of the NSRS. See the image below for the list of presentations and the links to download specific presentations.


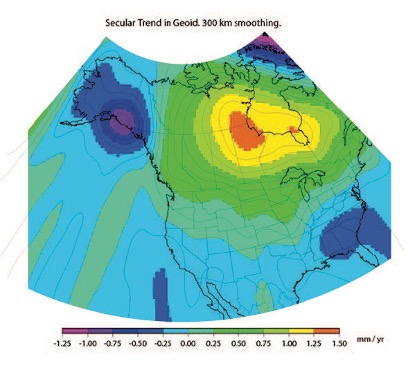
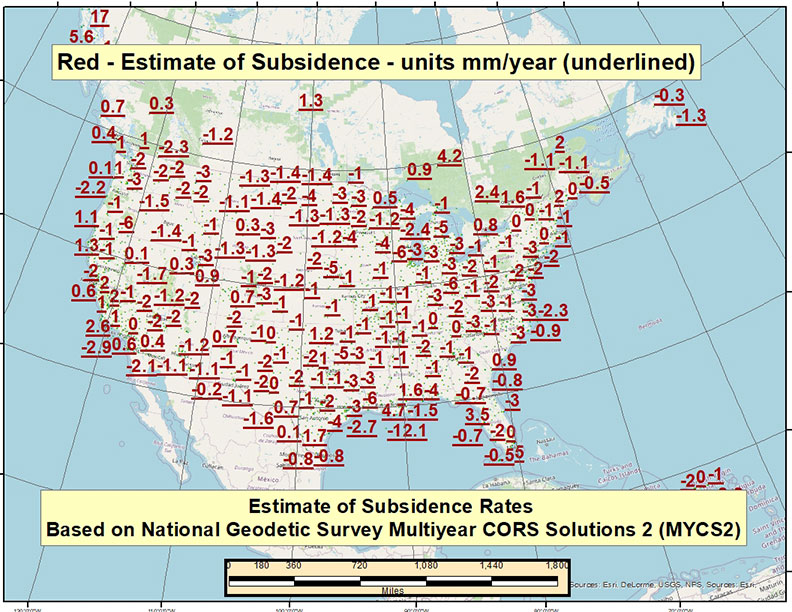
![Figure 32: Geoid rate over CONUS based on the GSFC mascon model [mm/yr] (Image: NOAA)](https://stage.globalpositioningnews.com/wp-content/uploads/2022/05/Geoid-rate-CONUS.jpg)
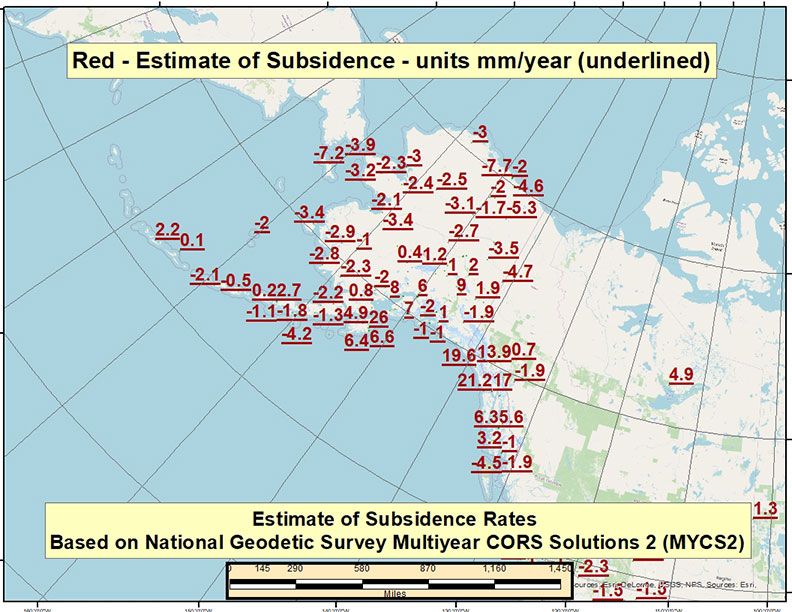
![Figure 33: Geoid rate over Alaska from GSFC mascon model [mm/yr] (Image: NOAA)](https://stage.globalpositioningnews.com/wp-content/uploads/2022/05/geoid-rate-alaska.jpg)


 Our reliance on state plane coordinate systems (SPCS) is at an all-time high with the sharing of data by various parties being more seamless than ever. The notion that a permanent monument’s positional values will be constantly changing is a head-spinner to most.