Tag: Oregon

  • Inside the new NSRS beta tools and a journey through geodetic history

    Inside the new NSRS beta tools and a journey through geodetic history

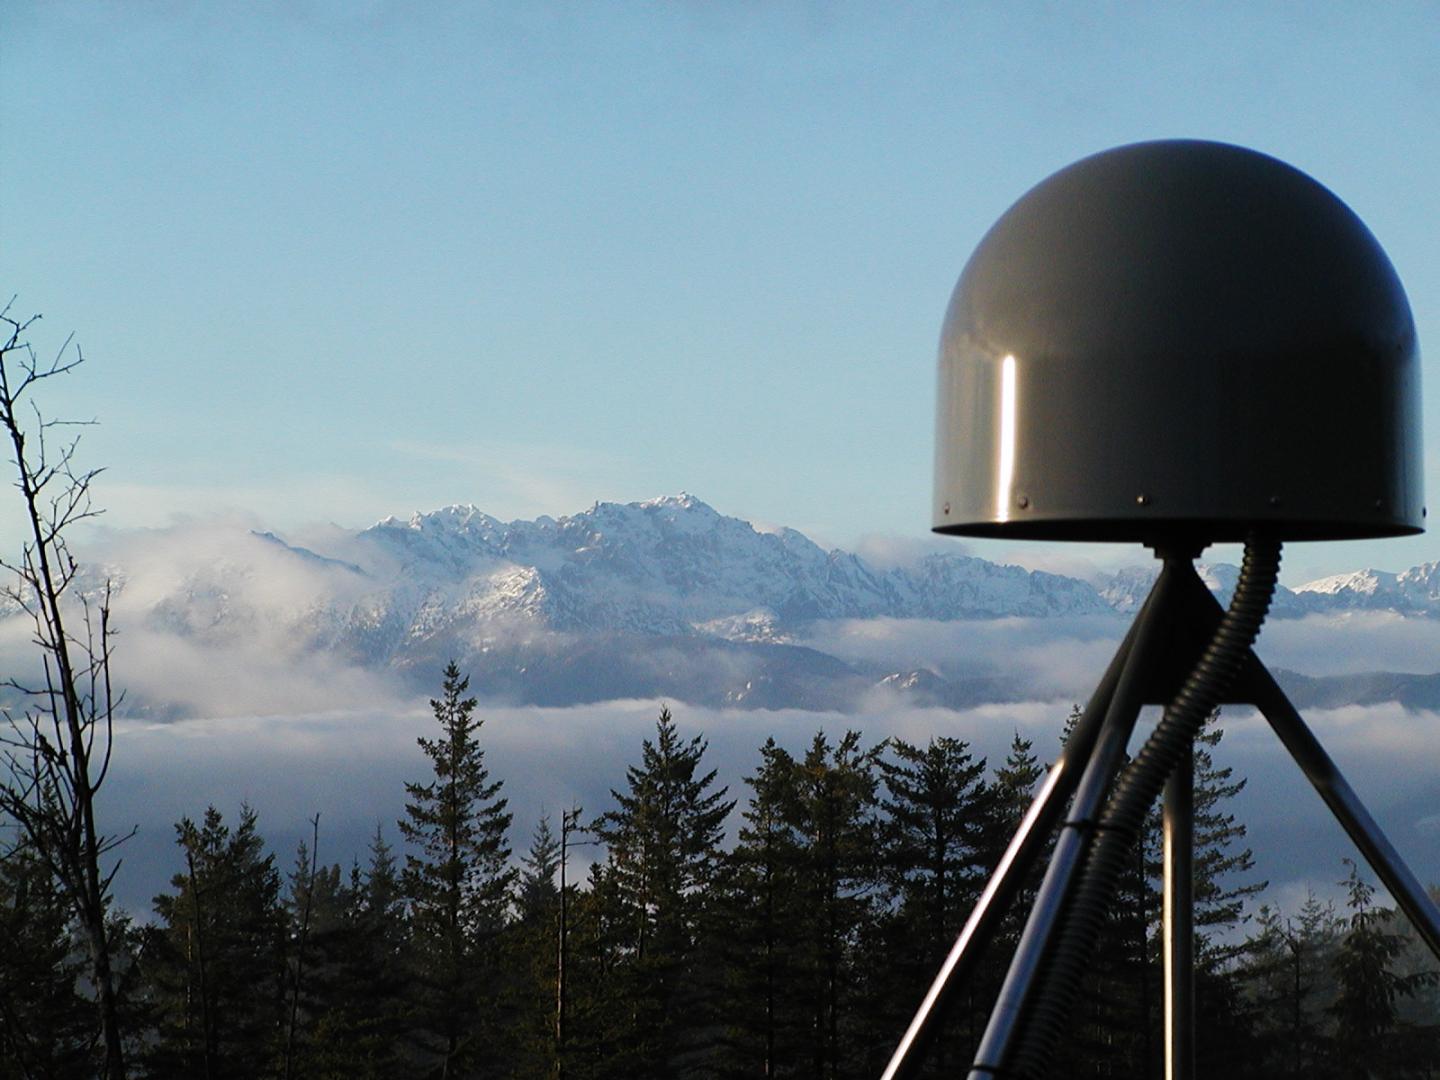
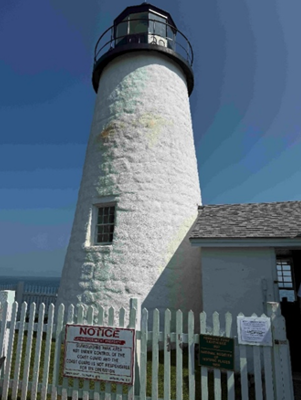
    This newsletter is going to highlight some history of the Coast and Geodetic Survey and provide the latest information on the National Geodetic Survey (NGS) new National Spatial Reference System (NSRS). First, every year my brother and I get together and travel to visit friends and relatives. He lives in Montana, and I live in North Carolina, so our yearly trips are typically 10 to 14 days long. As in all trips, I look for geodetic marks along the way. This year we traveled to coastal Maine to visit lighthouses and of course eat lobster rolls. We visited 12 Lighthouses along the Maine Coast. Lighthouses have both historical and navigational importance. The lighthouses were essential in guiding sailors through rocky shores. Portland Head Light commissioned by George Washington in 1791 is Maine’s oldest lighthouse and still guides vessels into Portland Harbor. We found NOS benchmark 841 8031 B 1979 on the grounds of this lighthouse. Pemaquid Point Lighthouse is managed by the Friends of Pemaquid Point Lighthouse, a chapter of the American Lighthouse Foundation, and remains an active aid to navigation under the ownership of the U.S. Coast Guard. We could climb up the Pemaquid Point Lighthouse, so I took a photo of the view from the top.

    Portland Head Light (Credit: Dave Zilkoski)
    Portland Head Light (Credit: Dave Zilkoski)

    One of my brother’s requests was to visit the first place in the continental United States to see the sunrise. However, the location of the first place in the continental United States to witness the sunrise depends on the time of year. As indicated in the box titled “First Places to See the Sunrise in the Continental U.S.” Mars Hill is the first place to witness the sunrise in June.

    Mark located on grounds of Portland Head Light. (Credit: Dave Zilkoski)
    841 8031 B 1979 — Mark located on grounds of Portland Head Light. (Credit: Dave Zilkoski)
    Pemaquid Point Lighthouse (Credit: Dave Zilkoski)
    Pemaquid Point Lighthouse (Credit: Dave Zilkoski)
    View from Pemaquid Point Lighthouse (Credit: Dave Zilkoski)
    View from Pemaquid Point Lighthouse (Credit: Dave Zilkoski)

    First Places to See the Sunrise in the Continental U.S.

    • October 7 to March 6: During these months, Cadillac Mountain in Acadia National Park, Maine, holds the distinction of being the first place in the continental U.S. to see the sunrise. Its elevation of 1,530 feet and eastern location make it ideal for early morning views. reddit.com+10nps.gov+10acadiamagic.com+10
    • March 25 to September 18: In the spring and summer, Mars Hill in Aroostook County, Maine, takes the title. Its northeastern position allows it to catch the first rays of sunlight during this period. newengland.com+2en.wikipedia.org+2aa.usno.navy.mil+2

    Around the Equinoxes: Approximately during the weeks surrounding the spring and fall equinoxes, West Quoddy Head in Lubec, Maine—the easternmost point of the contiguous U.S.—experiences the nation’s first sunrise. reddit.com+2en.wikipedia.org+2en.wikipedia.org+2


    That said, when we travel together, we always recover geodetic marks, so we chose to visit Cadillac Mountain even though in June the first place is located on Mars Hill in Aroostook County.  

    As many of you know, I worked for NGS for 35 years so reconning monuments is exciting to me. We found six marks in a radius of about two hundred meters on Cadillac Mountain. We will talk about them in a minute.

    Cadillac Mountain was important to me because from 1833 to 1898, the Coast and Geodetic Survey performed a triangulation project that extended from Calias, Maine, to New Orleans, Louisiana. The project was published as the Eastern Oblique Arc of the United States. The station Mount Desert 1856 that was located on Cadillac Mountain was part of this project. A report published in 1902 describes the Eastern Oblique Arc project and can be downloaded here.

    USCGS Special Publication Number 7. (Credit: USGS)
    USCGS Special Publication Number 7. (Credit: USGS)

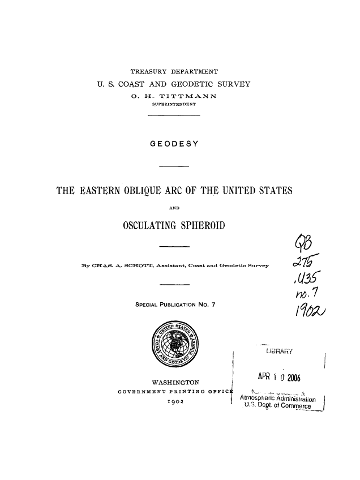
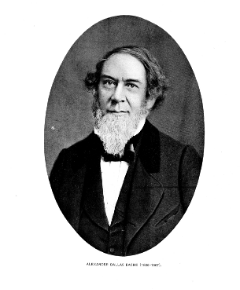
    According to the 1902 report, horizontal observations at station Mount Desert 1856 were acquired by Alexander Dallas Bache. That may not mean much to most people, but Mr. Bache was the second superintendent of the Coast Survey and was particularly important to the advancement of geodesy in the United States. As a side note, the Coast Survey was renamed the Coast and Geodetic Survey in 1878. The change reflected the agency’s expanded mission beyond coastal charting to include geodetic surveys of the nation’s interior, prompted by the growing importance of geodesy in its work.


    Bache’s leadership of the U.S. Coast Survey

    In 1843, Bache was appointed superintendent of the United States Coast Survey, succeeding Ferdinand Rudolph Hassler. Under his leadership, the Coast Survey expanded its missions to include hydrography, geodesy, topography, and the printing arts. He initiated geomagnetic studies, directed tide observers to make meteorological observations, and developed mathematical techniques for tide predictions and adjusting triangulation networks. Bache’s administrative skills transformed the Coast Survey into one of the foremost scientific organizations globally, providing critical data for navigation and commerce.

    Alexander Dallas Bache.
    Alexander Dallas Bache

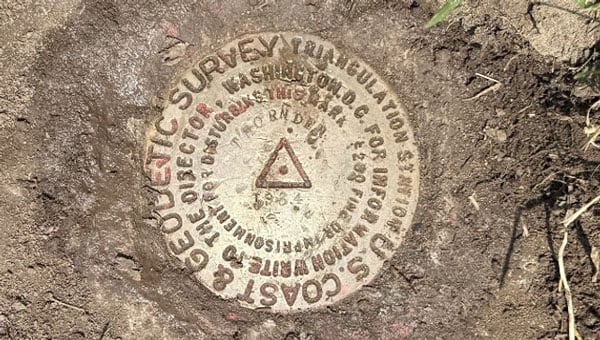
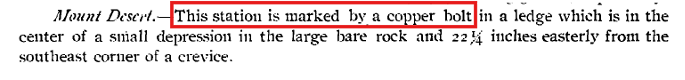
    According to the description of Mount Desert in the 1902 USCGS report, the station was marked by a copper bolt in a ledge (see the box titled “1856 Description of Mount Desert”). The 1902 description of the station on the NGS Datasheet stated that it was a hole drilled in a rock (see the box titled “1902 Description of Mount Desert”). I’m not sure why there is a discrepancy between the two descriptions but in 1931 the Maine Geodetic Survey found the drill hole, and based on measured references to other drill holes in the area that were documented in the original description decided that it was the location of the original station (see the box titled “1931 Description of Mount Desert”).  At that time, a Coast and Geodetic Survey Disk with Reference Marks were installed by the Maine Geodetic Survey.

    A description of Mount Desert from 1856. (Photo: NGS)
    A description of Mount Desert from 1856. (Photo: NGS)
    A Description of Mount Desert from 1902
    A description of Mount Desert from 1902.
    A description of Mount Desert from 1931.
    A description of Mount Desert from 1931.
    A description of Mount Desert from 1931.
    A description of Mount Desert from 1931.

    As I previously stated, we found six marks in the area. The boxes titled “Photos of Mount Desert 1856 and Reference Marks” and “Photos of Other Marks on Cadillac Mountain” provide photos of the monuments we found on Cadillac Mountain.  One may note that the reference mark 2 monument is in worse shape than the reference mark 1 and the Mount Desert monument. The 1944 recovery note stated that reference mark 2 was covered with roadway stone. There was not any stone covering reference mark 2 when I found it. Reference mark 1 is located behind some trees and out of sight of the path.

    When I arrived at the site, there were a group of people looking at reference mark 2. I held a little lecture on the importance of geodetic monuments and how this site was first occupied in 1856; and, of course, I highlighted the importance of geodesy.

    Photos of Mount Desert 1856 and reference marks. (Credit: Dave Zilkoski)
    Photos of Mount Desert 1856 and reference marks. (Credit: Dave Zilkoski)

    I was thrilled to stand in the very spot where Alexander Dallas Bache took geodetic measurements in 1856. [I know—people joke that I need to get a life, all because I get so fired up over geodetic monuments.]

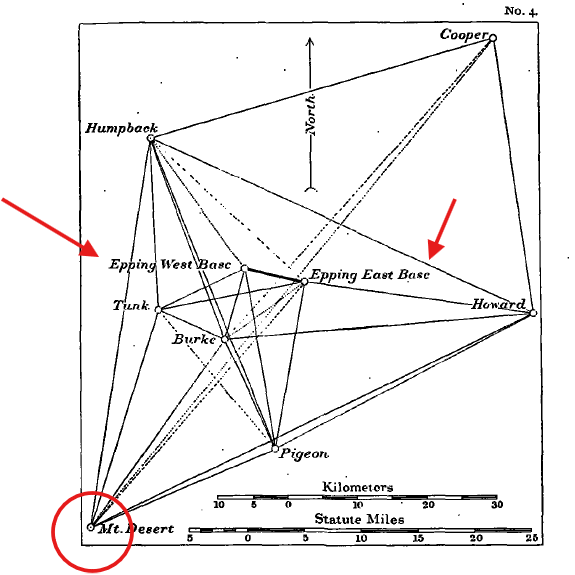
    The box titled “Abstract of Observations at Mount Desert” provides a summary of the directions from Mount Desert to the stations involved in this phase of the project. The box also includes a photo of an instrument, a 75 cm theodolite, which was used to perform the observations. The box titled “Diagram of Network Depicting Epping Base Line” provides a diagram that was included in the 1902 USCGS report.

    As a side note: during the 1970s as a NGS employee, I personally coded abstracts similar to this one to convert archival data into computer-readable form in support of the North American Datum of 1983 (NAD83) project. Once all data were in computer-readable form, they were reviewed for correctness and combined in an adjustment resulting in what is known as NAD 83 (1986).  See the NGS report for some details of the NAD 83 (1986) here.

    Abstract of Observations at Mount Desert (Credit: NGS)
    Abstract of Observations at Mount Desert (Credit: NGS)

    Diagram of network depicting Epping Base Line. (Credit: NGS)
    Diagram of network depicting Epping Base Line. (Credit: NGS)

    The other marks we found on Cadillac Mountain included a US Geological Survey Benchmark – K 24 1934, a bent pipe denoted as Cadillac Ground, and a Department of Interior Geological Mark – Cadillac 1975. All these marks are within a 200-meter radius of each other. My understanding is that Cadillac Ground was established because Mount Desert was obstructed by trees. I have provided weblinks for those that would like more information on these marks.

    Photos of other marks on Cadillac Mountain. From left to right, K 24 1934, Cadillac Ground and Cadillac 1975. (Credit: Dave Zilkoski)
    Photos of other marks on Cadillac Mountain. From left to right, K 24 1934, Cadillac Ground and Cadillac 1975. (Credit: Dave Zilkoski)

    After visiting more lighthouses along the Maine Coast, we traveled back to Boston and visited Waldon Pond and Thoreau’s family home. Why Thoreau you ask? In 2018, the Surveyors Historical Society and NSPS Foundation recognized Thoreau for his work as a surveyor by establishing a commemorative monument at Thoreau’s family farm.

    Thoreau described surveying as a “noble employment” that kept him close to nature: “Surveying … brings you within hearing of [the birds]” – https://www.heritagesurveys.com/famous-surveyors. Surveying and geodesy are indeed noble professions; they provide the foundation for all geospatial products and services.

    Photo of Commemorative Mark at Thoreau’s House. From left to right, Thoreau – A Surveyor, Thoreau Monument and drawing lines. (Credit: Dave Zilkoski)
    Photo of Commemorative Mark at Thoreau’s House. From left to right, Thoreau – A Surveyor, Thoreau Monument and drawing lines. (Credit: Dave Zilkoski)

    Finally, we left Boston for Syracuse to visit my younger brother and sister. I attended the SUNY College of Environmental Science and Forestry (SUNY ESF) which is immediately adjacent to Syracuse University campus. Both of my brothers attended Syracuse University, so we like to walk around campus whenever we visit Syracuse. During our trip to the University, we recovered the monument Thornden 1934. Thornden 1934 was significant to me because I recovered this monument over 50 years ago, as part of a special project that I performed for my geodesy class.

    Thornden 1934 (Credit: Dave Zilkoski)
    Thornden 1934 (Credit: Dave Zilkoski)

    I hope this was not too boring for you, but I real enjoy history and especially the history of the geodetic network of the United States. Today, you can use modern surveying technology to obtain a more accurate coordinate in seconds where it took days to months in the past. That is amazing!


    Now, what is the latest with the modernization of the National Spatial Reference System? On June 17, NGS announced that they incorporated four groups of NSRS modernization products to the NGS beta website.

    Multiple NSRS Modernization Products Published to Beta

    NGS has released the following four groups of products to the NGS beta website to solicit review and feedback from stakeholders as part of the modernization of the National Spatial Reference System (NSRS): (Note: These products are not final and should not be used for anything other than review and testing.)

    North American-Pacific Geopotential Datum of 2022 (NAPGD2022). This datum will replace the North American Vertical Datum of 1988 (NAVD 88) and all other vertical datums for islands in the United States. It will serve as a foundational component of the modernized National Spatial Reference System (NSRS), providing precise definitions for orthometric height (elevation). The release includes the defining grids that collectively make up the datum along with a number of supporting products to visualize the datum.

    Products. All NAPGD2022 products are provided as grids for the following: GEOID2022, DEFLEC2022, GRAV2022.

    Example coordinates. Coordinates and product values are computed for numerous example points throughout NAPGD2022 and provided in a table. NAPGD2022 Experience. Interactive online maps showing NAPGD2022 products for all regions that can be used on a computer or mobile device to query any location.

    Maps of NAPGD2022 products. Static map images of NAPGD2022 products for all regions.New Terrestrial Reference Frames of 2022 for North America (NATRF2022), Pacific (PATRF2022), Caribbean (CATRF2022), and Mariana (MATRF2022) plates. These four geodetic reference frames will replace the North American Datum of 1983 (NAD 83). They will serve as a foundational component of the modernized NSRS, providing precise definitions for geodetic latitude, longitude, and ellipsoidal height.

    Euler Pole Parameters of 2022. All of the new terrestrial reference frames are defined by transformation from the International Terrestrial Reference Frame of 2020 (ITRF2020) using Euler Pole Parameters (EPPs) that model tectonic plate rotation.

    State Plane Coordinate System of 2022 (SPCS2022). A system of map projections for accessing the modernized NSRS. Zone designs have been incorporated into the following beta products and services:

    Zone information tables. SPCS2022 zone definitions, example coordinate computation results, minimum and maximum coordinate values, and minimum coordinate differences with overlapping SPCS2022 zones and with other coordinate systems, provided as interactive tables that can be sorted and filtered.

    SPCS2022 Experience. Interactive online maps showing distortion for all SPCS2022 zones that can be used on a computer or mobile device to get distortion at any location or to view zone definitions.

    Maps of SPCS2022 zones and distortion. Static map images of SPCS2022 zone layers, number of zones, and distortion with performance statistics.

    NGS Coordinate Conversion and Transformation Tool (NCAT). This version can be used to perform SPCS2022 coordinate conversions at any location for all SPCS2022 zones. Later beta versions will include the ability to transform between reference frames and vertical datums.

    Products found on the NGS beta website are preliminary releases that are for testing and evaluation only; they are not final products nor do they contain any authoritative NGS data or tools. To provide feedback on any of the content on this site, please email [email protected].


    Everyone should review these products and provide their feedback to NGS. That said, my April 2025 newsletter highlighted the NAPGD2022 Alpha product that was moved to the Beta site. The Beta product is like the Alpha product, but it does not have an option for an interactive computation. The Interactive Computation Option provided essential information about NAPGD2022 and would be helpful to geospatial users for obtaining a better understanding of the differences between NADGP2022 orthometric heights and NAVD 88, and GEOID2022 geoid heights and hybrid GEOID18 geoid heights. My April 2025 newsletter highlighted the interactive computation option.

    Alpha interactive computation page (Credit: NGS)
    Alpha interactive computation page (Credit: NGS)
    Alpha interactive computation page (Credit: NGS)

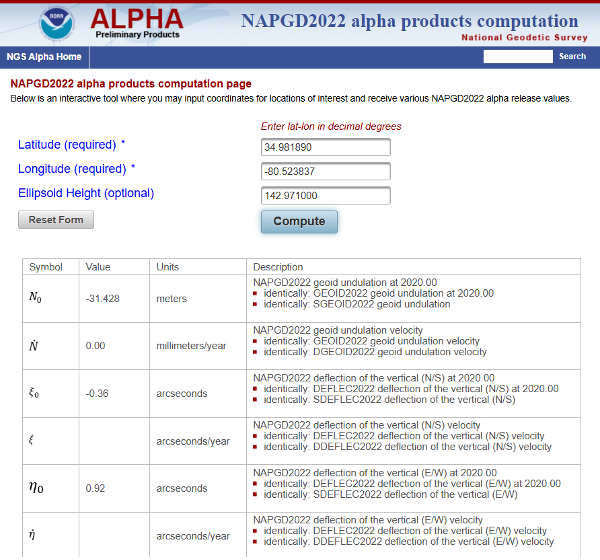
    As noted in my April 2025 newsletter, I downloaded the data and created my own maps to better highlight local variations. Although users can still view the original via the interactive online map, this personalized version offers clearer insights.

    Here are several of my comments on the Beta products based on my preliminary review:

    • The NAPGD2022 difference map (NAPGD2022 minus Historical in meters) uses 25 cm intervals, which are too coarse to reveal the finer local variations between published benchmarks accurately.
    • The NAPGD2022 Difference map should have an overlay of the marks used in the creation of the difference map. This would allow users to identify marks in their region of interest. Clicking on a mark should link to the NGS datasheet and Passive Mark Page.
    • The beta page for NATRF2022, PATRF2022, CATRF2022, and MATRF2022 is not particularly helpful for everyday geospatial users. There should be an Interactive Computation Option to enter NAD83 (2011), epoch 2010 coordinates where the routine transforms the coordinates into ITRF 2020, epoch 2020, as well as estimates in the new terrestrial reference frames – NATRF2022, CATRF2022, PATRF2022, and MATR2022.
    • Both the State Plane Coordinate System of 2022 (SPCS2022) and The NGS Coordinate Conversion and Transformation Tool (NCAT) are good tools for users to obtain an understanding of the differences and changes in the SPCS especially for their State. That said, like above, there should be an option to enter NAD83 (2011), epoch 2010 coordinates where the routine will transform the coordinates into ITRF 2020, epoch 2020, as well as estimates in the new terrestrial reference frames – NATRF2022, CATRF2022, PATRF2022, and MATR2022. The routine does have a note that states users can transform their coordinates using HTDP, but NGS should incorporate this process in the NCAT beta product.
      • Note from Beta NCAT product: This beta version of NCAT supports beta State Plane Coordinate System of 2022 (SPCS2022) but not transformations between reference frames or geopotential datums. NAD 83 latitude and longitude can be used as input, but the output coordinates will differ horizontally from actual SPCS2022 by up to a few meters, depending on location (likewise for UTM and USNG). If NAD 83 ellipsoid heights are used, the linear distortion and combined factor will differ from SPCS2022 values by a small amount, within ±0.3 parts per million (ppm). To reduce these differences, NAD83 epoch 2010.0 coordinates can first be transformed to ITRF2020 epoch 2020.0 using the Horizontal Time-Dependent Positioning (HTDP) tool.

    I plan to provide these comments to NGS through their feedback email process. Everyone should take time to review these products and provide your feedback to NGS. Remember, NGS placed these four groups of products on the NGS beta website to solicit review and feedback from stakeholders as part of the modernization of the National Spatial Reference System (NSRS) process. Users should review these Beta products and consider two questions:

    1. Do these products provide sufficient information and detail for documenting how I will deliver my products and services under the new NSRS?

    2. Do I need additional information or tools from the NGS to better understand the changes and impacts of the new NSRS?

    Your feedback will help NGS improve the Beta products.

  • NV5 Geospatial maps North American shorelines and riverine environments

    NV5 Geospatial maps North American shorelines and riverine environments

     NV5 Geospatial has mapped more than 26 million acres of North America’s shoreline and riverine environments across more than 200 projects.

    The projects have spanned from the Nuyakuk River in Alaska, Lake Tahoe in California, the Rio Grande in Texas, the entire coasts of South and North Carolina, the Achigan River in Quebec, Chesapeake Bay in Maryland and the Florida Keys.

    In 2022, the company mapped and acquired topobathymetric lidar data for 14 projects including the Yellowstone River, Wyoming; Hells Canyon, Indiana; Revillagigedo Island, Alaska and Iles de la Madeleine in Quebec.

    NV5 Geospatial first mapped these environments in 2012 using high-resolution bathymetric lidar and natural color imagery. The company mapped 34,051 acres of shoreline along the Sandy River, located in northwestern Oregon, to study the ever-changing basin geomorphology.

    NV5 has also signed a two-year contract with the National Geodetic Survey of the National Oceanic and Atmospheric Administration to provide topobathymetric lidar, 4-band imagery and mapping of 3,115 sq miles of the Maine shoreline.

    “For a decade we have been helping local, state, and federal government agencies as well as commercial and private entities gain the insights they need to solve some of their most challenging nearshore and riverine projects through our mapping technologies including topobathymetric lidar,” Kurt Allen, vice president of NV5 Geospatial, said. “Whether it be mapping the shoreline after a hurricane, updating the national shoreline, assisting water boards with flood planning, or hundreds of other possible use cases, we are constantly improving our technology and scalability to always be at the ready for our customers.”

  • Amazon shows how it’s building drone delivery system

    Amazon shows how it’s building drone delivery system

    Amazon has put out a video to show how the company is building its drone delivery service. The fully electric drones are designed to deliver packages under 5 pounds to customers in less than 60 minutes.

    Later this year, customers living in Lockeford, California and College Station, Texas will be among the first to receive Prime Air drone deliveries.

    Three components are integral to the system:

    • The drone itself, which Amazon said is as robust and reliable as its ground transportation trucks.
    • A sense-and-avoid system for obstacles such as other aircraft, people and pets in backyards.
    • An automated drone-management system to plan flight paths and ensure safe distances between the drones and  other aircraft in the area, and ensure compliance with aviation regulations.

    Amazon has been developing its drone delivery system for almost a decade, employing experts in safety, aerospace, science, robotics, software, hardware, testing and manufacturing.

    Below is an inside look at an Amazon flight-testing facility in Oregon.

    Photo: Amazon
    Photo: Amazon

    Photo: Amazon
    Photo: Amazon

  • US West Coast now has access to GNSS-powered ShakeAlert app

    US West Coast now has access to GNSS-powered ShakeAlert app

    After 15 years of planning and development, the ShakeAlert earthquake early warning system is now available to more than 50 million people in California, Oregon and Washington, the most earthquake-prone region in the conterminous U.S.

    ShakeAlert provides alerts to the general public through public alert systems such as TV, radio and mobile phones. It also slows down trains, opens firehouse doors, closing water and gas valves and

    May’s addition of Washington State to the system completes the U.S. Geological Survey and partners’ West Coast rollout of ShakeAlert.

    ShakeAlert first launched in California in 2019 and expanded to Oregon in March of this year. People in all three states can now receive alerts from FEMA’s Wireless Emergency Alert system, third-party phone apps, and other technologies.

    The ShakeAlert system relies on sensor data from the USGS Advanced National Seismic System. ANSS is a USGS-facilitated collection of regional earthquake monitoring networks operated by partner universities and state geological surveys on the West Coast and throughout the nation.

    Part of that data comes from GPS, which the USGS uses to measure crustal deformations over time. The USGS measures the precise position (within 5 mm or less) of GNSS stations near active faults relative to each other.

    USGS works closely with ANSS partners and state emergency management agencies on the system’s development as well as public communication, education and outreach.  “USGS science is the backbone of hazard assessment, notification, and response capabilities for communities nationwide so they can plan for, and bounce back from, natural disasters,” said David Applegate, associate director for Natural Hazards Exercising the Delegated Authority of the USGS Director.


    See also:

    Early earthquake warnings: GNSS could enable 10-second alerts


    “Systems powered by ShakeAlert can turn mere seconds into opportunities for people to take life-saving protective actions or for applications to trigger automated actions that protect critical infrastructure,” Applegate said. “An effort like this takes the dedication, ingenuity and hard work of dozens of partners with the same vision, and the USGS is proud to have been part of a collaborative team that made this robust public safety system available for millions of citizens on the West Coast.”

    The ShakeAlert earthquake early warning system can save lives and reduce injuries by giving people time to take protective actions like drop, cover and hold on before potentially dangerous earthquake shaking arrives at their location.

    In addition to supporting public alerts to mobile phones, ShakeAlert system data has, since late 2018, been used to develop applications that trigger automated actions. Automatic actions can be used to slow down trains to prevent derailments, open firehouse doors so they don’t jam shut and close valves to protect water and gas systems.

    The technology will continue to improve over time with the addition of more seismometers to the network, by expanding alert delivery area and by improving messaging speeds.

    A GNSS station in the Pacific Northwest geodetic array. (Photo: Central Washington University)
    A GNSS station in the Pacific Northwest geodetic array. (Photo: Central Washington University)

  • Using contact tracing and GPS to fight spread of COVID-19

    Using contact tracing and GPS to fight spread of COVID-19

    Tracing Location

    Contact tracing can help stem the spread of the COVID-19 pandemic. It involves tracking the movement and interactions of infected individuals to identify others at risk.

    National and regional responses to the COVID-19 pandemic have included containment through quarantine and restriction of movement. When properly implemented, these solutions limit spread of the contagion to prevent it from overwhelming healthcare and emergency management systems.

    According to the World Health Organization, the Centers for Disease Control and Prevention, and virtually all medical professionals, any effective strategy to return the world to normal requires three components: testing, contact tracing and isolation.

    While testing to find the people who are infected is the absolute top priority, contact tracing is vital for stopping a disease from spreading out of control. It involves tracking the movement and interactions of infected individuals to identify others at risk. Any positive test without contact tracing is bad public health — it misses an opportunity to reduce the spread of the virus.

    While the concept of contact tracing has just entered popular consciousness, it has been a standard public health tool for a century. For example, in the 1930s, Great Britain used it to contain the incidence of sexually transmitted infections. In the 1960s and 1970s, South American, African and Asian countries used it to eradicate smallpox. Additional diseases for which contact tracing is performed include tuberculosis, measles, HIV, Ebola, bloodborne infections, serious bacterial infections and novel infections.


    What Is Contact Tracing?

    The World Health Organization describes three basic steps:

    • Contact identification. Those who have been in contact with someone who has been confirmed to be infected are identified, by asking about their activities and those of the people around them.
    • Contact listing. All persons who have had contact with the infected person are informed of their status and told to receive early care if they develop symptoms.
    • Follow-up. Contacts are monitored for symptoms and tested for signs of infection.

    In some cases, quarantine or isolation is required for high-risk contacts.


    The enormous dimensions of the current pandemic, however, challenge traditional models of contact tracing, which are very resource intensive. In search of a technological assist, several Asian countries already have been taking advantage of the functionalities of smartphones to scale up contact tracing to match the pandemic’s rate of growth, such as the Trace Together app built by the Singapore government. Companies and organizations around the world are following suit, including Britain’s National Health Service, a pan-European initiative, and an unprecedented joint venture by Apple and Google.

    Automating Contact Tracing

    A study published on March 31 in Science concluded that “viral spread is too fast to be contained by manual contact tracing but could be controlled if this process [were] faster, more efficient and happened at scale.” A contact-tracing app that memorizes close contacts and immediately notifies users if they have had contact with infected individuals, prompting them to self-isolate, could control the pandemic without need for mass quarantines if enough people used it, the study argues.

    Privacy versus Protection. A similar app has been deployed in China, where people are required to use it to be allowed to move beyond their neighborhood, enter public spaces, or use public transport. A central database collects data on each user’s movement and coronavirus diagnosis, artificial intelligence analyzes these data, then the app displays a red, amber or green code that determines the user’s freedom of movement. This app has been credited with significantly helping China suppress the pandemic, but has been criticized for its disregard for data protection and privacy.

    Relying on fundamental epidemiological principles and common smartphone functionality, the Science study authors designed a simple algorithm to replace manual contact tracing. “Coronavirus diagnoses are communicated to the server, enabling recommendation of risk-stratified quarantine and physical distancing measures in those now known to be possible contacts, while preserving the anonymity of the infected individual.” Symptomatic individuals could use the app to request testing, and everyone could use it to access COVID-19-related health services, information and instructions, or even to request deliveries of food or medicine during self-isolation.

    Public trust in the app and how the gathered data are used would be critical to its success. The study’s authors lay out a series of requirements for its ethical implementation, then point out that “the algorithmic approach we propose avoids the need for coercive surveillance, since the system can have very large impacts and achieve sustained epidemic suppression, even with partial uptake.”

    The authors of a similar article in the journal JMIR mHealth and uHealth write that a contact-tracing system can limit any central coordination to notifying users who have been in contact with an infected person. Their core idea is that it does not matter where someone contacts an infected person, only that they were in close enough contact to risk infection. Particularly sensitive location data, such as GPS or phone cell data, “is actually neither necessary nor useful.” No one learns who the user is because the app is not linked to an identity, and it neither records nor stores location data.

    The authors argue their proposed app is the most effective epidemiologically because it would determine which people were in close proximity, and it would receive user cooperation. “Only if people trust a system — because it does not spy on them — will the system find broad support in the population.”

    GPS, Bluetooth or Both?

    Technologically, the concepts of location and proximity are embodied in two standard smartphone components: GPS receivers and Bluetooth transceivers. GPS-derived location data makes it possible to map and analyze the movements of individuals and of large numbers of people; for example, it is how we know that many in this country have begun relaxing social distancing rules ahead of the lifting of legal mandates. Bluetooth’s use of low energy, generally a drawback, becomes an advantage here because it can tell us whether two or more people have been within 1.5 to 2 meters of an infected person for at least 10 to 15 minutes — when the risk of infection is highest. This knowledge can enable newly infected, pre-symptomatic people to self-isolate and not infect others.

    Numerous companies are developing and proposing smartphone-based contact tracing apps.

    Vesedia Mobile Technologies proposes that people who test positive to COVID-19 be asked to provide information about public places they visited in the preceding days and at what times, using their phone location history for verification. The information would be anonymized by healthcare officials, and entered into a database that would be publicly accessible via a website and mobile app.

    Ramesh Raskar. (Photo: MIT/John Werner)
    Ramesh Raskar. (Photo: MIT/John Werner)

    Intersections. The COVID Safe Paths phone app and the Safe Places browser tool for contact tracers were created by Ramesh Raskar and other researchers at the MIT Media Lab. If a user tests positive and consents, his or her data is uploaded, redacted by healthcare authorities to remove any personally identifiable information, and downloaded by the app.

    The app then performs “intersections” — it identifies and notifies people with whom the infected person has crossed paths. By clicking on intersections, users can display their timeline for the past 14 days, in a calendar view, which tells them how many intersections have occurred each day.

    The app also provides news reports from authorized local news channels, based on each user’s position or if they tap the URL for their local healthcare authority, said Abhishek Singh, the program’s tech lead, who is helping with the app’s development.

    “We are also building an interoperable architecture,” Singh said. “Because there are many contact tracing apps already in the wild, we want to make sure that they have some common standards and guidelines that enable them to utilize data from other apps securely and through consent.” More than 1,200 people are voluntarily contributing to the project. “It is being led by the open-source community, and all our source code is out there and anybody can contribute,” Singh said.

    Safe Places is helping health authorities by making the data and insights visible, enabling them to make the right decisions such as targeting resources to areas that need them most, helping them impose restrictions such as lockdowns, or reopen the economy. “The economy will not reopen in a single burst, but step by step.” Singh said. “A dashboard that allows them to monitor where the infection is spreading and where it has been contained helps them decide where to take which steps.”

    The GPS Advantage. The uptake required for GPS-enabled contact tracing to be successful is generally lower than for Bluetooth-based contact tracing, Singh argues, citing an Oxford University simulation. “With GPS, you do not need people to have the app already downloaded for it to be effective,” he points out. A person who tests positive for the virus can use the Safe Place web tool to manually create a GPS trail and help healthy people. This is one of the biggest advantages of GPS compared to Bluetooth, because the latter requires exchanging information directly through the hardware, which cannot be done after the fact.

    Because the app is open source, any government can deploy it using its own IT infrastructure. However, a government that wants to adopt Safe Paths must sign a letter that commits it to complying with privacy and ethical guidelines. Preventing authoritarian governments and nosy employers from requiring people to use this app and reveal their data requires stringent guidelines as to how it is deployed and who can access the data, Singh said.

    Apple and Google Join Forces

    Apple and Google have joined in an unprecedented alliance to develop a system for notifying people who have been near others who have tested positive for COVID-19. Eight out of 10 people in the United States own smartphones, and the two companies’ operating systems run more than 99% of them. Apps built directly into iOS and Android, especially if interoperable, could dramatically increase the reach of public health authorities (the only organizations that would receive the data). To avoid fragmentation and encourage wider adoption, Apple and Google will allow only one app per country to use their system, but will allow U.S. states to use it and support countries that opt for a state or regional approach.

    The system will use Bluetooth signals from phones to detect encounters rather than GPS location data. It will not run ads, will require users to opt-in, be decentralized, and use randomized IDs not tied to a user’s actual identity to communicate potential contacts with individuals with a confirmed positive COVID-19 diagnosis.


    With GPS, you do not need people to have the app already downloaded for it to be effective.


    API Coming. On May 20, Apple and Google released an API to developers. Next, they will issue a system update to build in contact tracing at the OS level. Should a user’s phone notify them of a possible contact, they will be prompted to download and install a public health app from their local health authority to obtain trusted instructions.

    Developers of coronavirus-related apps for several U.S. states have argued that GPS location data is vital to identify infection hotspots and track outbreaks. However, for various technical reasons, workarounds designed to bypass the decision by Apple and Google and collect GPS data in connection with their contact tracing system would work poorly.

    Ethical and Equity Concerns

    “The work that we are doing for COVID-19 is pretty similar to work that we do on a routine basis with other reportable communicable diseases,” said Lisa Ferguson, nursing supervisor for Communicable Disease Investigations and Case Management for Multnomah County, Oregon, which includes the city of Portland. Most commonly, her unit is notified of illnesses by the state database, which receives electronic lab reports. “We assign that as a case to somebody on our team, and they call the person, interview them, ask some questions about their illness, their symptoms and where they could have possibly been exposed,” Ferguson explained. “Then, they talk about who that person might have exposed and where they were from two days before they became sick up until the time of the interview or the time that their symptoms were resolved.”

    The Multnomah County, Oregon, Disease Detection Team. (Photo: Multnomah County, Oregon)
    The Multnomah County, Oregon, Disease Detection Team. (Photo: Multnomah County, Oregon)

    How could technology — such as smartphone location data — best help Ferguson’s team conduct contact tracing for COVID-19? “In the public health world, we are not used to having access to technology in that way,” she said. “We need to have some ethical discussions before we are prepared to utilize something like a technology that can track people.” Also, unlike tracking measles, which requires knowing whether someone was in an airspace and who was there after them, “We do not automatically consider someone to have been exposed if they were in the same airspace as someone who tested positive.”

    If the privacy concerns could be adequately addressed, receiving a list of all the people who were less than six feet away for at least 10 minutes from someone who had tested positive could help her team scale up, Ferguson said. Her team would then reach out to those people, using such language as “You may have been exposed,” and “Please watch yourself closely.”

    Ferguson’s team always has “equity concerns,” fearing they might under-identify groups that do not have access to the technology. “It is a supplemental tool, but it certainly would not replace the work that we are doing,” she said.

    Help Wanted

    Safely reopening the United States will require a new workforce of at least 100,000 contact tracers, according to a report from the Johns Hopkins Center for Health Security and other experts. Any technological assist to contact tracing does not diminish this need. For example, smartphone alerts can help filter out those at low or no risk so that human tracers can focus on genuine cases, people at higher risk, or those who are harder to contact.

    Two out of 10 people in the United States do not own a smartphone, and only 42% of those above the age of 65 — who suffer 80% of the deaths from COVID-19 — do, according to a 2017 Pew Research Center poll. Hardly any homeless people own a smartphone. Among those most vulnerable to the pandemic are immigrants who do not speak English and are fearful of efforts to collect their personal information, strengthening the need for this to be done in person by trusted community members.

    Finally, even if Google and Apple’s automated service is widely adopted and works well, it will require many thousands of health workers to conduct tests and follow-ups.


    Feature photo: da-kuk / iStock / Getty Images Plus / Getty Images

  • Insitu demos UAV/GIS system for fighting wildfires

    Following successful test flights, Insitu’s ScanEagle helps combat Oregon wildfire.

    UAV company Insitu and Esri have successfully completed test flights on a new way to support firefighting efforts using software for firefighters and first responders.

    The flights were held at the Warm Springs Federal Aviation Administration (FAA) Unmanned Aerial System (UAS) Test Range in Oregon. The test site is a Pan Pacific FAA UAS Test Site for commercial UAS testing. The national FAA test site program facilitates the UAS industry in meeting strict customer needs and qualifications.

    Insitu is a wholly-owned subsidiary of The Boeing Company.

    A week after successfully completing customer acceptance test flights, Insitu, which has more than one million operational UAS flight hours, deployed its INEXA Solutions professional aerial remote sensing teams to aid firefighters in suppressing the Eagle Creek fire in Oregon.

    Onlookers watch the fire burn in the Columbia Gorge on Sept. 4. (Photo: U.S. Forest Service)
    Onlookers watch the fire burn in the Columbia Gorge on Sept. 4. The fire is now contained. (Photo: U.S. Forest Service)

    Collaborating with customers to identify business challenges, INEXA Solutions professionals use a continually expanding suite of capabilities such as INEXA Control (ground-based command and control), INEXA Cloud, INEXA manned and unmanned air vehicles including ScanEagle, and INEXA sensors and analytics to provide custom solutions and answers to mitigate business challenges from seabed to space.

    Coordinating with the Oregon Department of Forestry and other governing entities, Insitu’s ScanEagle system provided optimal, near real-time data for firefighters and first responders, resulting in heightened emergency response efforts, increased situational awareness and safety, and supported planning and resource allocation.

    Equipped with electro-optical (EO) for daylight and infrared (IR) video for nighttime flights, along with mid-wave sensors, the ScanEagle surveyed fire lines at night over the Eagle Creek wildfire, which had spread to nearly 49,000 acres throughout the Columbia River Gorge region.

    The ScanEagle can supplement manned firefighting fleets by operating during dense smoke and at night, when manned aircraft typically cannot fly. Infrared camera technology can penetrate smoke and gather and disseminate georeferenced still images of points of interest. These images allow geographic information system (GIS) specialists to perform analysis using Esri’s ArcGIS software.

    “Throughout the difficult Eagle Creek wildfire, our thoughts have been with our friends and neighbors impacted by this unfortunate event,” said Mark Bauman, vice president and co-general manager, Insitu Commercial. “We stand prepared to assist local authorities with ongoing operations in any way we can, and we extend our gratitude to all of those working hard to contain the fire.”

    ScanEagle poised for launch at Eagle Creek, Oregon, fire.
    ScanEagle poised for launch at Eagle Creek, Oregon, fire.

    As the sole aviation overwatch within the temporary flight restriction, the ScanEagle provided persistent nighttime oversight and monitored the progression of the fire. Insitu coordinated manned and unmanned aviation assets and through data collection, analysis and integration capabilities, produced near real-time georeferenced spatial data (maps tied to specific known locations).

    In this way, incident commanders, firefighters, and first responders had data that delivered updated incident perimeter maps, identified spot fires, located fire lines and hotspots, and provided near real-time video feed and still images of critical infrastructure, historical structures and more.

    “Prior to pursuing any new effort, we consider the reasons we exist as a company — we call it our ‘why,’ explains Jon Damush, Insitu’s chief growth officer. “Insitu’s ‘why’ is to pioneer and innovate in all that we do to positively impact people’s lives and change the course of history,” he continues. “This statement guides our actions and investments, and is precisely why we are doing the things we are doing to help those in need with our unique technologies and professional approach to aviation.”

    (Based on an Insitu press release)

  • Seeing the Great American Eclipse

    Photo: 2017 Eclipse/NASA
    Photo: 2017 Eclipse/NASA


    A total solar eclipse will cross the United States from coast to coast on Monday, Aug. 21 — the first solar eclipse in nearly 40 years.

    Not only is this is the first eclipse in the age of social media, it is the first with a path of totality crossing the Pacific and Atlantic coasts of the U.S. since 1918.

    Also, its path of totality makes landfall exclusively within the United States, making it the first such eclipse since the country’s independence in 1776.

    An interactive story map from Esri, Seeing the Great American Eclipse, features a collection of eclipse data such as the amount of exposure per location, traffic analytics and more.

    An estimated 1.85 to 7.4 million people will be traveling to the path of totality. The rapid population influx presents a unique challenge for national public safety agencies as well as state and local governments across the cities and towns where eclipse enthusiasts are expected to gather.

    Aside from potential record-breaking traffic jams, many are anticipating a significant strain on emergency resources and infrastructure (both physical and digital).

    Oregon in the Hot Seat. As the first state to experience the eclipse, Oregon is in the hot seat. It is not only one of the most populous states in the path of totality, but is expected to receive the most out-of-state visitors as well.

    During this unprecedented event, government agencies are going to need real-time situational awareness of personnel; resources; and infrastructures, such as freeways, in highly populated areas. Knowing who and what are at risk is critical, but knowing where when it matters most enables a cohesive response to any situation that might arise.

    In recognition of those needs, Oregon has developed the RAPTOR app (Real-time Assessment and Planning Tool for Oregon). Leveraging Esri technology, the online government resource adds the path of totality and other eclipse event layers to its situational awareness data.

    RAPTOR also allows users to quickly and easily digitize information from these events and put them onto maps, providing agencies with up-to-the-moment info on everything from traffic to weather.

  • Oregon moves to tablets for no-stake 3D

    Oregon moves to tablets for no-stake 3D

    The Oregon Department of Transportation (ODOT) is embracing the growing trend in highway construction to go “stakeless” and push to full 3D design.

    With more contractors using automated machine guidance applications, ODOT’s construction personnel are being asked to inspect projects with fewer stakes and visual indicators for line and grade. Employees are seeking to use the same data and information to determine line and grade when building or fixing stretches of road.

    ODOT inspectors Jorge Jimenez and Mike Stennett at Multnomah Falls, preparing for a night-time paving operation. (Photo: Chris Pucci)
    ODOT inspectors Jorge Jimenez and Mike Stennett at Multnomah Falls, preparing for a night-time paving operation. (Photo: Chris Pucci)

    To address this need, rugged tablet maker DT Research worked closely with ODOT to design purpose-built Inspector Positioning Tablets that run GPS locating and 3D modeling applications, and take advantage of the Oregon Real-Time GNSS Network.

    “MicroSurvey Field Genius surveying software is used to read XML files directly, allowing the inspector to work with the same files that the contractors received from the roadway designers,” said Chris Pucci, ODOT Construction Automation Surveyor.

    The tablets enable ODOT to fully use its knowledge of the Oregon Real-Time GNSS Network and expertise in survey-grade RTK GNSS to achieve accuracies of +/0.05 feet.

    The model DT391GS tablets have 9-inch touchscreens. The tablets can be used as handhelds or with an external antenna and pole. ODOT purchased one of four GNSS options offered by DT Research for the DT391GS tablets. The options enable inspectors and construction crews to employ a combination of GPS locating and 3D modeling to guide construction workers.

    The goal is to allow the inspectors to make the same checks they would have made if there had been traditional construction staking on a project, not to make inspectors into surveyors, Pucci noted.

    A one-day training is provided to train construction personnel before they are issued a tablet. “The tablets have been very well received by our construction inspection personnel,” he said.

    The tablet project is now in the pilot phase with 20 tablets deployed to eight construction offices and more than 70 construction personnel having been trained. “We also just placed an order for 22 more tablets for the upcoming 2017 construction season,” Pucci said.

  • Oregon moves to tablets for no-stake 3D design

    The Oregon Department of Transportation (ODOT) is embracing the growing trend in highway construction to go “stakeless” and push to full 3D design.

    With more contractors using automated machine guidance applications, ODOT’s construction personnel are being asked to inspect projects with fewer stakes and visual indicators for line and grade. Employees are seeking to use the same data and information to determine line and grade when building or fixing stretches of road.

    ODOT inspectors Jorge Jimenez and Mike Stennett at Multnomah Falls, preparing for a night-time paving operation. (Photo: Chris Pucci)
    ODOT inspectors Jorge Jimenez and Mike Stennett at Multnomah Falls, preparing for a night-time paving operation. (Photo: Chris Pucci)

    To address this need, rugged tablet maker DT Research worked closely with ODOT to design purpose-built Inspector Positioning Tablets that run GPS locating and 3D modeling applications, and take advantage of the Oregon Real-Time GNSS Network.

    “MicroSurvey Field Genius surveying software is used to read XML files directly, allowing the inspector to work with the same files that the contractors received from the roadway designers,” said Chris Pucci, ODOT Construction Automation Surveyor.

    The tablets enable ODOT to fully use its knowledge of the Oregon Real-Time GNSS Network and expertise in survey-grade RTK GNSS to achieve accuracies of +/0.05 feet.

    The model DT391GS tablets have 9-inch touchscreens. The tablets can be used as handhelds or with an external antenna and pole. ODOT purchased one of four GNSS options offered by DT Research for the DT391GS tablets. The options enable inspectors and construction crews to employ a combination of GPS locating and 3D modeling to guide construction workers.

    The goal is to allow the inspectors to make the same checks they would have made if there had been traditional construction staking on a project, not to make inspectors into surveyors, Pucci noted.

    A one-day training is provided to train construction personnel before they are issued a tablet. “The tablets have been very well received by our construction inspection personnel,” he said.

    The tablet project is now in the pilot phase with 20 tablets deployed to eight construction offices and more than 70 construction personnel having been trained. “We also just placed an order for 22 more tablets for the upcoming 2017 construction season,” Pucci said.

  • SOAR Oregon backs UAS FutureFarm for digital agriculture

    SOAR Oregon backs UAS FutureFarm for digital agriculture

    SOAR Oregon, a non-profit organization focused on the development of the unmanned aircraft systems (UAS) industry in Oregon, has given the city of Pendleton a grant for the establishment of a FutureFarm project at the Pendleton UAS Test Range.

    The Oregon UAS FutureFarm is a real-world proving ground designed to help digital agriculture pioneers accelerate product development, reduce cycles and expand market growth.

    SOAR Oregon is exhibiting at AUVSI Xponential 2016, being held in New Orleans this week.

    FutureFarm-signing-W
    Pendleton Mayor Phil Houk (right) signs the FutureFarm grant agreement with SOAR Oregon. SOAR Oregon’s John Stevens (front left), Roundup City Development Corporation’s Mike Short (back left), and Pendleton UAS Range’s Steve Chrisman (back right) were on hand to witness the signing.

    Once established in June, it will be the only digital agriculture proving ground of its caliber in the United States, SOAR Oregon said. Developers of agriculture-focused unmanned robotics and data systems will find the Oregon UAS FutureFarm has a broad spectrum of high value and commodity crops, multiple layers of remote sensing for benchmarking, and access to the agricultural knowledge base they need to test, validate and innovate the next generation of interconnected unmanned and automated agricultural systems.

    The Oregon UAS FutureFarm features a network of research-friendly farmers growing a large variety of irrigated and dry-land crops in both traditional and modern farming infrastructures. Strategic partners include the City of Pendleton, Digital Harvest, SOAR Oregon, Blue Mountain Community College, Oregon State University and USDA Columbia Basin Agricultural Research Center.

    “We believe that the Oregon UAS FutureFarm fills a clearly defined market niche for UAS platform and payload developers who are working on the next generation of technologies for precision agriculture,” said SOAR Oregon Executive Director Chuck Allen. “We are especially pleased that this project is taking place at one of Oregon’s FAA-designated UAS test ranges.”

    “We are pleased to be supporting the Oregon UAS FutureFarm as both a partner and user,” said Young Kim, CEO of Digital Harvest. “The fact that the test range includes high-value tree fruit orchards, premium wine grape vineyards, hundreds of automated irrigated plots, and hundreds of thousands of acres of dry land farms makes it a unique and special zone.”

    “The Oregon UAS FutureFarm is open to UAS developers, sensor makers, robotics companies, universities and any others who are looking for a real-world digital agriculture proving ground that is supported by a collaborative innovation focused community,” said Jeff Lorton, Oregon UAS FutureFarm project manager.

    Pendleton Mayor Phil Houk signed the agreement with John Stevens and Mike Short from SOAR in attendance. “The FutureFarm represents what we’d hoped the Pendleton UAS Range could become — not just an environment for the development of technology, but the place where real-world questions could be solved with unmanned aircraft,” said Steve Chrisman, Pendleton director of Economic Development. “We are excited about the potential of this project to develop solutions which benefit growers across the Northwest.”

  • Trimble VRS Now Service Now Available in Australia, Oregon

    Trimble VRS Now coverage in Australia.
    Trimble VRS Now coverage in Australia.

    Trimble, together with its distribution partner Ultimate Positioning Group (UPG), announced the availability of Trimble VRS Now correction service in Queensland, New South Wales, South Australia, Tasmania and Victoria.

    Trimble is also now offering the Trimble VRS Now correction service in Oregon’s Willamette Valley.

    The commercial subscription service provides surveyors, civil engineers, geospatial professionals and other industry specialists in these areas with instant access to real-time kinematic (RTK) GNSS corrections without the need for a base station.

    Using both GPS and GLONASS constellations, the Trimble service delivers centimeter-level RTK corrections customized for each GNSS receiver’s location anywhere in the network via cellular communications. The Trimble VRS Now service supplies accurate, reliable and easy-to-use GNSS positioning for a variety of applications including surveying, urban planning, urban and rural construction, environmental monitoring, resource and territory management, disaster prevention and relief and scientific research, Trimble said.

    “The addition of VRS Now to Trimble’s current portfolio of corrections technologies and services in Australia highlights our ability to meet any accuracy, delivery, availability and financial consideration across a variety of applications and markets,” said John Sprivulis, business area director of Trimble’s Positioning Services Division in the Asia Pacific. “Trimble is effectively creating a national positioning infrastructure to meet Australia’s future needs.”

    Trimble VRS Now in Australia is a continuation of Trimble’s focus on providing solutions that enable customers to increase productivity by simplifying access to high-precision accuracy around the world. Similar VRS Now services are operating in parts of the U.S. and Europe.

    In addition, the Australian VRS Now service supports the Trimble Pivot Field Mobile App, which provides up-to-the-minute information on the VRS Now system status for users in the region.

    Because OmniSTAR CORS service in the area is being phased out, existing Australian users will be automatically transitioned to the Trimble VRS Now service, which provides easy access to high accuracy and reliable positioning within the network coverage area.

    Service in Australia and Oregon is a continuation of Trimble’s focus on providing solutions that enable customers to increase productivity by simplifying access to high-precision positioning around the world. Similar VRS Now services are operating in Illinois, Indiana, Iowa, Nebraska, Colorado, Florida, Alabama, Mississippi, Texas, and parts of Europe.