Tag: point cloud

  • GIS helps archaeologists trace a mother’s journey

    GIS helps archaeologists trace a mother’s journey

    “The tasks of paleontologists and classical historians and archaeologists are remarkably similar — to excavate, decipher and bring to life the tantalizing remnants of a time we will never see.”
    — Adrienne Mayor

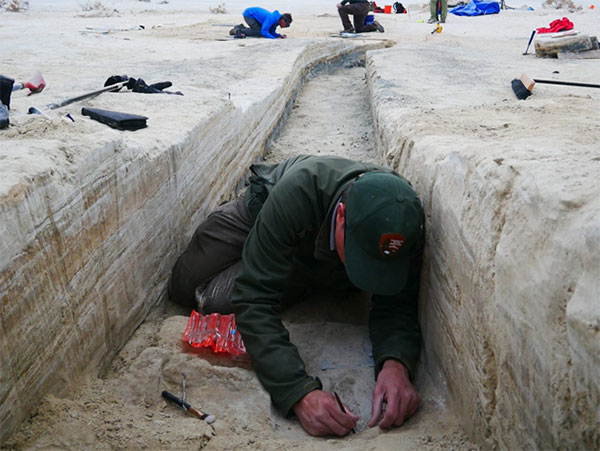
    Heatwaves rose up from the dusty, dry, cracked ground. Tiny black flies buzzed around the team’s eyes and faces. The only shade was under a canopy erected across the shallow open trench where half a dozen people gently brushed away the layers. Dirt is time; the deeper one digs, the further back in time one goes.

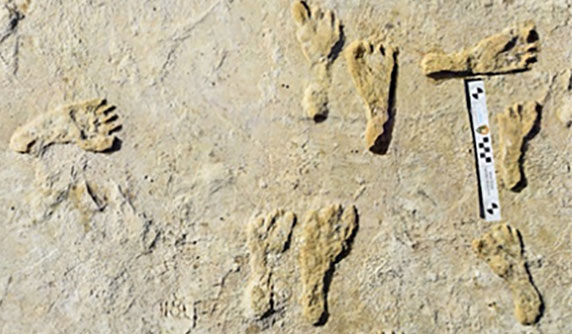
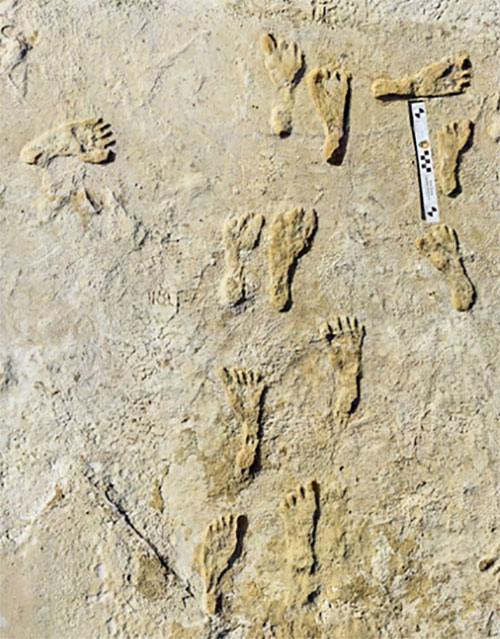
    A layer 23,000 years old is exposed at nearly two feet down, revealing footprints of a female and a toddler. It tells a story of her mile-long journey through the soft clay mud. Roaming nearby was a giant sloth and a herd of mammoths. This discovery forces science to re-adjust the timeline of humans living on the North American continent, pushing it further back into the Pleistocene era at least 10,000 years.

    Discoveries like this are the treasures archeologists seek. Archaeologists are scientists — part treasure hunters and part storytellers. They add context to history.

    A trench dug into the brown gypsum soil on a lake playa in White Sands National Park reveals more human footprints below the surface. (Photo: National Park Service)
    A trench dug into the brown gypsum soil on a lake playa in White Sands National Park reveals more human footprints below the surface. (Photo: National Park Service)

    Ground-Penetrating Radar

    Advanced technologies are aiding new discoveries of the past. Even though the footprints were buried beneath two feet of dirt, they were discovered without physically seeing them. Ground-penetrating radar (GPR) made the discovery possible. GPR has made significant advancements in recent years, along with improvements in other types of remote sensing applications.

    The resolution of GPR has improved along with the depths that GPR can detect objects. Computers can process the GPR data into 3D images providing a depth profile of the scanned area. This is how the footprints were detected.

    White Sands has the largest collection of fossilized human footprints. (Photo: National Park Service)
    White Sands has the largest collection of fossilized human footprints. (Photo: National Park Service)

    In addition to GPR, the researchers used magnetometers that verify disturbances in the sediment, which can also be imaged in 3D, albeit with a much lower resolution.

    “The sediment itself has a memory that records the effects of the animal’s weight and momentum in a beautiful way. It gives us a way to understand the biomechanics of extinct fauna that we never had before,” said Thomas Urban, the Cornell University research scientist who led the team making the discovery.

    Usually, archeological findings are of bones and artifacts. Fossilized “ghost” footprints of humans and other creatures brings them to life, providing glimpses of the living past.

    Under ideal conditions, GPR can reach depths of 30 meters (98 feet). The accuracy and range of GPR depend on sediment type, moisture content and other geologic morphologies. Underlying GPR technology and magnetometry are robust geospatial information systems (GIS) that preserve a digital record of the discovery, allowing for further geospatial analyses. Advances in machine learning will improve future detection.

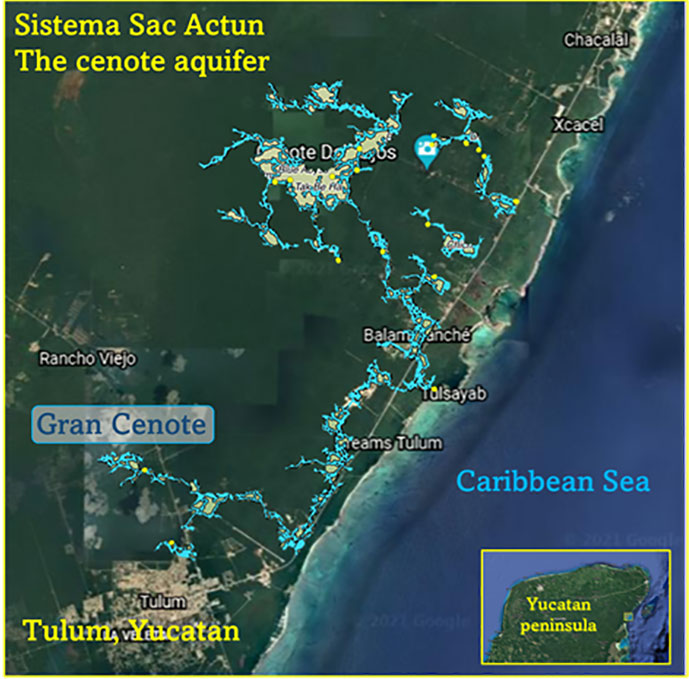
    Elsewhere in the Americas, a project has been ongoing in Mexico since the 1990s using GPR to map the cenotes and underground aquifers used by the Mayans. A 215-mile-long underground water cave system — the longest in the world — has been mapped in the Yucatan peninsula. Divers exploring these cenotes found remains of Ice Age animals, including a sabertooth tigers and mammoths.

    Map: William Tewelow
    Map: William Tewelow

    Lidar and ALS

    Lidar (light detection and ranging) is making even more discoveries possible with the help of artificial intelligence and machine learning. For instance, in the jungles of Guatemala, lidar revealed the unknown ancient Mayan city of Tikal.

    Lidar  is an active sensor that measures ground height. Using an airborne laser scanning (ALS) system mounted to a plane, helicopter or UAV, the lidar device’s laser beams scan the landscape. The system calculates the time it takes for the beam to reach an object on the ground and bounce back.

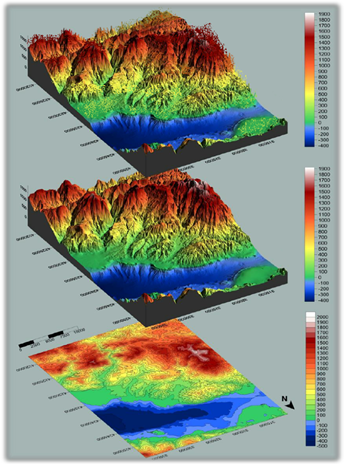
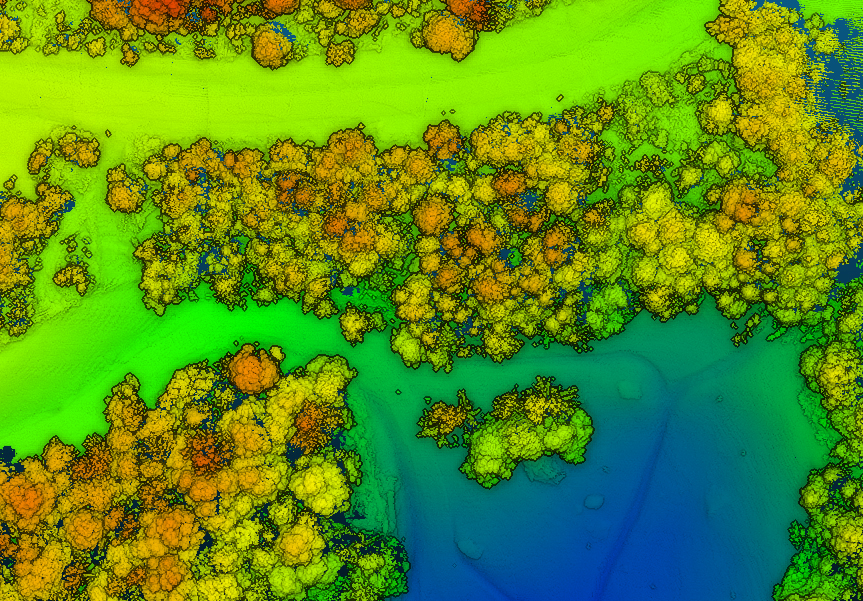
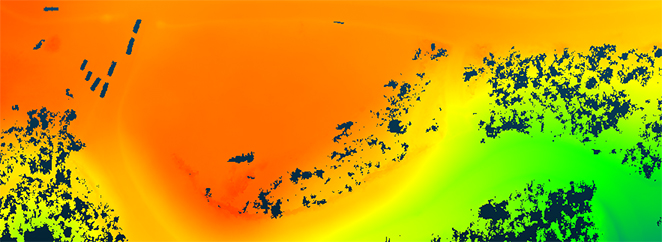
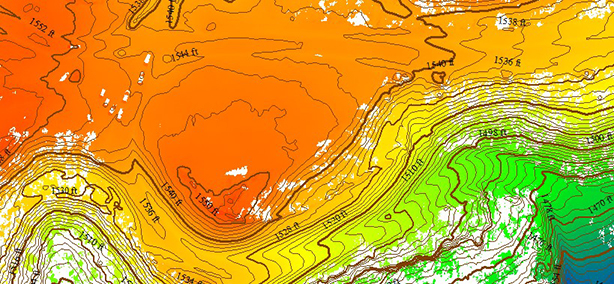
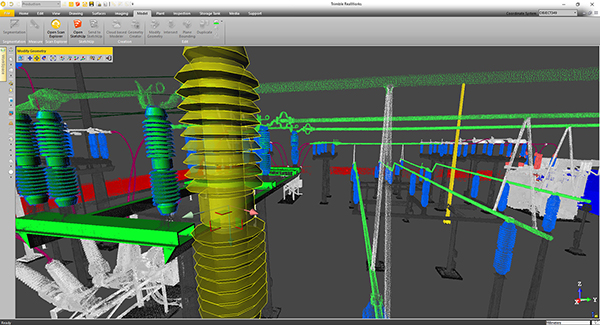
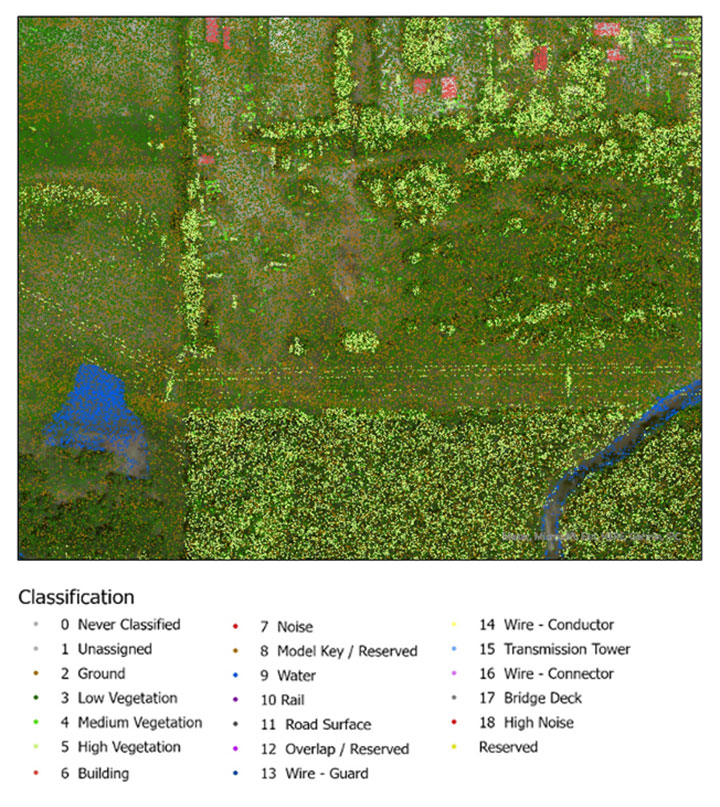
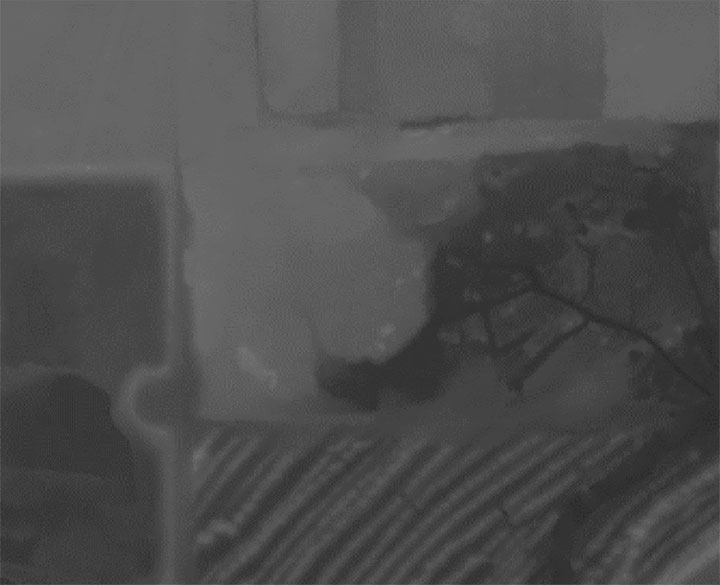
    The result generates one point for each ground object the laser touches, calculating the distance the beam traveled. Billions of points are collected during a scan. Geospatial archeologists then process the collected points into a point cloud (Figure 1). Selecting only points classified as ground and water, the points are converted to a raster image, and archeologists are provided a perspective of the bare earth under tree canopy and vegetation (Figure 2).

    In this way, lidar serves as a non-destructive way to identify earthwork formations, even in dense jungle.

    Object-Based Imagery Analysis

    The challenge with lidar and imagery is the sheer volume of data, beyond the scope of what a human can manually review. Because of how faint archaeological features can be, the search often requires manipulating imagery datasets by combining multispectral bands, and then merging them with topographical data. To assist this huge endeavor, artificial intelligence is applied to pixel-based classification and object-based imagery analysis (OBIA) to highlight areas of interest for further study.

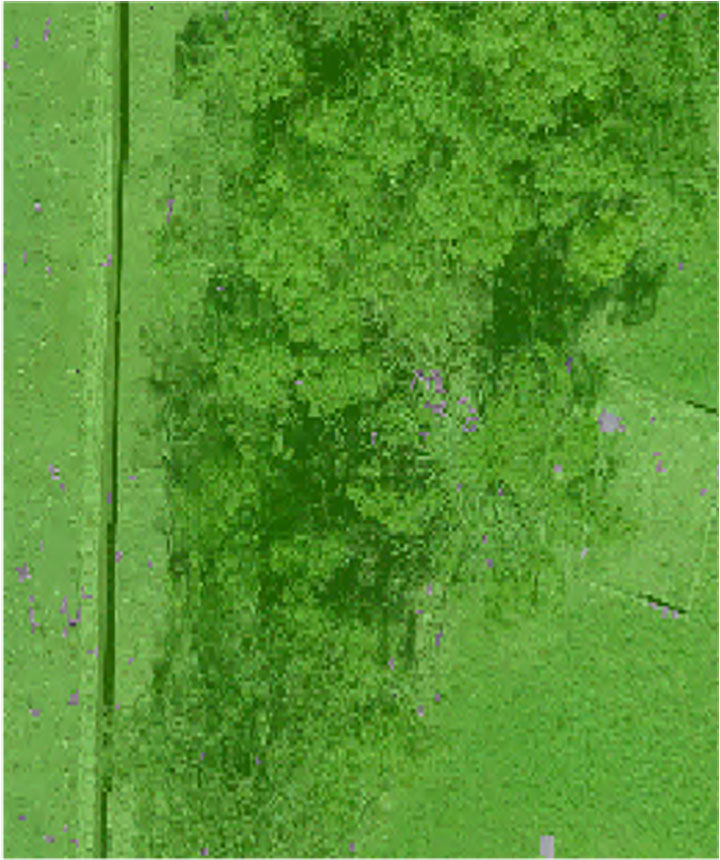
    Dylan Davis, a Ph.D. candidate at Pennsylvania State University, spearheaded the use of OBIA for finding earthworks such as circular mounds, stone walls,and roadways in Beaufort, South Carolina. He took advantage of high-resolution NOAA imagery taken of the coast before the hurricane season of 2008. Using artificial intelligence for object-based imagery analysis, 160 previously undetected mound features were found.

    <b>Raster comparison: Sea Pines Shell Ring, Hilton Head Island, South Carolina. </b>Credit: Dylan S. Davis, Matthew C. Sanger & Carl P. Lipo (2018): Automated mound detection using lidar and object-based image analysis in Beaufort County, South Carolina, Southeastern Archaeology [https://doi.org/10.1080/0734578X.2018.1482186]
    Raster comparison: Sea Pines Shell Ring, Hilton Head Island, South Carolina. Credit: Dylan S. Davis, Matthew C. Sanger & Carl P. Lipo (2018): “Automated mound detection using lidar and object-based image analysis in Beaufort County, South Carolina,” Southeastern Archaeology [https://doi.org/10.1080/0734578X.2018.1482186]
    On the local level, archeologists apply the same approach to finding headstones in unmarked cemeteries. A pixel-defined object-based classification system helped one researcher automatically identify potential headstones in a densely vegetated cemetery.

    The technology used for OBIA is also used for visual-inertial odometry (VIO). NASA is experimenting with VIO techniques to help astronauts navigate the lunar surface (see NASA’s Artemis program will need lunar spatial reference system). For Artemis, VIO will use the Moon’s craters as a reference system to derive an accurate position.

    Virtual 3D Worlds

    Perhaps one of the most significant uses of technology for archaeological research and exploration is the use of virtual 3D immersive worlds. Exploring ancient worlds as they might have looked gives archaeologists additional insights and the public a chance to experience their discoveries, connecting us with history.

    The mile-long journey of a young female carrying a toddler across an Ice Age landscape 23,000 years ago seems so distant, yet so familiar to any parent. The image breathes life into our common ancestry. Through the power of GIS and modern technologies, she walked right into the 21st century.

    “The man who knows and dwells in history adds a new dimension to his existence…He lives in all time; the ages are his, all live alike to him.”
    — William Flinders Petrie


    Special thanks to Stephanie Clark, a geospatial archeologist with Integrated Environmental Solutions, LLC, of Phenix City, Alabama. Stephanie provided technical advice and collaboration, and the lidar studies for Figures 1, 2 and 3.


    William TewelowWilliam Tewelow is a senior aeronautical information specialist for the Federal Aviation Administration. He is a 2016 graduate of the FAA’s management fellowship Program for Emerging Leaders and a mentor with the FAA’s National Mentor Program. He served on special assignment to the U.S. Department of Transportation and led a national strategic geospatial initiative under the authority of the White House Open Data Partnership.

    Tewelow is a designated Geographic Information Systems Professionals (GISP), with degrees in geographic information technology and Intelligence Studies. he is currently earning his master’s degree in organizational leadership with a focus on performance management.

    Tewelow retired from the U.S. Navy after serving 23 years as a geospatial and imagery intelligence specialist, a naval aviator, a meteorologist and a tactical oceanographer earning three achievement medals. He was among the first in the nation to earn a Geospatial Specialist Certification from the U.S. Department of Labor while working at NASA Stennis Space Center. He is married, enjoys traveling, connecting people, and solving problems, and is interested in new technology. His favorite quote is, “A man’s mind changed by a new idea can never go back to its original dimension.” ~ Oliver Wendell Holmes

  • Inertial Labs explains lidar, GPS-aided INS and data management

    Inertial Labs explains lidar, GPS-aided INS and data management

    A new blog offered by Inertial Labs discusses the scope of work to turn lidar point-cloud data collection into actionable deliverables. The blog, “Providing Actionable LiDAR Point Cloud Deliverables and the Inertial Labs RESEPI” by Luke Wilson, is also available as a downloadable PDF.

    A digital terrain model, a digital surface model, and a digital elevation model (from top). (Image: Inertial Labs)
    A digital terrain model, a digital surface model, and a digital elevation model (from top). (Image: Inertial Labs)

    The blog introduces lidar and creation of point clouds, then discusses the use of GPS-aided inertial navigation systems (INS). “A lidar point cloud is the product of sensor fusion across a GPS-aided INS and a lidar scanner. Each sensor plays a critical role in how a lidar payload functions and the applicability of its point cloud output,” explains Wilson.

    Wilson describes complications with converting datum reference frames, both traditional and reference ellipsoid such as WGS84. He also discusses projected coordinate systems. He concludes with analysis of the data using point classification — the foundation to create models including digital terrain, surface and elevation models (DTM, DSM and DEM respectively).

    Finally, Wilson explains how Inertial Labs’ RESEPI is a quick and efficient way to generate models of an environment, including in fields such as construction and utility management.

    RESEPI stands for REmote SEnsing Payload Instrument, Inertial Labs’ complete multiplatform, multisensor lidar and RGB payload solution for such remote sensing applications.

    Read the full blog.


  • 3 keys to successful canopy penetration

    3 keys to successful canopy penetration

    Sunlight through a tree canopy. (Photo: RedTail)
    Sunlight through a tree canopy. (Photo: RedTail)

    RedTail Lidar System’s RTL-400 delivers the trifecta

    Summer is here, and with it comes the challenge of creating accurate topographic maps under tree canopies. The adoption of drone-based, 3D light detection and ranging — or lidar — is emerging as the go-to sensing technique to meet this challenge consistently, safely and cost effectively.

    Designed specifically for use on small drones, the RTL-400 from RedTail Lidar Systems was developed with technology licensed from the U.S. Army Research Laboratory (ARL). The RTL-400 is designed to provide high-resolution 3D images of objects on the ground, flying at an altitude of up to 400 feet.

    The RedTail team recently partnered with the West Virginia Department of Environmental Protection (WVDEP) Division of Mining and Reclamation to demonstrate the RTL-400’s ability to generate an accurate digital terrain model (DTM) under “leaf on” conditions. This can be challenging, because pulsed laser light needs to reach the ground to generate laser light ground returns.

    RTL-400 flight specifications: speed -18 mph, flight time -12 minutes, acreage -20. (Image: RedTail)
    RTL-400 flight specifications: speed -18 mph, flight time -12 minutes, acreage -20. (Image: RedTail)

    One mission of the WVDEP Division of Mining and Reclamation is to assure compliance with the West Virginia Surface Mining and Reclamation Act and other applicable state laws. This task requires ongoing monitoring, mapping and assessment of sites across the state that are actively being reclaimed.

    Originally utilizing photogrammetry to generate point clouds, the WVDEP was unable to create the accurate, under-canopy DTMs that they desired. Looking for an alternate method, they began to consider lidar.

    The RedTail lidar team met with WVDEP representatives at a mine reclamation site in a remote area of south-central West Virginia. The terrain was a mixture of rolling hillside covered with grasses, brush and tree stands.

    The RTL-400 demonstration flight mapped approximately 20 acres of the reclamation site in 12 minutes, flying at an altitude of 196 feet and a speed of 18 mph.

    Once the data was collected, a digital terrain model (DTM) was created, revealing the RTL-400’s ability to generate the high-resolution, high-density point cloud needed to accurately map the terrain beneath the tree. 

    Digital terrain model (DTM) generated from RTL-400 point cloud. (Image: RedTail)
    Digital terrain model (DTM) generated from RTL-400 point cloud. (Image: RedTail)

    The RTL-400 delivered all three key elements needed to provide DTMs in foliated areas:

    • a small beam divergence of 0.5 milliradians (.03 degrees) with a spot size of just 2 inches diameter at the canopy cover
    • the ability to analyze up to five returns from every transmitted pulse so that returns from the ground can be received and processed
    • a pulse density of 800 pulses in every square meter of the canopy (for the WVDEP flight).  
    RTL-400 generated digital terrain model (DTM) overlaid with contour map. (Image: RedTail)
    RTL-400 generated digital terrain model (DTM) overlaid with contour map. (Image: RedTail)

    RedTail Lidar Systems is a division of 4D Tech Solutions Inc., a company focused on providing innovative technology-based solutions to address government and commercial customer needs. RedTail’s in-house technical expertise — coupled with a full suite of software and hardware design and manufacturing tools — allows the company to develop custom lidar solutions for manned and unmanned vehicle applications.

  • The value of point clouds is unlimited

    By Jacob Amacker
    Oxford Technical Solutions

    What is a point cloud?

    A point cloud is fundamentally a simple construct. It is a collection of points in 3D space, each point being given a coordinate in Cartesian convention. The points can also be given other properties, often these will be indicative of how they were obtained.

    Examples might include the time at which they were “seen” by the surveying device that collected the data. The intensity or error in position that the point has might also be included.

    Often point clouds will have around 100 million points after conducting a survey. Photography can also be overlaid on point clouds using photogrammetry techniques to essentially build 3D photography.

    Image: OxTS
    Image: OxTS

    INS survey: point clouds

    The principal method of collecting point-cloud data is by using lidar. Lidar technology is akin to radar: light is sent out from the device and bounces back off of objects. The difference is that radio uses large wavelength radio waves and lidar uses small wavelength lasers for high precision.

    The time for light to return to the device is used with the speed of light to calculate the distance away. Typically, a lidar device will contain lasers with a fixed vertical angle, but which spin around in the horizontal plane. Internally, the device knows at what angle the laser is pointing vertically and its azimuth angle. This gives the device the position of the point on the object in 3D spherical coordinates.

    The lasers inside produce thousands of points per second. Intensity, mentioned above, refers to the intensity of the reflected beam and indicates the reflectivity of the object.

    What is a georeferenced point cloud?

    Lidar requires navigation data to conduct a survey. We combine the navigation data with the lidar data to create georeferenced point clouds. Lidar devices know where points are in relation to each other, but they need to be told where they are in the world to be able to build a point cloud while moving the lidar.

    The navigation data often comes from an inertial navigation system (INS). An INS is a sophisticated combiner of inertial measurement unit (IMU) and GNSS data to get the best navigation data — so a device knows where it is in the world and how it is moving.

    The coordinates from the INS are added vectorially to the point coordinates of the lidar to get the final coordinates that would be used in the point cloud. This allows a user to put their lidar device on a vehicle like a van or an unmanned aerial vehicle (UAV) with an INS, to survey large areas efficiently instead of doing multiple static surveys and stitching them together.

    Photo: OxTS
    Photo: OxTS

    What are point clouds used for?

    There are a wide range of applications for which point clouds can be used. They are increasingly used in real time for robots and autonomous driving computers to understand their environment and navigate through it. The data in a point clouds is convenient for recognizing and identifying surfaces and objects; for example, other cars, road signs and lane markings.

    OxTS has been a global leader in inertial and GNSS technologies since 1998. OxTS is fundamentally involved in helping car manufacturers get the navigation data they require to go with lidar data in autonomous vehicle development, and in point clouds creation for use in surveying.

    Distances and volumes are easy to calculate using point-cloud analysis software, and intensity can help identify different materials.

    Another feature that lidar offers is multi-returns. This allows a laser pulse (which has a finite cross-section) to bounce back off of multiple surfaces to give multiple points from the same pulse. This is particularly useful for seeing windows and also seeing through them, and also for a myriad of other uses such as seeing the top of a treeline and the ground when flying over with a UAV.

    It can also be used to see snow depth. The lidar can see the top layer of snow and also gets another strong return from the ground beneath.

    At OxTS, we see lidar point clouds being used for driverless-car and work-vehicle development, coastal and forest management, infrastructure monitoring (signs, drains, bridges, road surfaces, railroads, etc.), creating 3D models of cities, pipeline exploration and more.

    The final product is a simple file format, for which the possibilities are almost endless — and we see new applications using point clouds all the time.

  • NavVis IndoorViewer 2.6 enables measurement based on point clouds

    Logo: NavVis

    Enables building stakeholders to take accurate measurements based on point clouds

    The latest release of the NavVis IndoorViewer 3D building visualization software features a new tool that lets building stakeholders take highly accurate measurements based on point clouds in the realistic 360° image view.

    NavVis, global provider of indoor spatial intelligence technology and enterprise solutions, announces the release of NavVis IndoorViewer 2.6. This major software release includes a new measurement tool that lets users take highly accurate measurements based on point clouds in realistic browser-based digital buildings.

    This release also makes additional features available to structured e57 point cloud files, including automatically generating highly detailed floor plans and routing.

    NavVis IndoorViewer is a popular deliverable among building stakeholders without the technical expertise to work with point clouds and modeling software, thanks to the realistic digital buildings and intuitive interface.

    One of the features that has proven to be useful among users across multiple industries is the measurement tool. It enables users to take measurements remotely on any device, saving time otherwise spent traveling to the site.

    The release of version 2.6 of NavVis IndoorViewer marks a major advance in the accuracy of virtual measurement tools. The tool has been redesigned to overcome two of the biggest problems with virtual measurement tools – accuracy and usability.

    On the one hand, point cloud measurements are quite accurate. But often these software tools are not accessible or even usable for a wide range of building stakeholders who lack the expertise in working with point clouds. If, on the other hand, the tool uses images or even meshes, which are much more user-friendly than point clouds, the tools are usually not reliable enough to produce accurate results.

    The new measurement tool in NavVis IndoorViewer combines the best of both worlds, thanks to a patent-pending magnifying feature that appears when taking measurements in the realistic 360° view. The magnifying feature reveals the exact section of the point cloud behind the image and lets users pick the point cloud point as the basis for a measurement while benefiting from the intuitive interface of the fully immersive walkthrough.

    “When redesigning the measurement tool in NavVis IndoorViewer, we wanted to make sure that a wide range of stakeholders in every industry that works with built environments could benefit from the accuracy of point clouds when taking virtual measurements,” said Georg Schroth, NavVis CTO. “We are confident that the new magnifying feature in NavVis IndoorViewer achieves our goal. Now even stakeholders that are unfamiliar with point clouds have an easy, intuitive way to take measurements based on this highly accurate real world data.”

    In addition to making strides in the accuracy of remote measurements, the interface of the tool has also been fully redesigned. This includes a new slider function that lets users view the 2D floor plan and 3D walkthrough side-by-side or move from one view to the other.

    The dual view provides an overview of the entire building so that users can easily locate an asset or area while also viewing the location in the realistic 360° view. The fully immersive walkthrough makes it possible to virtually move through the area being measured or inspect the asset, as if the user were on site. Measurements being taken show up in both views.

    The release of NavVis IndoorViewer 2.6 also introduces new feature support for e57 point cloud files captured by static scanners. Previous NavVis IndoorViewer releases have included a popular feature that lets laser scanning professionals upload structured e57 point cloud files and automatically generate realistic, fully immersive 360° walkthroughs that can be published and shared with clients as a web-based link.

    With the release of NavVis IndoorViewer 2.6, two popular features that were previously only compatible with scan data captured by NavVis hardware are now available for point clouds uploaded as structured e57 files. The first is the generation of a navigation graph, which makes it possible to turn static scans into a fully immersive indoor routing tool. The second is the automatic generation of highly detailed floor plans. Now point cloud files uploaded as structured e57 files can be turned into digital floor plans in a few clicks.

    Version 2.6 of NavVis IndoorViewer is now available. Register for a free trial.

  • Trimble RealWorks announces performance and UI enhancements

    Trimble RealWorks announces performance and UI enhancements

    Trimble will release a new version of Trimble RealWorks, its all-in-one point-cloud software platform. The new version of Trimble RealWorks — featuring performance and user interface (UI) improvements — will be available for download June 19.

    Changes include the following:

    • Batch processing workflows are now available to automate data processing for large datasets saving users time on projects.
    • New visualization and productivity tools include enhanced shading, improved registration automation and geometry editing. According to Trimble, the new tools enable customers to better understand project data and more easily create customer deliverables.
    • Enhanced multi-core processing for modern CPUs and added support for AMD Ryzen-based computers significantly reduces the processing time for registering and extracting scans.
  • SimActive launches free data-processing service using Correlator3D

    SimActive Inc., a developer of photogrammetry software, is offering a new free data-processing service using Correlator3D.

    New users can upload their first UAV, satellite or aerial image project to obtain digital surface model (DSM), digital terrain model (DTM), point cloud and orthomosaic outputs.

    Along with optimal results, users also receive tailored feedback, recommendations and training from SimActive experts.

    The service requires no obligation, and is based on Correlator3D software, building on more than a decade of innovation on computer vision algorithms, a subfield of artificial intelligence. Quick turnaround is also possible due to the speed of the software and extensive use of GPU.

    “Our new offer is unique to get the best possible results from the very first project onward,” said Philippe Simard, president of SimActive. “Following this, users are trained with industry-leading technology, custom advice and necessary knowledge for successful mapping.”

  • Viametris mobile backpack scanner includes panoramic camera

    Mobile-scanning company Viametris has launched the bMS3D backpack mobile scanning system, which features an embedded 360° camera.

    Narrow streets and pedestrian zones are considered hurdles when it comes to mobile scanning. The new bMS3D-360 makes these tasks achievable. It is now available on the market and it comes with post-processing software. It will be presented at SPAR 3D 2018 in June.

    “Users of mobile scanning systems know how difficult it is to cover an entire city with this kind of system and how complex the completeness is,” said Jerome Ninot, founder of Viametris.

    Improved Data Exploitation with Panoramic Images. Viametris has found a solution to scanning challenges by developing the bMS3D-360: the mobile scanning backpack system includes a panoramic camera. This sensor allows the user to maintain continuity of results with mobile mapping systems on cars that already include this kind of camera. Operation and visualization with such 360° images are now easy to use.

    Since Google provided massive street views, people are used to navigating through panoramic images. Navigating through bMS3D-360 images becomes easy and intuitive compared to navigating with 3D point clouds, the company said.

    Ten years of experience have allowed Viametris to produce its GNSS mono-antenna system based on GNSS-free scanning (indoor or denied-GNSS area): the system trajectory is calculated by lidar-SLAM. It produces colorized point clouds with absolute accuracy of less than 5 centimeters under appropriate satellite reception conditions.

    Compared to many mobile scanners, this backpack does not rely on GNSS to work. If the GNSS reception is not good enough, control points can be added for absolute localization. The backpack can be used to scan all sorts of indoor areas such as airports, industrial buildings or shopping malls.

    The bMS3D-360 is lightweight. It protects the retractable camera an all other components since it is self-contained.

    Post process in VIAMETRIS PPiMMS Software. PPiMMS post-processing software manages the dataset coming from the system. Its mission is to calculate, control and improve the trajectories by calling lidar-SLAM functions, and reducing drifts, thanks to loop closure algorithms.

    The user can manually add GCPs to constrain the result when GNSS reception is poor. But, in most cases, the user will be able to include post-processed global positions (PPK) using GNSS post-processing software. Additionally, the panoramic camera can be used to colorize the point cloud using PPiMMS.

  • LizardTech granted US patent for lidar point-cloud compression

    LizardTech, a provider of software solutions for managing and distributing geospatial content, has been awarded a U.S. patent for the compression of lidar point clouds (US 9753124).

    The patented technology provides lossless compression of point clouds captured by airborne lidar sensors or terrestrial laser scanners for easy and cost-effective processing, storage and transmission of data sets.

    Point cloud data goes from staggering to manageable when lidar files are compressed to the MrSID format.
    Point cloud data goes from staggering to manageable when lidar files are compressed to the MrSID format.

    “Lidar systems capture terabytes of data containing rich information that can be difficult to exploit due to the difficulty processing such massive files,” said John Hayes, the LizardTech senior engineer who received the patent. “Our lidar compression technique allows users to maximize their return on investment in point cloud data collection.”

    LizardTech developed the lidar compression technology in 2009 by leveraging the wavelet transformation algorithms used to compress satellite and aerial image data sets into MrSID formats. The point cloud compression technique was first released as a stand-alone LizardTech product called LiDAR Compressor and then integrated into GeoExpress in 2015.

    GeoExpress is LizardTech’s flagship software product originally created to enable geospatial professionals to manipulate digital satellite/aerial image and losslessly compress them to industry-standard MrSID or JPEG2000 files. The addition of lidar handling gave GeoExpress the ability to natively compress lidar data to MrSID and LAZ formats with no loss of data content, saving up to 75% on storage, and time in processing files.

    Lidar systems are flown extensively on aircraft and unmanned aerial vehicles to collect highly accurate measurements of terrain elevations for a variety of mapping applications.

    Another form of lidar, known as terrestrial laser scanning, captures point clouds at ground level — both inside and outside of building structures — for visualization of crime scenes, re-creation of accident sites, and 3D modeling of building interiors.

    “Lasers are even being mounted on earth-moving equipment at construction sites for real-time capture of grading progress so that engineering managers can make on-the-spot decisions,” said Toby Martin, vice president of development and strategy at Extensis. “Lidar compression makes this possible and is revolutionizing workflows in the architecture, engineering and construction (AEC) industry.”

    The lidar compression algorithms can be licensed via the LizardTech SDK to incorporate the technology into third-party geospatial software solutions. Already, LizardTech is seeing interest in this technology from hardware sensor developers who want to place data compression capabilities at the source of collection.

  • MicroSurvey CAD 2016 provides new capabilities for survey

    MicroSurvey CAD 2016 provides new capabilities for survey

    Photo; MicroSurvey CAD

    MicroSurvey Software has released MicroSurvey CAD 2016, the newest generation of its desktop survey and design program for land surveyors and civil engineers. Powered by a new IntelliCAD 8.1a engine and enhanced with a suite of new point-cloud management tools, the software makes high-impact drafting and design fast and intuitive, the company said.

    Users on multi-core computers will experience up to 300 percent faster performance compared to previous versions, which substantially improves productivity. Navigation has been enhanced through a new ribbon interface with high-resolution icons that provide easy access to frequently used tools. The newest version of the software is also able to open and export DGN files, handle annotation scaling, and publish drawings as DWF/DWFX, PNG and JPG files.

    Point Clouds. The new release includes significant enhancements for working with point clouds. The Ultimate and Studio versions of the software are now powered by the same point-cloud engine that drives Leica Cyclone and CloudWorx software, making it possible to directly import Leica Cyclone and Leica JetStream databases using Cyclone dialogs.

    Users can view panoramic photographs captured by the laser scanner and snap to points directly from the photographs in a TruSpace window. Point-cloud data is now displayed directly within the CAD model space, and users can snap to the point-cloud points using standard CAD tools.

    MicroSurvey CAD is compatible with field data from all major total stations and data collectors and is fully compatible with AutoCAD. It includes complete survey drafting, COGO, DTM, traversing, volumes, contouring, point-cloud manipulation and data-collection interfacing. No plug-ins or modules are necessary. Both a 64-bit version and a 32-bit version of the software are available.

  • Trimble Expands Geospatial Portfolio to Increase Productivity


    Trimble-S9-Total-Station-Application-W

    Trimble has expanded its portfolio of geospatial solutions for surveyors, engineers and mapping professionals. Highlights include new total stations, a new GNSS receiver and new field and office software features. The solutions save time, reduce costs, streamline workflows and produce high-quality geospatial deliverables across a wide range of industries, Trimble said.

    “Trimble’s portfolio expansion will enable our customers to work in a more efficient, seamless and collaborative manner,” said Chris Gibson, vice president of Trimble. “Trimble’s solutions are best known for quality, dependability and performance. Our vision is to equip customers with the most innovative tools, which includes a focus on offering new software applications that streamline and elevate the value of geospatial data to guide smart decision-making and transform the way organizations work.”

    The expanded portfolio of productivity solutions include:

    Total Station Solutions

    Trimble-totalstations-W

    A range of new and enhanced robotic total stations — the Trimble S5, S7 and S9 — improve project efficiencies, productivity and deliverables. Times saving enhancements include improved Trimble VISION technology, SureScan technology included in the S7 and optional in the S9 total station, and the DR Plus electronic distance measurement technology as a standard feature.

    Theft and loss risks are also minimized now with Locate2Protect technology embedded in each instrument, allowing users to remotely track the location of their equipment in real-time using Trimble InSphere Equipment Manager.

    In the office, Trimble Business Center software can be used to create high-dynamic-range (HDR) images using data captured with total stations. A new total station data editor enables fieldwork to be rapidly reviewed and allows surveyors to create deliverables with confidence, Trimble said.

    Scanning Solutions

    Trimble continues to blend powerful 3D laser scanning and imaging hardware with workflow-based software to drive new efficiencies for survey applications and construction planning and design.

    The Trimble TX8 3D laser scanner now offers greater accuracy (down to 1 mm) and streamlined onboard operation when measuring to longer ranges, decreasing the field time required for capturing reliable high-accuracy data.

    Enhanced tools in Trimble RealWorks software version 9.1 further reduce the time to produce high-quality deliverables from Trimble TX8 data. The new version of Trimble RealWorks software includes improved workflows for creating floor settlement plans and 3D pipeline models as well as complete storage tank inspection and reporting capabilities.

    GNSS Solutions

    The new Trimble R8s Integrated GNSS receiver and updated version of Trimble Access field software combine to offer configurable and scalable settings. Surveyors have the flexibility across their workflows by being able to tailor the Trimble R8s receiver with the updated field software for their specific application. The ability to customize provides flexibility for future business requirements and allows customers to maximize efficiencies across their workflows.

    cameraSightImage_S6-W

    Imaging Solutions

    Trimble enhancements to Trimble VISION workflows increase the value of highly accurate image data. Survey, engineering and civil infrastructure professionals can now generate dense point cloud deliverables in Trimble Business Center from images captured using the Trimble V10 Imaging Rover. Users can also quickly generate 2D CAD and 3D real-world models from images captured with Trimble total stations using the streamlined workflows created within Trimble Business Center and SketchUp software.

    Availability

    Trimble Access field software, Trimble Business Center version 3.50 office software, the Trimble R8s GNSS receiver, Trimble S5, S7 and S9 Total Stations and TX8 3D Scanner are available now through Trimble’s Geospatial Distribution Channel.

  • Arithmetica to Launch Pointfuse Modeling Engine at Intergeo

    A vector model displayed in orthographic projection.
    A vector model displayed in orthographic projection.

    Arithmetica will be demonstrating Pointfuse at Intergeo, which is being held this week in Essen, Germany.

    Pointfuse is a powerful modeling engine that has been created to give professionals a fast, precise and flexible way of turning vast point cloud data sets (whether derived from LIDAR or photogrammetry) into high-fidelity vector models, the company said.

    Replacing painstaking and costly manual modeling, Pointfuse uses advanced techniques at the interface of mathematical optimization and computational statistics to automatically and rapidly convert point clouds into accurate vector models that can then be manipulated using any industry-standard CAD system.

    Pointfuse is fully mobile compatible, and can process data from mobile scanners as easily and quickly as from terrestrial or airborne systems. Results can be output and used on standard handheld mobile devices, making it  useful for creating and viewing highly detailed models in the field.

    A point cloud image of a motorway with crash barriers extracted and highlighted by Pointfuse. Data courtesy of Blom Aerofilms Ltd.
    A point cloud image of a motorway with crash barriers extracted and highlighted by Pointfuse. Data courtesy of Blom Aerofilms Ltd.

    The software will also fully automate extraction of features from point cloud data, allowing the intelligent recognition, measurement and cataloguing of objects and built environments, and other forms of extracted knowledge.

    George Skrobanski, chief technical officer of Arithmetica, explains the significance of this development. “Achieving the automatic extraction of features from point cloud data has been the Holy Grail for the industry. Pointfuse uses its proprietary technology to provide true automation and we believe this changes the game.”

    At Intergeo, learn more at Arithmetica’s booth (Hall: 3 – Booth: D3.046).