Advances in GNSS technology constantly expand the range of projects that benefit from them.
ComNav Technology
A telecom company adopted its CORS station to build China’s national CORS service for public companies. It is increasingly used for field robotics, including the development of self-driving cars.
Leica Geosystems
Bernhard Richter, vice president of Geomatics, Leica Geosystems AG, pointed to one of the biggest infrastructure projects in Europe, which aims to connect London to Birmingham, Manchester and Leeds with a high-speed railway system, avoiding the need to fly between those cities. This will have great environmental benefits because high-speed trains are much more efficient than planes.
However, high-speed rail requires tremendous precision. “First comes the prep work, moving dirt,” said Richter. “Then you must install the railroad ties with tenths of a millimeter precision relative to each other to avoid side accelerations. For a surveyor, it really has everything in one project. You need to constantly work with civil engineers. You then try to build as much as possible with machine-control-guided systems to make the leveling as automated as possible.” The project will include building bridges over whole valleys and monitoring them, particularly during the construction phase, to ensure that they are not moving.
“Even the factory they are building is huge, so just to build the factory you need a lot of surveying,” Richter said. The project is generating 25,000 jobs at 300 construction sites, all of which must be managed on very tight schedules. In this context, the quality of the survey gear is critical. “On a construction site, the surveyor should be an invisible person,” Richter said. “When they come with the big machines and want to get stuff done, they don’t want a surveyor on the site. So, he has to work off hours, then remain on alert and trust that what comes out of an instrument is correct.” Leica Geosystems is one of the main suppliers for this project. “They chose us because of our focus on reliability, trust and quality.”
Trimble
Software is increasingly driving sales, pointed out Boris Skopljak, vice president, Surveying & Mapping Strategy and Product Marketing at Trimble Inc. As an example, he cited Trimble’s SX12 scanning total station, which uses Trimble Access software to leverage scanning, imaging and traditional total station capabilities in the field. “We have provided more inspection tools to enable people to decide whether something is meeting the tolerance.” The Trimble Connect cloud-based collaboration platform, coupled with the continuous field and office connectivity, has driven productivity increases and moved customers toward choosing the company’s solutions, he said.
As an example of Trimble solutions, Skopljak cited City Rail Link, New Zealand’s first underground rail network and the largest transportation infrastructure project ever undertaken there. “The Trimble R10 was integral to acquiring static observations above the work site, while the Trimble S9, DiNi and Trimble Business Center network adjustment were game changers for the survey control network,” he said. To expedite mine tunneling the surveyors used the SX12’s combined total station and scanning functionality with Trimble Access field software infield inspection tools. “Fewer customers are choosing solutions on a spec. It’s not about how many satellites you can track, for how many days, or how many points you can scan. They are choosing solutions based on the ecosystem and productivity.”
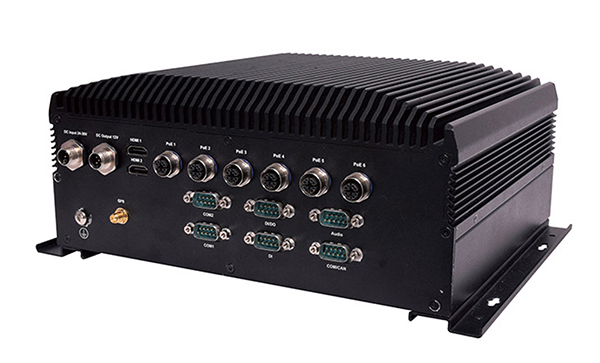
Lanner Electronics Inc., a designer and manufacturer of network appliances and intelligent edge computing platforms, has launched the R3S series of rugged, EN-50155-certified fanless vehicle/rail computers.
The R3S is equipped with a u-blox NEO-M8N module, which receives GPS, Galileo, GLONASS and BeiDou with the default set for GPS + GLONASS dual band.
Powered by Intel Atom x7-E3950 processor (formerly Apollo Lake) and Intel HD graphics 505 processor, R3S series offers power-efficient performance for consolidating the in-vehicle workloads such as video surveillance, control/monitoring, passenger information, and Wi-Fi hotspot sharing.
To ensure proper operations in moving vehicles, R3S series is certified with EN50155, EN50121-3-2, EN50121-4, EN50125-3 and EN45545 standard, E13 standard and has passed MIL-STD-810G shock and vibration resistance certifications. R3S series can operate under wide operating temperature range (-40~70° C) and 24~36/72~110 voltage input, indicating its excellent reliability in harsh railway settings.
Designed for in-vehicle surveillance, the new R3S series equip with 6x M12-protected PoE ports (any 3 or 4 ports can support IEEE 802.3at PoE+) for IP camera or wireless access point connection and one external removable 2.5-inch HDD/SSD drive bay for recorded footage storage.
For edge-to-cloud connectivity, R3S uses its internal GPS/GLONASS chipsets for GPS tracking and has two M.2 slots with up to 4x SIM card readers for failover LTE connection.
For consolidating the in-vehicle workloads such as in-vehicle control/monitoring and passenger information, R3S features a variety of I/O support, including 2x HDMI, DI/DO, 3x COM/CAN BUS and 4xUSB ports.
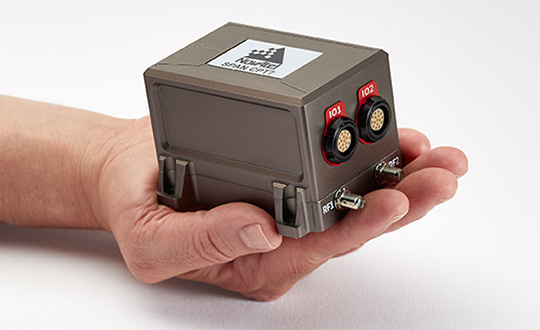
NovAtel, part of Hexagon’s Positioning Intelligence division, now brings users greatly improved processing speed and accuracy as well as significantly reduced signal acquisition time through the latest 7.07.03 firmware release.
The SPAN CPT7. (Photo: NovAtel)
The firmware works best with the recently launched TerraStar-X correction service, which delivers accuracy and reliability, as well as the OEM7, SPAN CPT7 and PwrPak7 products, which use signals from all GNSS constellations and frequencies to provide users with reliable autonomy and exceptional positioning availability.
The 7.07.03 firmware offers a significant improvement to the SPAN GNSS + INS (inertial navigation system) technology. SPAN with 7.07.03 shows improvements of up to 20% in the horizontal position over the entire SPAN IMU catalog and across various industry use cases including agriculture and marine. SPAN with 7.07.03 also provides improved motion detection, resulting in more robust time to convergence.
“The 7.07.03 firmware features improvements to both our SPAN Marine and SPAN Rail profiles that will greatly impact application performance and consistency,” noted NovAtel Director of Product Management, Neil Gerein, “The SPAN Marine Profile sees improvements to the heave performance and will allow users to start their work significantly faster thanks to a simplified setup for applications in marine dynamics. The SPAN Rail Profile improves position accuracy over long GNSS outages, which is crucial for applications in rail environments that often deal with potential signal obstructions such as trees, tunnels and dense urban areas.”
To download the 7.07.03 firmware update for your platform, click here.
The mobile mapping market size is expected to be worth more than $40 billion by 2024, according to a new research report by Global Market Insights.
The mobile mapping market is propelled by the increasing adoption of mobile devices such as smartphones and tablets across the globe. Smartphone users are extensively using mapping applications on their devices for navigation and driving assistance, the report said.
Furthermore, they are also leveraging on the GIS and GPS applications to access geo-referenced data for searching nearby restaurants, cinema halls and other landmarks. This is encouraging the technology companies to commence mapping across the globe to acquire accurate GIS data and provide an enhanced customer experience.
High initial investment is a major factor limiting the growth of the mobile mapping market. Currently, the market comprises a few major players with a long-standing expertise in location-based technologies. High initial investments in developing mobile mapping systems and assembling major components have restricted the entry of new players in the market.
According to the report, the software market is anticipated to grow at a CAGR of 15 percent over the projected timespan. The growing demand for geo-referenced data acquisition and data analysis software among the organizations is driving the mobile mapping market growth. The software assists organizations in simplifying the data extraction process by combining the vital details. It retrieves geographic and spatial data captured by the positioning devices to develop maps and other graphic displays. This data is also used by enterprises to build effective decision support systems, which will drive the market demand.
The report includes key industry insights in 250 pages with 341 market data tables and 38 figures and charts from the report, “Mobile Mapping Market Size, By Component (Hardware [Imaging Device, Laser Ranging Device & Scanning Device, Positioning Device], Software [Mapping Data Extraction, Data Processing], Service [Consulting, Integration & Maintenance, Managed Service]), By Application (Road & Railway Survey, GIS Data Collection, Vehicle Control & Guidance, Asset Management), By End-User (Agriculture, BFSI, Government & Public Sector, Real Estate, Retail, Mining, Telecommunication, Transport & Logistics), Industry Analysis Report, Regional Outlook (U.S., Canada, the United Kingdom, Germany, France, Italy, Spain, Australia & NZ, China, India, Japan, South Korea, Brazil, Mexico, Argentina, GCC, Israel, South Africa), Growth Potential, Competitive Market Share & Forecast, 2018 – 2024.”
The mobile mapping technology is used for conducting road and rail surveys, collecting GIS data, and developing vehicle control and guidance systems and asset management systems. The road and rail survey market is expected to register a growth rate of over 17 percent during the forecast period. It is used to analyze the road and rail infrastructure and plan the engineering operations with minimum disruptions. The surveying authorities across the globe are using mobile mapping technology to create maps for the transportation department for road assessment purposes.
The agriculture sector is estimated to grow at a CAGR of 22 percent during the forecast timeline. The integration of the GPS and GNSS devices into the farming process to acquire geospatial data is the primary factor driving the mobile mapping market share. Furthermore, the ability of the mobile mapping technology to monitor the crop yield and land variability also augments the demand for the technology among the farmers.
The European region accounted for over 25 percent global mobile mapping market in 2017. The increasing investments by the government agencies have accelerated the adoption of mobile mapping technology in the region. For instance, in 2017, the U.K. government established the Geospatial Data Commission to frame a strategy for using the public sector location data to support the country’s growth.
The Asia Pacific region will grow at a rapid pace over the forecast timespan. The rapid urbanization of the region and the growing number of infrastructural projects have fostered the growth of the mobile mapping market in the region. Moreover, the widespread adoption of smartphones has also driven the market size.
Prominent players operating in the mobile mapping market are Phoenix LiDAR, Sharp Corporation, Teledyne Optech, TomTom International, Topcon Positioning Systems, MapJack, Mapquest, Navteq, NCTech, Microsoft, Mitsubishi, NovAtel, Phaseone industrial, Hexagon, EveryScape, Foursquare Labs and XIMEA.
The major companies in the market are collaborating with other expert companies in the market to develop new product offerings and conduct strategic acquisitions to gain a competitive advantage over its competitors.
For instance, in 2017, Garmin acquired Navionics, a provider of electronic navigational charts to the marine industry. This acquisition is aimed at combining the data from Navionics charts and Garmin’s blue charts to develop improved navigational services to its customers. Similarly, in 2017, Hexagon entered into an OEM partnership with Smart Guided Systems to develop new precision technologies for commercial applications.
The global mobile mapping market research report includes an in-depth coverage of the industry with estimates and forecast revenue in USD respectively from 2013 to 2024, for the following segments.
Mobile Mapping Market, By Component
Hardware
Imaging device
Laser ranging and scanner device
Positioning device
Software
Mapping data extraction
Data processing
Service
Consulting
Integration & maintenance
Managed
Mobile Mapping Market, By Application
Road & railway survey
GIS data collection
Vehicle control & guidance
Asset management
Mobile Mapping Market, By End-User
Agriculture
BFSI
Government & public sector
Real estate & infrastructure
Retail
Mining
Telecommunication
Regions and Countries
North America
U.S.
Canada
Europe
UK
Germany
France
Spain
Italy
Asia Pacific
ANZ
China
India
Japan
South Korea
Latin America
Brazil
Mexico
Argentina
MEA
GCC
South Africa
Israel
PCTEL Inc. will demonstrate its next generation of multi-band, multi-network 4G LTE antennas at InnoTrans 2018 for the transit and rail industries, which takes place Sept. 18-21 in Berlin.
PCTEL’s new Trooper II and Coach II dual-carrier antenna platforms are designed to meet the requirements of increasingly complex RF communication systems in transportation applications.
The Trooper II antenna. (Photo: PCTEL)
Both Trooper II and Coach II antennas feature four 4G LTE antenna elements, and four 802.11ac Wi-Fi MIMO elements compatible with the world’s leading multi-network cellular routers.
The antennas support carrier aggregation for high-speed data transmissions in dense RF environments, such as transit depots and rail stations.
They also incorporate PCTEL’s proprietary high-rejection multi-GNSS technology for high precision tracking and asset management. Both platforms are housed in attractive low-profile housings and can be easily installed on all types of mass transit vehicles, or even fixed surfaces, the company said.
“PCTEL has a strong portfolio of products for rail and mass transit applications,” said Rishi Bharadwaj, PCTEL’s COO. “Our products have been qualified and deployed by major railroad equipment manufacturers and operators for over a decade. We are excited to showcase our industry-leading technology and capabilities at InnoTrans.
“High-performance antennas play a crucial role in the implementation of wireless technologies to improve safety and operational efficiency,” Bharadwaj said. “PCTEL’s innovative MIMO antenna technology also enables transit operators to deliver a better passenger experience through more reliable high-speed internet access.”
Tallysman, a manufacturer of high-performance GNSS antennas and related products, released its NMO (New Motorola) mounts for its dual- and triple-band GNSS antennas. NMO mounts are used in a variety of applications such as automobiles, railway cars and emergency vehicles.
With the introduction of this mount, customers can now upgrade existing GPS L1-only antennas to dual (L1/L2) and triple (L1/L2/L5) band GNSS antennas.
The NMO mount is available for Tallysman’s TW3872 (GPS L1/L2, GLONASS G1/G2, BeiDou B1, and Galileo E1) and the TW3972 (GPS L1/L2/L5, GLONASS G1/G2/G3, BeiDou B1/B2, Galileo E1/E5a+b + L-band correction) antennas.
The NMO mount is able to accept a ground plane (also available from Tallysman) to increase the gain of the antenna.
Tallysman antennas are housed in an IP67 compliant housing and are REACH and RoHS compliant.
Geoscience Australia, an agency of the Commonwealth of Australia, and Lockheed Martin have entered into a collaborative research project to show how augmenting signals from multiple GNSS constellations can enhance positioning, navigation and timing for a range of applications.
The research project aims to demonstrate how a second-generation Satellite-Based Augmentation System (SBAS) testbed can — for the first time — use signals from both GPS and the Galileo constellation, as well as dual frequencies, to achieve greater GNSS integrity and accuracy.
Over two years, the testbed will validate applications in nine industry sectors: agriculture, aviation, construction, maritime, mining, rail, road, spatial and utilities.
To improve precision navigation, a second-generation SBAS will use signals from both GPS and Galileo, and dual frequencies, to achieve even greater GNSS integrity and accuracy. (Graphic: Lockheed Martin)
“Many industries rely on GNSS signals for accurate, safe navigation. Users must be confident in the position solutions calculated by GNSS receivers. The term ‘integrity’ defines the confidence in the position solutions provided by GNSS,” says Vince Di Pietro, chief executive of Lockheed Martin Australia and New Zealand. “Industries where safety-of-life navigation is crucial want assured GNSS integrity.”
Ultimately, the second-generation SBAS testbed will broaden understanding of how this technology can benefit safety, productivity, efficiency and innovation in Australia’s industrial and research sectors, according to Lockheed.
“We are excited to have an opportunity to work with Geoscience Australia and Australian industry to demonstrate the best possible GNSS performance and proud that Australia will be leading the way to enhance space-based navigation and industry safety,” Di Pietro adds.
Basic GNSS signals are accurate enough for many civil positioning, navigation and timing users. However, these signals require augmentation to meet higher safety-of-life navigation requirements. The second-generation SBAS will mitigate that issue.
Once the SBAS testbed is operational, basic GNSS signals will be monitored by widely-distributed reference stations operated by Geoscience Australia. An SBAS testbed master station, installed by teammate GMV of Spain, will collect that reference station data, compute corrections and integrity bounds for each GNSS satellite signal, and generate augmentation messages.
“A Lockheed Martin uplink antenna at Uralla, New South Wales, will send these augmentation messages to an SBAS payload hosted aboard a geostationary Earth orbit satellite, owned by Inmarsat,” says Rod Drury, director of international strategy and business development for Lockheed Martin Space Systems Co. “This satellite rebroadcasts the augmentation messages containing corrections and integrity data to the end users. The whole process takes less than six seconds.”
By augmenting signals from multiple GNSS constellations — both Galileo and GPS — second-generation SBAS is not dependent on one GNSS. It will also use signals on two frequencies — the L1 and L5 GPS signals, and their companion E1 and E5a Galileo signals — to provide integrity data and enhanced accuracy for industries that need it.
Research partners
Lockheed Martin will provide systems integration expertise in addition to the Uralla radio frequency uplink. GMV-Spain will provide its magicGNSS processors. Inmarsat will provide the navigation payload hosted on the 4F1 geostationary satellite. The Australia and New Zealand Cooperative Research Centre for Spatial Information will coordinate the demonstrator projects that test the SBAS infrastructure.
Lockheed Martin has significant experience with space-based navigation systems. The company developed and produced 20 GPS IIR and IIR-M satellites. It also maintains the GPS Architecture Evolution Plan ground control system, which operates the entire 31-satellite constellation.
The Australian Government will invest $12 million in a two-year program looking into the future of positioning technology in Australia.
The funding includes testing of satellite-based augmentation systems (SBAS) that can offer instant, accurate and reliable positioning technology. The improvements in positioning could provide future safety, productivity, efficiency and environmental benefits across many industries in Australia, including transport, agriculture, construction and resources.
The two-year project will test SBAS technology that has the potential to improve positioning accuracy in Australia to less than five centimeters. Currently, positioning in Australia is usually accurate to five to 10 meters. While highly accurate positioning technologies are already available in Australia, they are expensive and only available in specific areas and to niche markets.
Research has shown that the widespread adoption of improved positioning technology has the potential to generate upwards of $73 billion of value to Australia by 2030.
Federal Minister for Infrastructure and Transport Darren Chester said the program could test the potential of SBAS technology in the four transport sectors — aviation, maritime, rail and road.
“SBAS utilizes space-based and ground-based infrastructure to improve and augment the accuracy, integrity and availability of basic GNSS signals, such as those currently provided by the USA Global Positioning System (GPS),” Chester said.
“The future use of SBAS technology was strongly supported by the aviation industry to assist in high accuracy GPS-dependent aircraft navigation. Positioning data can also be used in a range of other transport applications including maritime navigation, automated train management systems and in the future, driverless and connected cars,” he said.
Minister for Resources and Northern Australia Matt Canavan said access to more accurate data about the Australian landscape would also help unlock the potential of Northern Australia.
“This technology has potential uses in a range of sectors, including agriculture and mining, which have always played an important role in our economy, and will also be at the heart of future growth in Northern Australia,” Senator Canavan said. “Access to this type of technology can help industry and Government make informed decisions about future investments.”
The SBAS testbed will use existing national GNSS infrastructure developed by AuScope as part of the National Collaborative Research Infrastructure Strategy. It will test two new satellite positioning technologies — next-generation SBAS and Precise Point Positioning, which provide positioning accuracies of several decimeters and five centimeters respectively.
The SBAS testbed is Australia’s first step towards joining countries such as the U.S., Russia, India, Japan and many across Europe in investing in SBAS technology and capitalizing on the link between precise positioning, productivity and innovation.
Early this year, Geoscience Australia with the Collaborative Research Centre for Spatial Information (CRCSI) will call for organizations from a number of industries including agriculture, aviation, construction, mining, maritime, rail, road, spatial and utilities to participate in the testbed.
For more information about the SBAS testbed and National Positioning Infrastructure Capability visit the Geoscience Australia website.
Integration for infrastructure monitoring, navigation
By Desislava Staykova and Nico Zill
Rapid development in the technology of combined sensors within complex systems has taken place over the last decade. Such systems provide different accuracy levels, offering the possibility of use in application areas such as surveying, railway and automotive engineering, land administration, and for navigation purposes.
Multi-sensor integration and fusion is a comprehensive process of reading and combining sensor signals to ensure a higher level of data reliability and accuracy. Input data from every sensor and further combination with specially developed algorithms ensures the complete identification of observed features, which would be impossible with data from each individual sensor operating separately.
Because of its flexibility and the possibility for fast and continuous data measurement, multi-sensor integration and fusion has evolved rapidly in different areas. The object of this article is to overview the use of high-end and low-cost system complexes and software solutions for the purposes of the engineering geodesy, transportation and navigation.
Deformation Monitoring
Geodetic measurements for monitoring and displacements analysis of various engineering objects have always played an important role in maintaining structures like bridges, dam walls, building columns, wind power generators, and other construction.
This requires properly designed network schemes enabling continuous and highly accurate measurements. For such angular and length measurements of millimeter-level accuracy that must be performed in intervals of minutes, hours or a day, standard total stations are being replaced by automated ones (ATS) comprising precise servomotors, automatic target recognition sensors, electronic inclinometers, self-calibration control systems and other sensors.
The synchronized process of high-accuracy measurements (angular accuracy better than one second and distance accuracy better than one millimeter) and simultaneously adjustment software enables real-time or post-processing deformation monitoring and analysis. This type of hardware and software combination is often used during the life cycle of a project for construction and reconstruction of objects and for regular monitoring of the object’s stability.
Terrestrial Laser Scanning. The need for precise modeling and geometrical characterization of large structures and open areas as dams, mines, landslides and others cannot be covered by traditional surveying methods which require the use a huge number of points for describing the object’s surface. The development of laser scanning technology in the last decade offers a new way for deformations measurements and becomes part of the infrastructure monitoring.
The high scanning speed, dense measurement of huge numbers of points and high accuracy gives terrestrial laser scanning (TLS) an advantage other technologies used for large structural monitoring. Compared with the technologies using single point monitoring approaches where the displacements detection is limiteded to specific benchmarks, TLS provides high data redundancy. Combined with proper software products, this technique offers the possibility for high-accuracy surface modeling and displacement detection at the millimeter level. The scanned object consists of a large number of points, which allows implementation of mathematical algorithms for modeling and analyzing the object’s behavior.
Another advantage of TLS as a remote sensing measurement tool is the minimized impact of the operator over the observed points and network.
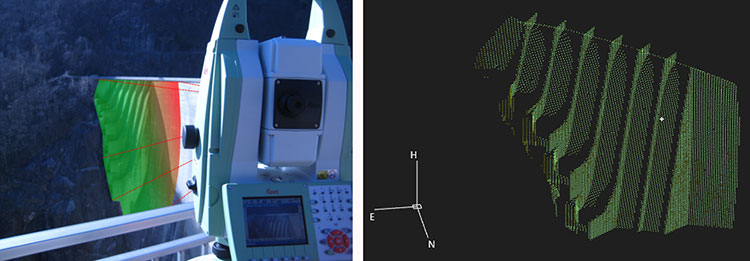
A new method for structural monitoring has emerged recently, comprising the advantages of the TLS, GNSS, geotechnical and meteo-sensors, enabling wide-area coverage and surface monitoring. One such tool is shown in Figure 1.
Figure 1. Terrestrial laser scanning combined with GNSS and other sensors enables wide-area coverage and survace monitoring. (Images courtesy of Leica Geosystems)
Mobile Laser Scanning
For different navigation purposes, for monitoring and investigation of wide areas, static measuring methods are being replaced by complex mobile measuring combinations of both high-end and low-cost sensors, to ensure fast, continuous and accurate data acquisition.
Recently mobile laser scanning (MLS) has experienced rapid development and proved its usage particularly in the railway and automotive sectors, for deformation analysis, for monitoring and documentation of as-built street and railway networks and the corresponding infrastructure objects.
MLS for Rail and Road. The advantages of MLS for fast, high-accuracy and complete scanning of the surroundings make it an important part of current railway and road conditions monitoring.
Continuous data acquisition and processing minimizes operator errors, and significantly reduces the time for performance of the surveying work and a-posteriori data analysis.
Localization and recognition of infrastructure objects forming part of railway and road environment has long been of primary importance in the transportation sector.
For determination and documentation of as-built railway and street networks from acquired data, Technet-Rail (Berlin, Germany) developed two software solutions, SiRailScan and SiRoadScan, for point-cloud analysis. The integrated mathematical algorithms ensure high-accuracy extraction and adjustment of the as-built left rail, right rail and center line, as well as of the roads’ border lines.
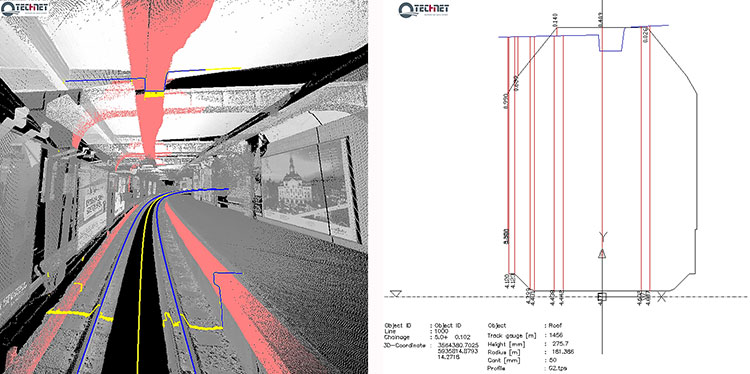
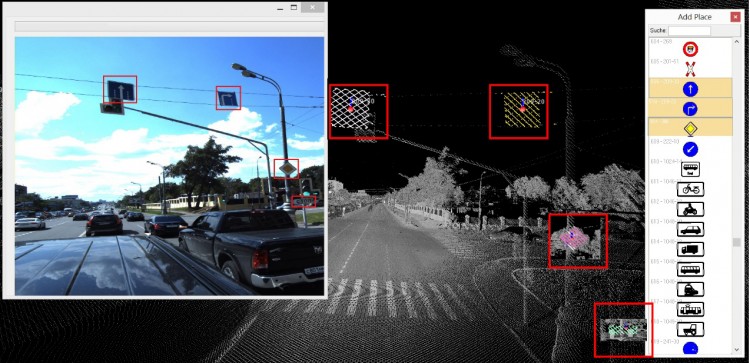
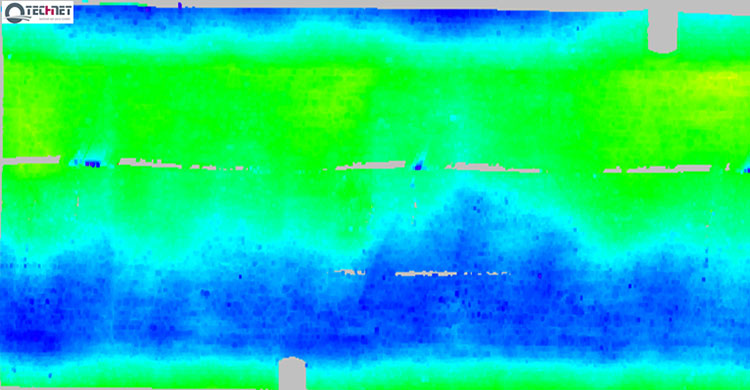
The adjusted geometry forms the basis for driving speed control tests, determination of the as-built environment for clearance detection and documentation, investigation of catenary wire deviations, ballast and road settlements, traffic signal positions, and any changes in the existing situation (see Figures 2 and 3).
Figure 2. Adjusted as-built rail geometry with SiRailScan used as basis for performance of clearance analysis and documentation in chainage based railway system.Figure 3. Adjusted with SiRoadScan road border lines. Detection and recognition of the roads signals.
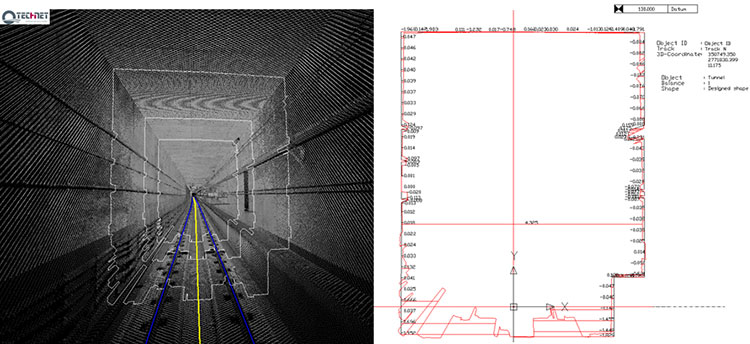
In response to the growing interest in application of the MLS technique and a-posteriori data adjustment for monitoring purposes, Technet-Rail developed additional tools for deformation analysis of structures such as tunnel bodies, railway bridges and road surfaces. The integrated software solutions enable comparison between the designed and as-built situation, epoch-wise analysis, modeling of the structure, development into 2D followed by color-coded deformation map (see Figures 4 and 5).
Figure 4. Tunnel deformation analysis performed with SiRailScan based on the as-built rail geometry. Automated calculation of differences between designed and as-built tunnel structure.Figure 5. Tunnel deformation analysis with SiRailScan based on a pre-defined form and direction.
MLS for Navigation. Multi-sensor integration is the basis for operation of the moving measuring systems integrating hardware devices such as laser scanning devices, GNSS, inertial measurement units (IMU), distance measuring instruments (DMI) and specific software algorithms for data synchronization. A milestone in the development of such systems is the measurement and navigation in indoor places or in areas with low or no GNSS coverage.
The need for safe and reliable navigation in transportation systems such as train control systems, intelligent vehicle systems, system tracking, in urban environments, underground areas, and other areas with no available GNSS signal stimulated much research in the area of multi-sensor integration and fusion. the main scope of some studies is the integration of different sensors delivering information for the attitude, velocity, acceleration such as the IMUs, inclinometers, wheel sensors, and correspondent filtering algorithms to achieve the best possible position accuracy without usage of GNSS signals.
Conclusion
For decades, infrastructure objects such as dam walls, bridges, tunnels, roads and railway tracks form a substantial part of civil engineering and engineering geodesy. The integrity of their structure requires deep knowledge of the behavior of these objects and the various methods for their optimal and high accurate monitoring. The rapid development evolution of multi sensor integration in combination with laser scanning technology makes it an essential method for accurate, continuous and dense measurement for the purposes of the engineering surveys.
Desislava Staykova and Nico Zill are engineers with Technet-rail 2010 GmbH, Berlin, Germany.
NM Group is nearing completion on an aerial mapping project covering more than 16,000 kilometers of United Kingdom rail network.
In 2014, NM Group was engaged to map the rail assets with a mix of high-tech laser measurement and imaging equipment, as part of a project to improve asset maintenance, operational effectiveness, efficiency and safety.
The project used a mix of specially commissioned lidar and high-resolution multi-angle cameras mounted on helicopters, carrying out aerial operations and ground-control activities over a four-month period and completing it before winter. The survey information was rapidly transported to NM Group’s Technology Centre in Knaresborough, North Yorkshire, where a team of specialists have been converting nearly a petabyte of raw data into a wide range of terrain, asset and imaging outputs.
“I am incredibly proud of the way our team has responded to this large and challenging project, completing the data capture within an unprecedented timescale and producing a high-quality output that will serve the rail network for years to come,” said NM Group’s CEO Kevin Jacobs.
NM Group’s contribution to the program provides the geospatial fabric on which other layers are overlaid, the basis for asset location mapping and the start point for the design of upgrades and modifications. Traditionally, this information would have been created by a visit to the site by a team of surveyors.
The new method will significantly reduce the need for future field work and trackside access. It will also facilitate more efficient maintenance, allowing crews to identify and access assets more safely and efficiently than in the past, via apps on a range of mobile devices, NM Group said.
NM Group is a specialist service provider of asset management, surveying and mapping solutions to sectors including energy transmission and distribution and road and rail transport. Applying a range of remote sensing and geospatial technologies, the company offers a full range of services from data acquisition through to analytics and web applications for wider access to information.
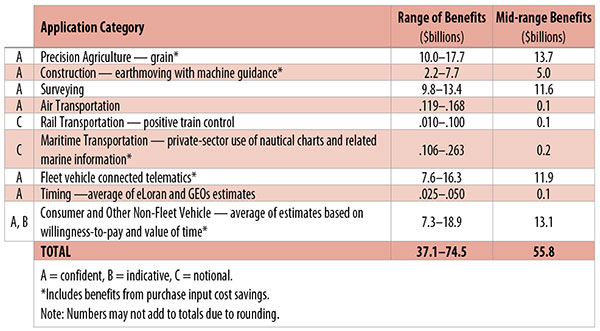
Table 1. Preliminary 2013 U.S. GPS economic benefit estimates. (Chart: GPS World, based on data from author)
This article is based on a presentation to the National Space-Based Positioning, Navigation and Timing Advisory Board in June 2015. The study reported on at the meeting was requested by the National Executive Committee for Space-Based Positioning, Navigation and Timing. It demonstrates the widespread use and importance of GPS to the U.S., with estimated benefits in 2013 of about $56 billion, or 0.3% of GDP for a subset of applications. The study is the first part of an effort that is expected to refine and extend this analysis.
By Irv Leveson
Critical to many civilian applications and innovations, GPS brings great economic benefits. These benefits have grown rapidly with the integration of GPS with other technologies and its wider and deeper infusion into applications. New GPS signals and other improvements in the system will further expand and enhance use. The unmistakable conclusion: GPS is everywhere.
Benefits of GPS to the U.S. will increase with the availability of other GNSS systems, even though GPS will constitute a smaller share of global GNSS benefits. The U.S. will continue to provide leadership, standards and innovation in technology and applications with positive domestic feedback.
GPS and other GNSS and enhancements raise productivity; reduce and avoid costs; save time; enable improved and new production processes, products and markets; increase health and well-being; reduce injury and loss of life; improve the environment; and increase security.
The National Executive Committee for Space-Based Positioning, Navigation and Timing (PNT), which is responsible for maintaining U.S. leadership in GNSS, commissioned a study to assign a quantitative value to the broad economic uses of GPS. The purpose is to inform the public, federal decision makers and critical infrastructure owners/operators on the importance of GPS and the need to protect it from disruption. Assessing the economic implications of actions such as preventing or disallowing interference, spectrum reallocation, developing supplementary or backup systems and/or toughening receivers can be informed by value estimates and the data used to derive them. In addition, economic values can contribute to planning for GPS modernization and analysis of budgets. Baseline estimates facilitate comparisons with future developments. GPS benefit estimates will be “ballpark” no matter how sophisticated the methodology because of limits to the availability of information, but in many cases, knowing orders of magnitude is essential in choosing courses of action.
Widespread, Pervasive Impact. The technological environment is one of rapid changes in information and materials technology and integration of technologies at levels ranging from systems on a chip to large-scale systems. GPS is increasingly integrated with other technologies and systems that build on each other to achieve greater outcomes.
The U.S. Department of Homeland Security counts GPS as an enabling technology because of its crucial role in 14 of the 16 industries that are classified as part of the nation’s critical infrastructure. It is useful to view GPS’ role as being especially important in “enabling the enablers,” industries that particularly support the rest of the economy and are at the forefront of economic growth. The most notable of these are transportation, communications, power and financial services.
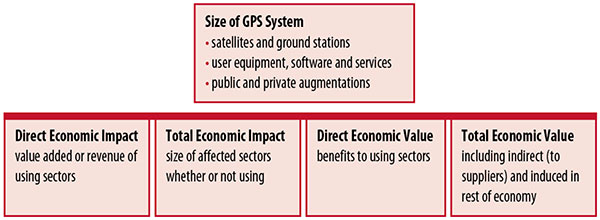
Economic Value versus Impact
Economic value is the addition to the value of the economy from the provision of a good or service, or the introduction of a technology. Benefits are measured relative to what would have been expected if there were no GPS. Direct economic value is the increase in value in using sectors. Total economic value includes increases in value to suppliers and value induced in the rest of the economy.
Direct economic impact, on the other hand, refers to measures of the importance of sectors that are using GPS. Total economic impact is the importance of sectors affected by GPS, whether they are using it or not. Total economic impact of GPS is virtually the size of the whole economy, so it is not very meaningful.
Direct economic impact is measured by value added of using sectors when the purpose is to avoid duplication among sectors that buy from and sell to each other. It may be measured by revenue for a single sector when adding sectors is not involved, so there is no need to avoid duplication.
The distinction between economic value and economic impact is critical. Even if economic impact is measured by value added rather than revenue, the value is not the net addition to the economy from the use of the product or technology. It is only the size of the using sector. See Figure 1.
Figure 1. Measuring GPS economic value and economic impact. (Chart: author)
The GSA Study
The most comprehensive estimates of global GNSS market size come from the European GNSS Agency (GSA), which has released four market reports from 2010 through 2015. The data are measures of economic impact and not economic value. The reports are of great interest because of their comprehensive global look at the sizes of markets and inclusion of forecasts. In contrast, the emphasis in this part of the present study is on current economic value, with U.S. benefits assessed for GPS.
One reason for interest in the GSA reports is that market information and projections often are proprietary and there can be great inconsistency across market research studies. GSA makes use of many confidential studies without revealing which sources contributed to each estimate. It apparently has been allowed to incorporate proprietary information from a number of market research firms since the data is subsumed in GSA’s own estimates and/or presented in graphs for which underlying numbers are not provided — and from which it is often difficult to even roughly extract them.
The 2015 report stated the methodology as: “The underlying forecasting model uses advanced forecasting techniques applied to a wide range of input data, assumptions and scenarios…Where possible, historical values are anchored to actual data.” Results were checked against opinions of market segment experts and market research reports. However, these analyses are not provided in the reports and have not been made available.
A distinction is made between the core market which covers the value of components that provide GNSS functionality in devices and enabled markets which “represent the services and devices enabled by GNSS.” The 2015 report provides global data on both core and enabled market and goes into much more detail on core markets for application sectors. In addition to providing sector information that did not appear previously, the 2015 report presents data on the extent to which each combination of the GNSS constellations was supported by receivers or chipsets offered by suppliers. Additional information on enabled sectors is in earlier reports.
GSA found in its 2015 market report that:
3.6 billion GNSS devices were in use globally in 2014, of which 3.08 billion were smartphones and .26 billion were for road.
North America had about 450 million devices installed (about 80% U.S.).
North America had 1.4 devices per capita in 2014.
North American shipments were 250–300 million in 2013.
Global core revenue was estimated at roughly €62 billion and enabled revenue at €227 billion in 2014. As noted, core revenue includes GNSS device components, software and services, while enabled revenue refers to applications.
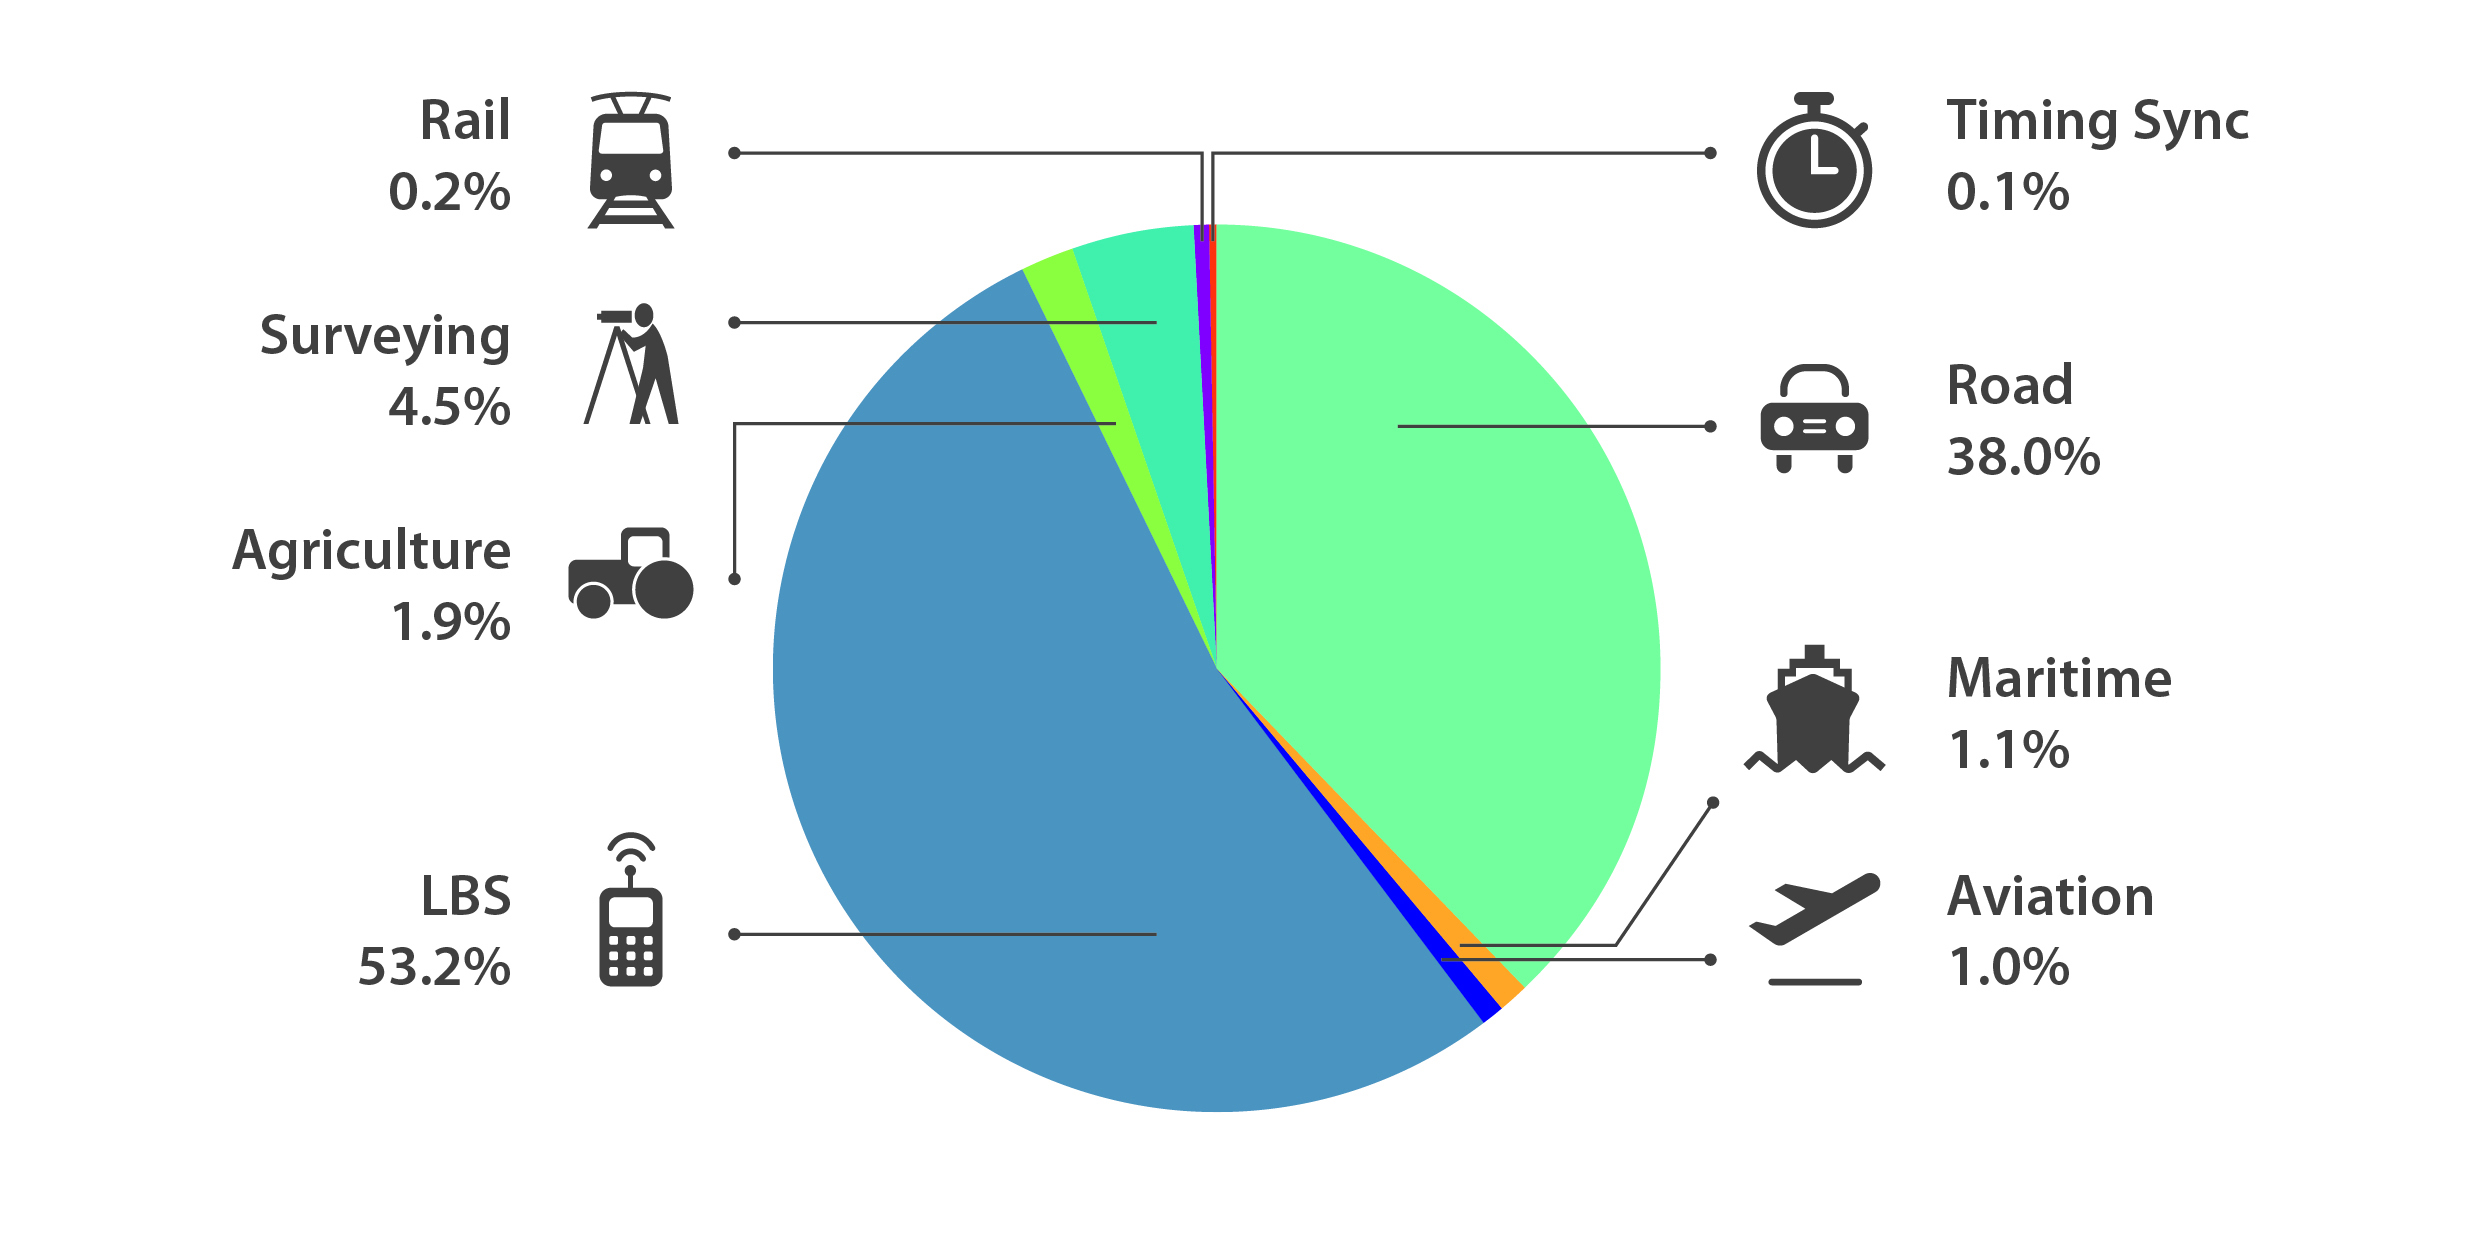
Location-based services (LBS) was projected to account for 53.2% of 2013–2023 core revenue growth, and road for 38%.
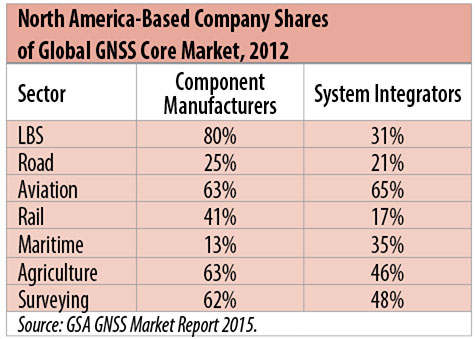
North American-based companies had sizeable shares of the global GNSS core market in 2012, particularly among component manufacturers. (See Table 2). Their market share among system integrators was highest in aviation.
North American-based companies had a 44% market share of value-added services revenue in 2012.
Table 2. North America-based company shares of Global GNSS core market, 2012. (Chart: author)
Markets and Applications
The pervasiveness of GPS-enabled applications is illustrated by the following statistics:
900 million mobile phones that incorporated GPS were sold globally in 2012.
The U.S. had 188 million smartphone subscribers and 263 million Internet users in 2013.
20% of U.S. mobile phone users get up-to-the-minute traffic or transit information.
The new industry category in the 2012 North American Industrial Classification System: “Internet publishing and broadcasting and web search portals” had U.S. revenue of $87 billion and 181,000 employees in 2012.
Google estimated that its search and advertising tools provided $111 billion in economic activity in the U.S. in 2013.
Deloitte estimated that Facebook enabled $104 billion of economic impact and 1.2 million jobs in North America in 2014.
Google Play and the Apple App Store each had more than 1.2 million apps in 2014.
How GPS Is Used. Uses of GPS include:
In agriculture for auto-steering tractors, combines and sprayers for precise operation, variable rate technology for precise placement of seed, fertilizer and pesticides, and for yield monitoring.
Managing forest health and ecological restoration, reducing fire and other hazards, and harvesting forest products.
In commercial fishing, navigation, finding fishing locations and monitoring fish catch by authorities.
In construction to direct the movement of dozers, excavators, pavers, scrapers, compactors and other heavy equipment and the placement of blades to give precise results.
In open-pit mining to guide loaders, dozers, drills and draglines.
In offshore energy exploration and development, for drilling, installations, pipe laying, diving operations, pipe inspection, repair and abandonment.
In surveying, to greatly reduce costs and to improve quality of products that rely on it.
In aviation, for navigation and monitoring positions of aircraft and for satellite-based augmentation systems (WAAS in the U.S.). GPS is the principal source for navigation for aircraft equipped with Area Navigation (RNAV) or Required Navigation Performance (RNP).
Railroad train pacing systems for cruise control, positive train control to keep track of train location and movement authorities, track defect location, and locating trucks with rail workers.
In marine transportation, for navigation, collision avoidance, communications and situational awareness and for monitoring by offshore authorities.
In vehicles, with handheld and embedded devices for navigation and fleet management.
For precise timing and time synchronization and frequency coordination (syntonization). It is used most notably in broadcasting and communications, including both cell phones and traditional telephone applications and the Internet, so packets arrive at the same time, for power generation and distribution to locate problems, and in financial services for time-stamping transactions.
In first responder services for location, navigation and communications and in emergency warnings and evacuations.
In structural monitoring of dams and bridges.
In environmental monitoring, including vegetation growth and sea-level change.
LBS and GIS
Rapid growth is taking place in location-based services (LBS) and geographic information services (GIS), which include everything from indoor location to many aspects of the Internet of Things and the “sharing economy,” and sophisticated systems for information management, analysis and display.
GPS is used for tracking and inventorying assets ranging from heavy machinery on farms and construction and mining sites, to pipes and other materials, containers in trucking sites and ports, and the location of utilities in the ground. In logistics it facilitates planning of product flow and transport.
The growth of same-day delivery — which takes advantage of Internet, cell phone, and location and navigation technologies enabled by GPS — is a continuation of the growth in just-in-time delivery that has been a phenomenon in manufacturing for several decades. Now it is having a profound effect on wholesale trade, retail trade and transportation.
The size of the LBS and GIS sectors is not defined and measured in a consistent way, and except for vehicle use, there is little information on productivity and saving in costs and time. (See sidebar box.)
LBS and GIS Market Size Estimates
For LBS and GIS, definitions and measures can vary greatly and often are not explicit.
Location-Based Services Market Size Estimates
Frost & Sullivan estimated the global LBS market at €22.8 billion in 2012 and forecast €32.0 billion in 2015.
Market and Markets estimated global LBS revenue at $8.1 billion in 2014.
Berg Insight estimated North American LBS revenue at $835 million in 2012.
(The U.S. can be assumed to spend 20–25% of the world value and about 80% of the North American value.)
Geographic information Systems Market Size Estimates
BCG estimated revenue of the U.S. GIS industry at $73 billion in 2011.
The global GIS market will reach $10.6 billion in 2015, according to a report of Global Industry Analysts in 2013.
The Canadian Geomatics study found private-sector spending of $2.3 billion in 2013. If U.S private spending was the same percentage of GDP, it would be $23.6 billion.
International Trade
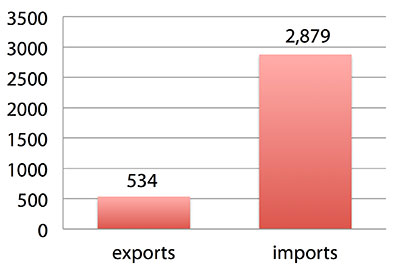
Official data show a $2.3 billion U.S. deficit in trade in GPS equipment in 2013. This gives an incomplete and misleading picture of the role of the U.S. and the benefits that result. See Figure 2.
Figure 2. U.S. trade in GPS equipment, 2013 (millions of dollars). (Chart: author)
The trade numbers for GPS equipment do not include revenue for licensing, international payments received by social media and e-commerce companies, or other Internet-based revenue for which the U.S. may have a substantial net trade surplus and which are an important source of revenue and profits of U.S.-based companies.
Imports of GPS equipment software and services enable the U.S. to gain more efficient production in many applications at home and enable the U.S. to export more goods and service that rely on GPS.
Exports of GPS equipment come back to the U.S. as components that benefit U.S. businesses and consumers with more capable products and lower prices. Exports of GPS equipment enable other countries to build on the technologies and contribute to innovation, while imports enable the U.S. to share in foreign innovations. Exports of GPS equipment and associated knowledge also raise incomes in other countries, creating larger markets for U.S. goods and services.
Scope of Benefit Estimates
The U.S. benefit estimates reported here are the result of an initial effort and are not meant to be comprehensive. More work is expected to be done to fill in some of the gaps.
Sectors were chosen based on availability of information to permit relatively robust estimates and importance to the economy or policy issues. These considerations limited the number of sectors for which estimates could be made. Methods were determined based on the nature of available studies and varied among sectors. Only economic benefits were included, with health and safety and environmental benefits left for later research.
Benefits include the value to users above their costs (consumer surplus). Benefits of GPS are compared with alternatives without GPS or an application using it (counterfactuals). Estimates are gross. They are not reduced by the costs of achieving the benefits. Contributions of augmentations are included, since a quantitative basis for separating them is not available.
Estimates were primarily benefits through productivity and cost savings in operations, with savings in input costs included where their magnitudes were clear. Benefits to the rest of the economy are not included. Illustrative allowances were made for the contributions of other technologies and systems to the outcomes examined.
In the case of GPS timing, the estimates were based on the costs avoided by not having to develop an alternative timing source on the assumption that the type of alternative source possible would have evolved from the time GPS became available. The measure does not represent the value of GPS time and synchronization to the nation and to users relative to the absence of a precise time and frequency source.
Government was included in the estimates for construction, surveying, and fleet and non-fleet vehicles. For timing and non-fleet vehicle benefits, two alternative measures are averaged. Sectors with lower quality estimates — rail and maritime transportation — were included because of their importance to the economy. Shares of benefits attributable to GPS were rough assumptions. More robust estimates would require extensive data collection and interviewing in studies greatly exceeding available time and resources.
The primary focus was on productivity improvements, cost savings and cost avoidance, where costs include users’ time. Productivity increases and cost reductions allow more to be produced with the same amount of resources in the sectors utilizing the technology or allow resources to be freed up for other purposes. In that sense, they are equivalent.
When benefits are measured by productivity gains or cost savings, much of consumer surplus (the value to users above what they pay) is implicitly included. Some sources measure value by willingness-to-pay. Willingness-to-pay includes consumer surplus. It also encompasses costs of the purchase and other costs incurred by the user.
Criteria for Selecting Sectors
The potential for making sector estimates of economic benefits was categorized in three basic levels:
confident: based on robust estimates.
indicative: based on one or more less robust estimates.
notional: illustrative, if major contributions of other technologies are not separated and estimates must be based on a plausible percentage of a larger benefit, or if information is not available and estimates must be based on a percentage of market size.
Choices among categories for estimation and estimation methods depended not only on which of the basic criteria are satisfied but also on the following additional criteria:
The importance of the sector to the economy, for example as an enabler of other activities.
The potential use of benefit estimates for the category as an input into analyses of the effects of signal disruption.
Several dozen studies were assessed to determine categories for inclusion and to select studies that can form the basis of estimation. Studies for use in estimation of benefits in a category were chosen according to how well they met the following criteria:
GPS. A test of introduction of GPS or comparison with and without GPS rather than benefits of a broader service.
Coverage. Estimates that cover a major part of the category.
Robustness of estimates, including the type of review the source is likely to have had.
Consistency. If alternative better estimates are not in such a wide range that an average is less meaningful except where explainable by expected sources of variation.
Timeliness. Preference to a recent period being covered by the estimates.
U.S. Economic Benefit Estimates
Preliminary estimates of economic benefits for included U.S. sectors totaled $55.8 billion in 2013. Averaging the alternative estimates, the sum of the benefits in the two vehicle categories is $25 billion, by far the largest of the sectors estimated. Next were agriculture with $13.7 billion, and surveying with $11.6 billion.
Economic benefits are underestimated for several reasons. Some sectors are not included because of lack of information on productivity and cost savings, namely LBS other than vehicle, including asset tracking and locating people; GIS and mapping other than nautical charts, forestry, fisheries, mining, energy exploration and development, land and coastal management, weather, and scientific applications and space.
Parts of others are not included: non-grain agriculture, construction other than earthmoving, GPS in aviation for some Area Navigation (RNAV) Standard Instrument Departure Routes (SIDs) and Standard Arrival Routes STARS) and Required Navigation Performance (RNP), and rail other than positive train control.
Some estimates are conservative. The value of saved time in non-fleet vehicle transportation is based on the recommendation of the Transportation Research Board rather than the much higher value used by the U.S. Department of Transportation.
Some types of benefits are not included — specifically, benefits of GPS timing applications above the cost of alternatives, and avoided income loss, property damage and medical costs associated with reduced accidents and improved emergency response.
Increases in benefits between 2003 and 2005 are not estimated.
And, as indicated, non-economic benefits such as those to health, safety, security, reduced loss of life and to the environment are not yet addressed.
Benefits as measured thus far are about 0.3% of GDP in one year. If all of the excluded sources of benefits were quantified, the benefits would be much larger.
Estimating Benefits for Sectors
U.S. economic benefits of GPS for grain farming were estimated for farms with grain sales of $250 million or more. The same method as was applied for earthmoving in construction.
A composite range of percentages of productivity gains and cost savings of 18–25% was determined from various studies. In the case of grain farming, benefits also come from yield increases due to improvements in plant health. The productivity gains used in the calculations incorporated both sources of benefits. Productivity was taken together with market size and an estimate of 68% adoption of technologies taking advantage of GPS to compute initial estimates of benefits. A notional adjustment was then made to exclude the contributions of other technologies and GNSSs. While having the adjustment determined by a group of experts would have been preferred, that was not possible with the time and resource constraints of the study.
Benefits of GPS machine guidance with earthmoving in construction were calculated based on an 8–12% share of construction for earthmoving operations, a benefit of 18–22% and a 20–25% adoption rate, relying on a number of sources.
For surveying, an estimate of market size was constructed based on U.S. Bureau of Labor Statistics data on numbers of surveyors, cartographers and photogrammetrists in the engineering services industry vs. the rest of the economy, together with revenue data for private surveying and mapping from the Economic Census. This was combined with a composite estimate of productivity gains over conventional surveying of 45–55% and an assumption of 100% adoption.
The benefit values for air transportation were estimated for the study by the Federal Aviation Administration (FAA) based on effects of WAAS and performance-based navigation (PBN). The rail estimates cover only positive train control, which is in early stages of implementation. Information is highly uncertain, but impacts as of 2013 are small. Maritime benefits were based on updating an earlier estimate of benefits of the private-sector value of nautical charts. The estimates for fleet vehicle-connected telematics were based on savings found in an extensive survey of fleet customers over a five-year period.
Timing benefits were based on the avoided costs from not having to develop an alternative source of timing. Alternatives considered were eLoran and a system of three geostationary satellites. Since there would have been strong pressures to develop an authoritative timing source in the absence of GPS timing, it was assumed that one of the alternatives would have been developed rather than assuming as in other cases that technologies in use when GPS became available would have continued in use.
Two estimates also were made for consumer and other non-fleet vehicle use. One was based on extrapolating results of a study of consumer willingness to pay for navigation services, and the other on time saved by navigation services.
Part of the benefits of LBS other than those that are vehicle-related and for GIS are implicitly included in estimates for sectors that use them.
Data and Research Needs
Additional work would be desirable to extend and refine the GPS economic benefit estimates, quantify safety-of-life and environmental benefits, examine international benefits, assess potential future benefits and consider loss from denial of GPS. Benefits of many new and rapidly growing services are yet to be quantified.
Systematic research is needed to fill in gaps in adoption, productivity and cost savings with comparative before-and-after studies as well as with case studies. Robust studies require major and often multi-year efforts involving targeted data collection, which are rarely done by government or academics for GNSS. Information needs to be much more granular, taking into account specific functions in which GNSS is used (such as plowing, seeding, fertilizing, harvesting), specific GNSS and non-GNSS technologies employed in each function at each site, and extent of their use.
Also, results for GPS might be improved or at least be more acceptable if the contribution of other technologies and GNSSs to measured benefits were assessed by a group of knowledgeable individuals rather than by a single researcher.
Information on market size, penetration and growth from market research firms, which tends to capture recent developments, is based on greatly varying sources and methods, resulting in major gaps and great divergence in estimates, especially in new or rapidly growing areas like LBS and GIS. The North American Industrial Classification System (NAICS) and its application in federal data collection such as in the Economic Census lags far behind in recognizing new categories and providing sufficient detail. Lags in data collection and research lead to understatement of the use and benefits of GPS.
Looking to the Future
Future benefits are expected to be even greater because of evolution of technologies, expansion of GNSS systems, creation of new products and markets, and growth and penetration of markets. The possibilities are suggested by the numerous nascent applications that have been emerging. Many will be enabled by expanding GNSS systems, signals and capabilities in conjunction with geographic expansion and increased capabilities in wireless systems.
The progression of platforms is long and growing: mainframes, PCs, mobile phones and other handheld devices, tablets, game controllers, wearables, TVs, home appliances, air and space — including planes, UAVs, satellites, planets, moons, rovers, rockets and spaceships.
The widespread availability of platforms and the growing ability to utilize them promises a long way to go in developing applications and deriving benefits.
Acknowledgments
The author thanks the PNT Advisory Board and Gov. Jim Geringer, liaison from the board to the study; Jason Kim of the Department of Commerce who oversaw the project; Jim Miller of NASA; and the members of the interagency Economic Study Team that advised the effort. Numerous additional people in and out of government provided information and assistance. Responsibility for the content and findings rests with the author.
IRV LEVESON, who has a Ph.D. in economics from Columbia University, is an economic and strategy consultant and founder of Leveson Consulting. He has done extensive work on GNSS markets and issues for more than 10 years. He is a member of the Institute of Navigation, the American Economic Association and the National Association for Business Economics.
2015 GNSS Market Report: European GNSS Agency Provides a Fresh Look at Worldwide Growth
The fourth edition of the European GNSS Agency’s (GSA’s) GNSS Market Report provides a comprehensive source of knowledge on this dynamic global market. The report has become a key reference for organizations building their GNSS market strategies. The new edition provides:
Comprehensive updates on previous analyses;
New statistics of the GNSS receiver capabilities of the 31 top global manufacturers, offering in total more than 300 models;
Insights on the GNSS industry and regional shares of the GNSS market
A more granular segmentation of the global GNSS market, namely: European Union (EU28); North America (including the United States, Canada, Mexico); Asia-Pacific (including China, Japan, Australia, India, Republic of Korea); Non-EU28 Europe (Norway, Switzerland, Russia, Ukraine); Middle East and Africa (Turkey, Israel, South Africa, UAE, Saudi Arabia); South America and Caribbean (including Brazil, Argentina, Colombia, Guatemala)
Information on a new market segment: Timing and Synchronization
Plus additional applications within existing segments, such as recreational navigation, fishing vessels, personal locator beacons, emergency locator transmitters and digital tachograph.
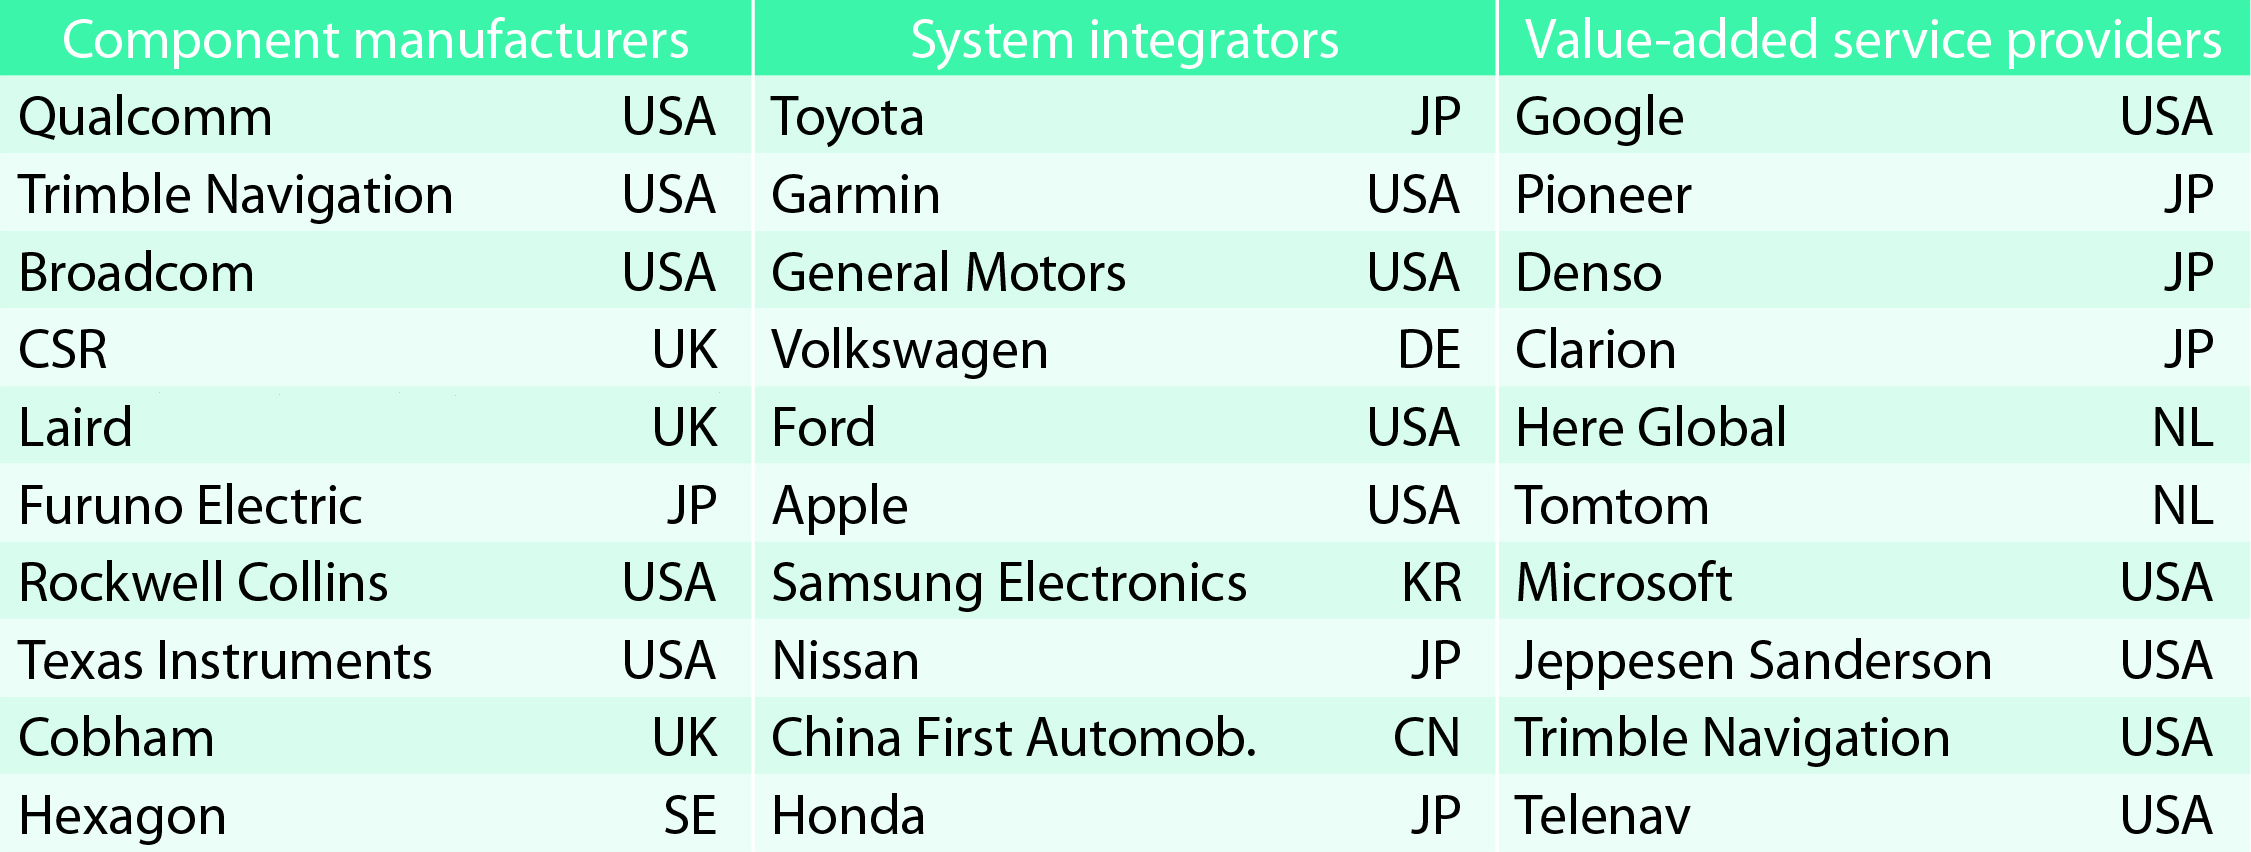
TABLE 1. Top 10 companies in each group based on 2012 revenue.
Key Findings
Top-line insights from the fourth GSA GNSS Market Report:
The global GNSS downstream market is forecast to increase by 8.3 percent annually from 2013– 2019, then slow down to 4.6 annually around 2023, growing on average faster (7 percent) than the forecast global GDP in this period (6.6 percent).
The installed base in the mature regions of EU28 and North America will grow steadily (8 percent per year) to 2023. The primary region of growth will be Asia-Pacific, which is forecast to grow 11 percent per year from 1.7 billion in 2014 to 4.2 billion devices in 2023 — more than the EU and North America together. The Middle East and Africa will grow at the fastest rate (19 percent per year), but starting from a lower base.
Location-Based Services (LBS) and Road dominate cumulative GNSS revenues, driven by booming sales of smartphones and in-vehicle devices, location-aware applications and data services.
With emerging economies catching up in terms of GNSS devices per capita, the Digital Divide will narrow, driven by the take-up of smartphones. The growing dominance of smartphones (3.08 billion in 2014) is foreseen as the most popular platform to access LBS.
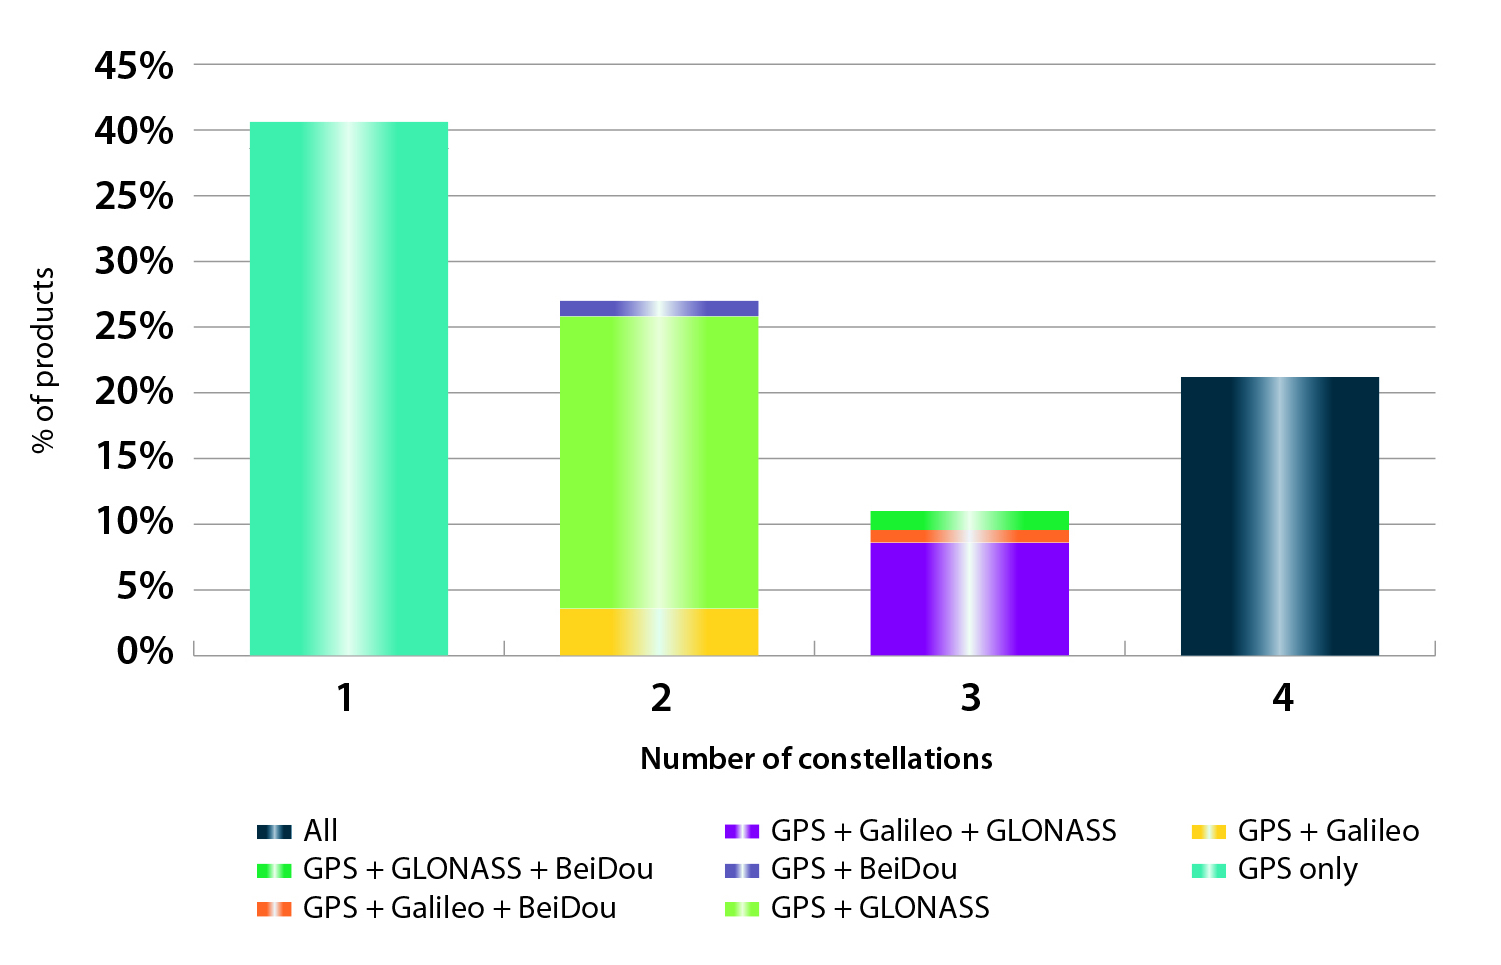
In the analysis of the capabilities of GNSS receivers and chipsets, it is reported that more than 60 percent of currently available receivers and chipsets support a minimum of two constellations with more than 20 percent supporting all four of them.
FIGURE 2. SUPPORTED CONSTELLATION BY RECEIVERS Chart shows the percentage of available receivers capable of tracking signals from one GNSS (such as GPS only), two GNSS (GPS + Galileo, GPS + GLONASS, GPS + BeiDou), three GNSS (GPS + Galileo + GLONASS, GPS + Galileo + BeiDou, GPS + GLONASS + BeiDou) or tracking signals from all constellations at the same time. The percentages add up to 100 percent. We can conclude that almost 60 percent of all available receivers, chipsets and modules are supporting a minimum of two constellations, showing that multi-constellation is becoming a standard feature across all market segments.
New Charts
The report includes new infographics presenting:
Global GNSS downstream market size, core and enabled (2013 to 2023)
GNSS industry share by region (2012)
The global shares of companies among components manufacturers, systems integrators and value-added service providers (2012)
Capability of GNSS receivers and chipsets, all segments (2015)
Supported constellation by receivers and chipsets , all segments (2015)
Detailed analysis of key GNSS segments: LBS, Road, Aviation, Rail, Maritime, Agriculture, Surveying, Timing and Synchronization, quantified in terms of:
Shipments of GNSS devices by application and region (2013 to 2023)
Installed base of GNSS devices by application and region (2013 to 2023)
Core revenues from GNSS device sales by application and region (2013 to 2023)
Capability of GNSS receivers and chipsets (2015)
Supported constellation by receivers and chipsets (2015).
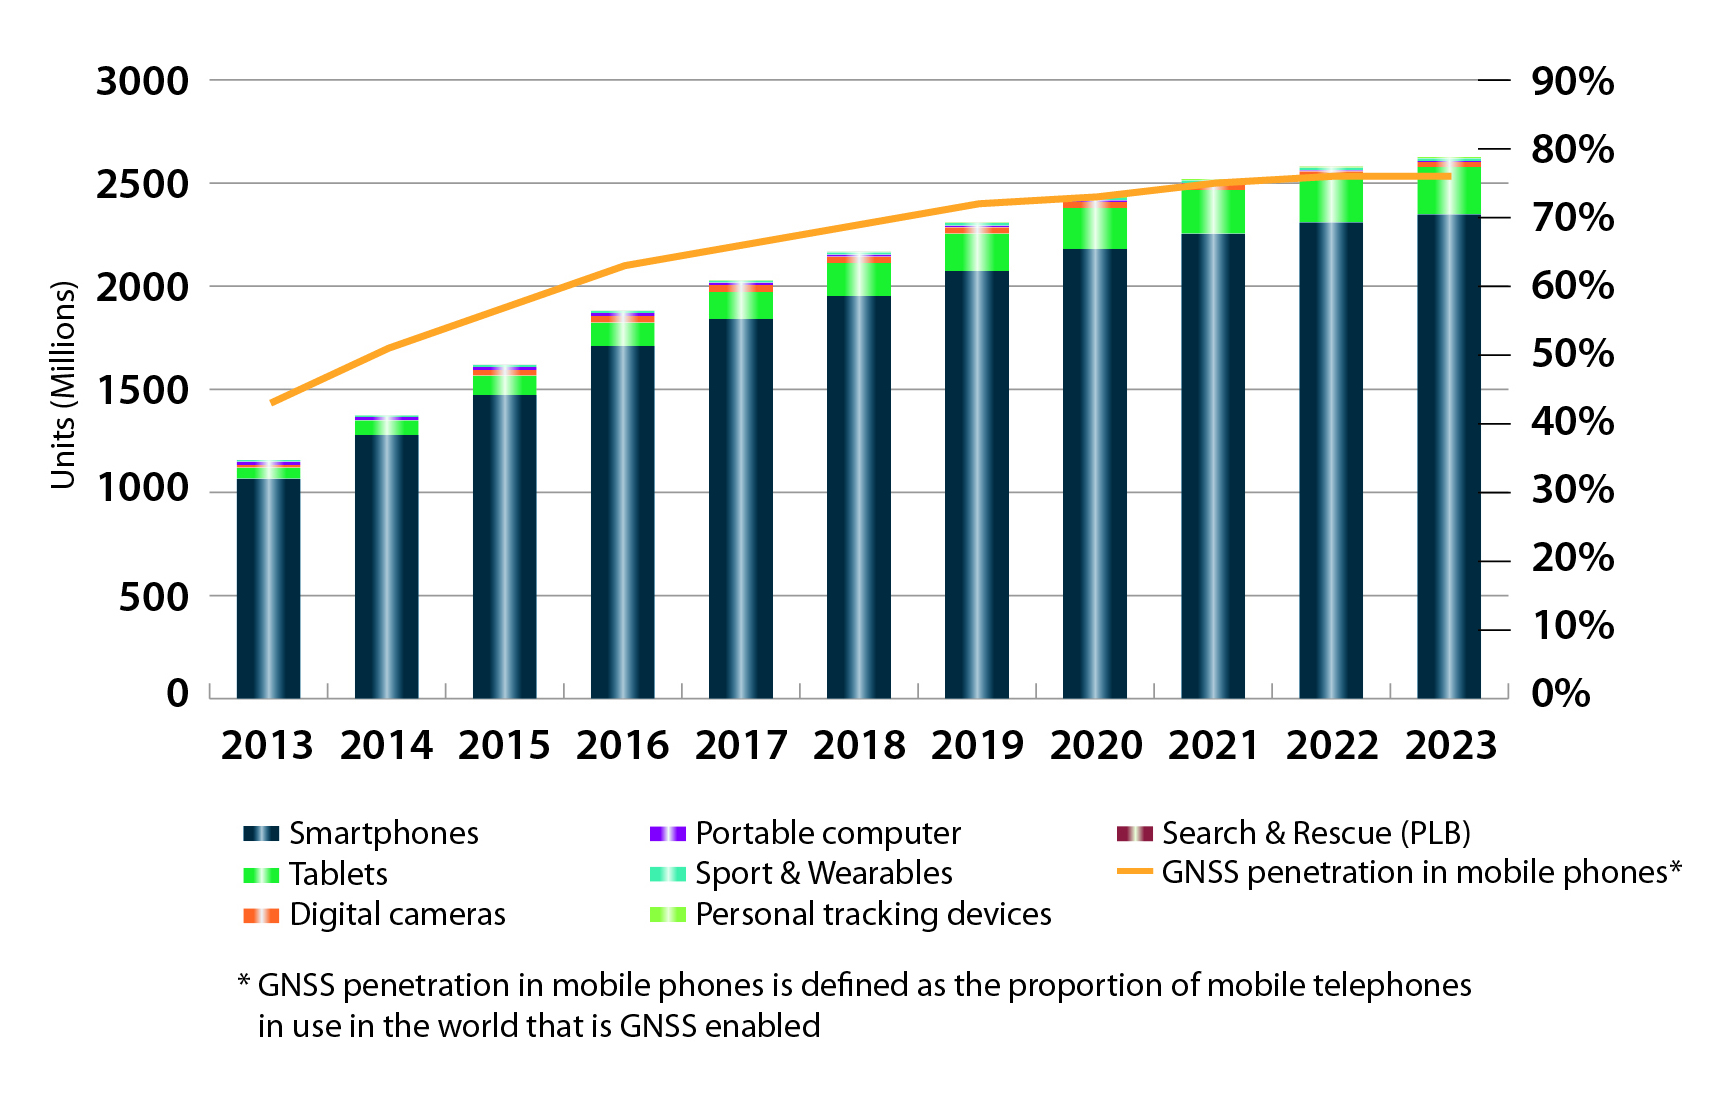
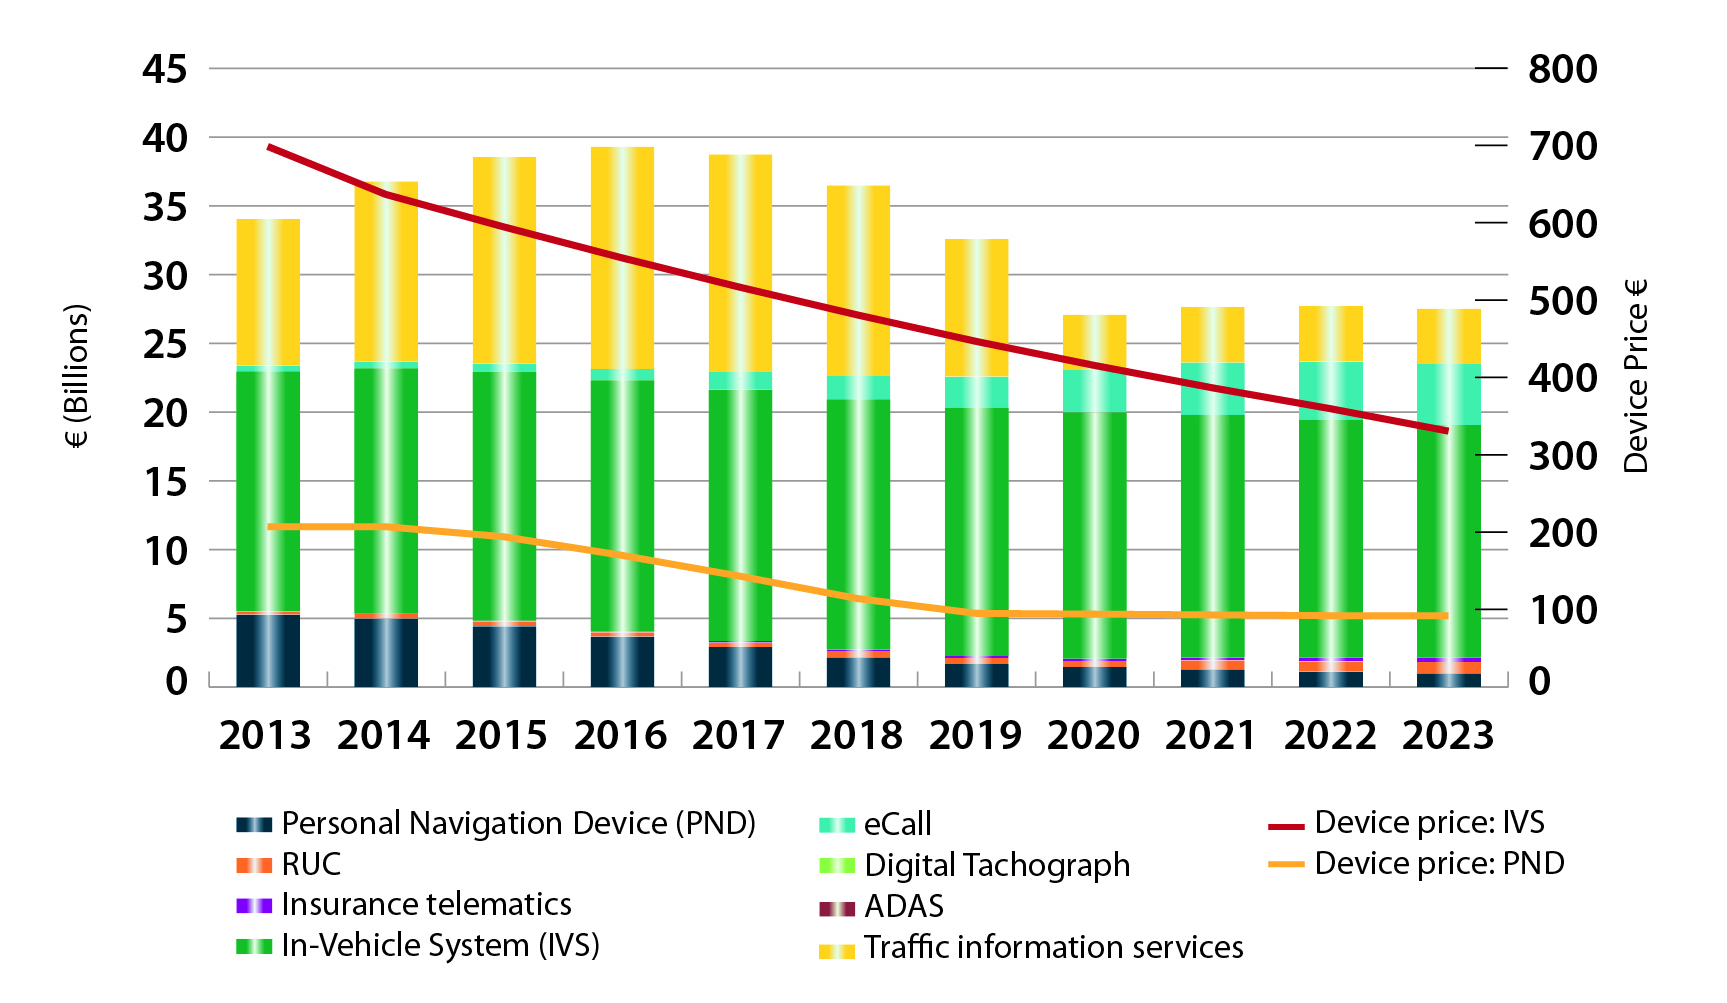
FIGURE 3. LOCATION-BASED SERVICES SECTOR GNSS shipments by type; GNSS penetration in mobile phones is defined as the proportion of mobile telephones in use in the world that is GNSS enabled.FIGURE 4. ROAD SECTOR Core revenue from GNSS device sales and services by application.
Methodology
The “GSA GNSS Market Report” is compiled by the GSA and the European Commission and was produced using the GSA’s systematic Marketing Monitoring and Forecasting Process.
The underlying market model uses advanced forecasting techniques applied to a wide range of input data, assumptions, and scenarios to forecast the size of the GNSS market in terms of shipments, revenue and installed base of receivers.
Historical values are anchored to actual data in order to ensure a high level of accuracy. Assumptions are provided by expert opinions and model results are cross-checked against the most recent market research reports from independent sources, before being validated through an iterative consultation process with sector experts and stakeholders.


 With the introduction of this mount, customers can now upgrade existing GPS L1-only antennas to dual (L1/L2) and triple (L1/L2/L5) band GNSS antennas.