The Trektor hybrid robot for agriculture, made by the French company SITIA, can work on a variety of crops by changing the width of its wheelbase and can perform many repetitive tasks, such as spraying and hoeing. (Image: SITIA)
Precision agriculture has been around for more than 30 years and now covers the majority of U.S. farmland. It refers to the ability of farmers to observe, measure and respond precisely to the variability of soil and crop characteristics within and between fields by using maps of these characteristics and GNSS navigation. It enables them to reduce inputs of seed, water, fertilizer, pesticides and fuel while increasing outputs. It also enables them to work at night and in the fog and automate many functions at large feed lots.
For precision agriculture, GNSS integrity can mean the difference between, say, a robot protecting a vineyard by weeding and spraying pesticides or damaging it by straying onto the vines.
Autonomous Tractors, Mowers, and Feed Monitors
SITIA, a French company, has developed an autonomous tractor that is used by, among others, an organic vineyard in France’s Loire valley to tirelessly weed the narrow rows between the grape vines — compensating for the movement of young workers to cities. Thanks to the high accuracy and integrity of the Septentrio GNSS heading receiver inside, the autonomous tractor has decreased the damage to the vineyards by more than an order of magnitude compared to the traditional work done by a farmer with a manual tractor.
Renu Robotics, based in San Antonio, Texas, makes a robot for vegetation management, called Renubot. It uses machine learning, a form of artificial intelligence, to plan its route, optimize its energy consumption, perform self-diagnostics, collect environmental data and assess the topography that it traverses.
Navigation is based on a stored map of paths, a Septentrio RTK GPS receiver and sensors to avoid obstacles. A radio link enables the Renubot to communicate with a control center, for reporting and updates. When the Renubot returns to its recharge pod, it charges its lithium battery and performs updates and downloads.
Manabotix Pty. Ltd., an Australian company, has developed an automated system to monitor cattle in large feedlots, using GNSS, lidar scanning and other vision or perception technologies and artificial intelligence. This has greatly improved the accuracy and consistency of feedlot volume estimates, which for the previous 150 years had been the responsibility of a select few employees, who would visually gauge the amount of feed in concrete troughs. This visual inspection by humans was inherently imprecise, subjective, and inconsistent, often causing animals to eat too much or too little one day and get off their optimal growth curve or even become ill. Manabotix’s solution consists of a Septentrio AsteRx-U GNSS receiver and antenna, a lidar scanner, and an onboard processing platform.
Statistical Analysis
Integrity is a key aspect of all these applications. A part of delivering integrity is a statistical analysis called receiver autonomous integrity monitoring (RAIM), which was developed for such safety-critical applications as aviation or marine navigation. A refinement of RAIM, called RAIM+, takes this analysis to the next level as part of a larger positioning protection package.
For autonomous operation, it can be particularly hazardous to be overly optimistic about GNSS accuracy. This parameter is reported in the form of positioning uncertainty, which is the maximum possible error on the calculated position. It is especially necessary in challenging GNSS environments, where the receiver has a direct line of sight to only a limited number of GNSS satellites or where GNSS signals are degraded. RAIM alerts users when their receiver’s uncertainty strays beyond the limits they have chosen for their application.
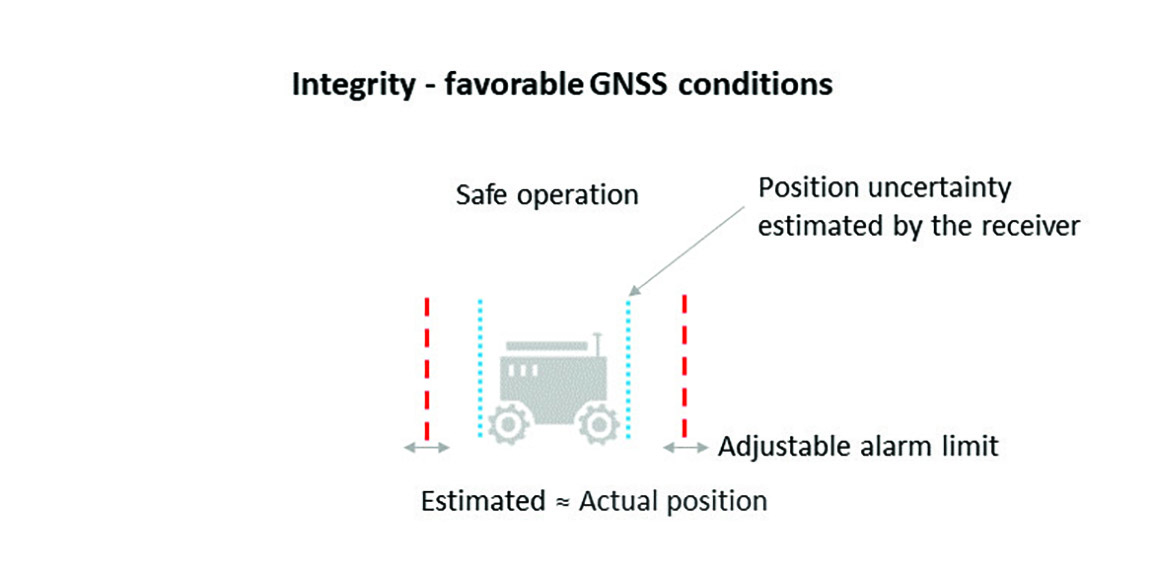
Users can be deceived by a consistent position or movement — which can be consistently inaccurate. The positioning uncertainty gives them an indication of the extent to which they can rely on their receiver’s positioning accuracy at any given moment. The receiver operator can set an alarm limit, so that the receiver can flag situations when positioning uncertainty becomes too large.
The blue line in Figure 1 shows position uncertainty estimated by a GNSS receiver under favorable conditions, when the view of the sky is unobstructed, and the receiver has a direct line-of-sight to many satellites.
Figure 1. Under good GNSS conditions, the position uncertainty shown by the blue lines is well within the alarm limits, indicating safe operation. The actual position of the receiver should always remain within the blue uncertainty boundaries. (Image: Septentrio)
During favorable conditions, the positioning uncertainty stays well below the alarm limit because the calculated position is almost the same as the robot’s actual position. However, in challenging environments, the truthfulness of positioning uncertainty becomes most critical (see Figure 2).
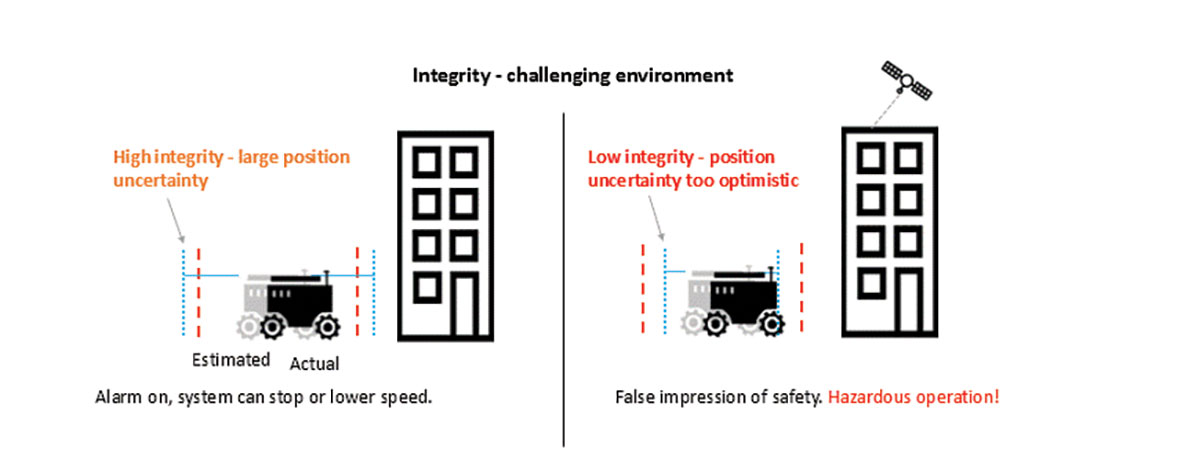
Figure 2. In challenging environments receivers with high integrity report large positioning uncertainty, flagging possible inaccuracies to the system. If the receiver is too optimistic about its accuracy, the operation becomes hazardous. (Image: Septentrio)
For instance, when the view of the sky is partially obstructed by buildings or foliage, the receiver has access to only a limited number of GNSS satellites, making it harder to calculate accurate position. In such cases the receiver must report a higher positioning uncertainty, so that the system can take adequate action such as switching to lower speeds, staying further away from predefined boundaries, or stopping.
A low integrity receiver may keep reporting an optimistic positioning uncertainty, that stays below the preset alarm limit even when the calculated position is way off from the actual position. The number may look fine, but effectively it becomes a “robot on the loose,” no longer on its planned path with a risk of damaging itself and its surroundings.
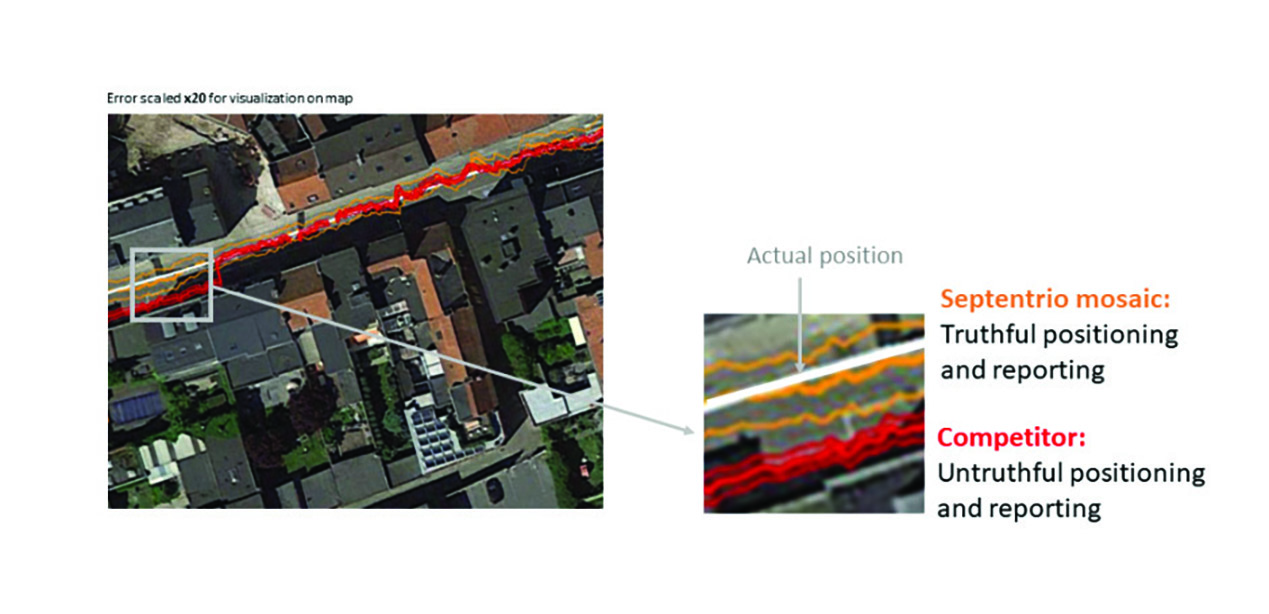
Let us look at uncertainty limits in action during a GNSS car test in an urban canyon, where the view of the sky is partially obstructed by houses (see Figure 3). The orange lines are the positioning and its uncertainty boundaries reported by a Septentrio mosaic GNSS module in the car, while the red lines are the positioning and its uncertainty boundaries reported by another popular GNSS receiver. The white line shows the actual position of the car as it drives along the road. The orange uncertainty boundaries of the mosaic receiver are truthful and somewhat wider in this challenging environment, and you can see that the actual position always remains within these boundaries. On the other hand, the red trajectory jumps off course in a certain challenging spot on the road, with the actual position no more within the uncertainty boundaries, which remain too optimistic. In this case the competitor’s receiver gives a false sense of security and the system is unaware of its hazardous operation.
Figure 3. In an urban canyon car test the Septentrio receiver reports truthful position uncertainty. A competitor receiver seems to be more accurate, while the actual position is not even within its reported uncertainty boundaries. (Image: Septentrio)
If the receiver depicted by the red line provided navigational information for an ADAS automotive system, for example, this could mislead the system into thinking that the car switched lanes. If the system then attempted to correct the trajectory by switching back to the “correct lane” this would result in taking the car off course and potentially hitting the sidewalk or even another car.
RAIM vs RAIM+
The underlying mechanism behind truthful positioning uncertainty reporting is RAIM, which ensures a truthful positioning calculation based on statistical analysis and exclusion of any outlier satellites or signals. Septentrio receivers are designed for high integrity and take RAIM to the next level with RAIM+, guaranteeing truthfulness of positioning with a high degree of confidence.
In Septentrio receivers RAIM+ is a component of a larger receiver protection suite called GNSS+ comprising positioning protection on various levels including AIM+ anti-jamming and anti-spoofing, IONO+ resilience to ionospheric scintillations, and APME+ multipath mitigation.
Septentrio has fine-tuned its RAIM+ statistical model with more than 50 terabytes of field data collected over 20 years. It removes satellites and signals which may give errors due to multipath reflection, solar ionospheric activity, jamming and spoofing, while working together with the GNSS+ components mentioned above. Because of this multi-component protection architecture, it achieves a very high level of positioning accuracy and reliability which goes well beyond the standard RAIM. The RAIM+ statistical model is adaptive, highly detailed, and complete, taking advantage of all available GNSS constellations and signals. The full RAIM+ functionality is also available in Septentrio’s GNSS/INS receiver line. User controlled parameters allow it to be tuned to specific requirements.
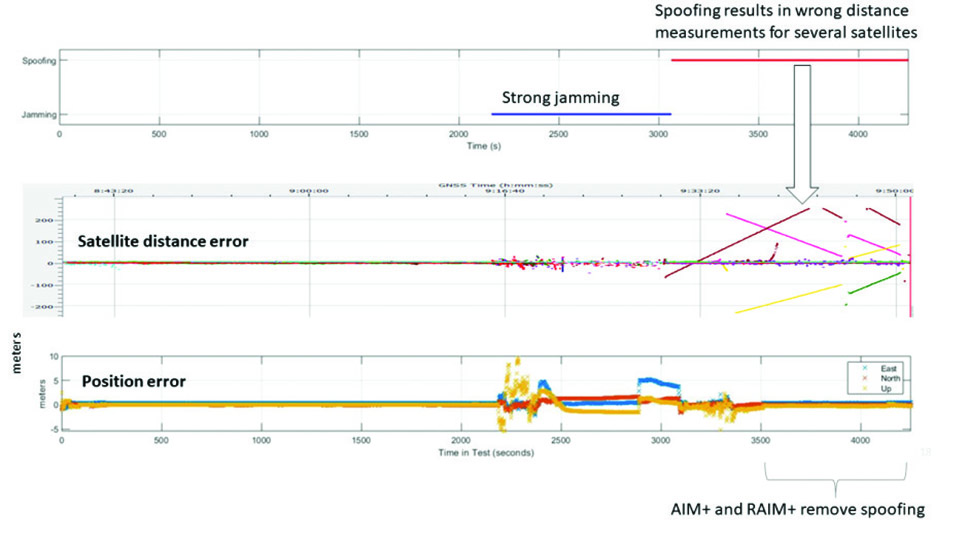
The diagram in Figure 4 shows RAIM+ in action during a jamming and spoofing attack on a Septentrio GNSS receiver. While AIM+ removes the effects of GNSS jamming, both AIM+ and RAIM+ work together to block the spoofing attack. Satellites with high distance errors, shown on the middle graph, are removed by RAIM+ since they do not conform to the expected satellite distance.
Figure 4. In this scenario jamming gives satellite distance errors but is countered by AIM+ technology. During spoofing AIM+ eliminates some of the spoofed satellites, while other satellites that have wrong distances are dismissed by RAIM+ algorithms. (Image: Septentrio)
This example shows that even in the case of jamming and spoofing, Septentrio’s high integrity receiver technology delivers truthful and reliable positioning on which any autonomous system can count.
GNSS Design Around Reliability
GNSS receivers designed to be reliable strive for high integrity in both reporting of the positioning uncertainty as well as in RAIM+ advanced statistical modelling. This ensures that these receivers provide truthful and timely warning messages and are resilient in various challenging environments. Other technologies such as inertial navigation system (INS) can also be coupled to the GNSS receiver to extend positioning availability even during short GNSS outages. Quality indicators for satellite signals, CPU status, base-station quality and overall quality allow monitoring of positioning reliability at any given time. High-integrity GNSS receivers provide truthful positioning in autonomous machines such as the SITIA weeding tractor. They are also crucial components in safety-critical applications, assured PNT and any other application where accuracy and reliability matters.
By R. Eric Phelts, Kazuma Gunning, Juan Blanch and Todd Walter
Innovation Insights with Richard Langley
AS WE NOTED IN THE LAST INNOVATION COLUMN, integrity — at least from a safety viewpoint — is the most important characteristic of a navigation system. Yes, accuracy, availability and continuity are also required but, without integrity, the advertised accuracy of a system might become meaningless and perhaps misleading. While GPS and user receivers are highly reliable, we cannot presume that there will never be an erroneous signal transmitted by a GPS satellite that would result in a receiver outputting a hazardously misleading position solution. While “supervisory” systems such as satellite-based augmentation systems monitor GPS signals and can alert users about defective satellites within a very short period of time, it is advantageous for a user receiver to autonomously detect problematic satellites and quarantine them so that they do not perturb the position solution.
It is for this reason that receiver autonomous integrity monitoring (RAIM) techniques were developed. As we know, a receiver needs signals from a minimum of four satellites simultaneously to determine its 3D position and its clock offset. However, typically there are more than four satellites in view, and so multiple solutions using subsets of four satellites are possible. If five satellites are visible, then it is possible to determine that one of them is faulty, but not which one (geometry plays a role here). This is called fault detection (FD). And if six satellites are visible, the faulty satellite can be determined and then excluded from the position solution (fault detection and exclusion, or FDE). This is the basic principle of RAIM.
Advanced RAIM (ARAIM) extends RAIM to other constellations beyond GPS. ARAIM enables the use of the newer GNSS constellations to provide better levels of performance than RAIM with GPS alone. It also uses dual-frequency measurements for enhanced vertical positioning reliability.
Central to positioning techniques providing a safety-of-life service is the notion that the uncertainty of a provided position must be conservatively estimated and provide for both nominal uncertainty and the uncertainty of a faulted solution such as that detected using RAIM. These conservative estimates are known as the horizontal and vertical protection levels. The horizontal protection level (HPL) is the radius of a circle in the horizontal plane with its center at the true position, which describes the region that is assured to contain or bound the provided horizontal position to a very high probability. The vertical protection level is half the length of a segment in the vertical direction with its center at the true position, which describes the region that is assured to contain or bound the provided vertical position to a very high probability. The probability levels are typically taken to be 99.9999998 and 99.99999% for HPL and VPL, respectively.
The usual approach for RAIM and ARAIM is to use the so-called “snapshot” approach, where measurements are assumed to be uncorrelated epoch to epoch. In this month’s column, a team of authors from Stanford University discusses a superior approach for ARAIM using the technique of precise point positioning.
Advanced Receiver Autonomous Integrity Monitoring (ARAIM) is implemented using solution separation in positioning and navigation software. Solution separation computations presume one or more GNSS satellites may be faulty, and they iteratively compute multiple position solutions comprised of subsets of the n satellites in view (n, n-1, n-2, and so on) to ensure that at least one of the solutions is fault-free. Using assumptions on the nominal and faulted uncertainty of the solutions, the software can compute conservative horizontal and vertical protection levels (PLs) by bounding the uncertainty from all the solutions. This assures (to a targeted level of probability) that the user position is contained within these limits.
Traditional solution separation techniques generally operate as a “snapshot.” The basic measurements are dual-frequency, carrier-smoothed pseudorange (code), and errors are generally assumed to be uncorrelated from epoch to epoch. This procedure requires that errors at each time step are conservatively bounded with large uncertainties (sigmas) designed to protect the user against the worst-case error. These assumptions minimize the complexity and computational cost of the solution by providing a robust, provably safe bound. However, the PLs computed are relatively large. In addition, they can change suddenly from one epoch to the next due to changes in available satellites or platform dynamics. This can make meeting performance goals (such as continuity) for aircraft approaches more challenging.
Solution separation procedures using techniques based on precise point positioning (PPP) implement an extended Kalman filter (EKF) to filter measurements over time. In this case, the basic measurements are dual-frequency code and carrier phase, and errors are assumed to have some correlation between each time step to the next. Accordingly, these techniques leverage higher quality measurements (that is, carrier-phase-based as opposed to code-based) to smooth and reduce large sigmas and to estimate (and calibrate) errors over time. The complexity associated with defining and characterizing the decorrelation models for the errors, so that the nominal covariance produced by the EKF conservatively describes the actual error, is significant. Also, the computational cost of estimating the error states may be substantially higher than with the traditional snapshot approach. However, the computed protection levels provide integrity and are often significantly smaller. In addition, the filtering makes them more robust to platform dynamics, which makes them well-suited for aircraft in flight.
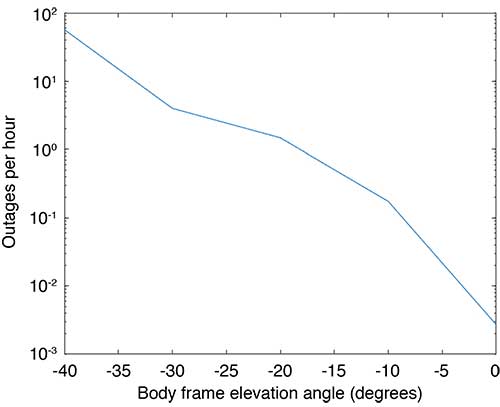
Flight Data: Outages and Cycle Slips. ARAIM performance may be significantly affected by aircraft dynamics. Specifically, banking can induce satellite outages and cycle slips. Outages weaken the constellation geometry and can cause sudden changes in the protection level. Frequent cycle slips prevent code measurements from being smoothed, potentially inflating protection levels of carrier-phase-smoothed code measurements for extended periods of time.
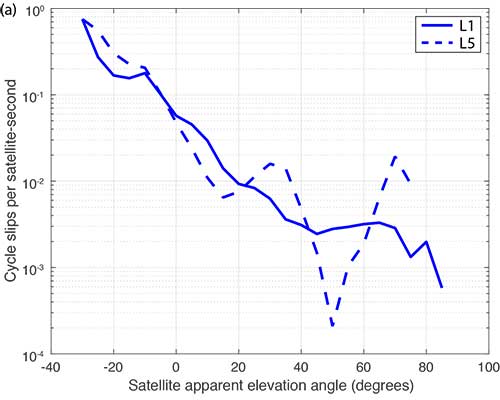
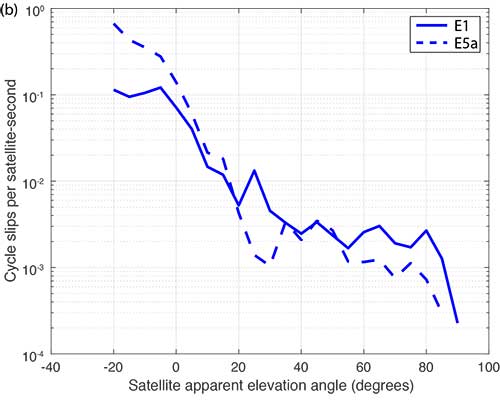
When the outages and cycle slips are computed as a rate, a trend can be seen. Both increase notably as the relative elevation angle to the satellites decrease. FIGURE 1 shows an example of outages as a function of the apparent elevation angle of the satellites (relative to the aircraft). Cycle slips on GPS L1-L5 and Galileo El-E5a are plotted in FIGURES 2 (a) and (b), respectively.
FIGURE 1. Outages as a function of body frame or apparent elevation angle during aircraft banking. (Image: Authors)FIGURE 2a. Cycle-slip rate (per satellite-second) for GPS L1-L5. (Image: Authors)FIGURE 2b. Cycle-slip rate (per satellite-second) for E1-E5a. (Image: Authors)
For this article, we have used the flight data from one of our earlier papers on the effect of aircraft banking on ARAIM performance (see Further Reading). With this data, we show that significant advantages of PPP can be retained even during aircraft maneuvers when outages and cycle slips threaten ARAIM continuity and availability the most.
MODEL ASSUMPTIONS
The traditional snapshot solution separation approach is well-established and was implemented according to the standards established by a working group operating under the U.S.-European Union Agreement on GPS-Galileo Cooperation, which has been extended to all constellations (see Further Reading). For this article, we limited the constellations to GPS and Galileo, and the prior probabilities assumed for satellite and constellation faults were as follows:
Psat = 10-5, Pconst,GPS = 10-8 and Pconst,GAL = 10-4
We implemented the PPP algorithm with solution separation using an EKF using dual-frequency code and carrier-phase measurements (from GPS and Galileo) with estimated parameters comprising the receiver position and velocity, clock biases for each constellation in use, a residual tropospheric delay, carrier-phase float ambiguities for each tracked carrier, multipath error, receiver differential code bias, and broadcast orbit and clock error. Modeled (not estimated) effects include solid Earth tide modeling, ocean loading, an initial tropospheric delay and relativistic effects. Many of the details of the implementation can be found in our paper “Design and Evaluation of Integrity Algorithms for PPP in Kinematic Applications” (see Further Reading).
PPP techniques typically utilize precise ephemeris information obtained from a global network of ground reference stations such as those operating in the network coordinated by the International GNSS Service. Snapshot solution separation techniques, however, use only ephemeris information broadcast from the satellites themselves. For a proper comparison of the protection levels computed by each technique, the PPP filter was constrained to use this broadcast information.
The model we have applied is mostly typical of a traditional PPP implementation with one significant exception — the state tracking the error contribution of the broadcast orbit and clock on each line-of-sight signal. The error contributed by the broadcast orbit and clock is handled by the filter leveraging a characterization of the rate of change of the error, then including it as an estimation state for each line of sight and only adding enough process noise to capture the slowly changing error. We have previously characterized the rate of change of the error in the broadcast orbit and clock and process noise (for GPS). Complete tables of initial state uncertainties and additional settings for process and measurement noise were provided in our earlier work (see Further Reading).
RESULTS
Flight data collected over a period of approximately one year was used to evaluate ARAIM performance through momentary outages and cycle slips due to aircraft dynamics. A multi-constellation, multi-frequency receiver tracked GPS (L1 C/A and L5) and Galileo (E1 and E5a) satellites. This receiver is installed in a Global 5000 jet owned and operated by the FAA William J. Hughes Technical Center. It records and stores GNSS measurements whenever flights are taken. The data we used for this article included data recorded over approximately 35 flights from September 2017 to April 2018.
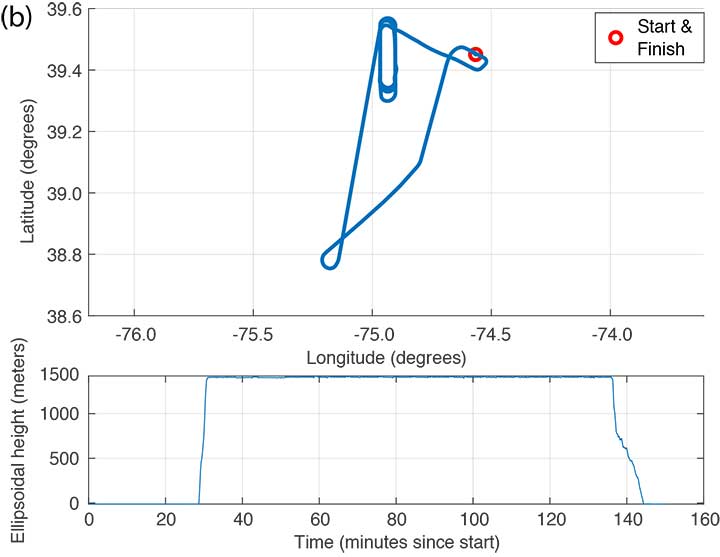
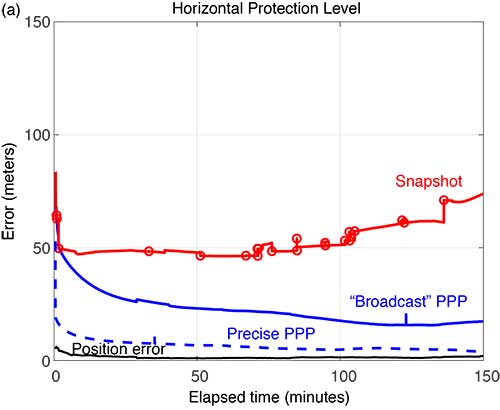
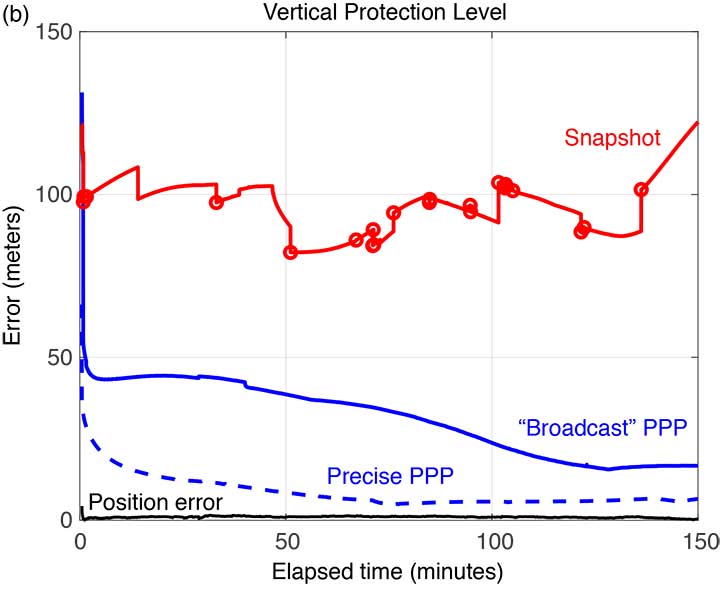
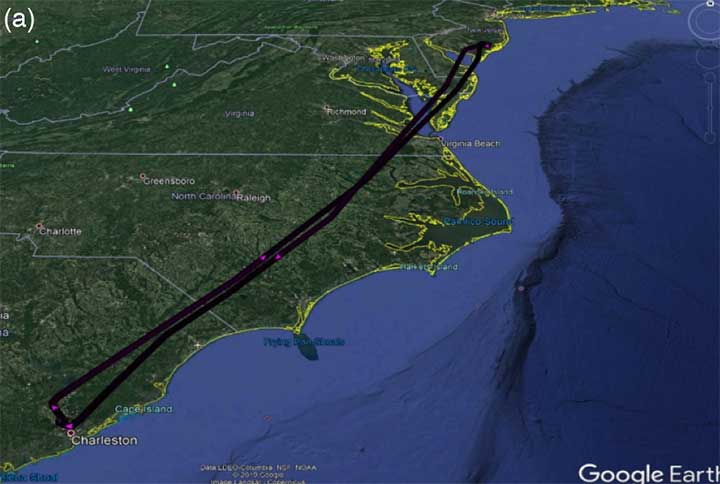
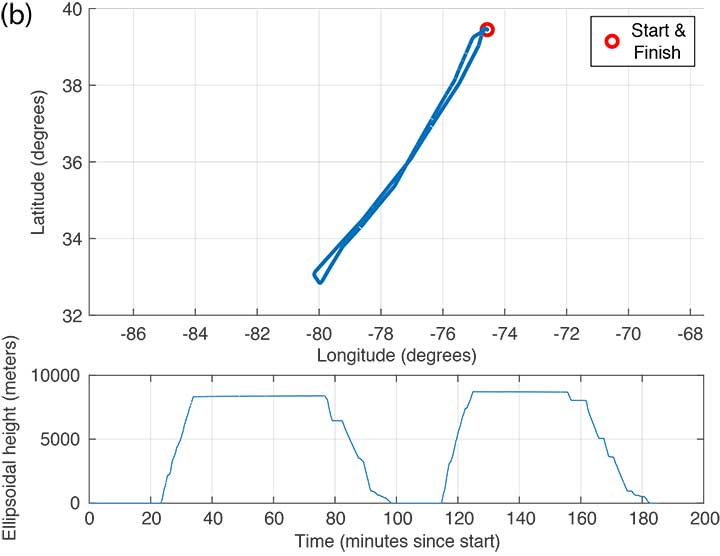
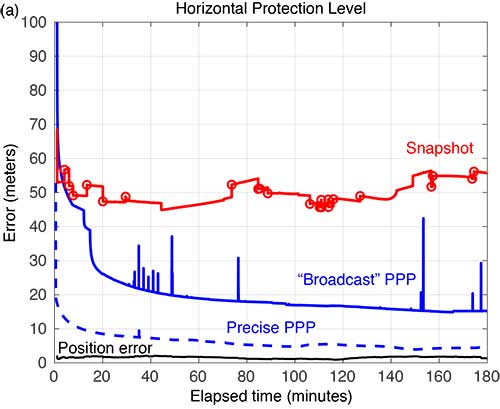
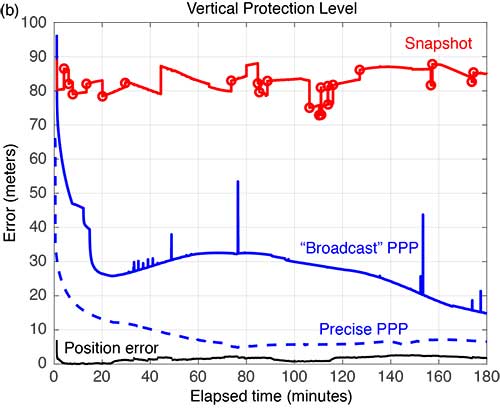
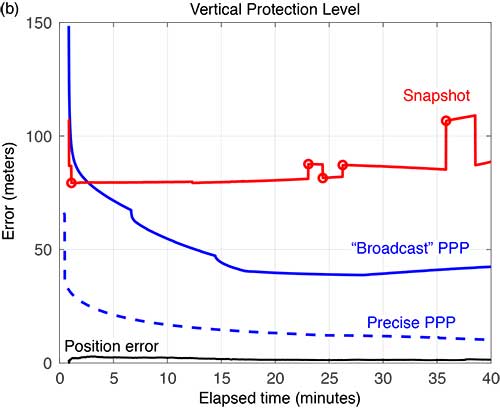
FIGURE 3 shows the trajectory and altitude information corresponding to a single flight (Flight #6) taken on Sept. 20, 2017, and FIGURE 4 compares the corresponding horizontal and vertical protection levels computed using snapshot and “broadcast” PPP techniques. For an additional reference, we also computed protection levels using PPP with precise orbits and clocks (we call this precise PPP despite the terminology redundancy) and plotted these in Figure 4, too.
FIGURE 3b. Altitude information for Flight #6 (Sept. 20, 2017). (Image: Authors)FIGURE 4a. Horizontal protection levels for Flight #6 (Sept. 20, 2017); red circles indicate a satellite being dropped or reentering the solution. (Image: Authors)FIGURE 4b. Vertical protection levels for Flight #6 (Sept. 20, 2017); red circles indicate a satellite being dropped or reentering the solution. (Image: Authors)
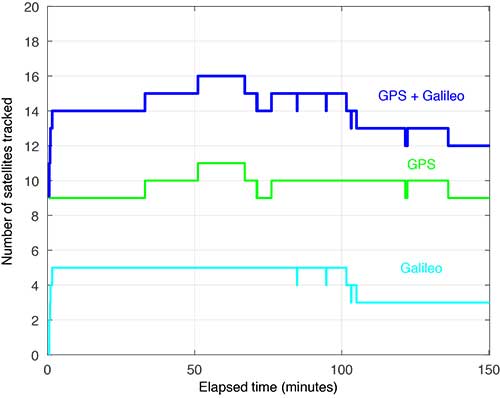
Several things are readily apparent from these comparisons. First, after the initial time required for convergence, there is a substantial reduction in the PLs using the broadcast-PPP-based approach. The precise PPP PLs, as expected, produce the largest reduction, but use additional information not available to the snapshot method. In addition, the snapshot solution separation PLs vary significantly due to cycle slips and momentary satellite outages. FIGURE 5 shows the number of satellites tracked by the receiver during this flight; red circles plotted on the snapshot protection-level line indicate when satellites are coming into and out of view. Despite numerous abrupt changes in number of measurements and measurement quality, the EKF of the PPP techniques produces PLs that are relatively smooth and continuous.
FIGURE 5. Number of satellites tracked for Flight #6 (Sept. 20, 2017). (Image: Authors)
FIGURE 6 shows the trajectory and altitude information corresponding to Flight #4 taken on Sept. 15, 2017.
FIGURE 6a. Flight path for Flight #4 (Sept. 20, 2017). (Image: Authors)FIGURE 6b. Altitude information for Flight #4 (Sept. 20, 2017). (Image: Authors)
FIGURE 7 compares the horizontal and vertical PLs for snapshot solution separation and the PPP-based techniques.
FIGURE 7. Horizontal protection levels for Flight #4 (Sept. 15, 2017); red circles indicate a satellite being dropped or reentering the solution. (Image: Authors)FIGURE 7b. Vertical protection levels for Flight #4 (Sept. 15, 2017); red circles indicate a satellite being dropped or reentering the solution.
As in the case shown in Figure 4, the PLs in Figure 7 reveal a substantial reduction in the mean PLs computed using the PPP-based approach. And the snapshot solution separation approach displays even more variations due to momentary satellite outages. Some of the cycle slips affected enough satellites to introduce brief spikes in the PPP solution as well. These reconverge quickly, but they suggest that some tuning of the EKF can still be done to mitigate these interruptions. Still, the filtered approach produces PLs that are more robust to the outages and are substantially smaller than with the snapshot method.
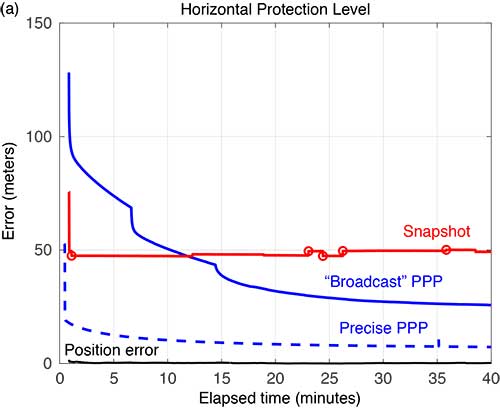
FIGURE 8 compares the horizontal and vertical PLs computed using snapshot solution separation and PPP techniques for Flight #20 — where the airplane remained stationary on the runway. In the absence of flight dynamics, the levels for all the approaches were relatively smooth. However, a few discontinuities can still be observed for the snapshot case. Also note, in the case of the broadcast PPP, the convergence time is noticeably longer. This is likely because the integer ambiguity resolution in the solution took longer to converge without platform motion.
FIGURE 8a. Horizonta protection levels for a stationary aircraft (Flight #20, Dec. 4, 2017); red circles indicate a satellite being dropped or reentering the solution. (Image: Authors)FIGURE 8b. Vertical protection levels for a stationary aircraft (Flight #20, Dec. 4, 2017); red circles indicate a satellite being dropped or reentering the solution. (Image: Authors)
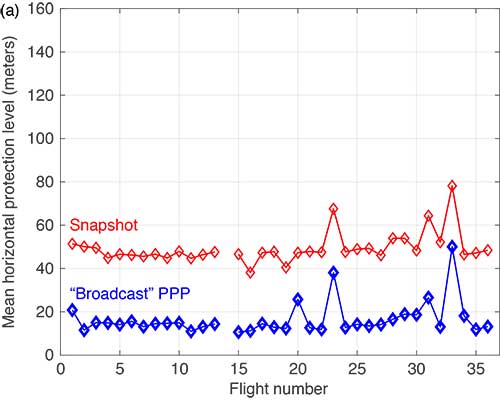
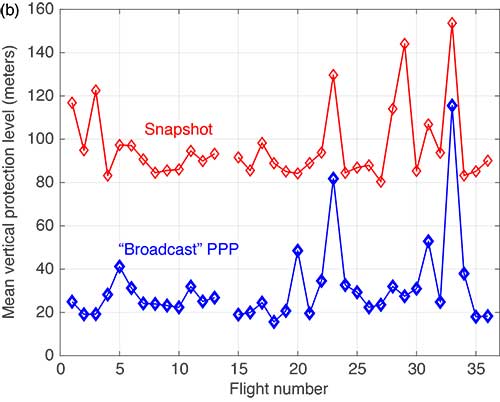
The mean horizontal and vertical PLs for both techniques are summarized in FIGURE 9. (There were issues with the data from Flight #14 and it was not processed.) The PPP approach consistently produces protection levels anywhere from 30 to 75% smaller than those computed using the snapshot approach. The mean PLs for the PPP techniques were always below those computed with the snapshot method.
FIGURE 9a. Comparison of mean horizontal PLs for “snapshot” vs. a PPP-based technique. (Image: Authors)FIGURE 9b. Comparison of mean vertical PLs for “snapshot” vs. a PPP-based technique. (Image: Authors)
CONCLUSIONS
Data from 35 flights was used to compare ARAIM protection levels computed by the traditional “snapshot” solution separation versus a PPP-based approach during both in-flight and several static scenarios. We observed that the filtering of PPP methods yields mean PLs approximately 30 to 75% of those computed using traditional methods in all cases. This improvement can be attributed to exploiting — through filtering and estimation — carrier-phase-based measurements and a time-correlation of the errors. In addition, the EKF employed by the PPP approach demonstrated improved robustness to outages and cycle slips induced by aircraft dynamics. Despite the increased complexity and computational cost, we believe that PPP approaches hold promise for significantly improving ARAIM performance.
ACKNOWLEDGMENT
This article is based on the paper “Evaluating the Application of PPP Techniques to ARAIM Using Flight Data” presented at ION ITM 2020, the 2020 International Technical Meeting of The Institute of Navigation, San Diego, California, Jan. 21–25, 2020.
MANUFACTURER
The flight data was recorded using a Trimble BX935-INS receiver fed by an Antcom Avionic II GNSS antenna.
R. ERIC PHELTS is a research associate in the Department of Aeronautics and Astronautics at Stanford University, California. He received a Ph.D. in mechanical engineering from Stanford University in 2001. His research involves signal deformation monitoring for SBAS and flight-data analyses for ARAIM.
KAZUMA (KAZ) GUNNING is a Ph.D. candidate in the GPS Laboratory at Stanford University working under the guidance of Todd Walter. He is also the navigation algorithms and architecture lead at Xona Space Systems in San Mateo, California. His research interests are in precise point positioning and integrity.
JUAN BLANCH is a senior research engineer at Stanford University, where he works on integrity monitoring algorithms for radionavigation. He received a Ph.D. in aeronautics and astronautics from Stanford University in 2003. He has received The Institute of Navigation (ION) Parkinson and Early Achievement awards.
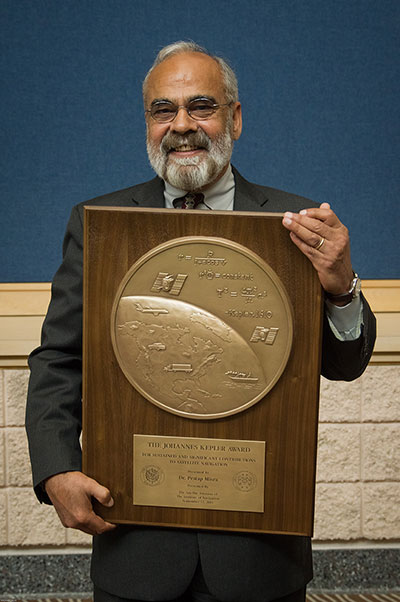
TODD WALTER is a research professor in the Department of Aeronautics and Astronautics at Stanford University. He received his Ph.D. in applied physics from Stanford University in 1993. His research focuses on implementing high-integrity air navigation systems. He has received the ION Thurlow and Johannes Kepler awards. Walter is also a Fellow of the ION and has served as its president.
“A Baseline RAIM Scheme and a Note on the Equivalence of Three RAIM Methods” by R.G. Brown in Navigation, Vol. 39, No. 3, Fall 1992, pp. 301–316.
Advanced Receiver Autonomous Integrity Monitoring
“SBAS Corrections for PPP Integrity with Solution Separation” by K. Gunning, J. Blanch and T. in Proceedings of ITM 2019, the 2019 International Technical Meeting of The Institute of Navigation, Reston, Virginia, Jan. 28–31, 2019, pp. 707–719.
“Design and Evaluation of Integrity Algorithms for PPP in Kinematic Applications” by K. Gunning, J. Blanch, T. Walter, L. de Groot and L. Norman in Proceedings of ION GNSS+ 2018, the 31st International Technical Meeting of the Satellite Division of The Institute of Navigation, Miami, Florida, Sept. 24–28, 2018, pp. 1910–1939.
“Effect of Aircraft Banking on ARAIM Performance” by R.E. Phelts, J. Blanch, K. Gunning, T. Walter and P. Enge in Proceedings of ION GNSS+ 2018, the 31st International Technical Meeting of the Satellite Division of The Institute of Navigation, Miami, Florida, Sept. 24–28, 2018, pp. 2632–2641.
“Precise Point Positioning” by J. Kouba, F. Lahaye and P. Tétreault, Chapter 25 in Springer Handbook of Global Navigation Satellite Systems, edited by P.J.G. Teunissen and O. Montenbruck, published by Springer International Publishing AG, Cham, Switzerland, 2017.
By Javier Benedicto
Head, Galileo Programme department,
European Space Agency
Javier Benedicto, left, accept the 2018 GPS World Satellites Leadership Award on behalf of Giuliano Gatti of the European Space Agency, from Phil Froom of Rockwell Collins. (Photo: Melanie Beus)
Since the Galileo initial services declaration in December 2016, the Galileo Program has been providing global PNT and search-and-rescue services for users worldwide. The European GNSS Agency (GSA) just issued its GNSS 2019 Market Report in October, providing a complete overview of the current status and trends of the GNSS worldwide market with focus on European GNSS (Galileo and EGNOS) applications and services.
In parallel with service provision, the Galileo Program is undertaking extensive infrastructure development and deployment activities to reach Full Operational Capability (FOC), incorporating new service capabilities, but above all aiming at increasing the robustness and resilience of the system infrastructure, operations and service provision.
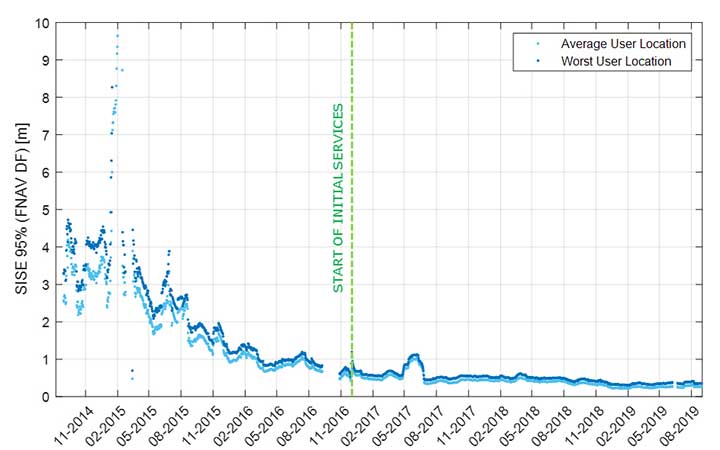
Galileo’s signal-in-space quality has steadily improved over the past few years, reaching in 2019 a best signal-in-space error (SISE) of about 0.25 meters (95%, global average; Figure 1). This has been achieved through a combination of several factors, including the increased number of operational satellites, enhanced versions of the Ground Mission Segment, and higher uplink rate of the navigation message (lower age of data). This performance is well within Galileo’s initial service accuracy commitments, as defined in the public Open Service – Service Definition Document (OS SDD).
Figure 1. Long-term historical SISE plot over a 30-day sliding window, constellation averaged. (Image: ESA)
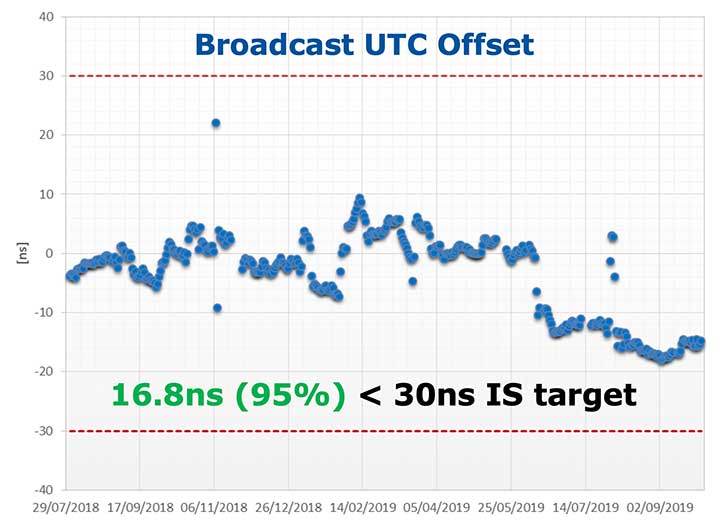
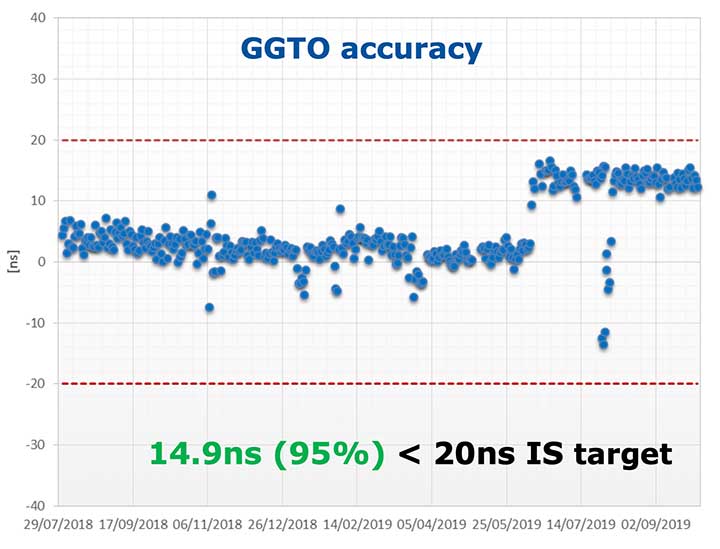
Figures 2 and 3 (see page 40) show Galileo’s timing performance as broadcast UTC offset and GGTO accuracy. The evaluation was performed with calibrated GPS/Galileo timing receivers operated in UTC(k) laboratory (PTB, INRIM). Again, the initial timing service commitments have been fully met.
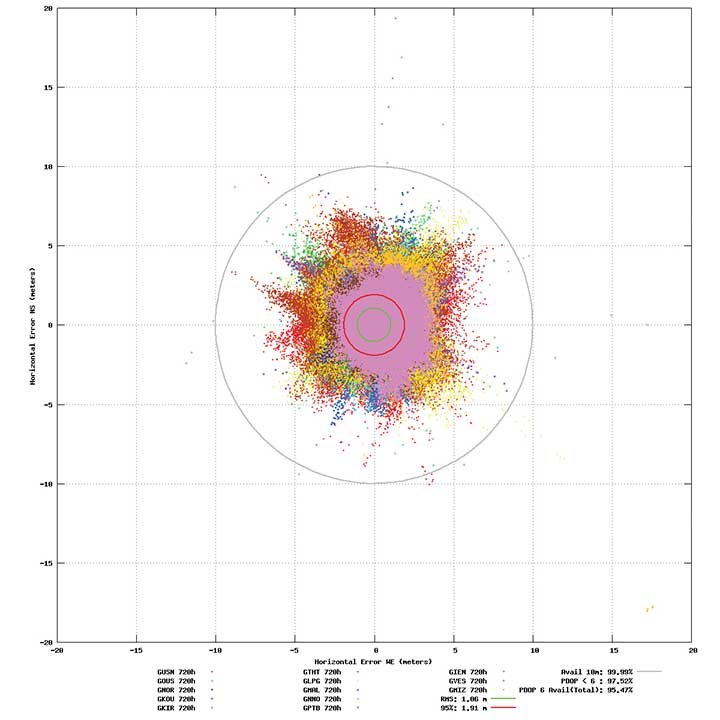
Probably the most significant discriminator of Galileo compared to other GNSS is its capability to broadcast multi-frequency (E1, E6, E5) signal components on all operational satellites. The position performance of a dual-frequency user receiver on-ground is shown in Figure 4. This measurement from June 2019 demonstrates a Galileo position accuracy well below 2 m (95%).
Figure 4. Galileo position accuracy performance, dual-frequency, June 2019. (Image: ESA)
With the aim of further improving the Open Service (OS) performance, three newly introduced I/NAV message improvements on Galileo E1-B are under implementation, namely FEC2 Reed-Solomon Clock and Ephemeris (CED), Reduced CED, and Secondary Synchronization Pattern (SSP). Galileo Open Service (OS) users will benefit from improved robustness in terms of navigation data retrieval in challenging environments, in addition to facilitating a reduced time to first fix. Those I/NAV improvements on Galileo E1-B are backwards compatible with previously released OS SIS ICDs.
In addition, Galileo infrastructure is currently being upgraded to provide means for OS authentication. The protocol proposed uses the E1B External Data Broadcast Service (EDBS) to provide authentication data to the user. The OS Navigation Message Authentication (NMA) is based on an adaptation of the Timed Efficient Stream Loss-tolerant Authentication (TESLA) protocol.
Beyond the OS, the Galileo system has been designed to allow for the dissemination of value-added data, such as high accuracy and authentication, in the E6B signal component. The component has been designed to broadcast the Galileo High Accuracy Service based on the provision of accurate satellite data (clocks, orbits and biases) and atmospheric data (mainly ionospheric corrections) to enable multi-frequency multi-constellation PPP with correction data transmitted through an open format in the Galileo E6B signal.
The introduction in early 2020 of the automatic acknowledgment of the SAR/Galileo Return Link Message (RLM) as part of the Cospas-Sarsat system will enable space assets to be used for search and rescue — persons in distress will get swift acknowledgement that their alert has been detected and located. The Return Link is the means to interact with a SAR beacon, improving the effectiveness of SAR operations. Extensive testing has demonstrated that the median latency for the reception of a return link message on the ground is 14.2 seconds, while 99% of messages are received within 57 seconds, after the request for the RLM transmission is delivered to Galileo (from Cospas-Sarsat to the RLSP). At the same time, the measured rate of reception was 100%, considering line-of-sight availability, thanks to the very robust Galileo navigation data link. This performance has been demonstrated to be uniform across the globe, as shown in Figure 5.
Figure 5. Beacon activation map and RLM delivery latency through the Galileo system. (Image: ESA)
Following the re-profiling of the Galileo Safety-of-Life (SoL) service, Galileo is meant to be exploited through dual-frequency multi-constellation (DFMC) SBAS and will support the provision of integrity through the concept of Horizontal Advanced Receiver Autonomous Integrity Monitoring (H-ARAIM). To allow the exploitation of Galileo for these SoL applications, a thorough analysis of the actual signal-in-space (SiS) performance and of potential feared events critical for SoL users is key. In this context, the Galileo Integrity Failure Mode and Effect Analysis (IFMEA) process is implemented through measurements and review of the system design, including feared-events characterization.
Ground Segment Brings Robustness
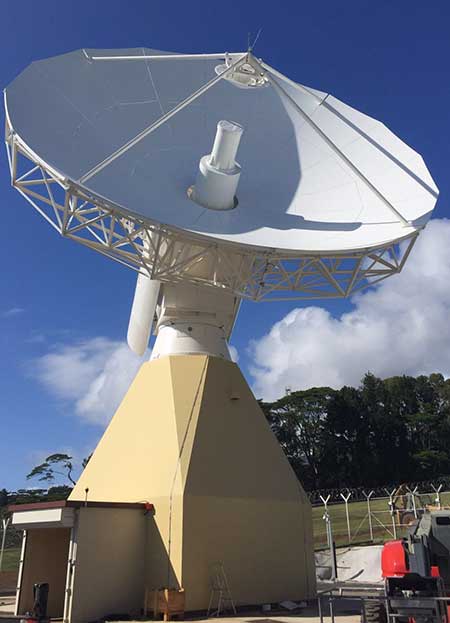
Galileo telemetry and telecommand ground station. (Photo: ESA)
Galileo’s Ground Segment is being upgraded to fully redundant control centers. These include processing and storage, monitoring and control facilities, and security monitoring centers. A worldwide network of Galileo Sensor Stations (GSS) allows monitoring and measuring of satellite signals; uplink stations allow dissemination of the navigation message to users through Galileo satellites; and telemetry, tracking and control (TTC) stations allow monitoring and control of the satellites.
Ground segment upgrades under production by Thales Alenia Space France (in charge of the ground mission segment and security monitoring) and GMV Spain (in charge of the ground control segment) are addressing increased service robustness, through the introduction of a more flexible infrastructure with a significant technology refresh, improved security, service continuity, enhanced service performances, and enhanced operability features.
One important objective of the ongoing upgrades is to implement a modern infrastructure, based on leading virtualization technologies. This modernized infrastructure will make it possible to easily accommodate hardware and software changes without requiring significant redesign or requalification, and will minimize the impact to Galileo service operations — under responsibility of Spaceopal GmbH — during future deployment activities.
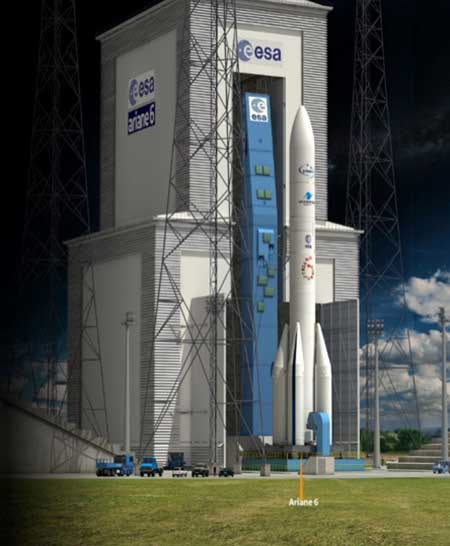
Batch 3, Ariane 6 Under Production
Ariane 6 on the launchpad. (Artist’s concept: ESA)
The production of Batch 3 of 12 additional Galileo FOC satellites is proceeding, aiming at readiness for launch by the end of 2020 onward. The satellite design includes a selected number of improvements compared to the 22 FOC satellites launched previously and built by the same satellite manufacturer OHB Systems.
The different stages of assembly, integration and initial test phase in the OHB production plant in Bremen have already started, before shipment to ESA-ESTEC in the Netherlands for the environmental test campaign consisting of thermal vacuum, mechanical tests, interface verification with the launcher and system end-to-end performance tests with the elements of the Galileo ground segment.
Following the phasing out of the Ariane 5 SE launcher, the third batch of Galileo satellites will be progressively launched with the new Ariane 62 launcher vehicle, the two solid-booster variant of Ariane 6 now in the final stages of development.
Evolution to Meet User Needs
The Galileo Second Generation roadmap has achieved maturity in 2019 and is now entering the preliminary design and implementation phase. Based on the EU’s H2020 Galileo Second Generation activities managed by ESA, and the GSA prospective market analysis, the European Commission, in close consultation with EU member states, has agreed on an ambitious set of long-term PNT goals for the future European GNSS infrastructures.
Technology pre-developments, critical engineering activities and synergic design activities between space and ground infrastructure are being conducted. This will translate into the progressive deployment of a complete set of space/ground infrastructure that is tailored to satisfy the diversified user needs in four main dimensions:
Satellite and ground segment infrastructure with capabilities that can dynamically adapt to current and future user needs. Key drivers are flexibility and robustness, ensuring fast time to market to meet user needs.
Full synergy between GNSS and SBAS systems infrastructure, to complement and enhance the service portfolio. This will allow segmentation and complementarity of safety-critical services and extension to all new PNT services available today, including high-accuracy positioning integrity.
Enhanced integration with terrestrial systems — 5G/6G, signals of opportunity (SOOP), terrestrial beacon systems (TBS). ESA and GSA have been actively leading the 5G positioning standardization worldwide in collaboration with public and private institutions inside 3GPP and will soon move toward the start of standardization of 6G terrestrial positioning and GNSS interconnection technologies.
Full complementarity with external sensors (such as INS, barometer and lidar) and application environments (low-power devices and internet of things) so that the Galileo Second Generation Infrastructure enhances and complements the capabilities provided by these external means.
A key pillar for this long-term strategy is the Galileo transition satellites. The competitive procurement procedure for the first batch of transition satellites is coming in 2020. The flexibility and robustness of these satellites will allow the European PNT infrastructure to satisfy all the different user needs in the next decade. This procurement — together with others at system, ground segment and technology level — will enable the start of the in-orbit validation of second-generation capabilities from 2025 onward.
Additional ground and test infrastructure are in early engineering analysis, design and technology development, in order to proceed with additional procurements for experimental and operational usage, starting early in the 2020s.
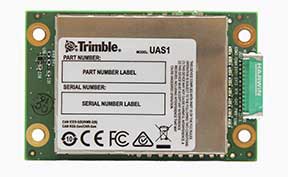
The UAS1 GNSS receiver module has been designed for UAV/UAS applications requiring centimeter accuracy in a small package. (Photo: Trimble)
Trimble has introduced a compact, high-precision GNSS board specifically designed for unmanned aerial systems (UAS).
The Trimble UAS1 has a simple connectivity and configuration to allow UAS system integrators to easily add satellite-based positioning — with the ability to upgrade its capabilities — using rugged connectors and Trimble’s easy-to-use software interface.
The new UAS1 incorporates the latest Trimble Maxwell technology with advances in high-precision GNSS positioning. Its GNSS engine with 336 channels is capable of tracking L1/L2 frequencies from the GPS, GLONASS, Galileo and BeiDou constellations for robust centimeter-level, real-time kinematic (RTK) positioning.
The compact board includes a broad range of receiver capabilities — from high-accuracy GPS-only to full GNSS features for positioning. Firmware options and features are password upgradeable, allowing functionality to be added as requirements change.
The receiver also supports fault detection and exclusion (FDE) and receiver autonomous integrity monitoring (RAIM). System integrators also have the ability to detect interference with the RF Spectrum Monitoring and Analysis tool embedded in the receiver.
“UAS manufacturers demand high performance, reliability and high-quality customized support for their positioning solutions,” said Thomas Utzmeier, general manager of Trimble’s Integrated Technologies Division. “The new UAS1 board delivers the latest GNSS technology in an easy-to-integrate form factor for UAV/UAS applications.”
Designed for easy integration and rugged dependability, the Trimble UAS1 has a Remote Network Driver Interface Specification (RNDIS) that enables manufacturers to access the web UI with the USB connector. As with similar Trimble embedded boards and modules, easy-to-use software commands can simplify integration and reduce development times.
Features also include integrated Trimble RTX technology, an industry-standard camera hot-shoe interface to geo-position photographs, and LED indicators for status checks. The Trimble UAS1 can also output to RINEX, a common postprocessing format.
The Trimble UAS1 supports Trimble CenterPoint RTX GNSS corrections, which enable precise and robust positioning without the use of a base station via a subscription service. CenterPoint RTX allows users to achieve better than 2-centimeter horizontal and 5-centimeter vertical accuracy.
Trimble’s UAS1 is suitable for UAS applications requiring centimeter accuracy in a small package. Manufactured and tested to Trimble’s highest quality standards, the compact design allows for easy setup, configuration and installation in a customers’
system.
Using a full metal shield (the form factor is 71 x 46 x 13 millimeters), the board’s design enables high-precision GNSS signal protection from electromagnetic interference (EMI) on the host UAS platform. In addition, the receiver is FCC- and CE-certified, which speeds compliance for the customer’s overall system and can reduce time to market.
By Kazuma Gunning, Juan Blanch and Todd Walter, Stanford University, and Lance de Groot and Laura Norman, Hexagon Positioning Intelligence
UAV and autonomous platforms can greatly benefit from an assured position solution with high integrity error bounds. The expected high degree of connectivity in these vehicles will allow users to receive real-time precise clock and ephemeris corrections, which enable the use of precise point positioning (PPP) techniques.
Until now, these techniques have mostly been used to provide high accuracy, rather than focusing on high-integrity applications. The authors apply the methodology and algorithms used in aviation to determine position error bounds with high integrity (or protection levels) for a PPP position solution.
PPP techniques can provide centimeter accuracy without local reference stations in kinematic applications. These techniques have so far mostly been used to provide high accuracy, and it is only recently that they have been proposed to provide integrity, that is, position error bounds with a very low probability of exceeding them.
There has been preliminary work on the application of integrity to PPP, but it remains a challenge to translate the benefits of PPP to accuracy while maintaining high integrity. Most of the integrity work in PPP and real-time kinematic (RTK) has dealt more with the ambiguity resolution process under nominal error conditions and less on the integrity of the position solution under fault conditions.
The authors overview their PPP filter implementation, and describe the threat model as well as two classes of integrity algorithms: solution separation and sum of squared residuals based (also called residual-based [RB], a misnomer, as all autonomous integrity monitors are based on the residuals.)
They present data sets used to evaluate the algorithms, compare the protection levels (PLs) obtained with different algorithms, and present the results obtained with the most promising PL formulation in four different data sets: static, dynamic in open-sky conditions, dynamic in midtown suburban conditions, and in flight.
Concluding, they state: “We have formulated RAIM protection-level formulas using either solution separation or the sum of residual squares. Both formulations consist of straightforward adaptations of snapshot RAIM to a Kalman filter solution.
“For solution separation, we have shown an implementation where the computational cost of running a bank of filters is far from being proportional to the cost of one filter. Instead, we could run 50 additional filters for the cost of one.
“For residual based RAIM we have developed a set of formulas to update the sum of square residuals from one time step to the next one. Because this test statistic is exactly the same as the one used in snapshot RAIM (when we consider the problem as a batch least squares), we could use the formula that ties the slope of a fault mode to the standard deviation of the solution separation. The slope can therefore also be updated recursively.”
Finally, “we have refined the PPP filter, added one scenario (suburban driving conditions), and examined the effect of considering multiple faults in the formulation of the test statistics and the protection levels. The results are very promising: protection levels below 2 m appear to be achievable, and the computation load is lower than expected.”
Interest in the Iridium constellation as a potential alternative and back-up provider of positioning and timing has increased with the announcement of impending operational capability. Overall concept information is hard to come by, but this 2009 ION GNSS paper gives an early look. The text is from the paper’s abstract.
The iGPS high-integrity precision navigation system combines carrier phase ranging measurements from GPS and low Earth orbit Iridium telecommunication satellites. Large geometry variations generated by fast-moving Iridium spacecraft enable the rapid floating estimation of cycle ambiguities. Augmentation of GPS with Iridium satellites also guarantees signal redundancy, which enables fault-detection using carrier phase Receiver Autonomous Integrity Monitoring (RAIM). Over short time periods, the temporal correlation of measurement error sources can be exploited to establish reliable error models, hence relaxing requirements on differential corrections. In this paper, a new ionospheric error model is derived to account for Iridium satellite signals crossing large sections of the sky within short periods of time. Then, a fixed-interval positioning and cycle ambiguity estimation algorithm is introduced to process Iridium and GPS code and carrier-phase observations. A residual-based carrier phase RAIM detection algorithm is described and evaluated against single-satellite step and ramp-type faults of all magnitudes and start times. Finally, a sensitivity analysis focused on ionosphere-related system design variables (ionospheric error model parameters, code-carrier divergence, single- and dual-frequency implementations) explores the potential of iGPS to fulfill some of the most stringent navigation integrity requirements with coverage at continental scales.
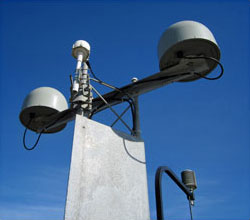
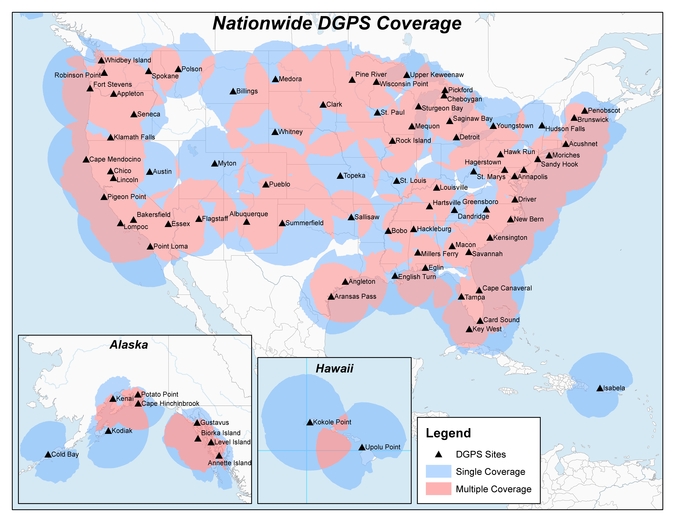
Twenty-two NDGPS sites that serve coastal areas would remain operational under the proposal.
An Aug. 18 Federal Register notice proposes shutting down the Nationwide Differential Global Positioning System (NDGPS) in January 2016 because of a decline in its use, except for sites in coastal areas.
The notice, issued by the U.S. Coast Guard (USCG), Transportation Department (DOT) and Corps of Engineers (USACE), reads:
The Nationwide Differential Global Positioning System (NDGPS) service augments GPS by providing increased accuracy and integrity using land-based reference stations to transmit correction messages over radiobeacon frequencies. The service was implemented through agreements between multiple federal agencies including the USCG, DOT, and Army Corps of Engineers, as well as several states and scientific organizations, all cooperating to provide the combined national DGPS utility.
However, a number of factors have contributed to declining use of NDGPS and, based on an assessment by the Department of Homeland Security, DOT and USACE. DHS, DOT and USACE are proposing to shut down and decommission 62 DGPS sites, which will leave 22 operational sites available to users in coastal areas.
A DGPS reference station antenna.
Contributing factors cited in the decision are:
USCG changes in policy to allow aids to navigation (ATON) to be positioned with a GPS receiver using Receiver Autonomous Integrity Monitoring (RAIM), which assesses the integrity of a GPS signal within the receiver;
increased use of Wide Area Augmentation System (WAAS) in commercial maritime applications, which uses ground-based reference stations and satellite communications to improve accuracy;
limited availability of consumer-grade NDGPS receivers;
no NDGPS mandatory carriage requirement on any vessel within U.S. territorial waters;
the DOT Federal Railroad Administration’s determination that NDGPS is not a requirement for the successful implementation of Positive Train Control (PTC), which provides the railway system the capability to positively enforce movement authorities along railroad systems.
In April 2013, announced that DHS and DOT were in the process of analyzing the need for NDGPS. “The response to the 2013 notice was limited, but the responses received were well informed on the NDGPS system, its use, and current and potential applications,” the notice reads. “While a limited number of responders found the broadcast of corrections to be beneficial, no respondents reported the discontinuance of DGPS broadcast to be detrimental or harmful. Ship pilots in particular noted that DGPS can be critical in confined waterways for precise ship-handling maneuvers.”
Public comments on the proposed shutdown and decommissioning of 62 DGPS sites are being accepted until Nov. 16. Termination of the NDGPS broadcast at these sites is planned to occur on Jan. 15, 2016.
Full details on how to submit public comments can be found on the Federal Register page.
The 2014 Federal Radionavigation Plan, just released from the U.S. Department of Transportation, touches on funding for the Nationwide Differential GPS and the use of eLoran as a precision timing alternative.
The plan is signed by the Secretaries of Defense, Transportation and Homeland Security, and released by the DOT Office of the Assistant Secretary for Research and Technology. A PDF of the document has been posted to the NAVCEN’s website.
Nationwide Differential GPS (NDGPS). The nationwide differential GPS (NDGPS) service augments GPS by providing increased accuracy and integrity using land-based reference stations to transmit correction messages over radiobeacon frequencies. The service has been implemented through agreements among federal agencies including the Coast Guard, DOT and the Army Corps of Engineers, but a decision has not yet been made on funding beyond FY2016:
“The Department of Homeland Security, in coordination with the Department of Transportation, is analyzing the future requirements for the NDGPS to support investment decisions beyond Fiscal Year (FY) 2016. Future investment decisions might include maintaining NDGPS as currently configured, decommissioning NDGPS as currently configured, or developing alternate uses for the NDGPS infrastructure. Contributing factors to these decisions are: (1) the U.S. Coast Guard change in policy to allow aids to navigation (ATON) to be positioned with a GPS receiver using Receiver Autonomous Integrity Monitoring (RAIM), and to allow USCG navigation in all waters using the WAAS receiver; (2) limited availability of consumer grade NDGPS receivers; (3) no USCG DGPS carriage requirement on any vessel within U.S. territorial waters; (4) the Presidential Directive turning off GPS SA; (5) continuing GPS modernization; and (6) the Federal Railroad Administration’s determination that neither NDGPS, nor High Accuracy NDGPS, are requirements for the successful implementation of Positive Train Control.”
eLoran for Timing. eLoran is mentioned in the plan only briefly, in the following excerpt about precision timing alternatives:
“For precise timing applications, chip-scale atomic clocks are now available from at least one company, and others have active research and development programs in the United States and abroad. The U.S. Coast Guard has established a Cooperative Research and Development Agreement to assess a high-power wireless alternative for providing precise time using U.S. government facilities such as mothballed Loran-C sites, upgraded to eLoran capability. If successful, this effort would offer another solution suitable for integration with GPS, or use as an independent complement to GPS, that could together provide highly available and precise timing for many applications.”
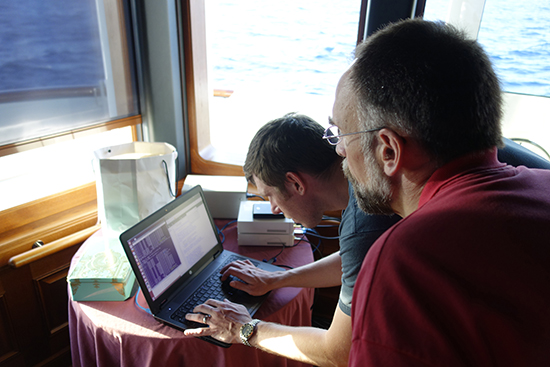
Photo: Mark L. Psiaki, Brady W. O’Hanlon, Steven P. Powell, Jahshan A. Bhatti, Todd E. Humphreys, and Andrew Schofield
Spoofing Detection with Two-Antenna Differential Carrier Phase
By Mark L. Psiaki, Brady W. O’Hanlon, Steven P. Powell, Jahshan A. Bhatti, Todd E. Humphreys, and Andrew Schofield
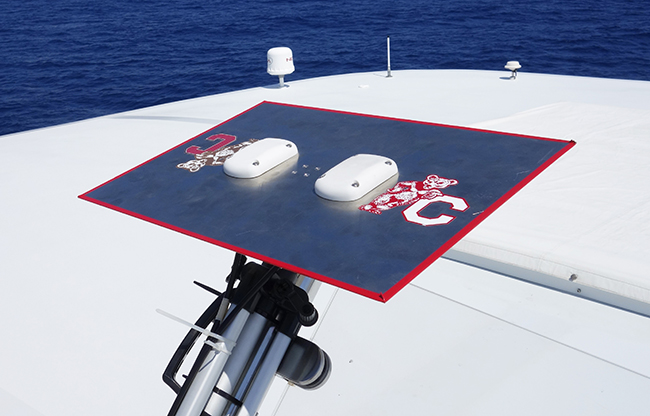
A new method detects spoofing attacks that are resistant to standard RAIM technique and can sense an attack in a fraction of a second without external aiding. The signal-in-space properties used to detect spoofing are the relationships of the signal arrival directions to the vector that points from one antenna to the other. A real-time implementation succeeded against live-signal spoofing attacks aboard a superyacht, the White Rose of Drachs shown above, cruising in international waters.
Concerns about spoofing of open-service GNSS signals inspired early work on simple receiver-autonomous integrity monitoring (RAIM) methods based on the consistency of the navigation solution. Work on new classes of defense techniques began in earnest after the demonstration of a powerful spoofer that is undetectfable by simple pseudorange-based RAIM methods. There has been a sense of urgency to solve the spoofing problem since the Iranians captured a classified U.S. drone in 2011 and made unsubstantiated claims to have spoofed its GPS. Two dramatic field demonstrations of the spoofer developed by author Humphreys and colleagues at the University of Texas, Austin, heightened interest in spoofing detection: one involved deception of a small airborne unmanned autonomous vehicle (UAV), causing it to dive towards the ground; another sent a superyacht off course without raising any alarms on its bridge.
One class of spoofing detection methods uses encrypted signals, their known relationships to the open-service signals, and after-the-fact availability of encryption information. Such techniques require a high-bandwidth communication link between the potential victim of a spoofing attack and a trusted source of after-the-fact encryption information, and may involve significant latency between attack and detection.
Another class of methods uses advanced RAIM-type techniques. Instead of considering only pseudorange consistency, these RAIM techniques examine additional signal characteristics such as absolute power levels, distortion of the PRN code correlation function along the early/late axis, the possible existence of multiple distinct correlation peaks in signal-acquisition-type calculations, and other signal or receiver characteristics. Such methods are relatively simple to implement because they do not require much additional hardware, if any, but some of these strategies can have trouble distinguishing between multipath and spoofing or between jamming and spoofing.
A third class proposes the addition of Navigation Message Authentication bits. These are encrypted parts of the low-rate navigation data message. Such techniques require modification of the navigation data message and can allow long latencies between the onset of a spoofing attack and its detection.
A fourth class exploits the differing signal-in-space geometry of spoofed signals in comparison to true GNSS signals. All spoofed signals typically arrive from the same direction, but true signals arrive from a multiplicity of directions. Some of these methods use receiver antenna motion to achieve direction-of-arrival sensitivity. Others use an array of two or more receiver antennas.
The most powerful of these detection strategies exploit models of the effects on carrier-phase data of antenna motion or antenna-array geometry. This knowledge may be partial because an unknown antenna-array attitude may need to be determined as part of the detection calculation. Their power derives from the high degree of accuracy with which a typical GNSS receiver can measure beat carrier phase.
Goals. This research follows on moving-antenna/carrier-phase-based spoofing detection work. One of our goals has been to remove the necessity for moving parts by using two antennas and processing their carrier-phase data.
A second goal has been to achieve real-time operation. An earlier prototype moving-antenna system (see “GNSS Spoofing Detection,” GPS World, June 2013) used post-processing and completed its spoofing detection calculations days or weeks after the recording of wide-band RF data during live-signal attacks.
A third goal has been to test this system against actual live-signal spoofing attacks to prove its real-time capabilities and evaluate its performance during the two phases of an attack: the initial signal capture and the post-capture drag-off to erroneous position and timing fixes.
Two-Antenna System Architecture
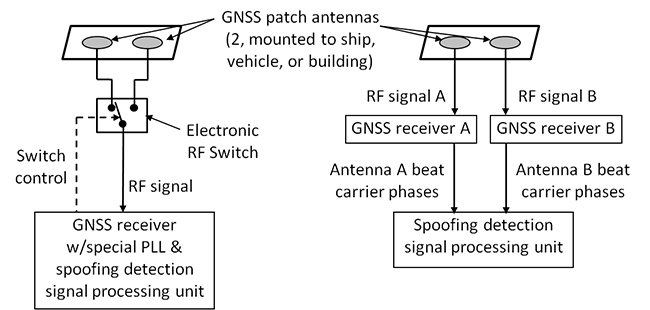
The system consists of two GNSS patch antennas, GPS receiver hardware and software, and spoofing detection signal-processing hardware and software. Figure 1 shows two versions. The left-hand version connects its two patch antennas to an RF switch. The single analog RF output of the switch is input to a GNSS receiver that is standard in all respects, except for two features. First, it controls the RF switch or, at least, has access to the switching times. Second, it employs a specialized phase-locked loop (PLL) that can track the beat carrier phase of a given signal through the phase jumps that occur at the switching times. The right-hand version connects each antenna to an independent GPS receiver, likely connected to a common reference oscillator.
Figure 1. Two configurations:, the RF-switched-signal/single-receiver configuration (left) and the two-receiver configuration (right).
The last element of each system is a spoofing detection signal-processing unit. Its inputs are the single-differenced beat carrier phases of all tracked signals, with differences taken between the two antennas. In the switched antenna system, each difference is deduced by the specialized PLL. In the two-receiver system, the single-differences are calculated explicitly from each receiver’s beat carrier-phase observables.
Except for the final spoofing detection unit, the two-receiver system on the right-hand side of Figure 1 is already available commercially. Typical applications are CDGPS-based attitude/heading determination. Thus, this is the easiest version to implement.
This system could include more than two antennas. A multi-antenna system could have a dedicated RF front-end and a dedicated set of receiver channels for each antenna, as on the right of Figure 1. Alternatively, a multi-antenna system could include an RF switch between any one of the multiple antennas at the command of the receiver. The latter design would entail a slight modification to the specialized PLL to track multiple independent phase jumps for the independent antenna switches.
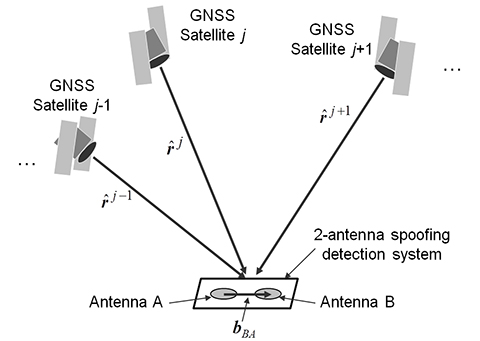
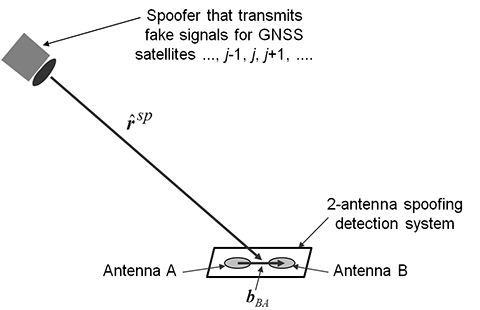
Principles. The principles used to detect spoofing can be understood by considering and comparing the signal-in-space and antenna geometries shown in Figure 2, the two-antenna system and three GNSS satellites for a typical non-spoofed case, and Figure 3, a spoofed case. The salient difference is that the different GNSS signals arrive from different directions for the non-spoofed case, namely and . They all arrive from the same direction, the direction of the spoofer , for the spoofed case. For detection purposes, the important geometric feature is the projection of each direction of arrival onto the known separation vector between the two antennas, bBA. This projection has a direct effect on the beat carrier-phase difference between the two antennas. In the non-spoofed case, this effect will vary between the different received signals in ways consistent with the attitude of the vector. In the spoofed case, all of these carrier-phase differences will be identical. The spoofing detection algorithm decides between two hypotheses about the carrier-phase differences, one conjecturing a diversity consistent with authentic signals and the other conjecturing the sameness that is characteristic of spoofed signals.
Figure 2. Geometry of two-antenna spoofing detection system and GNSS satellites for non-spoofed case.Figure 3. Spoofed-case geometry of two-antenna spoofing detection system and GNSS spoofer.
Hypothesis Test
The PDF paper on which this article is based presents the non-spoofed and spoofed signal models that form the basis of a hypothesis test, develops optimal estimation algorithms that fit the observed differential beat carrier phases to the two models, and shows how these estimates and their associated fit error costs can be used to develop a sensible spoofing detection hypothesis test. Download the PDF here.
Offline and Live-Signal Testing
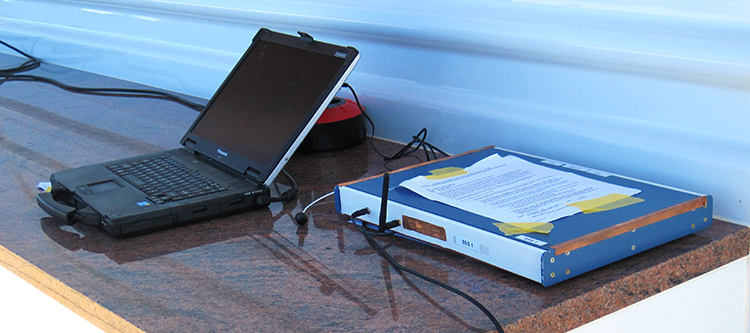
We tested a prototype version of the two-antenna system as depicted on the righthand side of Figure 1. The antennas connect to two independent RF front-ends that run off of the same reference oscillator. These RF front-ends provide input to two independent receivers that track each signal using a delay-lock loop (DLL) and a PLL. Figures 4 and 5 show system elements: two GPS patch antennas mounted on a single ground plane with a spacing of 0.14 meters, two RF front-ends — universal software radio peripherals (USRPs) — with a common ovenized crystal oscillator. Digital signal-processing functions are implemented in real-time software radio receivers (SWRX) running in parallel on a Linux laptop, written in C++. Spoofing detection calculations are performed on the same laptop using algorithms encoded in Matlab.
Figure 4. The two antennas of the prototype spoofing detection system mounted on a common ground plane.Figure 5. Signal processing hardware of the prototype spoofing detection system.
A key feature of this architecture is the ability of its real-time software radios’ C++ code to call the spoofing detector’s Matlab tic function and to pass carrier-phase and other relevant data to the tic function. This feature served to shorten the implementation and test cycle for the prototype system by eliminating the need to translate the original Matlab versions of the spoofing detection algorithms into C++. This enabled rapid re-tuning and redesign of the spoofing detection calculations, exploited during the course of live-signal testing.
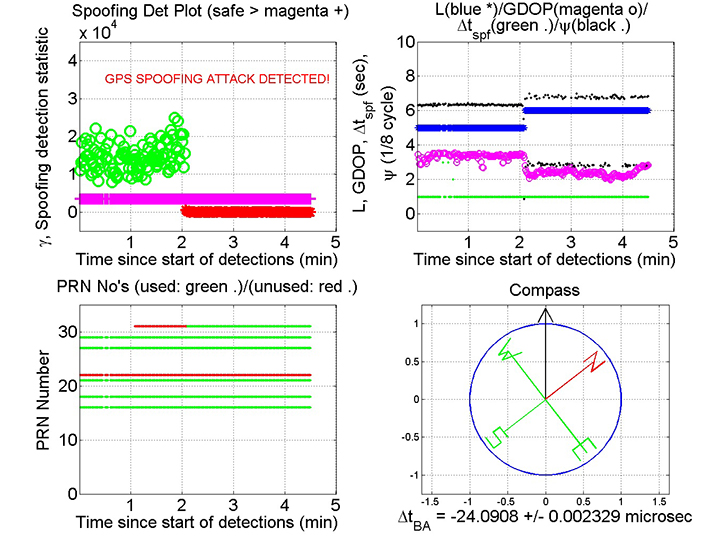
The Matlab package displays real-time signal authentication information. Figure 6 shows the version of the display used for this study’s culminating live-signal tests. All displays are updated in real time. The upper left, upper right, and lower left plots scroll along their horizontal time axes to keep the most recent 4.5 minutes of data available. The lower right compass updates each time a new spoofing detection calculation is performed. The green dots in the upper left plot indicate that the time between spoofing detections, Δtspf , is nominally 1 second, though sometimes the gap is longer due to lack of a sufficient number of validated single-differenced carrier phases to carry out the calculation. Thus, the nominal update time for all of the plots in this display is 1 second. Faster updates are possible with the Matlab software, but Δtspf was deemed sufficiently fast for this study’s experiments.
The most important panel in Figure 6 is the upper left spoofing detection statistic time history. The magenta plus signs on the plot show the spoofing detection threshold chosen for this case, γth. The computed γ values are plotted as green o’s if they lie above γth and as red asterisks if they lie below. If γ is above γth, the message “GPS Signals Authenticated” is displayed on the plot; if below, the message switches to the spoofing alert: “GPS SPOOFING ATTACK DETECTED!”
Figure 6. Spoofing detector real-time display. Clockwise from top left: the spoofing detection statistic time history γ(t); four diagnostic time histories that include time histories of the number of satellites used for spoofing detection L(t) (blue asterisks), their corresponding GDOP(t) values (magenta o’s), the time increment between spoofing detection tests Δtspf(t) (green dots), and the compass heading ψ(t) as determined from the two-antenna non-spoofed-case solution (black dots); Compass display; and time history of GPS PRN number availability.
The other three panels proved helpful in diagnosing system performance. A low L value (near 4) or a high GDOP value in the upper right panel indicated poorer reliability of the spoofing detection calculations. A correct compass heading in the absence of spoofing provided a check on the system. During spoofing attacks, the compass heading became jumpy, thereby providing another possible indicator of inauthentic signals.
The vertical scale of the lower left panel lists the possible GPS PRN numbers. The presence of a green or red dot at the level corresponding to a given PRN number indicates that one or both receivers is seeing something from that satellite at the corresponding time. If the dot is red, then the returned data are incomplete or are deemed to be insufficiently validated for use in the spoofing detection calculation. If the dot is green, then the data from that PRN have been used in the detection that has been carried out at that time.
Another feature of the prototype spoofing detection system is its ability to record the wide-band RF data from its two antennas. For each spoofing scenario, the raw samples from both USRPs were recorded while the real-time software receiver was performing its signal-processing operations and while the real-time spoofing detector was doing its calculations. These recorded data streams will allow off-line analysis and testing of a re-tuned or completely redesigned spoofing detection system.
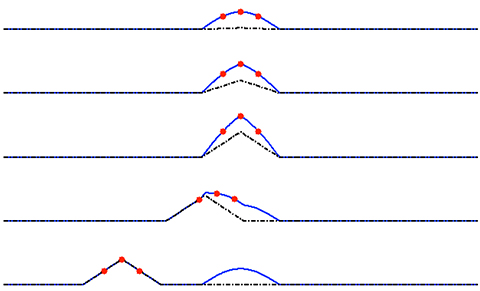
Red Team Receiver/Spoofer. The UT Austin spoofer’s attack strategy overlays the spoofed signal on top of the true signals, ramps up the power to capture the receiver tracking loops, and finally drags the pseudorange, beat carrier phase, and carrier Doppler shift off from their true values to spoofed values. Figure 7 shows the pseudorange part of a spoofing attack: cross-correlation of the receiver’s PRN code replica with the total received signal (blue solid curve); the receiver’s early, prompt, and late correlations (red dots); and the spoofer signal (black dash-dotted curve). In the top plot, the spoofer has zero power, and the receiver sees only the true signal. The second and third plots show the spoofer ramping up its power while maintaining its false signal in alignment with the true signal. The spoofer power in the middle/third plot is sufficient to capture control of the three red dots of the receiver’s DLL. In the fourth and fifth plots, the spoofer initiates and continues a pseudorange drag-off, an intentional falsification of the pseudorange as measured by the victim receiver’s DLL.
Figure 7. Receiver/spoofer attack sequence as viewed from a channel’s code offset cross-correlation function. Spoofer signal: black dash-dotted curve; sum of spoofer and true signals: blue solid curve; receiver early, prompt, and late correlation points: red dots.
The spoofer performs drag-off simultaneously on all spoofed channels in a vector spoofing attack that maintains consistency of all spoofed pseudoranges. After the initiation of drag-off, the victim receiver computes a wrong position, a wrong true time, or both, but the residual pseudorange errors in its navigation solution remain small. Therefore, this type of attack is not detectable by traditional pseudorange-based RAIM calculations.
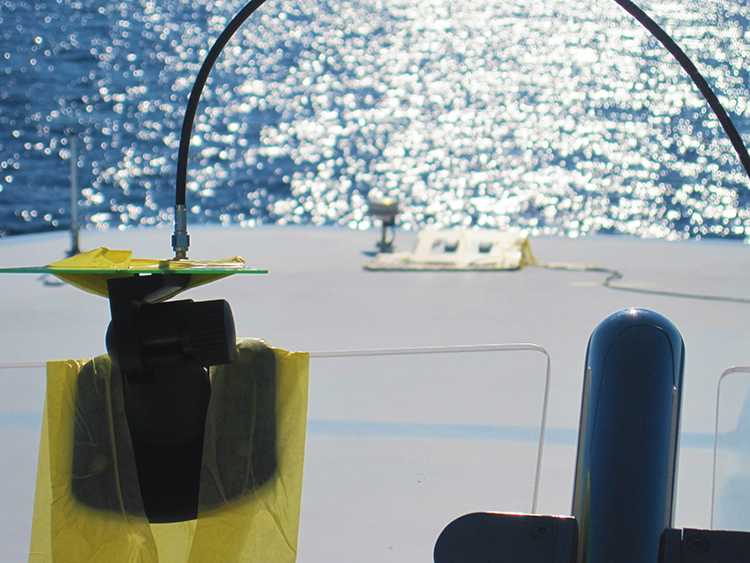
The receiver spoofer hardware consists of a GNSS reception antenna, the receiver spoofer signal-processing unit, and the spoofer transmission antenna (Figure 8).
Figure 8a. Receiver/spoofer hardware: GPS reception antenna on ship’s rear upper deck.Figure 8b. Receiver/spoofer hardware: directional transmission antenna pointed at the ship’s GPS antenna and the detector antenna pair near the defended ship’s antenna. The orientation of the spoofing transmission antenna, combined with its remote location from the receiver/spoofer’s reception antenna, ensured that the spoofer did not self-spoof.Figure 8c. Receiver/spoofer hardware: spoofer electronics, located amidships.
The receiver/spoofer requires tuning of its transmission power levels. If the power is too high, its spoofing attacks will be too obvious. A very high transmitted power could also saturate the front-end electronics of the intended victim, causing it to jam the system rather than spoof it. If transmitted power is too low, it will not capture the victim’s tracking loops, and its spoofing attack will fail. The proper power level depends on the gain patterns of the spoofer transmission antenna and the victim receiver antenna and on their relative geometry.
Attack Test Scenarios. Three sets of tests were conducted to develop and evaluate the spoofing detection system. The first tests started by recording wideband RF GPS L1 data using USRPs. These data were post-processed in two software receivers that recorded the outputs of their signal tracking loops. Afterwards, the Matlab spoofing detection calculations were run using the recorded tracking loop data as inputs. These preliminary tests at Cornell and Austin proved the efficacy of the spoofing detection algorithms. They did not, however, test system performance during the transition from non-spoofed to spoofed signals that takes place at the initiation of a spoofing attack.
The second set of tests was carried out using the first real-time version of the system, after the Matlab spoofing detection calculations were repackaged into a tic function and linked to the C++ real-time software receivers. This set of tests also was unable to probe the system’s performance at the onset of a spoofing attack, before the signal drag-off.
The final set of tests was conducted aboard the White Rose of Drachs in the Mediterranean’s international waters.
The power adjustment tests on June 27 needed a means to decide whether a given attack had captured the tracking loops of the ship’s GPS receiver. The strategy for confirming capture was to perform a noticeable drag-off after the initial attack. We settled on a vertical drag-off as providing the most obvious indication of a successful capture. Successful attacks dragged the receiver’s reported altitude as high as 5,000 meters.
The tests that evaluated spoofer and spoofing detector antenna placements relative to the ship’s GPS antenna were also important to achieving sensible results. Various placements were tried. The most successful relative geometry is depicted in Figure 8.
The placement of the detector antennas relative to the defended antenna is atypical of likely real-world detection scenarios. It is expected that a real-world spoofing detector will be integral with the defended GNSS receiver.
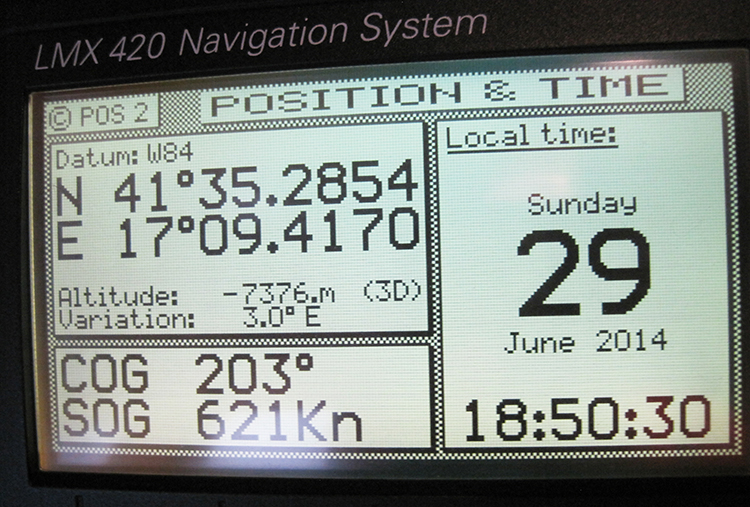
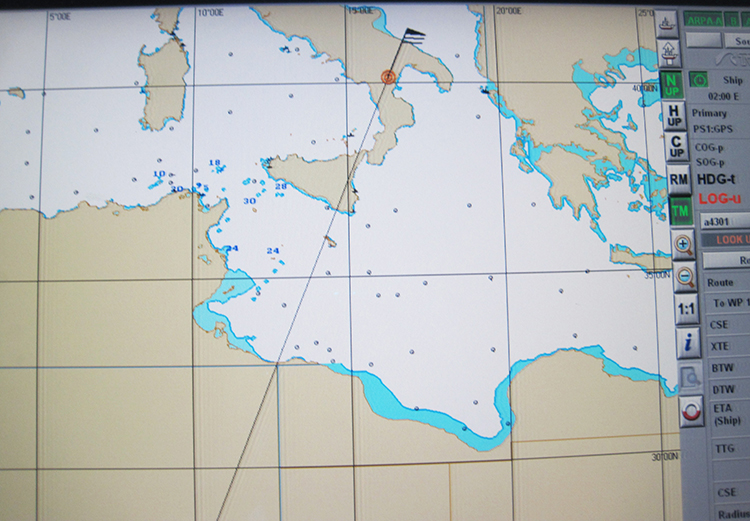
The culminating live-signal attack involved a 50-minute spoofing scenario in which the attacker took the ship — apparently — from the Adriatic to the coast off of Libya. The scenario’s long distance and short duration required a mid-course speed in excess of 900 knots. This spoofing scenario was designed in the simplest possible way, by taking a straight-line course in WGS-84 Cartesian coordinates from the true location to the spoofed location off of Libya. This course took the spoofed yacht position across the Italian and Sicilian land masses and below the Earth’s surface to a maximum depth of more than 23 kilometers.
Obviously, the White Rose was physically unable to execute this maneuver. Its crew would not have needed spoofing detection to realize that its GPS receiver was returning false readings. The main points of this last test were to dramatize the potential errors that can be caused by a spoofer and to check whether the spoofing detector could continue to function under these drastic conditions.
Figure 9 highlights this unusual scenario with two displays from the ship’s bridge, photographed during the attack. The GPS display shows the speed, 621 kn (knots), and the altitude, 7376 m. The chart display shows the yacht on (or rather, below) dry land and halfway across the “insole” of Italy’s boot. It also shows a tremendously long velocity vector, extending beyond the chart.
Figure 9a. The ship’s bridge GPS receiver display during the Libya spoofing scenario.Figure 9b. The GPS-driven chart during the Libya spoofing scenario.
Spoofing Detection Test Results
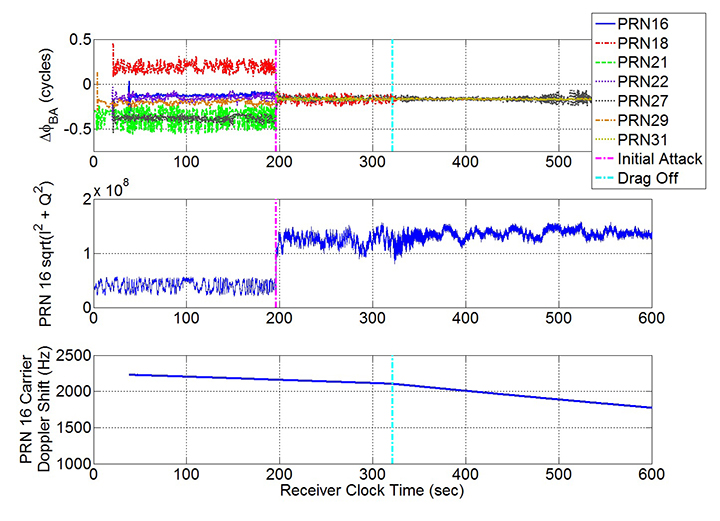
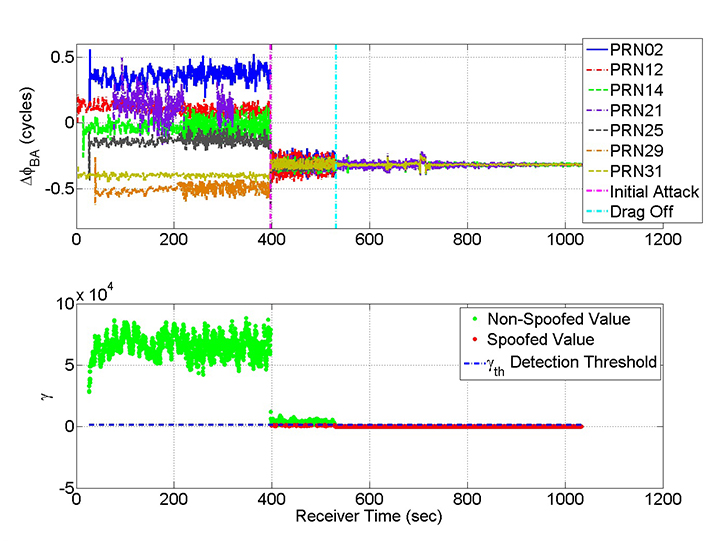
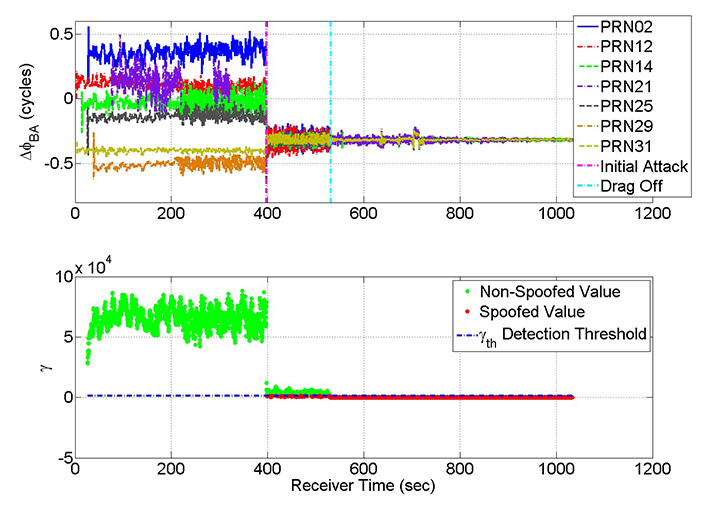
Various signal output time histories (Figure 10) illustrate the attack sequence and suggest means to evaluate the spoofing detection system. The upper panel plots the fractional portions of the two-antenna spoofing detector’s single-differenced beat carrier-phase time histories, Δϕ1BA, …, ΔϕLBA for the L = 7 tracked PRN numbers 16, 18, 21, 22, 27, 29, and 31. The middle panel plots the amplitude time history of the 100 Hz prompt [I;Q] accumulation vector for PRN 16, as received at Antenna A of the detection system. The bottom panel plots the PRN 16 carrier Doppler shift time history.
Figure 10. Indicators of initial capture and drag-off during Libya spoofing attack, as measured by the spoofing detection receiver.
This was a strong attack in which the spoofer power was 10.7 dB higher than the power of the real signal for PRN 16. The other spoofed signals had power advantages over their corresponding true signals that ranged from 3.3 dB to 13.6 dB, and the spoofer’s mean power advantage was 10.4 dB. Therefore, the onset of the spoofing attack at 196.1 sec is clearly indicated by the sudden jump in (I2+Q2)0.5 on the middle panel. The upper panel shows a corresponding sudden coalescing of the single-differenced beat carrier phases, which implies that the spoofing detection algorithm should have been able to detect this attack.
The spoofer drag-off started at 321.5 sec, as evidenced by the sudden change in the slope of the carrier Doppler shift time history on the lower panel. The period after the initial attack and before the drag-off is delimited by the vertical magenta and cyan dash-dotted lines. During this interval the spoofer waited to capture the receiver’s tracking loops.
The single-differenced phase time histories in the upper plot appear somewhat noisier during the interim pre-drag-off period of the attack than after the start of the drag-off at 321.5 sec. The grey dotted curve for PRN 27 is an exception because it becomes noisy again starting at about 450 sec due to decreased signal power. The increased noisiness of the differential phase time histories during the interim period is probably the result of interference between the true and spoofed signals, which are likely beating slowly against each other. The response of the spoofing detection algorithm during this phase is uncertain because this multipath-like beating between the two signals is not modeled.
Figure 11 demonstrates performance of the spoofing detection algorithm for the Libya attack scenario. The upper panel of the figures is a repeat of the upper panel of the single-differenced beat carrier-phase time histories from Figure 10, except that they are plotted for a longer duration. The lower panel shows the γ(t) spoofing detection statistic time history. It plots the same information that appeared in the upper left panel of Figure 6 during the corresponding real-time detection tests. At 196 sec γ(t) is clearly above the blue dash-dotted spoofing detection threshold γth. At 196.4 sec it is clearly below γth , which indicates a spoofing detection. It remains below γth for the duration of the attack. In this reprocessed version of the detection calculations, γ(t) has been updated at 5 Hz. Therefore, the earliest possible detection point would have been 196.2 sec, which is 0.1 sec after the onset of the attack. This point corresponds to the green dot in the lower panel of Figure 11 that lies slightly above the blue dash-dotted γth line. Theoretically, the system might have detected the attack at this time, but the finite bandwidth of the two receivers’ PLLs caused lags in the transitions of the single-differenced phases in the top plot, which led to the 0.3 sec lag in the detection of the attack. It is encouraging, however, that the spoofing detector worked well during the initial pre-drag-off phase of the attack, from 196.1 to 321.5 sec, despite the added noisiness of the single-differenced carrier phases in the top plot, likely caused by beating between the true and spoofed signals.
Figure 11. Single-differenced carrier-phase time histories (top plot) and corresponding spoofing detection statistic time history (bottom plot) for Libya spoofing attack scenario.
Figure 12 plots the same quantities as in Figure 11, but for a different spoofing attack, a little less overt than the Libya attack. The power advantage of the spoofer ranged from 3.0 to 14.0 dB for the different channels with a mean power advantage = 9.2 dB. It was detected by the system, as evidenced by the convergence of the single-differenced carrier phases at the onset of the attack at 397.5 sec. The spoofing detection statistic in the bottom panel dives near to the γth detection threshold at the onset of the attack and sometimes passes below it, but it does not stay permanently below the threshold until after the time of drag-off, after 531 sec.
Figure 12. Single-differenced carrier phase time histories (top plot) and spoofing detection statistic time history (bottom plot) for a spoofing attack with a slightly lower power advantage than the Libya attack.
The large oscillations of the single-differenced carrier phases during the pre-drag-off initial capture interval from 397.5 to 531 seconds is likely due to beating between the true and spoofed signals. The largest variations occur for PRNs 12 and 31, which are the ones with the lowest spoofer power advantages, 3.2 and 3.0 dB, respectively. Apparently these oscillations cause γ(t) sometimes to take on values slightly above γth during the interval 397.5 sec < t < 531 sec. Thus, the spoofing detector can experience problems in the initial phases of an attack.
Note that the spoofer failed to capture the tracking loops of the ship’s GPS receiver. This is surprising, given the average spoofer power advantage of 9.2 dB above the true signals. We conjecture that the ship’s GPS antenna had lower gain in the low-elevation direction toward the spoofer transmission antenna than did the detector’s antennas. A lower gain would reduce the spoofer power advantage in the ship’s receiver and could explain why the spoofer failed to deceive it.
Many additional spoofing attacks were carried out aboard the ship. The spoofing detector proved finicky. It took quite some time to get the spoofing detection two-antenna system positioned in a sensible place relative to the ship’s GPS antenna so as to be sensitive to nearly the same spoofing signals. In addition, the spoofing detector’s GPS receiver tended to lose lock at the initiation of an attack, prior to signal drag-off. This was likely caused by the large power swings of the received signals due to beating of the true signals against the spoofed signals. This problem went away at higher spoofer power levels. When lock was lost, the software receiver would attempt to re-acquire the signal. Often a reacquisition would succeed only after signal drag-off by the spoofer. Typically, the spoofing detector immediately detected the attack once it had reacquired the spoofed signals that were no longer beating against the true signals due to having been dragged sufficiently far away from them, as in Figure 7. Re-analysis of the recorded data indicated that poor PLL tuning may have caused the losses of lock during the initial attacks. Spoofing detection calculations carried out on the reprocessed data have proved more reliable when implemented with a better PLL tuning.
Two attacks were carried out with only a subset of the visible GPS satellites being spoofed. The first involved spoofing 7 of 9 visible satellites, and the second test spoofed only 4 of 9. The spoofing detection system had trouble maintaining signal lock during the initial part of the first attack. It subsequently reacquired signals and was able to detect the attack successfully after reacquisition. The first attack also succeeded in capturing the ship receiver’s tracking loops as evidenced by spoofing of the yacht to climb off the sea surface. The second attack, with only four spoofed satellites, was not detected by the prototype system, but it succeeded in deceiving the ship’s GPS receiver about its altitude. This latter result indicates a need to modify the detection calculations to allow for the possibility of partial spoofing. In their current form, they assume that all signals are either spoofed or authentic. Of course, in the partial spoofing case it may also be possible to use traditional pseudorange-based RAIM techniques to detect an attack.
Improved detection during pre-drag-off initial phase of attack;
Detection when only a subset of signals are spoofed;
Advanced RAIM techniques;
A real-time prototype of the switched-antenna version;
Detection of a spoofer that uses multiple transmission antennas;
Reacquisition of true signals to recover from a spoofing attack.
Conclusions
A new prototype GNSS spoofing detection system has been developed and tested using live-signal spoofing attacks. The system detects spoofing by using differences in signal direction-of-arrival characteristics between the spoofed and non-spoofed cases as sensed by a pair of GNSS antennas. A spoofing detection statistic has been developed that equals the difference between the optimized values of the negative-log-likelihood cost functions for two data-fitting problems. One problem fits the single-differenced beat carrier phases of multiple received signals to a spoofed model in which the fractional parts of these differences are identical -— in the absence of receiver noise — because the spoofed signals all arrive from the same direction. The other problem fits the single-differenced carrier phases to a non-spoofed model. This second optimal data-fitting problem is closely related to CDGPS attitude determination. The simple difference of the two optimized cost functions equals a large positive number if there is no spoofing, but it equals a negative number if the signals are being spoofed. Monte Carlo analysis of the probability distributions of this difference under the spoofed and non-spoofed assumptions indicates that it provides a powerful spoofing detection test with a low probability of false alarm.
A real-time version of this system has been implemented using USRPs and real-time software radio receivers, and it has been tested against live-signal spoofing attacks aboard a yacht that was cruising around Italy. Successful detections have been achieved in many spoofing attack scenarios, and detections can occur in as little as 0.4 seconds or less. One scenario spoofed the yacht’s GPS receiver into believing that it had veered off of a northwesterly course towards Venice in the Adriatic to a southwesterly course towards the coast of Libya, and at the incredible speed of 900 knots. The spoofing detector, however, warned the crew on the bridge about the attack before the yacht’s spoofed position was 50 meters away from its true position.
The live-signal tests revealed some challenges for this spoofing detection strategy. They occur primarily during the initial attack phase, before the spoofer has dragged the victim receiver to a wrong position or timing fix. If the spoofer power is not much larger than that of the true signals, then beating occurs between the spoofed and true signals during this initial period. This beating can cause difficulties for the receiver tracking loops, making single-differenced carrier phase unavailable. Even when single-differenced phase is available, both the spoofed and non-spoofed models of this quantity can be inadequate for purposes of designing a reliable spoofing detection test.
This article’s new two-antenna spoofing detection system has generated promising real-time results against live-signal spoofing attacks, but further developments are needed to produce a sufficiently reliable detection system for all anticipated attack scenarios. The best defense will likely employ a multi-layered approach that uses the techniques described in this paper along with advanced RAIM techniques that detect additional signal anomalies that are characteristic of spoofing.
Acknowledgments
The authors (brief bios given in online version) thank the owner of the White Rose of Drachs for the loan of his vessel to conduct the live-signal GNSS spoofing detection tests reported here. The crew of the White Rose aided and supported this project in many ways.
Red Team, White Team, Blue Team
Background
Before March 2013, members of the UT Radionavigation Lab and the Cornell GPS Lab didn’t know about gold-plated sinks and spiral staircases at sea. They did know something about spoofing navigation systems and detecting spoofer attacks. The UT group had hacked a helicopter drone at White Sands Missile Range in June 2012, coaxing it to dive towards the ground. The Cornell group had developed a prototype system that could reliably detect all UT Austin attacks, but it was clumsy, having an oscillating antenna and requiring hours of post-processing.
Andrew Schofield, master of the White Rose of Drachs, attended Todd Humphreys’ 2013 South-by-Southwest conference talk on the drone hack and challenged him to go big — bigger than a 1.3-meter drone helicopter. How about a 65-meter superyacht? The result: a summer 2013 Mediterranean cruise that produced intriguing, provocative results.
The UT team had implemented a feedback controller for their spoofer, but they were unable to control the spoofed drone in a smooth, reliable manner. The White Rose cruise offered a chance to test a next level of sophistication: a controlled sequence of lies leading the victim on a precise course selected by the spoofer, different from the one intended by the captain.
The UT team was able to induce inadvertent turns while the ship’s bridge thought it was steering a straight course. They could nudge the yacht onto a wrong course paralleling the desired course. The crew remained unaware of the yacht’s true course because its GPS receiver and GPS-driven charts indicated that she was on her intended route.
The Push for Protection
Andrew Schofield quickly began advocating for a follow-up experiment: a UT Red Team attack against the White Rose GPS and a simultaneous Cornell Blue Team demonstration of real-time spoofing detection.
The Cornell Team, however, faced challenges in transitioning from its initial prototype to a more sophisticated system, one that eliminated the moving parts and that operated in real time. Team members thought they could produce the next system, but had never been quite sure they could make good on their boast.
Development of a second prototype system began with implementation of a new Cornell detection algorithm in Matlab. The first tests of this algorithm involved UT recording and pre-processing of transmissions in an RF chamber that housed the two antennas of Cornell’s second prototype. Cornell applied its new Matlab algorithm to these data and demonstrated off-line spoofing detection.
The remaining hurdle was real-time operation. The original development plan called for translation of the Matlab algorithm to C++ followed by integration with a UT Austin/Cornell real-time software radio. It would be understatement to say that this was an ambitious task for the two-month window that remained until the White Rose cruise.
UT Ph.D. student Jahshan Bhatti steered the team around this hurdle by proposing the direct use of Cornell’s Matlab code in the real-time system. Prior to this, no one had realized that it could be practical to call Matlab from C++ in real time. Mark Psiaki packaged the Matlab spoofing detection software into a single tic function, Jahshan coded the calling C++/Matlab interface, and the team was on track to test spoofing detection in late June 2014.
Spoofer, Detector Clash at Sea
The White Rose would sail from southern France on June 26, setting a course around Italy to Venice. The Cornell Blue Team would have three full days in international waters to demonstrate and evaluate their real-time spoofng detection system. A Ph.D. graduate from UT’s Radionavigation Laboratory would operate the Red Team spoofer, aka the Texas Lying Machine.
In preparation for the voyage, the two teams converged in the White Roses’s home port of Cap-d’Ail. They performed initial shake-down tests of their systems in port. They could not do full live-signal tests in Cap d’Ail because they were still in French territorial waters. Transmission of live spoofing signals in the GPS L1 band is permitted only in international waters, and only if conducted for scientific purposes.
The spoofing and detection tests started in earnest on the morning of June 27 off the southern coast of Italy. The White Rose had passed through the Strait of Messina between Italy and Sicily earlier that day. The initial tests were concerned with antenna geometries and spoofer power levels. Later tests concentrated on serious deception of the White Rose regarding its true course and location.
During the tests, the UT Red team and its spoofer were situated on the White Rose Sun Deck, above and behind the bridge. The Cornell Blue team and its electronics were on the bridge with its two antennas on the roof. A walkie-talkie link between the teams provided coordination of detector operation with spoofing attacks along with feedback about spoofer and detector performance.
Hijacked to Libya!
For the final day of tests, Andrew Schofield suggested sending the spoofed White Rose to Libya as she cruised the Adriatic from Montenegro to Venice — a difference of 600 nautical miles. The target trip time of 50 minutes necessitated a peak speed over 900 knots (1,667 kilometers/hour) after factoring the need to limit initial acceleration and final deceleration; if too large, they might cause the victim receiver’s tracking loops to lose lock and, therefore, the spoofed signals.
The Cornell and UT Austin teams programmed the spoofer for a trip to Libya, and they initiated the attack. The White Rose bridge soon became a scene of excitement. The ship started veering sharply to port, and its velocity vector lengthened until it literally went off the charts. The GPS receiver showed the ship hurrying towards Libya on a collision course with the back of Italy’s boot. The bridge’s GPS receiver displayed speeds that increased through 100 knots, 200 knots, 300 knots — for a yacht with a speed capability of about 15 knots.
The Cornell detector issued a spoofing alert at the onset of the attack, long before the White Rose veered off course. After a few minutes, the detector’s continued successful operation became boring. Of course, boring success is better than exciting failure.
The Cornell system had not been as successful during some of the preceding attacks, and the results from the June voyage suggested avenues for improvement. If new live-signal tests become necessary to evaluate planned improvements, the Red and Blue teams stand ready for a future superyacht cruise.
Mark L. Psiaki is a Professor of Mechanical and Aerospace Engineering. He received a B.A. in Physics and M.A. and Ph.D. degrees in Mechanical and Aerospace Engineering from Princeton University. His research interests are in the areas of GNSS technology and applications, spacecraft attitude and orbit determination, and general estimation, filtering, and detection.
Brady W. O’Hanlon is a graduate student in the School of Electrical and Computer Engineering. He received a B.S. in Electrical and Computer Engineering from Cornell University. His interests are in the areas of GNSS technology and applications, GNSS security, and space weather.
Steven P. Powell is a Senior Engineer with the GPS and Ionospheric Studies Research Group in the Department of Electrical and Computer Engineering at Cornell University. He has M.S. and B.S. degrees in Electrical Engineering from Cornell University. He has been involved with the design, fabrication, testing, and launch activities of many scientific experiments that have flown on high altitude balloons, sounding rockets, and small satellites. He has designed ground-based and space-based custom GPS receiving systems primarily for scientific applications.
Jahshan A. Bhatti is pursuing a Ph.D. in the Department of Aerospace Engineering and Engineering Mechanics at the University of Texas at Austin, where he also received his M.S. and B.S. He is a member of the UT Radionavigation Laboratory. His research interests are in the development of small satellites, software-defined radio applications, space weather, and GNSS security and integrity.
Todd E. Humphreys is an assistant professor in the department of Aerospace Engineering and Engineering Mechanics at the University of Texas at Austin, and Director of the UT Radionavigation Laboratory. He received a B.S. and M.S. in Electrical and Computer Engineering from Utah State University and a Ph.D. in Aerospace Engineering from Cornell University. He specializes in applying optimal estimation and signal processing techniques to problems in radionavigation. His recent focus is on radionavigation robustness and security.
Andrew Schofield is a career Yacht Captain. After completing his degree in Applied Biology and working in the bio-science industry for a year, he left all that behind in 1991 and found a deck hand’s job on a sailing yacht in the Caribbean. Since then he has worked on various yachts in various locations. He has been Captain of the White Rose of Drachs since launch in June 2004. He is President of the Professional Yachting Association, the large yacht professional body, and focuses on the training and certification of crew. In his time at sea GPS has transformed navigation. He feels that the relevance of the work done to detect GPS spoofing cannot be overstated with regard to the safety of life at sea, and he is delighted to have facilitated the voyage during which spoofing detection was proven.
The Institute of Navigation’s (ION) Satellite Division awarded Pratap Misra its Johannes Kepler Award on September 12 at the ION GNSS+ Conference in Tampa, Florida, for his contributions to satellite navigation education, the understanding of GLONASS, and receiver autonomous integrity monitoring.
Misra is credited with tracking GLONASS satellites using the AF Deep Space Tracking Network to determine their orbits in the coordinate frame used by GPS, while the satellites broadcast their positions in the Soviet coordinate frame. Misra is recognized for his ground-breaking work on navigation with combination of GPS and GLONASS signals and is the western world’s leading expert on what’s now the Russian satellite navigation system. He was a technical advisor to the Federal Aviation Administration for many of the bilateral and multi-lateral committees that worked on the development of GPS/GLONASS spectrum sharing and avionics.
Additionally, Misra has worked on receiver autonomous integrity monitoring (RAIM), and contributed a novel approach that does not require the simplifying assumption of Gaussian errors. He was also the first to provide a RAIM algorithm that leveraged the receiver clock to put a bound on the vertical position error. These algorithms are expected to play a significant role in the upcoming multi-constellation environment.
Misra is a research associate professor of Mechanical Engineering at Tufts University, and is well known for the textbook that he co-authored with Professor Per Enge of Stanford University, Global Positioning System: Signals, Measurements and Performance. Misra is a past chair of the ION Satellite Division and has held numerous volunteer positions within ION, most recently focusing on the support of student programs. He is both an ION Fellow (2003) and IEEE Fellow (2007).
The Kepler Award recognizes and honors an individual for sustained and significant contributions to the development of satellite navigation. It is the highest honor bestowed by the ION’s Satellite Division.
“From the reports on GLONASS problems, we have an explanation that may be used in our technical support replies:
“Our analysis reveals the GLONASS integration algorithms skipped an interval of around 1.5 minutes at the control centre software.
“At 21:00 UTC April 1, all GLONASS satellites received an orbit state (ephemeris) which was clearly several minutes ahead of the current orbit shape without actually changing the applicable reference time stamp. In other words, future orbit-position, velocity and accelerations were assigned to a current reference timestamp.
“This led to incorrect orbit positions for all GLONASS satellites and subsequent problems with receiver using GLONASS measurements.
“In our receivers, RAIM rejected the solutions because of the large GLONASS errors, and could only work with GPS only and the recently revised RAIM settings for a Base (SRL,ON,-6,-4,-4).
“The issue is now rectified, and the GLONASS constellation is back to normal.”
Aerospace GNSS receivers constitute a class apart, compared to their more popular relatives used in automotive, cell phone, or survey applications. Automotive and cell-phone receivers can sometimes provide position information even in indoor environments. The survey class of receivers provides centimeter-level accuracies. However, neither group can guarantee the reliability and integrity of the position solution, and users rely upon them at their own risk, and only in non-critical applications.
On the other hand, an aerospace GNSS receiver not only provides decimeter-level accuracy, but it also guarantees that the position error is bounded by an integrity limit. The probability that the position error is more than the integrity limit is very rare: one in ten million times.
Now, isn’t that the best class of GNSS receiver?
A certified aerospace GNSS receiver stands as the keystone of the Federal Aviation Administration’s (FAA’s) ambitious NextGen Aviation program for the United States. The FAA developed NextGen to revolutionize the way an aircraft flies in the U.S airspace. In its June 2013 update report, the FAA states that “NextGen is providing major benefits to the general aviation community. The Wide-Area Augmentation System (WAAS) has improved general aviation access to more than 1,500 airports in all kinds of weather with no costly investment in ground infrastructure.”
According to the report, by the end of the NextGen mid-term in 2020, NextGen improvements will reduce delays by 41 percent from today. The FAA estimates that by 2018, NextGen will reduce aviation fuel consumption by 1.4 billion gallons, reduce emissions by 14 million tons, and save $23 billion in costs. NextGen also has an important safety impact for air travelers.
Tens of thousands of aircraft are already equipped with WAAS receivers, which improve the availability, accuracy, and integrity of GPS signals. Pilots take advantage of WAAS technology to fly approach procedures using Localizer Performance with Vertical Guidance (LPV) to altitudes as low as 200 feet. The FAA has published 3,123 WAAS LPV approaches as of May 2013 and expects to publish 5,218 by 2016.
The key to NextGen is the aerospace GPS-SBAS receiver.
How different are aerospace GNSS receivers from commercially available receivers, including high-precision receivers?
An aerospace GPS-SBAS receiver is characterized by very high reliability, accuracy, and availability. Among these attributes, the reliability factor is the most important parameter. Misleading information from an aerospace receiver should be extremely improbable, since that can lead to hazardous or severe major consequences to the aircraft, its passengers, and flight crew.
Table 1 shows the major differences between a standard GNSS receiver and an aerospace GNSS receiver.
Table 1. Differences between a standard GNSS receiver and an aerospace GNSS receiver.
Performance Requirements
The DO-229D standard document — formally, the RTCA Minimum Operational Performance Standards for GPS/WAAS Airborne Equipment — specifies the minimum performance standards of an aerospace GPS-SBAS receiver. In particular, an aerospace GNSS receiver needs to meet the GPS and SBAS signal processing requirements, GPS and SBAS data/message processing requirements, satellite integrity status requirement, accuracy requirements in presence of interference, dynamic range and sensitivity requirements, and so on, as defined in DO-229D standard.
Most importantly, the receiver must meet the Receiver Autonomous Integrity Monitoring (RAIM) requirements for en-route, terminal, non-precision and precision phases of flight of DO-229D. Additionally, the receiver must meet the fault detection, fault exclusion, missed alert, false alert, step detection, ramp detection, and other integrity-related requirements of DO-229D.
Further, the receiver needs to meet the environmental conditions specified in DO-160 standard for temperature, temperature variation, altitude, humidity, shock, vibration, magnetic effects, voltage spike, EMI/EMC, lightning, and so on.
Safety and Reliability Aspects
A Functional Hazard Assessment (FHA) based on the intended function of the GPS-SBAS receiver software needs to be carried out to determine whether the receiver meets the requirements of hazardously misleading information. The safety and reliability aspects of the receiver are computed through Failure Mode and Effect Analysis (FMEA) and Fault Tree Analysis (FTA). The effects of each failure mode are determined at the system level for each operating mode of the equipment.
RAIM. For an aerospace GPS-SBAS receiver, RAIM is of paramount importance. The measure of protection provided by RAIM is given by Horizontal/Vertical Protection Limits (HPL/VPL). HPL is used as the protection limit for en-route, terminal, and LNAV (Non-precision approach) phases of flight and compared against the Horizontal Alert Limit (HAL) for the phase of flight. Whereas, VPL is compared against the Vertical Alert Limit (VAL) for the LNAV/VNAV and LP/LPV phase of flight.
The most critical part of the integrity requirement is to detect a satellite failure and, if possible, to make corrective actions in addition to generating timely alerts. A Failure Detection and Exclusion algorithm, often known as FD/FDE, is to be implemented in an aerospace GNSS receiver. The effectiveness of the FD/FDE algorithm has to be tested extensively in off-line condition for availability of satellite failure detection and exclusion. Further, the algorithm has to be tested in on-line conditions as well as on a target environment. There has to be a match among the off-line,
on-line, and on-target test results for using the algorithm in
the GNSS receiver.
The integrity tests on an aerospace GNSS receiver are carried out as per the guidelines in DO-229D. This requires simulation of the GPS orbit and determination of satellite visibility at more than two thousands grid points on the Earth surface and for 12 hours at 5-minute time intervals. The FD/FDE algorithm is validated at each space-time point to determine the availability of failure detection and exclusion.
For the non-precision approach, the space-time points are arranged in terms of the HPL values and Horizontal Exclusion Limit (HEL) values and the most difficult to detect/exclude satellite is identified. Extensive Monte Carlo simulations are carried out at the selected space-time points to validate the false alert and missed alert requirements of DO-229D standard. Similar tests are carried out on the GNSS receiver for the precision approach, wherein the VPL values are considered instead of HPL values. Further, the test results of the off-line tests are validated through comprehensive on-line and on-target tests on the selected space-time points.
Certification Aspects
To ensure that the software and the firmware of the aerospace GNSS receiver are robust, providing adequate levels of safety and reliability, the receiver software and firmware need to be developed conforming to the software and hardware design assurance standards — DO-178B and DO-254 respectively. Based on the criticality of the end application, the design assurance should meet DO-178B and DO-254 objectives of Level A, B, or C criticality.
An aerospace GNSS receiver needs to be certified by the FAA (or other competent authorities in other countries) for airworthiness. The FAA gets involved in the certification process right from the planning stage and oversees the compliance of the entire development process as per DO-178B and DO-254 standards. The aerospace GNSS receiver software and firmware undergo extensive verification and validation processes. Further, the GNSS receiver is subjected to all the functional and environmental tests as per DO-229D and DO-160 standards respectively under FAA supervision. Only after the successful completion of all the software, hardware, and systems tests, the receiver is certified by the FAA for airworthiness through Technical Standard Order TSO-C145 Authorization (TSOA).
Conclusion
Aerospace GNSS receivers, by virtue of their inherent safety, reliability, and integrity, are far more suitable for critical applications, where an error could have hazardous or catastrophic consequences. These receivers must be used in commercial transport aircraft, business jets, general aviation aircraft, gliders, experimental aircraft, balloon, and so on. Further, in airport surface vehicles and mass-transport vehicles such as high-speed trains, trams, and unmanned autonomous vehicles of all sorts, whether ground or air, receivers similar to aerospace GNSS receivers should be used for navigation and surveillance purposes.
Jaynata Ray received his Ph.D. from the University of Calgary. He has worked in the GPS field since 1992, and is group manager at Accord Software and Systems in Bangalore, India. He is a member of GPS World’s Editorial Advisory Board.