RoGO Communications, the creator of the DropBlock satellite communications platform for cellular-denied environments, is partnering with Augmented Sense Technologies (AugSense) to integrate artificial intelligence capabilities into RoGO’s communications infrastructure.
RoGO was founded to develop lifesaving technology for wildland firefighters and first responders. It’s product DropBlock is a ruggedized, portable satellite communications platform that provides real-time GPS tracking, weather telemetry, IoT sensor data, and tactical messaging in cellular-denied and remote environments.
The partnership will develop edge AI-powered sensor fusion, Team Awareness Kit (TAK) ecosystem development, and predictive analytics to firefighters, disaster recovery, military and other first responders and remote operators, including All Hazards emergencies such as hurricanes, earthquakes and floods. Last month, RoGO and AugSense presented the combined capabilities at the annual convention for Special Operation Forces (SOF Week) in Tampa.
Wildland firefighters, search-and-rescue teams, and military personnel routinely operate in remote terrain where conventional communications infrastructure does not exist. RoGO’s DropBlock technology has proven its ability to deliver real-time GPS tracking, weather data, IoT sensor telemetry, and tactical messaging over satellite links in these environments—deployed today by wildland fire agencies. As missions grow more complex and sensor-rich, operators increasingly need more than raw data. AI can deliver intelligence at the edge, delivered in real time, without dependence on connectivity.
Through this partnership, RoGO will enhance its platform with AugSense’s edge AI engine, a modular, platform-agnostic system that processes and fuses multi-modal sensor data directly on devices, without requiring a cloud connection. The AI-enriched intelligence products will transform raw sensor feeds into actionable decisions, such as predictions for the spread of a wildfire or other threats to safety.
Edge AI Capabilities
Edge AI Processing: AugSense’s engine runs AI workloads directly on edge devices using neuromorphic and spiking neural network architectures, achieving greater energy efficiency than conventional approaches. This means intelligence processing in power-constrained environments — no cloud, no data center, no latency.
Multi-Modal Sensor Fusion: AugSense’s fusion engine synthesizes data from diverse sensors (RF, weather, geospatial, physiological, and chemical/biological) into a single actionable intelligence picture at the edge.
TAK Integration & Development: Purpose-built plugins for the Android Team Awareness Kit (ATAK) and broader TAK ecosystem that overlay AI-fused intelligence onto the common operating picture, enhancing coordination across distributed teams connected through RoGO’s DropBlock network.
Predictive Analytics: Machine learning models that transform raw sensor telemetry into forward-looking predictions such as anticipating weather shifts, equipment failures, threat patterns, and fire behavior.
Immediate Applications
The combined solution targets several high-impact use cases.
In wildland firefighting, the integration enables AI-predicted wind shifts and fire behavior models to reach incident commanders via RoGO’s satellite network—critical for crew safety decisions.
For search-and-rescue operations, fused sensor data and intelligent mapping overlays allow distributed teams to coordinate effectively through the DropBlock network without relying on cellular infrastructure.
In defense and special operations, the partnership delivers fused multi-sensor intelligence and TAK-integrated common operating pictures over satellite backhaul in contested and communications-degraded environments.
A new RoGO mobile phone app coming in the third quarter enables point-to-point communications among DropBlocks and firefighter crews and displays the location of firefighting assets along with fire weather data.
February’s column focused on potential errors in orthometric heights using a digital barcode leveling system with multi-piece leveling rods. As stated in the column, businesses need to make decisions based on expenses and ultimately on the profit margin; but making a business decision that results in a bad technical outcome is never the right decision. This newsletter column is going to highlight a new feature in the National Geodetic Survey (NGS) Beta OPUS Projects 5.1 routine permitting the use of RTN vectors to support the development of the 2022 Transformation model.
On Jan. 12, NGS held a webinar titled “Using RTN Data in OPUS Projects 5 for GPSonBM.” Users can download the video and PowerPoint slides here.
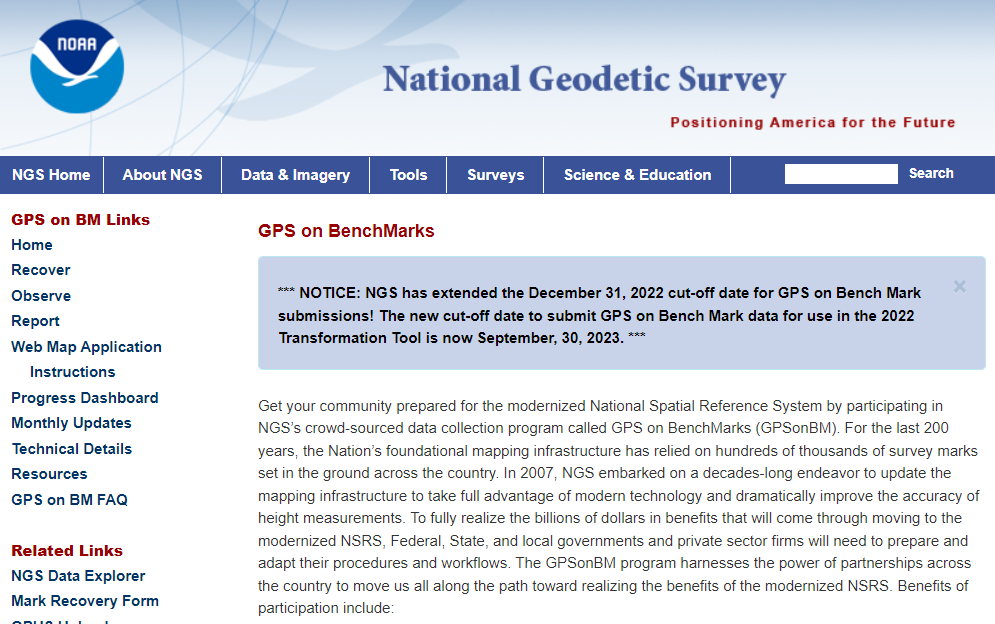
I’ve been highlighting NGS’s GPS on Bench Mark program that supports the 2022 Transformation Tool in my columns since 2018. NGS delayed the completion date for the new modernized NSRS until 2025, so they have extended the cut-off date for submitting GPS on Bench Mark data for use in the 2022 Transformation Tool until Sept. 30.
NGS GPS on BenchMarks Program (Image: NGS website)
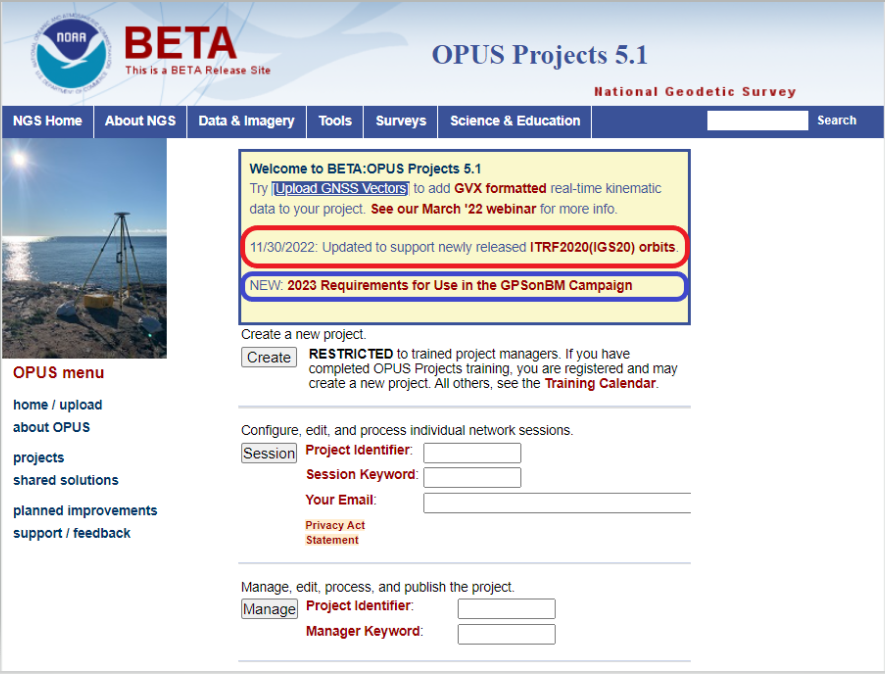
NGS has been developing tools that facilitate submitting data to the NGS GPS on BM campaign such as OPUS Share. The latest tool is the OPUS Project 5.1 routine that allows the use of RTN vectors. OPUS Projects 5.1 is a beta product, but NGS is now allowing users to use the routine to submit data for the GPS on BM campaign. My October 2021 column highlighted NGS’s Beta OPUS Projects 5.1.
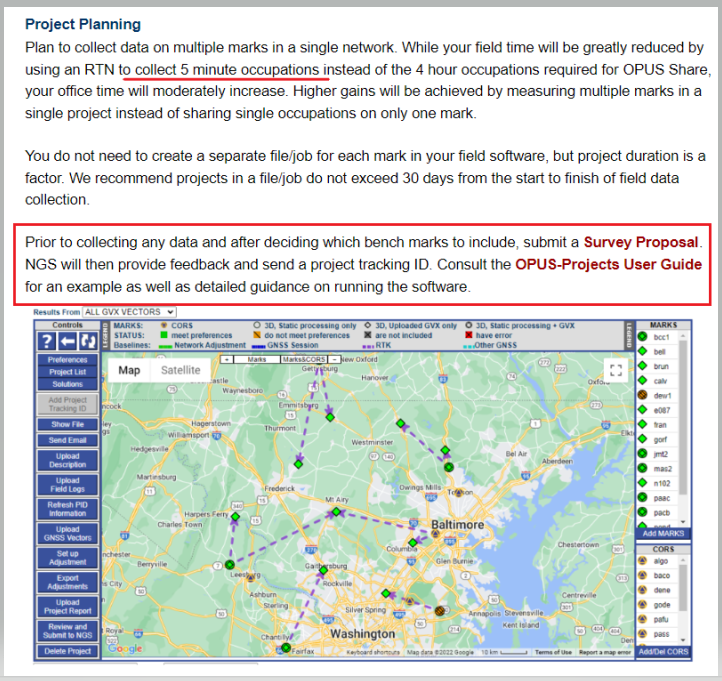
The 2023 requirements for using OPUS Projects in the GPS on BM program (Image: NGS website)
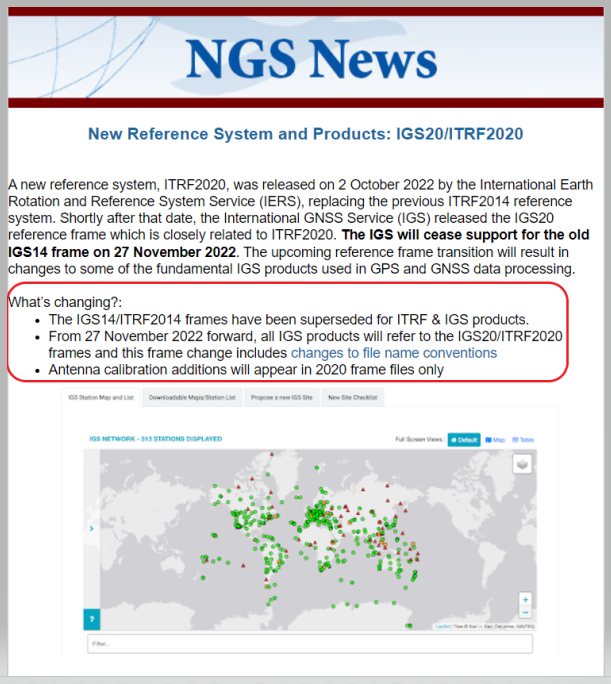
I’d like to note that OPUS has been updated to support the newly released ITRF2020 (IGS20) orbits. My October 2022column discussed the latest International Terrestrial Reference Frame of 2020 (ITRF2020) released by the International Earth Rotation and Reference System Service (IERS). A previous NGS news bulletin provided a statement about the new reference system and products.
Clicking on the link titled “NEW: 2023 Requirements for Use in the GPSonBM Campaign” on the OPUS Projects 5.1 webpage provides the requirements for using OPUS Projects 5.1 and Real-Time Network (RTN) data to support the 2022 Transformation Tool; that is the 2023 GPS on BM campaign. There are five sections in the writeup: Introduction, Project Planning, Equipment and Configuration, Field Requirements and Office Requirements. The Introduction section states that the requirements are limited to the GPS on BM Campaign and will be replaced, or superseded, when NGS finishes its new GNSS surveying specifications.
Introduction Section from Requirement Write Up (Image: NGS website)
The project planning section of the announcement states that RTN vectors of 5-minute occupations can be used instead of the 4-hour occupations required for OPUS Share.
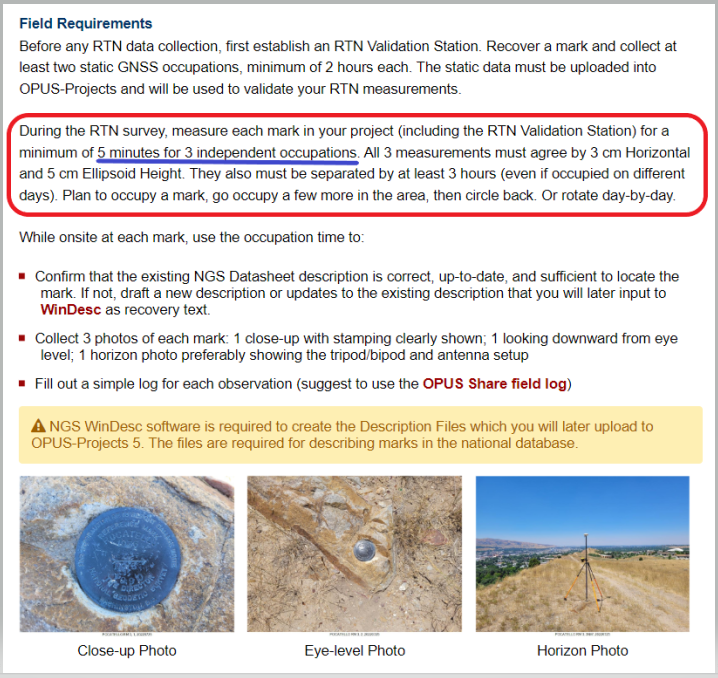
However, the Field Requirement section states that the mark must be occupied three different times.
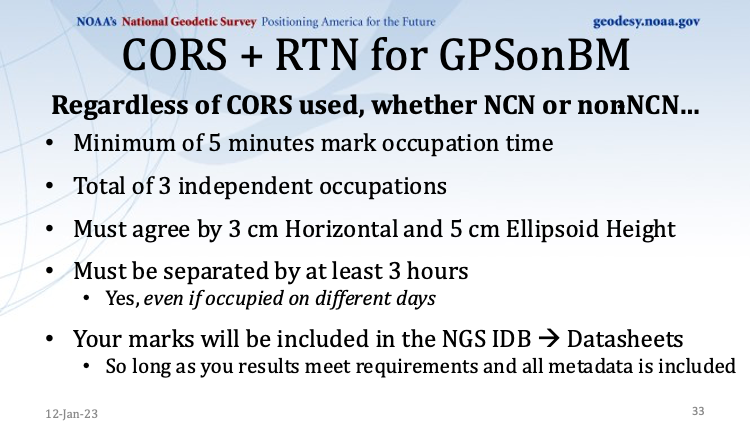
“During the RTN survey, measure each mark in your project (including the RTN Validation Station) for a minimum of 5 minutes for three independent occupations. All three measurements must agree by 3 cm horizontal and 5 cm ellipsoid height. They also must be separated by at least 3 hours (even if occupied on different days). Plan to occupy a mark, go occupy a few more in the area, then circle back. Or rotate day-by-day,” the section states.
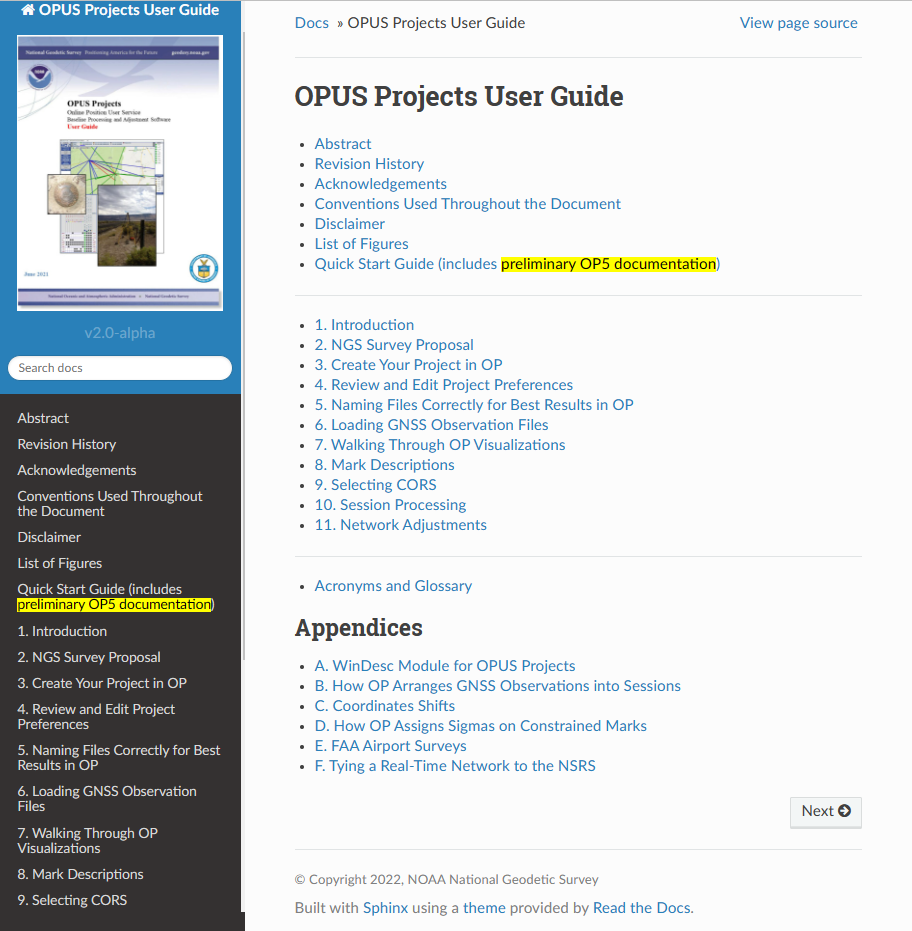
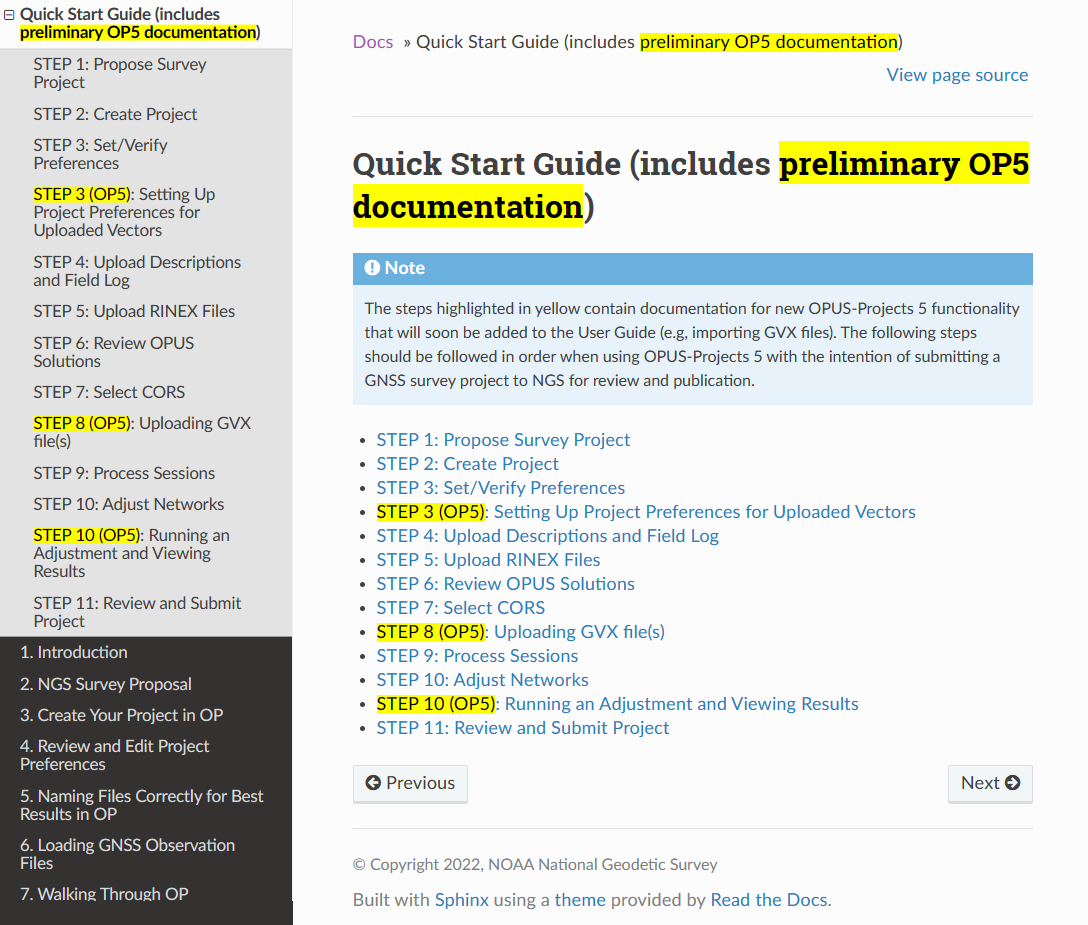
As stated in the section on office requirements for using OPUS-Projects 5 in the 2023 GPS on BM Campaign writeup,“The OPUS-Projects User Guide provides instructions on how to run the software and submit a project to NGS. The User Guide states to follow the steps in the order listed below, and it explains steps 1 – 7 and 9 – 11 in detail. For step 8 and when including GVX data in OPUS-Projects 5, refer to those portions of the User Guide’s Quick Start which are highlighted in yellow. NGS is working on fully updating the User Guide to include more details; for now, use the Quick Start Guide for assistance with GVX.”
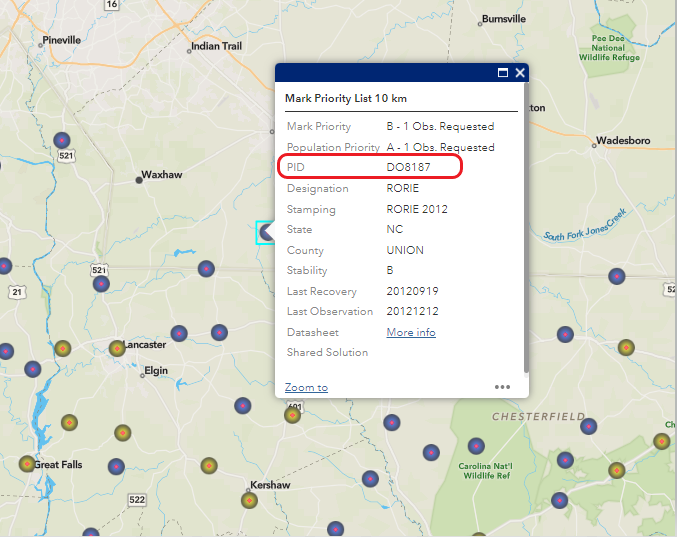
I recently used OPUS Projects to analyze some GNSS results using Harris-Galveston Subsidence District CORS and PAMS GNSS data. I want to emphasize that it may seem like a lot of work the first time you use the routine, but NGS makes it fairly simple to complete each task. The manual is very complete and does a good job of describing every step. The manual can be downloaded here. In my experience, the most time-consuming task is creating the descriptions. There are several items that must be correctly entered because the answer to some entries affect the answers to other entries. That said, NGS supports a description entry software called WinDesc that facilitates entering the appropriate information. The OPUS Projects User Guide provides an appendix that describes using the WinDesc module to enter description metadata.
For marks that are in the NGS database, known as the NGS Integrated Data Base (NGSIDB), WinDesc will import information from NGSIDB, thereby decreasing the number of entries users need to address. In other words, if the mark has a PID then it should be in the NGSIDB. If you are occupying a mark that is part of NGS GPS on Bench Marks website then it probably has a PID and a description in NGSIDB.
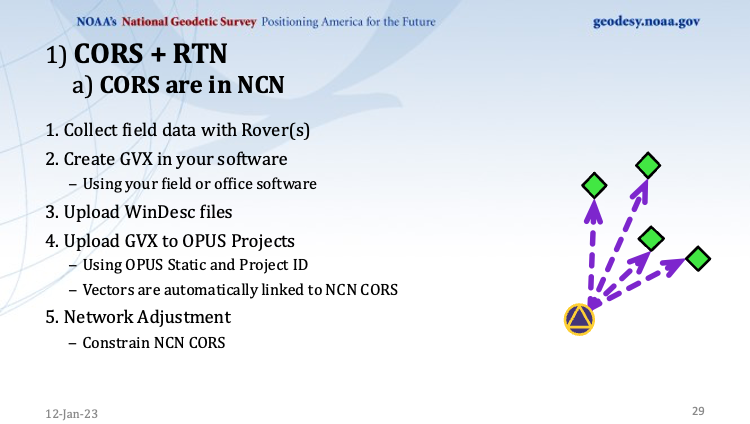
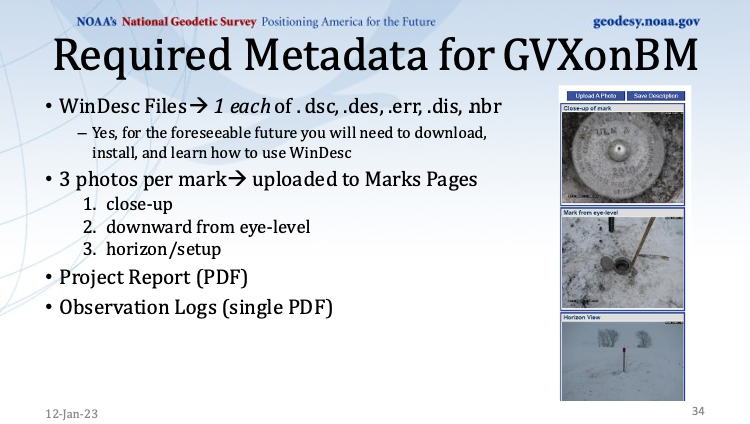
I’ve included three slides from the Jan. 12 webinar that summarize the basic requirements.
This slide is a depiction of how a CORS station must be connected to the RTN vectors. (Image: NGS website)
This slide provides the occupation and precision requirements. (Image: NGS website)
This slide provides a list of the required metadata for the project. (Image: NGS website)
As for the requirement of at least three independent RTN occupations on different times, in my opinion at least one occupation should be on a different day. My October 2021 column addressed a study that reported on using RTN solutions to estimate accurate horizontal and vertical coordinates.
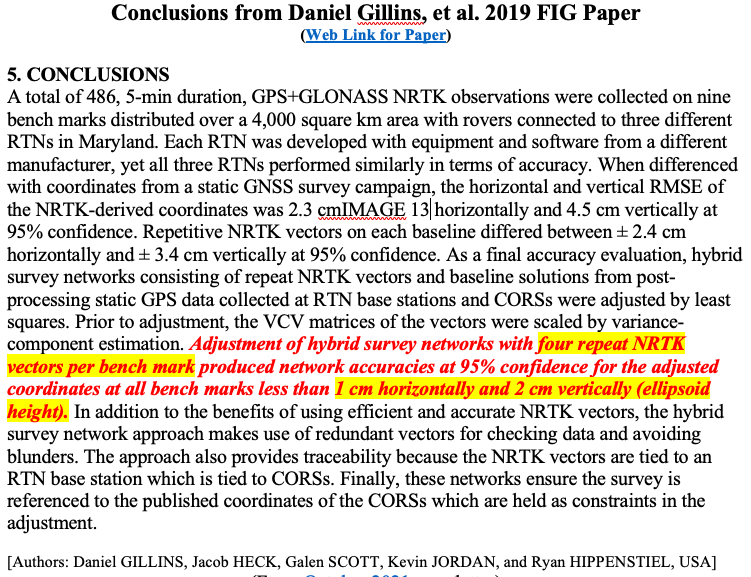
The report stated, “When differenced with coordinates from a static GNSS survey campaign, the horizontal and vertical RMSE of the NRTK-derived coordinates was 2.3 cm horizontally and 4.5 cm vertically at 95% confidence. Repetitive NRTK vectors on each baseline differed between ± 2.4 cm horizontally and ± 3.4 cm vertically at 95% confidence.”
The report also stated, “Adjustment of hybrid survey networks with four repeat NRTK vectors per bench mark produced network accuracies at 95% confidence for the adjusted coordinates at all bench marks less than 1 cm horizontally and 2 cm vertically (ellipsoid height).”
The requirements are limited to the GPS on BM Campaign and will be replaced, or superseded, when NGS finishes its new GNSS surveying specifications.
(Image: Screenshot of Accuracy of GNSS Observation from Tree Real-Time Networks in Maryland, USA)
The paper by Gillins, et. al was presented at the 2019 FIG Working Week held in Hanoi, Vietnam, on April 22–26, 2019. The International Federation of Surveyors (FIG), involves a wide range of professional fields within the international surveying community; this includes surveying, cadastre, valuation, mapping, geodesy, hydrography, and geospatial and provides an international forum for discussion and development to promote professional practice and standards. FIG meetings are held all over the world. I’d like to highlight that the 2023 FIG Working Week is going to be held in Orlando, Florida, on May 28 – June 1, 2023.
NGS will be presenting a full-day worth of content on NSRS Modernization during the FIG Working Week 2023. For the first time in more than 20 years, this annual FIG gathering will take place in the United States, hosted by the National Society of Professional Surveyors (NSPS).
I’ve participated in several FIG meetings. I’ve learned a lot from presentations as well as holding hallway meetings with experts from the international surveying and mapping community. All geospatial users should plan on attending this event. I have provided information about the FIG commissions in my August 2021 newsletter. I would encourage everyone to visit the FIG website and review the information about the 2023 FIG Working Week. The a list of the FIG Commissions can be found here. More information can be obtained on each commission by clicking on its title.
Future columns will highlight the FIG Working Week as the agenda is developed. I would encourage everyone to check NGS’s Website for updates on Beta products and new surveying specifications. Geospatial users should also subscribe to NGS’s News Services at the following here. Check out the NGS News Services site for what’s available.
The new platform is designed to provide fresh data on nearly every road across the U.S. at a reduced cost
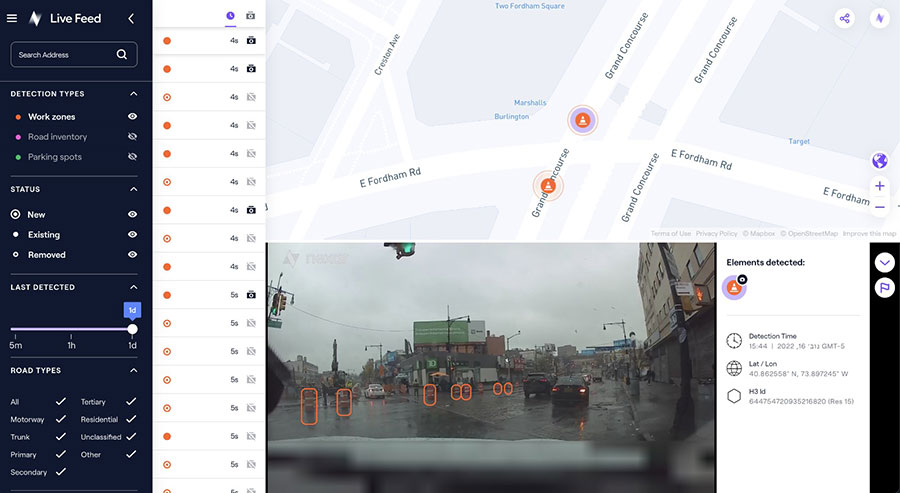
Nexar, an artificial-intelligence (AI) computer vision company, has released CityStream Live, a real-time mapping platform.
CityStream Live enables the mobility industry, including connected vehicles, maps, mobility services, digital twins or smart city applications, to access a continuous stream of fresh, crowdsourced road data. Only with real-time data can vehicles really know what’s coming their way, react to varying speed limits, avoid work zones, find parking and someday drive themselves. Thanks to Nexar’s massive network of “eyes on the road,” edge AI and change-detection capabilities, CityStream Live is already available to industry design partners.
Today’s digital maps often fall short of the freshness and precision that software-driven auto OEMs, autonomous vehicles, and mobility players require. Standard mapping methods — SD, HD and traffic maps — fail to provide accurate, up-to-date and cost-effective solutions, Nexar said.
To solve this problem, CityStream Live provides real-time mapping technologies at the edge of the network, enabling detection of work zones, road sign changes, potholes and free parking spaces. The platform is designed to provide fresh data on nearly every road across the United States at a dramatically reduced cost.
CityStream Live uses a crowdsourcing network and edge AI software to provide developers with a live data feed to increase situational awareness, enhance driving capabilities, increase safety, add comfort and help solve everyday mobility challenges.
More than 700,000 vehicles are in in Nexar’s camera network, which captures 94% of U.S. roads each month. Nexar collects 3 billion miles of road vision data per year.
A free trial version of CityStream Live can be accessed here.
Hexagon’s Safety, Infrastructure & Geospatial division announced the addition of artificial intelligence to HxGN Connect, Hexagon’s real-time incident center as a service solution.
HxGN Connect provides crime and operations centers with real-time views of different data sources, collaboration channels to coordinate across teams and the ability to add new participants and channels as needed. The AI capabilities autonomously analyze diverse data types from incidents, assets, cameras, units, alarms and more, issuing proactive notifications and alerts based on observed trends and deviations.
Having access to diverse information and intelligence in real-time enables police, emergency management, transportation and other organizations to evaluate a situation and deploy resources faster, while continuing to coordinate and dynamically respond as situations change.
“Some organizations operate in silos, without access to data or the ability to act on it,” said Kalyn Sims, Chief Technology Officer, Safety & Security, Hexagon’s Safety, Infrastructure & Geospatial division. “[HxGN Connect] breaks down silos within departments and across jurisdictions, and it mines data in real-time to deliver insights. The result is quicker and better responses to incidents and emergencies.”
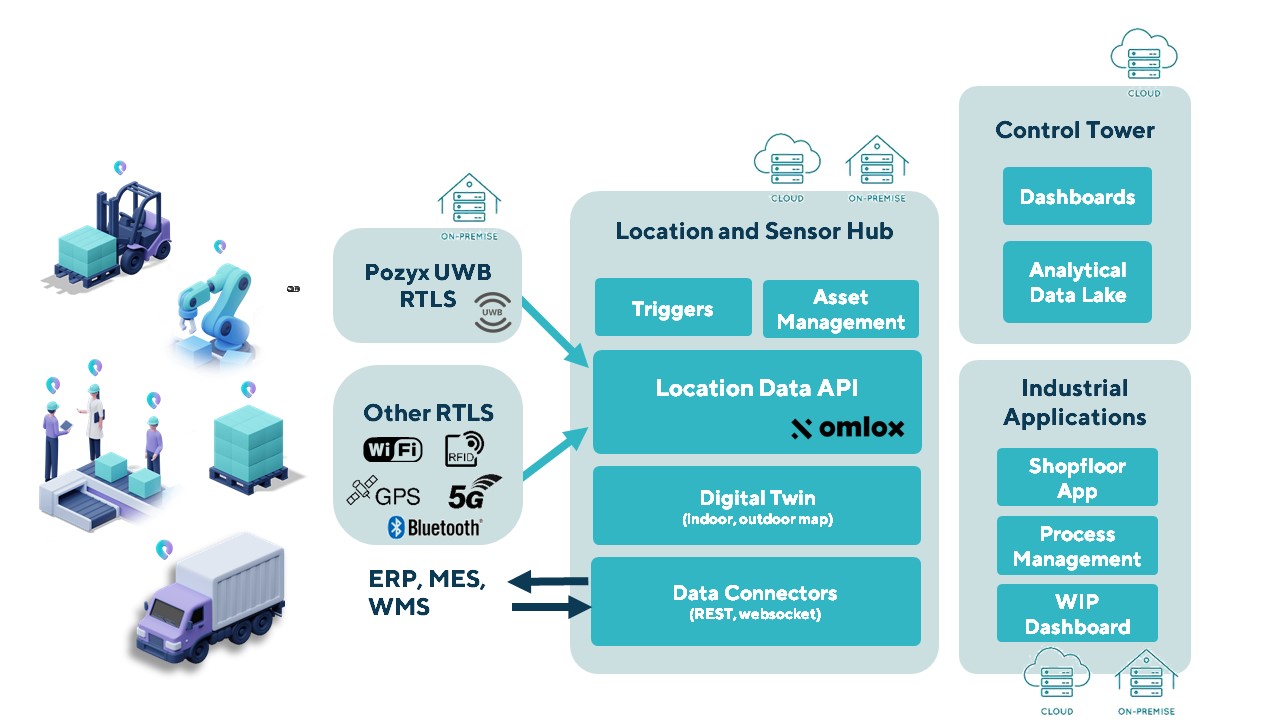
The Pozyx Platform is an asset tracking and identification solution for seamless indoor and outdoor tracking, based on the omlox hub and supporting multiple location technologies.
The omlox hub is an open standard for real-time location systems (RTLS) that combines location data from GPS, ultra-wideband, 5G, radio-frequency identification, Wi-Fi and Bluetooth.
The Pozyx Platform offers a seamless indoor/outdoor transition with zoom-in from a worldwide map to a detailed indoor map, showing highly accurate locations up to 10 cm. It is designed for smart manufacturing, providing a supply-chain solution that supports Industry 4.0.
It tracks and identifies any asset, providing real-time data to facilitate warehouse and inventory control, keep track of critical tools, and slash lost asset costs.
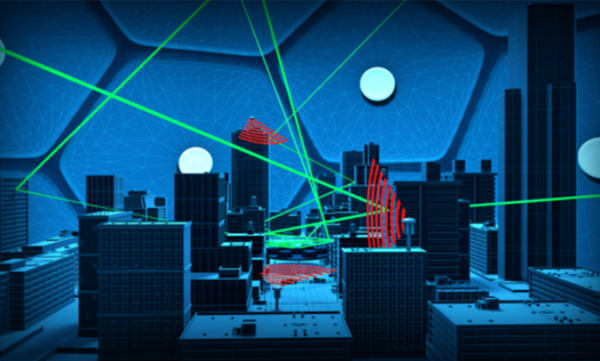
Spirent Federal Systems, a PNT simulation company, offers its government customers and contractors a unique solution for anechoic-chamber-based CRPA testing: a patented “zoned chamber” approach using multi-output, multi-constellation GNSS signal simulators to emulate the movement of satellites in orbit.
To address the limits of a standard anechoic chamber, Spirent has created independent zones configured to represent the real-world sky view, using genuine constellations and improved satellite azimuth and elevation arrival angles. Test scenarios can be multi-constellation and multi-frequency with customizable time, date and duration — now lasting hours instead of minutes.
Because scenarios are valid for longer time periods without sacrificing realism, the zoned chamber is effective for validating all aspects of the CRPA system including beamforming, null steering and space-frequency adaptive processing/space-time adaptive processing (SFAP/STAP). CRPA systems with inertial sensors can be tested with static and dynamic scenarios using a positioner within the chamber.
Additionally, to account for multipath and signal obscuration, Spirent has integrated a 3D environment modeling tool which generates all the variables of a multipath-rich environment in real time, including ground reflection. Interference sources such as jammers and spoofers can be added anywhere in the chamber and concurrently simulated with the GNSS signals. Authorized users can also test classified RF signals such as MNSA M-code and Y-code.
“Spirent Federal’s goal is to get new technologies to U.S. warfighters at a speed that outpaces near-peer threats,” said Jeff Martin, vice president of Sales. “The realism of our patented zoned chamber allows advanced CRPA systems to be deployed faster with confidence they will perform in GPS-contested environments.”
Illustration of a simulated test environment incorporating GNSS, multipath and jamming in a Spirent zoned chamber. (Image: Spirent Federal)
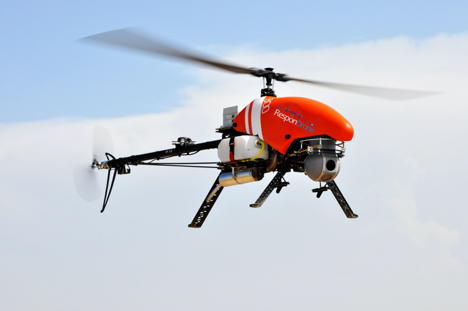
Emergency response providers participating in a Design Thinking workshop organized by the ResponDrone Project have indicated that they would like to use drones to gather and distribute crucial information and provide communication networks in disaster areas.
Preliminary results from the workshop, held in Thessaloniki, Greece, in November, indicate that first responders view the constant provision of real-time information in crisis situations as one of the most valuable benefits arising from using drones in disaster management missions.
The results of the Design Thinking workshop will be presented and discussed with the ResponDrone consortium at the project’s General Assembly, which will take place on Dec. 10–12 in Paris.
ResponDrone is an international project co-funded by the EU and the Korean government, which aims to develop an integrated solution for first responders to easily operate a fleet of drones for multiple synchronized missions to enhance their situation assessment capacity and their own protection.
The workshop, attended by representatives from first-responder organizations and industry partners of the ResponDrone consortium, took place to assess the best possible system requirements.
The aim of the ResponDrone project is to develop and evaluate a situation awareness system for first responders in emergency situations. The system will provide crucial information and communication services to all relevant stakeholders in a disaster situation.
First responders said they would like the ResponDrone system to:
provide reliable and validated real-time information
be flexible and open to information from already existing data sources
be able to visualize different information layers in a customizable manner
be fast and easy to deploy
be able to provide near future predictions regarding the development of the disaster situation.
Workshop participants included regional and national authorities in charge of first response, state agencies responsible for carrying out on the ground first response actions, rescue services and fire departments from Greece, France, Armenia, The Netherlands, Latvia, Bulgaria and Israel.
According to the first responders, a disaster can initially be described as a black box, which needs to be opened. Gathering relevant and reliable information from the disaster area and combining it with already available data, as well as rapid distribution of information to all relevant stakeholders, are the top priorities in disaster management.
The deployment of drones as a means of enabling the afore-mentioned capabilities seems to be a promising approach. It is crucial that the data gathered by drones is presented to the right people as soon as possible, preferably in real time.
“The workshop clearly showed the urgent need for the constant provision of real time information,” said ResponDrone project coordinator Max Friedrich from the German Aerospace Center (DLR).
“First responders wish to receive real-time data on current occurrences in the disaster area, on the position and status of potential victims and the first response units deployed in field, as well as the status and current location of available resources.”
Friedrich added that the ResponDrone system would be designed to provide highly accurate real-time information. The flexible system would gather information from various data sources and should be designed for fast and easy deployment.
ResponDrone has already begun developing an integrated solution for first responders to easily operate a fleet of drones with multiple synchronized missions to enhance their situation assessment capacity and their own protection. This system of systems will simplify and accelerate situation assessment and sharing, decision making and operations management, while requiring only a small crew to operate it.
Esri has released a new web browser application, allowing users to create reporting dashboards that use charts, gauges, maps and other visual elements to reflect the status and performance of people, services, assets and events in real time.
Using dynamic dashboards through Operations Dashboard for ArcGIS, organizations of all types — from emergency operations centers to public utilities — can view crucial activities and key performance indicators that are vital to meeting their objectives.
“The Chicago Office of Emergency Management and Communication [OEMC] GIS team has been using Operations Dashboard to support various events with access to real-time information,” said Joe Kezon, GIS manager for the Chicago OEMC. “We are looking forward to the enhancements that will further increase our ability to ensure the safety and security of the City of Chicago.”
With an easily accessible web app, executives can monitor their organizations’ activities to assess what is working well and what needs attention.
“The Emergency Management division of the Chicago Office of Emergency Management and Communications works very closely with our public safety partners and the city’s infrastructure departments in our comprehensive approach to event and incident management,” said Thomas Sivak, deputy director, Emergency Management, Chicago OEMC. “The Operation Dashboard allows us to effectively coordinate among agencies and adjust resources to make Chicago a safe place to live, work, and play.”
Having this type of authoritative data allows decision-makers to reduce the risk of costly errors due to inaccurate or outdated information, better control the allocation of resources, maintain real-time awareness of where assets and human resources are located, monitor conditions live such as weather and traffic, and achieve real-time insight to respond to changing conditions.
“The new Operations Dashboard web app enables, at a glance, decision-making better than ever,” said Jeff Shaner, Esri product manager. “Not only can dashboards be authored online — anywhere, at any time — but the common platform allows greater collaboration among personnel.”
Operations Dashboard also provides a common interface to monitor progress and identify vulnerabilities that could compromise the success of an organization’s mission. Dashboards can be authored completely in a web browser. There is no need to download and install an app anymore.
Users can launch Operations Dashboard by using their ArcGIS organizational account. They can also browse and manage dashboards within their ArcGIS organizational content or on the dashboard home page.
Hexagon AB has acquired Luciad, a Belgian-based software company specializing in the visualization and analysis of real-time geospatial information.
Luciad’s visualization technologies support live connections to dynamic sensor feeds in a 3D environment. The result is a 5D digital reality — real-time, rapid fusion of multi-source content and the ability to perform analytics on-the-fly.
These intuitive command and control systems benefit all kinds of applications, from public safety to smart cities to defense and intelligence, enabling users to make critical decisions based on changing information in real time.
“This acquisition strengthens Hexagon’s ability to deliver smart digital realities, enhancing our Smart M.App platform with 3D, 4D (real-time sensor feed integration) and 5D (dynamic analytics) capabilities,” said Hexagon president and CEO Ola Rollén. “The ability to rapidly integrate sensor data in a visually compelling environment provides the geospatial location intelligence and situational awareness necessary for mission critical operations.”
Luciad has more than 100 highly-skilled professionals in eight countries, with 100,000 users of its technology globally.
Luciad will be fully consolidated as of today, operating within Hexagon’s Geospatial division. The company’s turnover for 2016 amounted to 16 MEUR.
Esri President Jack Dangermond describes the value of GIS at the plenary session of the Esri UC.
“Maps are alive,” declared Jack Dangermond, Esri founder and president, on the plenary stage at the world’s largest GIS event. The 38th annual Esri User Conference is taking place July 10–14 at the San Diego Convention Center.
We are on the cusp of a data and information explosion, Dangermond explained while introducing the conference theme “The Science of Where.”
“We are about to launch in to a different scale,” he predicted. GIS is changing rapidly with numerous new information streams and advances in real-time data, and maps are central to understanding our changing world. GIS provides a platform for managing, analyzing and applying that data and information, he said.
His advice? “Share, collaborate. Communicate so we collectively can learn all bout world. Let’s take our work collectively to scale.”
GIS is vital to understanding developments in numerous areas: population growth, climate change, social changes, natural disasters and political polarization, to name a few. “We have to do everything we can to better understand and form collaborations to address these areas,” he said.
“Today’s businesses and governments require new ways of thinking,” said Dangermond. “Our users are leading the charge, using mapping and analytics to empower digital transformation, accelerate understanding of big data, and democratize technology. It is an inspiration to see how so many different organizations are applying the science of geography and the technology of GIS to gain insight into their data and reveal hidden patterns and spatial relationships.”
Dangermond presented numerous examples of organizations using GIS in new ways. For instance, Oak Ridge National Laboratory has created an “energyshed” map similar to a watershed map. An orchard is using GIS and GPS tracking to collect data on cherry picking. The Democratic Republic of Congo is making use of crowdsourcing to generate maps.
Story Maps are aiding what Dangermond calls “geo-journalism,” telling stories about new developments in virtually every field.
A screenshot of “Washington’s Ice Age Floods” story map from the Washington Geological Survey.
Dangermond also presented the following awards:
Ice Age Floods, by the Washington Geological Survey, won Best Story Map.
The GIS Digital Transformation Award went to Abu Dhabi, which “has taken GIS to new frontiers” in every government agency with every citizen, Dangermond said.
The Enterprise GIS Award went to the U.S. National Geospatial-Intelligence Agency for maintaining the largest GIS database in the world, with daily updates and a user-friendly portal.
The President’s Award, chosen personally by Dangermond, was given to the United Parcel Service (UPS), which saves up to $400 million a year with its location-enabled Orion system. It puts the ability to update maps in the hands of supervisors, who constantly are optimizing routes. Now deployed in the U.S., the Orion system is going worldwide.
Other speakers and their topics at the first-day plenary included:
Renowned author and theoretical physicist Geoffrey West — His book Scale: The Universal Laws of Growth, Innovation, Sustainability, and the Pace of Life in Organisms, Cities, Economies, and Companies, explores dynamic growth and the challenges of achieving that growth sustainably.
Oakland County, Michigan — Making government services more cost-effective
Chesapeake Conservancy — Analyzing imagery and sensor data to protect watershed areas
Taylor Shellfish Farms — Transforming the family-run business by implementing cloud GIS solutions so staff can perform spatial data collection in the field
Severe Trauma Air Rescue Service (STARS), Calgary, Canada — Powering real-time decision support systems to improve emergency services
Smart Dubai — Empowering one of the smart cities of the future with citizen engagement and smart growth
Walt Disney Animation Studios — Behind the scenes of Zootopia.
GIS provides the means for users to apply “the Science of Where” everywhere, according to Esri President Jack Dangermond. (Photo: Esri)
“Maps are alive,” declared Jack Dangermond, Esri founder and president, on the plenary stage at the world’s largest GIS event. The 38th annual Esri User Conference is taking place July 10–14 at the San Diego Convention Center.
We are on the cusp of a data and information explosion, Dangermond explained while introducing the conference theme “The Science of Where.”
Esri President Jack Dangermond describes the value of GIS at the plenary session of the Esri UC. (Photo: GPS World)
“We are about to launch in to a different scale,” he predicted. GIS is changing rapidly with numerous new information streams and advances in real-time data, and maps are central to understanding our changing world. GIS provides a platform for managing, analyzing and applying that data and information, he said.
His advice? “Share, collaborate. Communicate so we collectively can learn all bout world. Let’s take our work collectively to scale.”
GIS is vital to understanding developments in numerous areas: population growth, climate change, social changes, natural disasters and political polarization, to name a few. “We have to do everything we can to better understand and form collaborations to address these areas,” he said.
“Today’s businesses and governments require new ways of thinking,” said Dangermond. “Our users are leading the charge, using mapping and analytics to empower digital transformation, accelerate understanding of big data, and democratize technology. It is an inspiration to see how so many different organizations are applying the science of geography and the technology of GIS to gain insight into their data and reveal hidden patterns and spatial relationships.”
Dangermond presented numerous examples of organizations using GIS in new ways. For instance, Oak Ridge National Laboratory has created an “energyshed” map similar to a watershed map. An orchard is using GIS and GPS tracking to collect data on cherry picking. The Democratic Republic of Congo is making use of crowdsourcing to generate maps.
Story Maps are aiding what Dangermond calls “geo-journalism,” telling stories about new developments in virtually every field.
A screenshot of “Washington’s Ice Age Floods” story map from the Washington Geological Survey.
Dangermond also presented the following awards:
Ice Age Floods, by the Washington Geological Survey, won Best Story Map.
The GIS Digital Transformation Award went to Abu Dhabi, which “has taken GIS to new frontiers” in every government agency with every citizen, Dangermond said.
The Enterprise GIS Award went to the U.S. National Geospatial-Intelligence Agency for maintaining the largest GIS database in the world, with daily updates and a user-friendly portal.
The President’s Award, chosen personally by Dangermond, was given to the United Parcel Service (UPS), which saves up to $400 million a year with its location-enabled Orion system. It puts the ability to update maps in the hands of supervisors, who constantly are optimizing routes. Now deployed in the U.S., the Orion system is going worldwide.
UPS took home the President’s Award for innovative use of GIS. (Photo: Esri)
Other speakers and their topics at the first-day plenary included:
Renowned author and theoretical physicist Geoffrey West — His book Scale: The Universal Laws of Growth, Innovation, Sustainability, and the Pace of Life in Organisms, Cities, Economies, and Companies, explores dynamic growth and the challenges of achieving that growth sustainably.
Walt Disney Animation Studios — Behind the scenes of Zootopia. (Read more here.)
Oakland County, Michigan — Making government services more cost-effective
Chesapeake Conservancy — Analyzing imagery and sensor data to protect watershed areas
Taylor Shellfish Farms — Transforming the family-run business by implementing cloud GIS solutions so staff can perform spatial data collection in the field
Severe Trauma Air Rescue Service (STARS), Calgary, Canada — Powering real-time decision support systems to improve emergency services
Smart Dubai — Empowering one of the smart cities of the future with citizen engagement and smart growth.
Mobileye, a developer of vision and data analysis for Advanced Driver Assistance Systems (ADAS) and autonomous driving, has introduced a new mapping technology development called Road Experience Management (REM).
REM enables crowd-sourced real-time data for precise localization and high-definition lane data that forms an important layer of information to support fully autonomous driving.
Mobileye is engaged with General Motors to integrate REM into existing program launches in an expedited timeframe, as part of GM’s heightened partnership with Mobileye. In addition, on Jan. 5, Mobileye signed a Memorandum of Understanding with Volkswagen and announced a strategic partnership to explore and integrate REM into Volkswagen’s fleet.
The technology is based on software running on Mobileye’s EyeQ processing platforms that extracts landmarks and roadway information at extremely low bandwidths, approximately 10 kb per kilometer of driving. Additionally, backend software running on the cloud integrates the segments of data sent by all vehicles with the on-board software into a global map.
“We leveraged advanced artificial intelligence, used for creating environmental models from camera input, in order to create maps based on local coordinate systems while requiring very low bandwidth,” said Prof. Amnon Shashua, co-founder, chairman and Chief Technology Officer of Mobileye. “The low bandwidth of the model, and the fact that it requires only a camera, which is already available in most new car models as part of the trend towards growing driver assistance deployment, enables the map creation and update to be managed by a cooperative crowd sourcing mechanism.”
A third OEM customer of comparable size is expected to be announced later this year.
Shashua discussed the future of autonomous driving and road mapping at the Consumer Electronics Show in Las Vegas in January.