Tag: sea level

  • Sentinel-6 sea-level mission to use GNSS-RO for weather and climate monitoring

    Sentinel-6 sea-level mission to use GNSS-RO for weather and climate monitoring

    To get the best measurements of Earth’s atmosphere, you sometimes have to leave it. This November, the Sentinel-6 Michael Freilich spacecraft will do just that.

    News from the Jet Propulsion Laboratory

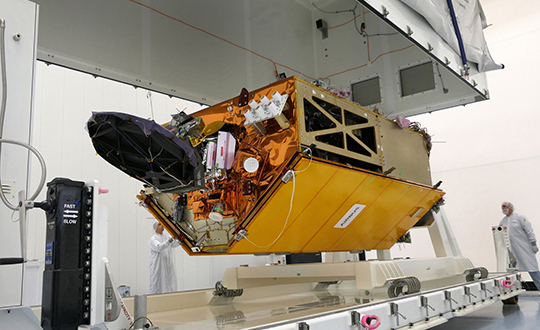
    When a satellite by the name of Sentinel-6 Michael Freilich launches this November, its primary focus will be to monitor sea-level rise with extreme precision. But an instrument aboard the spacecraft will also provide atmospheric data that will improve weather forecasts, track hurricanes and bolster climate models.

    “Our fundamental goal with Sentinel-6 is to measure the oceans, but the more value we can add, the better,” said Josh Willis, the mission’s project scientist at NASA’s Jet Propulsion Laboratory in Southern California. “It’s not every day that we get to launch a satellite, so collecting more useful data about our oceans and atmosphere is a bonus.”

    A U.S.-European collaboration, Sentinel-6 Michael Freilich is one of two satellites that compose the Copernicus Sentinel-6/Jason-CS (Continuity of Service) mission. The satellite’s twin, Sentinel-6B, will launch in 2025 to take over for its predecessor. Together, the spacecraft will join TOPEX/Poseidon and the Jason series of satellites, which have been gathering precise sea-level measurements for nearly three decades. Once in orbit, each Sentinel-6 satellite will collect sea-level measurements down to the centimeter for 90% of the world’s oceans.

    JPL-developed instrument

    Meanwhile, they’ll also peer deep into Earth’s atmosphere with GNSS-RO to collect highly accurate global temperature and humidity information. Developed by JPL, the spacecraft’s GNSS-RO instrument tracks radio signals from navigation satellites to measure the physical properties of Earth’s atmosphere. As a radio signal passes through the atmosphere, it slows, its frequency changes, and its path bends. Called refraction, this effect can be used by scientists to measure minute changes in atmospheric physical properties, such as density, temperature, and moisture content.

    The precise global atmospheric measurements made by Sentinel-6 Michael Freilich will complement atmospheric observations by other GNSS-RO instruments already in space. Specifically, the National Oceanic and Atmospheric Administration’s National Weather Service meteorologists will use insights from Sentinel 6’s GNSS-RO to improve weather forecasts.

    Also, the GNSS-RO information will provide long-term data that can be used both to monitor how our atmosphere is changing and to refine models used for making projections of future climate. Data from this mission will help track the formation of hurricanes and support models to predict the direction storms may travel. The more data we gather about hurricane formation (and where a storm might make landfall), the better in terms of helping local efforts to mitigate damage and support evacuation plans.

    The Sentinel-6 Michael Freilich spacecraft undergoes tests at its manufacturer Airbus in Friedrichshafen, Germany, in 2019. The white GNSS-RO instrument can be seen attached to the upper left portion of the front of the spacecraft. (Photo: Airbus)
    The Sentinel-6 Michael Freilich spacecraft undergoes tests at its manufacturer Airbus in Friedrichshafen, Germany, in 2019. The white GNSS-RO instrument can be seen attached to the upper left portion of the front of the spacecraft. (Photo: Airbus)

    A brief history of radio occultation

    Radio occultation was first used by NASA’s Mariner 4 mission in 1965 when the spacecraft flew past Mars. As it passed behind the Red Planet from our perspective, scientists on Earth detected slight delays in its radio transmissions as they traveled through atmospheric gases. By measuring these radio signal delays, they were able to gain the first measurements of the Martian atmosphere and discover just how thin it was compared to Earth’s.

    By the 1980s, scientists had started to measure the slight delays in radio signals from Earth-orbiting navigation satellites to better understand our planet’s atmosphere. Since then, many radio occultation instruments have been launched; Sentinel-6 Michael Freilich will join the six COSMIC-2 satellites as the most advanced GNSS-RO instruments among them.

    “The Sentinel-6 instrument is essentially the same as COSMIC-2’s. Compared to other radio occultation instruments, they have higher measurement precision and greater atmospheric penetration depth,” said Chi Ao, the instrument scientist for GNSS-RO at JPL.

    GNSS-RO basics

    The GNSS-RO instrument’s receivers track navigation satellite radio signals as they dip below, or rise from, the horizon. They can detect these signals through the vertical extent of the atmosphere — through thick clouds — from the very top and almost all the way to the ground. This is important, because weather phenomena emerge from all layers of the atmosphere, not just from near Earth’s surface where we experience their effects.

    “Tiny changes in the radio signal can be measured by the instrument, which relate to the density of the atmosphere,” said Ao. “We can then precisely determine the temperature, pressure, and humidity through the layers of the atmosphere, which give us incredible insights to our planet’s dynamic climate and weather.”


    With the help of JPL’s GNSS-RO principal investigator Chi Ao and NOAA’s National Weather Service meteorologist Mark Jackson, this video explains how the GNSS-RO instrument aboard Sentinel-6 Michael Freilich will be used by meteorologists to improve weather forecasting predictions. (Credit: NASA/JPL-Caltech)


    But there’s another reason why probing the entire vertical profile of the atmosphere from orbit is so important: accuracy. Meteorologists typically gather information from a variety of sources – from weather balloons to instruments aboard aircraft. But sometimes scientists need to compensate for biases in the data. For example, air temperature readings from a thermometer on an airplane can be skewed by heat radiating from parts of the aircraft.

    GNSS-RO data is different. The instrument collects navigation satellite signals at the top of the atmosphere, in what is close to a vacuum. Although there are sources of error in every scientific measurement, at that altitude, there’s no refraction of the signal, which means there’s an almost bias-free baseline to which atmospheric measurements can be compared in order to minimize noise in data collection.

    And as one of the most advanced GNSS radio occultation instruments in orbit, said Ao, it will also be one of the most accurate atmospheric thermometers in space.

    More on the mission

    Copernicus Sentinel-6/Jason-CS is being jointly developed by the European Space Agency (ESA), the European Organisation for the Exploitation of Meteorological Satellites (EUMETSAT), NASA, and the National Oceanic and Atmospheric Administration (NOAA), with funding support from the European Commission and support from France’s National Centre for Space Studies (CNES).

    The first Sentinel-6/Jason-CS satellite that will launch was named after the former director of NASA’s Earth Science Division, Michael Freilich. It will follow the most recent U.S.-European sea-level observation satellite, Jason-3, which launched in 2016 and is currently providing data.

    NASA’s contributions to the Sentinel-6/Jason-CS mission are three science instruments for each of the two Sentinel-6 satellites: the Advanced Microwave Radiometer, the GNSS-RO, and the Laser Retroreflector Array. NASA is also contributing launch services, ground systems supporting operation of the NASA science instruments, the science data processors for two of these instruments, and support for the international Ocean Surface Topography Science Team.

  • Story map navigates cause and effects of climate change

    Climate-Change-O

    Esri has released an interactive map illustrating the earth’s natural and human systems and how they have changed — and will change — over time. With the Atlas for a Changing Planet story map, scientists, policy makers, planners and activists can examine detailed spatial information that is critical for adapting to a warmer future.

    “Mitigating the effects of climate change is a global, geographic challenge,” said Jack Dangermond, president of Esri. “Understanding how the earth’s systems interact and transform is an essential first step in measuring the threat of climate change and making informed decisions to reduce it.”

    Atlas for a Changing Planet explores a sample of maps, imagery and data from Esri ArcGIS Online. The story map covers five themes: understanding natural systems, mapping human systems, mapping ocean impacts, predicting the future, and international cooperation.

    Complex issues, processes, and concepts — such as biomass and ocean acidification — are clearly and succinctly explained with maps and multimedia, Esri said. For example, users visualize the density of carbon stored in living plants (biomass) with an explanation of how this information is key to estimating how land-use change affects the climate. Interactive maps illustrate which areas will be severely affected by rising sea levels, the changes in sea ice extents in the Arctic Ocean, and population growth in urban cities around the world.

    The story map also models data from the National Center for Atmospheric Research (NCAR) in three scenarios. With this data, users navigate the story map to see projected changes in temperature and precipitation based on the level at which greenhouse gas emissions increase or decrease over time.

    Esri created the story map in time for the Nov. 30 start of the United Nations 21st Conference of the Parties (COP21). World leaders are gathering at the annual meeting to negotiate an international agreement with the goal of keeping global warming’s increase below 2 degrees Celsius.

  • On the Edge: The Precision to Carry On

    On the Edge: The Precision to Carry On

    Components easily pack into a baseball-style case. Photo: Nicholas DiGruttolo
    Components easily pack into a baseball-style case. Photo: Nicholas DiGruttolo

    By Nicholas DiGruttolo

    When asked to do a small survey job overseas, we were concerned about shipping bulky and expensive survey equipment. Shipping costs are not trivial. Add to that the real possibility that your survey equipment may be confiscated by the local authorities, as ours was in Djibouti, and the cost of shipping equipment becomes a substantial part of the overall job. There should be alternatives, especially if accuracy requirements are not stringent.

    Faced with this problem for a second time, we considered a new receiver system that has many advantages over conventional survey-grade GNSS receivers: It is small, lightweight and low-cost without sacrificing performance, making it ideal for precision surveying in remote areas of the world and for traveling to the job site by commercial airline. All the components, including the tripods, rods and batteries, are constructed from commercial off-the-shelf (COTS) components. A complete base and rover kit fits in a baseball bag and weighs less than 10 kilograms. The kit is sized and approved as carry-on luggage.

    The system is scalable from a simple single-frequency semi-mobile receiver for control networks and some semi-kinematic mapping applications, to a dual-frequency network RTK solution.

    The system comes with free processing software that supports carrier-phase relative positioning in real time and post mission, as well as precise-point positioning (PPP) and CA-code differential correction. The software is designed with a simple user interface for easy selection of base and rover data or automatic data download of the closest Continuously Operating Reference Station (CORS) from the U.S. National Geodetic Survey database.

    complete survey set including GNSS receiver, antenna, battery and cables, fits in a small handheld plastic case.
    Complete survey set including GNSS receiver, antenna, battery and cables, fits in a small handheld plastic case. Photo: Nicholas DiGruttolo

    The system fills a gap between survey applications, where centimeter-level precision is an absolute necessity, and mapping applications, where meter-level is tolerable. The product offers sub-foot precision in most cases and centimeter precision in ideal situations.

    Our team recently performed topographic mapping of an oil refinery site in Saudi Arabia and surveyed a precise-elevation network in Sarasota, Fla., to research the effects of sea-level rise. The small size of the COTS components simplified transport to Saudi Arabia, eliminating additional airline baggage fees and easing import through customs. Researchers performing the sea-level study reduced field time by increasing the number of receivers needed to observe a robust vertical control network.

    Oil Refinery. The oil refinery project entailed mounting a GNSS antenna on the roof of an off-road vehicle and driving multiple transects around the 18-kilometer perimeter of the site to record the elevation of the terrain. Kinematic data was recorded at 1 Hz using a GPS-only version of the single-frequency receiver. Baseline length to the local reference station varied from less than 1 kilometer to about 10 kilometers. The site was open desert with no overhead obstructions or sources of multipath other than the roof of the vehicle on which the antenna was mounted. Post-processing and comparison to simultaneously collected data from a high-precision survey-grade receiver revealed positional accuracy of about 5 centimeters horizontal and 10 centimeters vertical, when the system’s trajectory was compared to the truth trajectory provided by the survey-grade receiver. Figure 1 shows the difference between the two trajectories. The system’s antenna was 2 feet away from the survey-grade antenna along the driving direction of the vehicle; the trajectory was mostly in the north-south direction and hence the 0.6-m offset in the plot!

    Figure 1. Antenna location difference in the sub-decimeter range between the survey-grade system and the compact low-cost system. Note: A 0.6-m offset is to be removed from the difference, as the two antennas were mounted 0.6 m apart in the vehicle driving direction.
    Figure 1. Antenna location difference in the sub-decimeter range between the survey-grade system and the compact low-cost system. Note: A 0.6-m offset is to be removed from the difference, as the two antennas were mounted 0.6 m apart in the vehicle driving direction.

    Sea Level. The sea-level-rise study required a high-accuracy vertical control network to cover a 2,500 hectare area. The purpose of the network is to determine the shortest term effects of sea-level rise with a rate of 1.8 millimeter/year in the affected area. Ten benchmarks were established throughout the area of interest, and a robust network of static observations was performed with a combination of two dual-frequency and two single-frequency receivers. The single-frequency receivers were GPS-only units where two standard 4-inch patch antennas were mounted on rods adjusted to a 0.9-meter height. The addition of two receivers provided greater redundancy and a stronger network solution in much less time than would have been possible with only one pair of survey-grade receivers. Figure 2 shows the addition of several loop ties to the network as a result of adding the two roving, lightweight receivers.

    Figure 2. Sea-level rise monitoring network showing increased tie points and redundancy as a result of adding the extra lightweight precision receivers to the survey-grade receivers.
    Figure 2. Sea-level rise monitoring network showing increased tie points and redundancy as a result of adding the extra lightweight precision receivers to the survey-grade receivers.

    Manufacturers

    The system described in this article is the G1 system developed by Geomatics USA, LLC (www.geomatics.us; see also www.navtechgps.com).


    Nicholas DiGruttolo works as a field surveying manager for JBrown Professional Group Inc., Northrop Grumman Corporation, and has recently become vice president of surveying.

  • GPS Reflections Group Honored with Water Prize

    The GPS Reflections Group of University of Colorado-Boulder has been awarded the prestigious Prince Sultan Bin Abdulaziz International Creativity Prize for Water. The prize is awarded biannually to acknowledge innovative work that contributes to the sustainable availability of water and the alleviation of the global problem of water scarcity.

    The awards will be presented in a ceremony in Riyadh, Saudi Arabia, on December 16, concurrently with the 6th International Conference on Water Resources and Arid Environments (ICWRAE 6), December 16-18, 2014.

    Professors Kristine Larson and Eric Small developed a new method to measure water at the Earth’s surface. The research team discovered that standard geodetic GPS instruments are sensitive to hydrological influences. They subsequently developed a cost-effective technique, GPS Interferometric Reflectometry (GPS-IR), to measure soil moisture, snow depth, and vegetation water content around GPS antennas. GPS-IR has the advantage of relying on an existing GPS infrastructure installed by surveyors and geoscientists that covers an increasingly large portion of the global surface.

    Larson has written for GPS World magazine (see Innovation: How Deep Is That White Stuff?), and her team’s sea-level work has been reported here before.

    Larson and Small collaborated with scientists at the University Corporation for Atmospheric Research and the National Atmospheric and Oceanic Administration, also in Boulder.

    The team uses the GPS-IR technique to analyze data streams from existing GPS networks in near real-time. Data from hundreds of operational GPS sites are downloaded and processed, yielding estimates of hydrologic variables within 24 hours.

    Scientists and government agencies can access this information at the team’s web portal and use the data to improve monitoring and forecasting of hydrologic variables.

  • By the Beautiful Sea

    A panorama from the GNSS tide gauge at Onsala Space Observatory. When satellites pass over the sky, the GNSS tide gauge uses signals direct from the satellite and signals reflected off the sea surface to measure the sea level. Photo: Johan Löfgren
    A panorama from the GNSS tide gauge at Onsala Space Observatory. When satellites pass over the sky, the GNSS tide gauge uses signals direct from the satellite and signals reflected off the sea surface to measure the sea level. Photo: Johan Löfgren

    New Tide Gauge Uses GNSS to Measure Sea-Level Change

    A new way of measuring and monitoring sea level — an important facet of researching climate change — has been implemented by scientists at Chalmers University of Technology in Sweden using existing coastal GPS stations.

    When satellites pass over the sky, the GNSS tide gauge uses signals direct from the satellite and signals reflected off the sea surface to measure the sea level. Photo: Johan Löfgren
    When satellites pass over the sky, the GNSS tide gauge uses signals direct from the satellite and signals reflected off the sea surface to measure the sea level. Photo: Johan Löfgren

    Measuring sea level is an increasingly important part of climate research, and a rising mean sea level is one of the most tangible consequences of climate change. Researchers at Chalmers University of Technology have studied new ways of measuring sea level that could become important tools for testing climate models and for investigating how the sea level along the world’s coasts is affected by climate change.

    Johan Löfgren and Rüdiger Haas, scientists at Chalmers Department of Earth and Space Sciences, have developed and tested an instrument that measures the sea level using a GNSS tide gauge.

    “The global mean sea level is rising because of climate change, but the change depends on where you are in the world,” said Rüdiger Haas. “We want to be able to make detailed measurements of sea level so that we can understand how coastal societies will be affected in the future.”

    The GNSS tide gauge uses GPS and GLONASS signals. BeiDou and Galileo will be added in the future.

    “We measure the sea level using the same radio signals that mobile phones and cars use in their satellite navigation systems,” said Johan Löfgren. “As the satellites pass over the sky, the instrument ‘sees’ their signals — both those that come direct and those that are reflected off the sea surface.”

    Antenna Setup. Two antennas, covered by small white radomes, measure signals both directly from the satellites and signals reflected off the sea surface. By analyzing these signals together, the sea level and its variation can be measured up to 20 times per second. The sea-level time series is rich in physical phenomena such as tides (caused mostly by the gravitational pull of the Moon and the Sun), meteorological signals (high and low pressure), and signals from climate change. Through advanced signal processing, these signals can be studied further.

    Schematic drawing of the GNSS tide gauge for SNR analysis (left) and phase-delay analysis (right). For the SNR analysis, the satellite signal with elevation ε reflects off the sea surface and interferes with the direct satellite signal at the antenna, creating an interference pattern in the recorded SNR observable that can be related to the reflector height, hr. For the phase delay analysis, the phase delays of the direct and the reflected signals are recorded separately, and through geodetic analysis of the phase delay, the baseline between the antennas can be determined and related to the height of the nadir-looking antenna over the sea surface, ha, and the vertical distance between the antenna phase centers, d.
    Schematic drawing of the GNSS tide gauge for SNR analysis (left) and phase-delay analysis (right). For the SNR analysis, the satellite signal with elevation ε reflects off the sea surface and interferes with the direct satellite signal at the antenna, creating an interference pattern in the recorded SNR observable that can be related to the reflector height, hr. For the phase delay analysis, the phase delays of the direct and the reflected signals are recorded separately, and through geodetic analysis of the phase delay, the baseline between the antennas can be determined and related to the height of the nadir-looking antenna over the sea surface, ha, and the vertical distance between the antenna phase centers, d.

    The scientists’ initial study compared sea-level solutions from two analysis methods: signal-to-noise ratio (SNR) analysis and phase-delay analysis. The SNR analysis uses multipath signals observed with an upward-looking antenna, and the phase delay analysis uses the phase delay for both an upward- and a downward-looking antenna (see diagram).

    Both GPS and GLONASS L1 and L2 signals were recorded, and the results were compared to independent measurements of sea level from a co-located pressure tide gauge. The GNSS-derived sea level showed a high correlation with the tide-gauge sea level for both analysis methods. Correlation coefficients for the phase-delay analysis and for the SNR analysis using frequency L1 were 0.95 to 0.97, whereas the correlation coefficients for the SNR analysis using frequency L2 were 0.86 to 0.87. 

    The phase-delay analysis shows a better agreement with the independent tide gauge sea level than the sea level from SNR analysis. Expressed as RMS differences, the phase-delay analysis achieves values of 3.5 cm (GPS) and 3.3 cm (GLONASS), whereas the SNR analysis achieves 4.0 cm (GPS) and 4.7 cm (GLONASS). The scientists concluded that, for the phase-delay analysis, it is possible to use both frequency bands, and for the SNR analysis, frequency band L2 should be avoided if other signals are available.

    The GNSS tide gauge at Onsala Space Observatory uses signals from satellite navigation systems like GPS to measure the sea level. Photo: Johan Löfgren
    The GNSS tide gauge at Onsala Space Observatory uses signals from satellite navigation systems like GPS to measure the sea level. Photo: Johan Löfgren

    Land and Sea. Unlike traditional tide gauges, the new GNSS tide gauge can measure changes in both land and sea at the same time, in the same location. That means both long-term and short-term land movements (post-glacial rebound and earthquakes) can be taken into consideration.

    “Now we can measure the sea level both relative to the coast and relative to the center of the Earth, which means we can clearly tell the difference between changes in the water level and changes in the land,” said Johan Löfgren.

    This summer, other high-precision instruments are being installed to work with the Onsala GNSS tide gauge, in collaboration with SMHI, the Swedish Meteorological and Hydrological Institute.

    “Our tide gauge station will become part of a network of stations along the coast of Sweden that will be able to monitor changes in the water level to millimeter precision well into the future,” said Gunnar Elgered, professor at Chalmers Department of Earth and Space Sciences.

    The scientists have also shown that existing coastal GNSS stations, installed primarily for the purpose of measuring land movements, can be used to make sea-level measurements.

    “We’ve successfully tested a method where only one of the antennas is used to receive the radio signals. That means that existing coastal GNSS stations — there are hundreds of them all over the world — can also be used to measure the sea level,” said Johan Löfgren.


    This work was previously reported in these publications: Larson, K.M., J. Lofgren, and R. Haas, “Coastal Sea Level Measurements Using A Single Geodetic GPS Receiver,” Adv. Space Res., Vol. 51(8), 1301-1310, 2013, doi:10.1016/j.asr.2012.04.017, 2013; and Larson, K.M., R. Ray, F. Nievinski, and J. Freymueller, “The Accidental Tide Gauge: A Case Study of GPS Reflections from Kachemak Bay, Alaska,” IEEE GRSL, Vol 10(5), 1200-1205, doi:10.1109/LGRS.2012.2236075, 2013.

  • Enhanced Sea-level Prediction System to Improve Coastal Flooding Plans

    National Geodetic Survey logoAs the Gulf Coast begins another hurricane season, researchers with the Conrad Blucher Institute for Surveying and Science (CBI) at Texas A&M University-Corpus Christi will be improving the data collection system to allow for more accurate planning and predictions for flooding and sea-level rise.

    CBI has been awarded $1.35 million to enhance the National Spatial Reference System that helps model and predict sea level rise.

    Forecasters are predicting a hurricane season with one or two major hurricanes, but flooding can still pose significant threat, especially to the vital infrastructure along the Gulf coast, which includes 10 of the 14 largest ports. The long-term stability of this region’s infrastructure is in question due to the impact of sea level rise and associated increases in risks of flooding. Growing Gulf coastal populations, up 32 percent from 1990 to 2008, compound the risks. Preparing for sea level rise, flooding and other impacts requires accurate data about what’s occurring at the water’s edge. Collection methods for this type of geospatial data will be enhanced through this project.

    The funding, from the National Geodetic Survey, a project of the National Oceanic and Atmospheric Administration, provides the foundation for modeling along the northern Gulf of Mexico through the National Spatial Reference System.

    The project focuses on an area that is most exposed to inundation from tropical storm surge and has a high risk of flooding and long-term effects of climate change and subsidence.

    “We are excited to be part of this project to provide the latest geospatial data with information from tide gauges, sea level observations, land elevation reference points, and 3D positioning,” said Gary Jeffress, director of CBI. “This system will help local and regional leaders plan for improved resilience to the impacts of sea level rise and flooding and develop long-term strategies to address impacts along the northern Gulf of Mexico.”

    The project will extend and improve monitoring stations from Texas to the Florida Keys to provide additional measurements, including more accurate data regarding elevations, 3D positioning, subsidence rates and sea level observations, that will establish ongoing monitoring of the relative sea-level change along the northern Gulf of Mexico in the coming decades.

    Jeffress, Ruizhi Chen and James Rizzo, with CBI and Texas Spatial Reference Center, will lead the project for A&M-Corpus Christi. Researchers from University of Southern Mississippi, Louisiana State University and Florida Atlantic University are also partners in the project.

  • New Tide Gauge Uses GPS to Measure Sea-Level Change

    New Tide Gauge Uses GPS to Measure Sea-Level Change

    A panorama from the GNSS tide gauge at Onsala Space Observatory. When satellites pass over the sky, the GNSS tide gauge uses signals direct from the satellite and signals reflected off the sea surface to measure the sea level. Photo: Johan Löfgren
    A panorama from the GNSS tide gauge at Onsala Space Observatory. When satellites pass over the sky, the GNSS tide gauge uses signals direct from the satellite and signals reflected off the sea surface to measure the sea level. Photo: Johan Löfgren

    A new way of measuring sea level using satellite navigation system signals, for instance GPS, has been implemented by scientists at Chalmers University of Technology in Sweden. Sea level and its variation can easily be monitored using existing coastal GPS stations, the scientists have shown.

    Measuring sea level is an increasingly important part of climate research, and a rising mean sea level is one of the most tangible consequences of climate change. Researchers at Chalmers University of Technology have studied new ways of measuring sea level that could become important tools for testing climate models and for investigating how the sea level along the world’s coasts is affected by climate change.

    Johan Löfgren and Rüdiger Haas, scientists at Chalmers Department of Earth and Space Sciences, have developed and tested an instrument that measures the sea level using a GNSS tide gauge.

    ”The global mean sea level is rising because of climate change, but the change depends on where you are in the world,” says Rüdiger Haas. “We want to be able to make detailed measurements of sea level so that we can understand how coastal societies will be affected in the future.”

    When satellites pass over the sky, the GNSS tide gauge uses signals direct from the satellite and signals reflected off the sea surface to measure the sea level. Photo: Johan Löfgren
    When satellites pass over the sky, the GNSS tide gauge uses signals direct from the satellite and signals reflected off the sea surface to measure the sea level. Photo: Johan Löfgren

    The GNSS tide gauge uses GPS and GLONASS signals. BeiDou and Galileo will be added in the future.

    ”We measure the sea level using the same radio signals that mobile phones and cars use in their satellite navigation systems,” says Johan Löfgren. “As the satellites pass over the sky, the instrument ‘sees’ their signals — both those that come direct and those that are reflected off the sea surface.”

    Two antennas, covered by small white radomes, measure signals both directly from the satellites and signals reflected off the sea surface. By analyzing these signals together, the sea level and its variation can be measured, up to 20 times per second. The sea level time series is rich in physical phenomena such as tides (caused mostly by the gravitational pull of the Moon and the Sun), meteorological signals (high and low pressure), and signals from climate change. Through advanced signal processing, these signals can be studied further.

    The new GNSS tide gauge can measure changes in both land and sea at the same time, in the same location. That means both long-term and short-term land movements (post-glacial rebound and earthquakes) can be taken into consideration.

    ”Now we can measure the sea level both relative to the coast and relative to the center of the Earth, which means we can clearly tell the difference between changes in the water level and changes in the land,” says Johan Löfgren.

    This summer, other high-precision instruments will be installed to work with the Onsala GNSS tide gauge, in collaboration with SMHI, the Swedish Meteorological and Hydrological Institute.

    The GNSS tide gauge at Onsala Space Observatory uses signals from satellite navigation systems like GPS to measure the sea level. Photo: Johan Löfgren
    The GNSS tide gauge at Onsala Space Observatory uses signals from satellite navigation systems like GPS to measure the sea level. Photo: Johan Löfgren

    ”Our tide gauge station will become part of a network of stations along the coast of Sweden that will be able to monitor changes in the water level to millimeter precision well into the future,” says Gunnar Elgered, professor at Chalmers Department of Earth and Space Sciences.

    The scientists have also shown that existing coastal GNSS stations, installed primarily for the purpose of measuring land movements, can be used to make sea-level measurements.

    ”We’ve successfully tested a method where only one of the antennas is used to receive the radio signals. That means that existing coastal GNSS stations — there are hundreds of them all over the world — can also be used to measure the sea level,” says Johan Löfgren.

    More about the research

    The method is described in two new scientific articles:

    Sea level time series and ocean tide analysis from multipath signals at five GPS sites in different parts of the world

    and Sea level measurements using multi-frequency GPS and GLONASS observations

    This work was previously reported in these publications:

    Larson, K.M., J. Lofgren, and R. Haas, Coastal Sea Level Measurements Using A Single Geodetic GPS Receiver, Adv. Space Res., Vol. 51(8), 1301-1310, 2013, doi:10.1016/j.asr.2012.04.017, 2013.

    Larson, K.M., R. Ray, F. Nievinski, and J. Freymueller, The Accidental Tide Gauge: A Case Study of GPS Reflections from Kachemak Bay, Alaska, IEEE GRSL, Vol 10(5), 1200-1205, doi:10.1109/LGRS.2012.2236075, 2013.