Team Provides Accurate 3D Maps for Smart City Applications
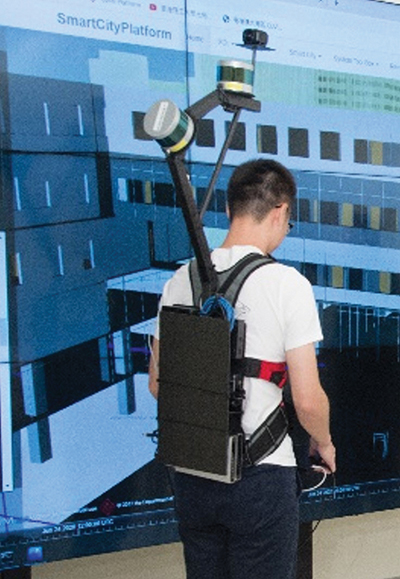
The PolyU team’s mobile mapping backpack. (Image: The Hong Kong Polytechnic University)
According to 2019 statistics, more than 10,000 residential buildings in Hong Kong are at least 50 years old. Most of these buildings lack 3D indoor building information models (BIM), which creates challenges when it comes to reconstruction or maintenance.
In response, a team at Hong Kong Polytechnic University (PolyU) has developed a lightweight and reliable 3D mobile mapping system in a backpack. The system can easily measure cities and obtain 3D maps with centimeter-level accuracy. It can be used to build spatial data infrastructure, which supports smart city applications in many fields.
The system uses advanced technologies such as simultaneous localization and mapping (SLAM), useful in urban canyons where GNSS signals can be spotty. It can carry out continuous data collection in complex indoor and outdoor environments, and is particularly suitable for high-density and complex urban environments, such as those in Hong Kong.
The mapper is providing a special boon to modular integrated construction (MIC) in the city. With MIC, free-standing integrated modules are prefabricated and then transported to the site for installation in a building. However, the trucks hauling the large components can’t always maneuver through narrow streets in Hong Kong’s urban areas.
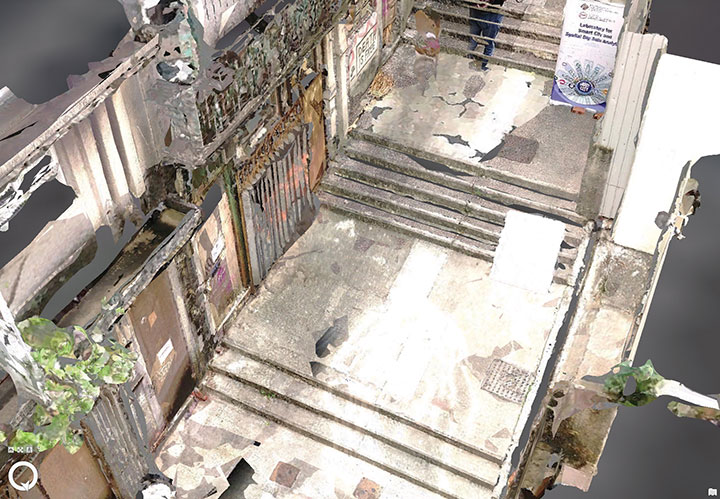
One of many narrow streets mapped in downtown Hong Kong. (Image: The Hong Kong Polytechnic University
To address the issue, the PolyU team collaborated with the Hong Kong Construction Industry Council, providing its mobile-mapping backpack to conduct 3D measurement of critical road sections. The project identified and mapped obstacles, and optimized the route for transporting oversized components to avoid narrow passages.
Mobile-mapping backpacks also can be used to create detailed indoor 3D models to support firefighting and provide evacuation routes for personnel at the fire scene.
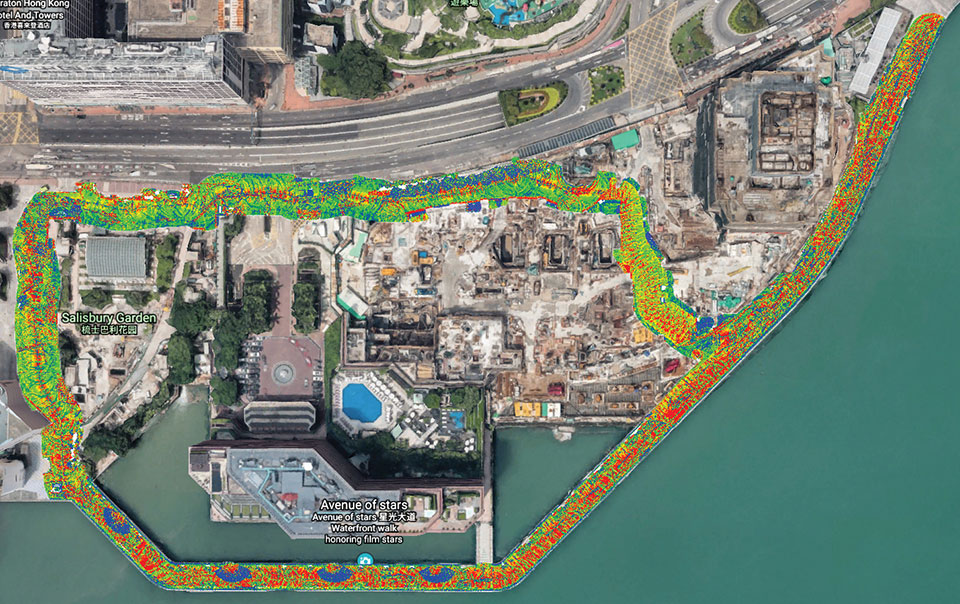
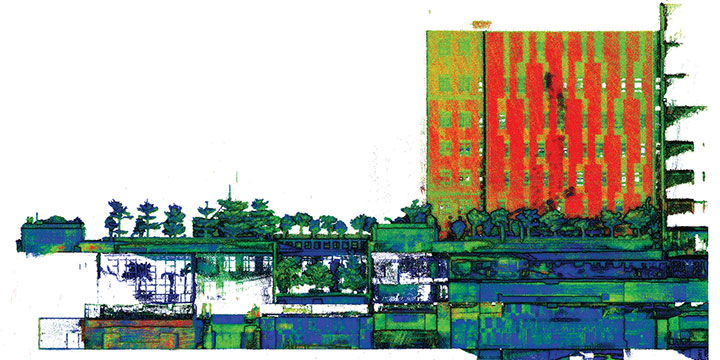
The route taken by the mobile mapping backpack carrier in the harbor area. (Image: The Hong Kong Polytechnic University)A sample point cloud from the mobile mapper. (Image: The Hong Kong Polytechnic University)
The mobile mapper is one of the technologies developed by PolyU’s Smart Cities Research Institute, established in 2020 to help address social issues and provide solutions for smart city development. In March, the institute’s projects received a gold medal at 2021 Inventions Geneva Evaluation Days.
The global LoRaWAN market is projected to reach US$5557.2 million, growing at a very high compound annual growth rate (CAGR) of 47.2% during 2019 to 2027, according to market research firm InForGrowth.
LoRaWAN is mainly designed for wide range and low-power communications in smart city applications that benefit from wireless battery-operated devices and secure bi-directional communication, mobility and localization services.
InForGrowth’s LoRaWAN market report provides a detailed analysis of global market size, regional and country-level market size, segmentation market growth, market share, the competitive landscape, sales analysis, impact of domestic and global market players, value-chain optimization, trade regulations, recent developments, opportunities analysis, strategic market growth analysis, product launches, area marketplace expanding and technological innovations.
Top driving factors
The report discusses these driving factors in the LoRaWAN market.
Growing adoption of smart devices (IoT) in smart cities and smart home projects.
The growing adoption of machine-to-machine communication devices due to low cost and less power consumption.
Due to the use of IoT in various applications such as smart metering, smart lighting, and livestock monitoring, organizations face challenges regarding the selection of an appropriate connectivity option for specific business use cases.
LoRaWAN mainly the private or virtual networks, and connect different endpoints that use different applications (IoT, M2M, smart cities, sensor networks, and industrial automation) in a single data environment. This fuels the demand for LPWANs that offer requisite connectivity, provide long-range access, and extended battery life for connected devices and sensors.
Market segmentation
The global LoRaWAN market has been segmented on the basis of deployment, hardware, application and end-user.
The application of LoRaWAN is based on industry verticals segmented into
asset tracking
smart metering
smart parking
smart waste management
smart building
others.
Top-end users — those receiving benefits through the LoRaWAN market — can be segmented into
agriculture
utilities
consumer electronics
healthcare
manufacturing
others.
Region Analysis
The market is classified into North America, Europe, Asia Pacific, Middle East, Africa and Latin America.
Europe dominated the market in 2018 and is anticipated to dominate the market in the coming years as well. This is mainly attributed to the rapid adoption of smart agriculture in the region. Large-scale macro-farms are being replaced by family-owned micro-farms across Europe.
Key players involved in the LoRaWAN market included in this study are Murata Manufacturing Co., Ltd., Link Labs, Microchip Technology Inc., Laird Connectivity, Semtech Corporation, SK Telecom Co. Ltd., Orange S.A. Senet Inc., Comcast Corporation and others.
At Intergeo 2019, Bentley Systems will be focusing on digital construction, digital cities, reality modeling and civil design. (Photo: iStock.com/alexsl)
Bentley Systems will be focusing on smart cities, specifically digital twins for digitally advanced smart cities and other technology solutions, at Intergeo 2019, which will take place Sept. 17-19 in Stuttgart, Germany.
During the show, the company will offer demonstrations and discuss digital construction, digital cities, reality modeling and civil design. In the realm of digital construction, Bentley Systems will cover the use of a mixed reality solution for 4D construction featuring Bentley’s SYNCHRO (4D construction software) with Microsoft HoloLens.
The company also will demonstrate how its OpenCities Planner software enables visualization of 2D, 3D and GIS data in a 3D world. Bentley colleagues will discuss how OpenCities Planner’s capabilities combined with Bentley’s reality modeling offerings make city-scale digital twins broadly accessible, the company said.
In addition, the company will key in on reality modeling, including the process of capturing the physical reality of an infrastructure asset, creating a representation of it and maintaining it through continuous surveys. Bentley experts also will demonstrate the use of ContextCapture, which enables users to generate spatially-classified and engineering-ready reality models at any desired level of accuracy and scale, including entire cities.
Finally, the company will discuss how civil design can be made better though its open applications, including OpenRoads, OpenSite and OpenRail.
During the show, Robert Mankowski, vice president of Bentley Systems’ Digital Cities Business Unit, will present a keynote on Sept. 18 titled, “The Digitally Advanced City: Trusted Information Whenever and Wherever Needed.” Håkan Engman, business development director of reality modeling at Bentley Systems, also will present a spot talk on Sept. 19 titled, “Digital Transformation for Increased Efficiency and Sustainability.”
Bentley Systems will be in Hall 3 at booth A3.010 at Intergeo.
The Open Geospatial Consortium (OGC) is inviting members and non-members to participate in its 3D IoT Platform for Smart Cities Pilot.
The goal of the pilot, which is sponsored by the Korea Land and Housing Corporation, is to advance the use of open standards for integrating environmental, building and internet of things (IoT) data in smart cities. It will focus on two scenarios: real-time monitoring of indoor occupancy and real-time monitoring of micro-dust air pollutants.
According to OGC, participants in this pilot will connect their technology and expertise with real city needs while collaborating with other participants to advance open standards for smart cities. OGC hopes the outcomes of the pilot will help facilitate and standardize the access to environmental, building and IoT data in smart cities.
This Initiative is being conducted under OGC’s Innovation Program, the research and development laboratory of OGC. Under OGC’s Innovation Program, sponsors and OGC members come together to address geospatial IT challenges.
Everywhere we turn today, the term “smart” is attached to an item or to a process. Smartphones, smart cars, smart electricity grids, smart home appliances; you name it, someone is making it a “smart” item or process. Advancement in technology has increased computing power, expanded data storage capability, and has allowed for miniaturization of circuits and processors. This forward progress has led to the creation of these smart item/processes, and together creates the real possibility of making many of life’s tasks and normal operations more automated. This potential automation also brings new systems monitoring conditions of various entities and operations within our daily lives, such as increased efficiency of HVAC systems, utility metering that adjusts to our patterns of consumption and landscape watering that only provides water when needed.
In addition to the personal systems now being controlled with these machines, there is now revitalized interest in the creation of “smart cities.” The concept of this type of a civilized urban metropolis once existed only in science fiction, but technology has brought this concept to life in ways not imagined by the best of those writers. Surveyors have a big role in the development, installation and maintenance of these cities, so let us spend some time digging into the element that go into our future environments.
What is a smart city?
For those old enough to remember, the concept of a smart city only existed on “The Jetsons” cartoon from the early 1960’s, with cities in the sky, flying cars and some technological advancements that do exist today. While Orbit City may not come to fruition in the next several generations, many of the concepts of a smart city are taking shape today.
For the definition of a smart city, we go to the Google search engine and find the following entry from Internetofthingsagenda.techtarget.com: A smart city is a municipality that uses information and communication technologies to increase operational efficiency, share information with the public and improve both the quality of government services and citizen welfare.
Establishing a smart city requires forward thinking leadership and substantial funding to be created and maintained; however, the real function lies within the computing infrastructure and collection/manipulation of large quantities of data to create an environment of efficiency and conservation. A true comprehensive system combines available historical data, a collection of sensors and data collectors transmitting real-time information, and a powerful computing system containing analytical programming with extensive database functionality.
Is smart cities technology and adoption really that important?
Population trends worldwide continue to show that urban and suburban areas are expanding while rural areas are seeing a large reduction in residence. Several factors are at play, with technology being the central reason for the migration from the farm/small towns to the bigger cities.
Statistics show that in 1960, two billion people worldwide lived in rural areas while one billion lived in urban sections. As the population has increased drastically, the percentages for each category have reversed; in 2007, the two categories were equal and by 2017, the urban sector has jumped to 4.13 billion versus the rural population of 3.4 billion.
Chart: Our World in Data
Population experts estimate by 2050, upwards of 70 percent of the world’s population will be living in urban areas. Whether this population shift goes directly to the city centers or the less dense outskirts, municipal facilities and services will need to be upgraded and expanded with the continuing trend. Add to this surge the challenge to create a more sustainable environmental infrastructure and ecosystem, and it becomes a maintenance challenge and logistical nightmare. By using technology to create smarter infrastructure monitoring and management systems, the creation of smart cities with advancing technology will be key to successful and sustainable growth for municipalities and its citizens.
One of the biggest challenges faced by most municipalities is aging infrastructure. Utility systems, including water supplies and stormwater drainage, was installed several generations ago without a plan for replacement and/or expansion. Redevelopment in older urban areas are now taxing these aging systems well beyond their initial capacity, all while these facilities begin to fail simply because of continued use well beyond their original designed life span. Municipalities are forced to spend money on repairing and modernizing the existing infrastructure before entertaining the idea of upgrading new installations to “smart city” specifications. However, many municipalities are mandating that new developments and infrastructure improvements meet these specifications so any future upgrades can include computerized systems.
All these systems, new and future, will require extensive planning and mapping to be effective and efficient to justify their expense. Surveyors, utilizing a variety of tools based around high-accuracy mapping and data collection, can provide the necessary base information for these systems.
Where does surveying fit in?
Just as computers and electronic technology has allowed many industries to evolve, the surveying profession has also advanced with new methods and equipment. Our ability to perform advanced measurements and establish positional location information is critical in providing the base data necessary for smart city services. Previous surveying, mapping and record keeping systems were sufficient for the needs of the time period. However, these historical data points were nearly impossible to place into a single database simply because of one factor: georeferencing.
The surveyor has the unique responsibility of being recognized as expert measurer and locator of physical points on the ground in relation to property and boundary rights. It is because of this distinctive role within the community that the surveyor can provide a significant role in the development of the groundwork of a smart city. The introduction and implementation of newer technology and tools has allowed the surveyor to become a valuable member of the infrastructure mapping team. It always hasn’t been this way and the surveying profession shoulders most of that blame.
Past promises: digital vs. smart
Many surveyors will make the argument that our profession has been ahead of the game for years with our data collection processes having been transformed from notes in a field book to electronic devices. Digital data, however, isn’t necessarily smart data as many factors go into establishing the difference. The physical form of the survey information has no direct correlation to the basis of the data; in this case, the records need to be based upon a spatial reference frame rather than an assumed data system.
Also on the topic of spatial reference systems, we can also address the lack of respect given to geographical information systems (GIS) from surveyors during its initial introduction and implementation. GIS was discounted as a convoluted graphical database not sophisticated enough for the high-accuracy world of surveying. Little did the surveying profession know that GIS would become the spatial basis for many mapping systems and be utilized in millions of locations worldwide. Only now does the surveying community realize that we missed the bandwagon and can help to provide the crucial link between spatial data and actual points on the ground in relation to physical improvements and property ownership.
Another digital platform not initially embraced by the surveying community is building information modeling or BIM. This software is a three-dimensional modeling program used mostly by architects and mechanical engineers for depicting and designing buildings and plumbing systems. One of the advantages of BIM versus traditional CAD is a database information link containing data regarding the entities within the BIM. Among the attributes contained with BIM are documentation, spatial reference, time, cost, operational applications, and related applications (contracts, purchasing, suppliers, procurement solutions, etc.). The existing spatial data necessary for this system can be supplied by surveyors using a variety of methods but not many have implemented the software.
Technology, availability, cost of entry and overall usefulness
Surveying instruments and measuring techniques has turned a significant corner in the past two decades. While conventional measurement methods are still used (including steel tapes, laser-based total stations, and GNSS receivers), more types of sensors are being introduced to enhance the accuracy and expand the volume of data points being collected. Scanners, using phase-based and time-of-flight methodologies, are now more popular than ever as ease of use has increased while the cost of ownership has greatly decreased. Ground-based and mobile LiDAR used to be only available to large firms and the government, but new models are being introduced at price points affordable to many surveyors. Many articles have been written regarding the lightspeed adaptation of surveying, engineering and construction firms with UAV use of photogrammetry methods to quickly map areas that were previously inaccessible and meeting standards not thought possible. We are also seeing more implementation of new scanning methods, including SLAM (simultaneous localization and mapping) using handheld and backpack devices.
The common thread for all these technologies and methods is one thing: georeferencing. What was once nearly impossible is now a reality; data collection from various methods all being located within a common horizontal coordinate and vertical datum systems. The ability to obtain literally millions of data points with high-accuracy horizontal and vertical values is phenomenal with most of the credit going to the United States Department of Defense and their implementation of the GPS. Yes, the technology of scanners and data collection would have been invented without the overall coordinate tie-in but having the ability to reference that same data to a common system is the key.
Also key to the smart city data collection methodology is the surveyor as the expert measurer. A trained and experience surveyor can lead the data collection of significant projects, including location of existing improvements and establishment of future installations. From establishment of parcel/right-of-way lines to integration of point clouds from scanners and photogrammetry, the surveyor can assemble this data together to provide the groundwork for successful analyzation and planning. By combining data from various areas of a municipality, including utility atlases, existing improvements, and future expansion plans, a database can be created in which a smart city will rely upon for oversight and monitoring. The surveyor fills a vital role to determining the accuracy and effectiveness of data like no other profession and should not be overlooked when assembling a team for the creation of a smart city.
Future opportunities
Like all technological discoveries and enhancements before, the future is bright with many possibilities to increase the effectiveness and efficiency of a smart city. More types of sensors are being introduced on a regular basis and in every way imaginable, including wireless communication, RFID tags, and microelectromechanical systems (MEMS) devices.
One of the latest buzzwords is the “Internet of Things” (IoT), with many new devices being created to interconnect a network of web-enabled computerized devices using microprocessors, a variety of sensors and wireless communication hardware to gather, transmit and perform actions on information acquired from their environments. IoT presents advantages to users by enabling them to monitor their overall business processes and improve the customer experience. These actions can also precipitate changes to allow the company to save time and money, enhance employee productivity, integrate and adapt business models, make better business decisions, and generate more revenue.
As discussed in previous articles (GPS World March 2018 and GPS World November 2018), the next big technology to look forward to is the telecommunications upgrade to 5G. Once a full 5G network is running with extended coverage, we can look forward to new opportunities for indoor location services with similar accuracy to our existing GNSS capability.
What’s next?
The technology sector will continue to push the limits of computing speed, physical size and data capacity looking for the “next big thing.” The surveying profession has enjoyed many of the fruits of that success so one has to imagine that many more advances will be coming soon. Smart cities will continue to evolve as citizens of Earth keep migrating to the urban areas and forcing the existing infrastructure to expand or face failure. Surveyors will continue to help provide a variety of services to those citizens and municipalities, with an eye on the future for more advancing technology. I can’t wait to see what is next.
GIS is growing in importance to urban development, whether for environmental impact studies, geofencing or building information modeling (BIM). Sharing GIS data with developers is critical to a coordinated approach to smart city growth.
By Christine Easterfield, Principal Analyst, Cambashi
Just over half the world’s 7 billion population lives in cities. In Europe, this rises to three quarters, and 30 cities worldwide have populations of more than 10 million — the majority in India, China and South America.
This trend will continue. It is projected that the global population will reach almost 10 billion by 2050, which means cities will need to cope with increasing demands on housing, transport and communications.
Growing urban populations place considerable stress on housing stock. Cities need to provide scope to build new, but also to look at best use of existing properties.
In the growing urban population, there will always be a proportion that needs more support as employment rates shift and wages do not always keep up with city expenses. Social housing projects need to keep pace, and making the most of city resources opens opportunities for smart buildings.
The role of GIS
Proposed Indianapolis zoning map. (Image: City of Indianapolis)
Coordinating new build and refurbishment plans across a city requires planning and organization, and a set of tools to support planners and designers. The layout of city-planning zones is the starting point for many new developments — sharing data about these areas is typically achieved using a GIS (geographic information system).
The standard city map with records of roads, emergency routes, bike routes, key buildings, new development zones, existing housing stock, utility services and street lighting are a central resource for most cities.
Sharing data between these city maps and developers’ plans is critical to a coordinated approach to city growth.
Environmental impact
The early stages for many developments involve an environmental impact study. How will the new development fit into the existing landscape? What restrictions are imposed because of the conditions of the site or the current demands on local resources? What options are there for addressing these constraints?
This last point is important for acceptance of the development. Being able to show a level of flexibility to accommodate local concerns and developers’ challenges will build a cooperative relationship. The ability to easily integrate building plans with the city map means that confidence is quickly built into the new plans.
Combining the geography of the city view with the building model destined for development provides a perfect foundation for an integrated GIS/BIM model to take the development from drawing board to handover.
Maintaining a digital twin of a development, in the form of a BIM, provides a rich source of information about the as-built building — exact measurements, materials used, changes from the original design and more. Integrating this with the city maps held in GIS means a continuous dataset can be formed.
Tools for construction site inspection and reporting
Photo: Alen Ajan/Fotolia.com
Developing building information models (BIMs) requires monitoring the build activity and accurate recording of the construction. The best way to do this is as it happens.
Simple-to-use tools that are robust enough to cope with a construction site are becoming more available from software providers. These support gathering data by construction teams and contractors as the work is completed.
As well as recording data, these tools are also useful in registering the progress and completion of tasks. Many enable interaction with central systems that can send changes and updates directly to the site for immediate action.
The same tools can register the location of the user, enabling safer working practices to be enforced.
The practice of geofencing to monitor or even restrict access to parts of a construction site, by registering the location of a device against a predefined region on a map of the site, can track critical activities and react with the most appropriate action if an incident is reported.
Remote site inspection and reporting
The Aeryon SkyRanger. (Photo: Aeryon Labs)
The safest inspections don’t involve human intervention at all. Sending an unmanned aerial vehicle, UAV or drone, to fly over your site removes risk to staff when viewing hazardous environments.
Photographic imagery collected by drone can be loaded into GIS tools and accurately registered against the map of the area to provide a seamless view of the site.
Data integration is key
The range of data that can be accurately gathered and viewed together now covers original 3D designs, 2D construction plans, inspection photo-imagery and as-built updates.
Integration of BIM and GIS tools means that these different data types can be viewed together and in the same spatial context.
Support for building operation, management and maintenance in the wider context of a smart city
On-the-spot data capture of accurate as-built building information models that can seamlessly integrate with existing city plans leads to a data resource that cities can build on to improve safety, security and facilities for their citizens.
So what should the smart city planner be looking for?
Existing geospatial and data management tools already address many of these challenges, and when an opportunity for a technology refresh is presented, the approach to smart city support should be a big part of the mix.
Christine Easterfield
Christine Easterfield is principal analyst for Cambashi. She has more than 20 years’ experience in the software business. Her experience has covered geospatial asset management for the utility industry: assessing market needs and opportunities, managing customer requirements, liaising with development teams and running global product introduction programs.
Previous roles include programming, training, consultancy and product marketing management.
She has worked for a range of companies from multinationals to small start-ups, resulting in an understanding of how different sized organisations operate, grow and manage change. Christine has a BSc in Computational Sciences and an MA in English Literature.
Story maps combine geographic data withmultimediato tell a story and present information in a useful, interesting way.
While many story maps are designed for general, non-technical audiences, some story maps can also serve highly specialized audiences. They use the tools of GIS, and often present the results of spatial analysis, but don’t require their users to have any special knowledge or skills in GIS.
“Story maps use geography as a means of organizing and presenting information. They tell the story of a place, event, issue, trend or pattern in a geographic context,” explains Esri’s press staff in a blog. “They combine interactive maps with other rich content — text, photos, illustrations, video and audio — within intuitive user experiences.”
Haven’t yet dipped your toe into Story Maps? This Esri blog takes users through story map creation step by step.
Below are six visual narratives that provide timely information using Esri’s Story Map creation tools.
Faces Show Personal Impact of Opioid Epidemic
The National Safety Council is adopting the Celebrating Lost Loved Ones map, which allows family and friends of those lost to the opioid epidemic to place an image and description of their late loved one on an interactive map. The project helps raise awareness of the broad impact of the opioid crisis and advances the council’s mission of ending opioid deaths. Unintentional opioid overdose deaths totaled 37,814 in 2016.
Jeremiah Lindemann, a solution engineer for Esri, created the map in 2016 following the death of his younger brother. Since its launch, the map has gathered more than 1,300 memorials from people across the U.S.
The map has been a crowdsourced effort, allowing grieving friends and family members to honor their loved ones, share their stories with others and find a supportive community in return.
Communities Potentially Affected by DACA Policy Changes
When elected officials talk about changing our immigration system, just who and where are people affected? That’s the question Esri is trying to help answer with a new interactive story map that explores communities with the highest shares of non-citizen residents and DACA (Deferred Action for Childhood Arrivals) recipients.
The map shows estimates on DACA eligible, recipients, and annual GDP loss from removing DACA workers by congressional district. Data comes from USC’s Dornsife Center for Immigrant Integration.
The size of the symbol shows the estimate of DACA recipients, and the color of the symbol shows the estimated GDP loss from removing DACA workers. This map shows that the economies of many states in the Southwest and several major urban cities could be substantially disrupted if DACA recipients are no longer permitted to work.
The Ever-Changing Minimum Wage
National, state and local government policies toward the minimum wage vary widely and are continually changing. On Jan. 1, new or adjusted minimum wage policies took effect in 18 states and territories. Varying rates, policies, and impacts across the nation make it challenging to understand the minimum wage landscape.
This Esri story map provides an overview of the the nation’s changing minimum wage policies. A few notable findings:
At the highest level, the variability of minimum wage policies from state to state is striking — this ranges from some states in the South that don’t even require a minimum wage, to places like D.C. that have a $12.50 minimum wage (currently the highest for a state or territory).
Similarly, the number of cities and counties that have taken it upon themselves to raise wages locally is impressive; these cities and counties have robust plans for raising minimum wages over the next few years.
Regardless of an area’s minimum wage, all states fail to guarantee minimum wages that actually match up to the cost of living for their respective areas. As such, there is a growing divide between states that have raised minimum wages and are at least bringing minimum wages closer to the cost of living, versus those states that are slower to raise minimum wages (or don’t raise wages at all) and fall much further below the local cost of living.
Even while minimum wages have nominally increased, inflation has devalued the dollar in such a way that even in 2018 some wages today have less purchasing ability than nominally lesser wages in the 1970s.
Ireland Encourages Emmigrees to Come Home
Like much of Ireland, the history of County Donegal is inextricably wedded to the geography of migration. Now county officials are using a story map to try and woo émigrés back to the Emerald Isle.
The Irish government views the loss of its citizens so seriously that a minister for diaspora affairs was appointed to the Irish cabinet in 2014.
“Ireland’s Call — To Return Its Global Diaspora Home” displays key factors to assist those in contemplating returning. The story map launches the Global Skills Locator to link its global diaspora with job opportunities back home.
Smart City 3.0 Book Explained
Esri China (Hong Kong) Limited uses the story map tools in a unique way — to highlight its new book Smart City 3.0. The book and map discuss artificial intelligence, the internet of things, robotics and the sharing economy, and how all of them are shaping a new phase of development for the smart city.
Hurricane Harvey’s Lasting Effects
Within cities, poor communities often live in segregated neighborhoods with higher flood risks. This is especially true in Houston, where Hurricane Harvey hit this past August.
As in previous disasters like Katrina and Sandy, the heaviest cost of Harvey’s destruction is likely going to be borne by the most vulnerable communities in its path.
Humanitarian aid organization Direct Relief’s interactive Esri maps used the Centers for Disease Control and Prevention’s social vulnerability index to show the geographic distribution of households with elderly or disabled members (in orange), immigrant and limited English-speaking populations (in purple), and pockets of poverty (in green). The darker the color, the higher the concentration of these factors in each region.
Learn more about story maps and how to create them here.
The Open Geospatial Consortium (OGC) is seeking interested sponsors to define the challenges for Phase 2 of its Future Cities Pilot Project.
As the operation and planning of cities increasingly relies on 3D geo-information in their processes, and apply Building Information Models (BIM) paradigms to their information management approach, efficient information flow in both directions between geospatial systems (GIS) and the architecture/engineering/construction (AEC) systems becomes increasingly important. This requires data to be interoperable, which requires common — and ideally open — standards.
Completed in 2017, the Future City Pilot, Phase 1 (FCP1) demonstrated that interoperability between CityGML and BIM Industry Foundation Classes (IFC) works well in practice, and showed clear benefits in three use cases: urban planning; social care; and flood modelling. However, to achieve success, a significant amount of manual intervention needed to be employed.
Phase 2 of the Future City Pilot (FCP2) aims to improve the automation of the flow of data, as well as address a number of related interoperability challenges, including:
Comparing data conversion with data linking approaches;
Looking at tools that consume both CityGML and BIM structured data;
Data structures that support the seamless integration of GIS data and BIM data;
Linking real-time sensor information with 3D City Models encoded as CityGML;
Security models to protect the sensor readings, including Single-Sign On (SSO) methodologies to protect parts of the 3D City Model;
Understanding where and how we must capture location and time information: the ability to correlate location in different coordinate reference systems (CRS) such as local, regional, global, and understand if, and how, the integrity of the location data has changed through that process (Survey4BIM use case); and
Data linking to facilitate asset management over dispersed geographies.
Below is a video summary of FCP1.
The Engineering Reports documenting the main outcomes of FCP1 are available.
Sponsorship of the Future City Pilot will provide the following benefits to sponsoring organisations:
Assess and affect market direction based on sponsor needs;
Visibility as global leader in information technology critical to deploying smarter cities;
Amplification of funding by multiple sponsors’ to solve common/similar problems;
Leveraging effort up to 3.5 times based on participant in-kind;
Accelerated process – workable interface specifications in 4-6 months;
Follow-on procurements using standards-based architecture proven in the pilot;
These Innovation Program pilots help feed into the consensus standards process of OGC’s Standard Program; and
Leading the way to safer and more efficient cities.
There are three main deliverables resulting from an OGC pilot:
Testing of running software from several organizations to ensure interoperability of the independently developed implementations based on open standards;
Demonstration of policy-oriented scenarios with the deployed code. These scenarios show the previously unavailable capability from a non-technical point of view;
Documentation of the results of the architecture, testing, and demonstration. The reports may then become the basis of procurement activities of the operational system.
The scope of this pilot as currently planned will include the demonstration of a common architecture and data model in multiple cities. The number of cities used for the demonstration will depend upon the sponsor requirements.
If you want an innovative solution to your organisation’s Geospatial & BIM data interoperability problem, OGC urges you to contact Bart De Lathouwer, director of OGC’s Innovation Program.
Columbus, Ohio, has positioned itself smartly for an autonomous future, taking a lead role in pilot projects on infrastructure and autonomous air and road transport.
The city will draw on up to $40 million in grants from the U.S. Department of Transportation, $10 million from Vulcan, Inc,. and $500 million in local private pledges.
Carla Bailo, assistant vice president for mobility research and business development at Ohio State University (OSU), presented the city’s ambitious program at ION GNSS+.
In “Position, Navigation and Timing — An Enabling Technology for Mobility and Smart Cities,” she focused on a triple-zero target: zero accidents and fatalities, zero carbon footprint and zero stress.
Smart Columbus will put six autonomous shuttle buses in the commercial district, coordinate truck platooning, time deliveries and manage parking to reduce congestion, and undertake drone delivery of medical supplies and other critical needs. Multimodal transit apps, mobility assistance for those with disabilities and pedestrian collision avoidance will be based on real-time data on transit options and availability, as well as traffic information, road and weather conditions.
Position, navigation and timing (PNT) technologies play a central role in smart cities: vehicle-to-vehicle and vehicle-to-infrastructure communication, autonomous navigation and collision avoidance, location-based services and smart, resilient infrastructure.
Smart Columbus envisions the city as a center for high-tech transportation research and innovation. OSU’s partnerships with mobility companies and vehicle manufacturers, industry groups and government agencies contribute to the city’s comprehensive approach to the smart city project. Through its expertise in sensors, communication, PNT, transportation, autonomous and connected vehicles, and geospatial science and engineering, OSU will serve as the lead researcher on Smart Columbus.
Dorota Grejner-Brzezinska, OSU professor and frequent contributor to GPS World, in her new role as associate dean for research at OSU’s College of Engineering will be a key participant in research projects on ways to integrate self-driving cars, deliver high-definition 3D maps and metadata, use sensors to better connect vehicles for safety and efficiency, and find better ways to move people around the city when they don’t have access to a car.
Intergeo 2016 host DVW German Society for Geodesy, Geoinformation and Land Management gathered together experts from the worlds of business, public authorities and science to talk about this year’s key topic of the show: the “smart city.” Held in April at Hamburg’s Agency for Geoinformation and Surveying, the event focused on what an intelligent, digital city might look like and what role geoinformation would play as cities and metropolitan regions become “smart.”
Intergeo 2016, the leading international event for the geospatial community, will be held Oct. 11-13 in Hamburg, Germany, and also will focus on smart cities as a multi-faceted issue to shape the future.
During the preview, attendees agreed that cities must, and will, become more intelligent because of the benefits it has to society, Intergeo officials say in a May news release.
“They all agreed that the increasing penetration of digital technologies into cities is not an end in itself.” Intergeo says in the news release. “First and foremost is the common good of society and the advantages that digitalization offers inhabitants. This will ensure that cities can be run on a more intelligent basis and thus become a sustainable living space. The preview participants felt that smart geodata was an essential prerequisite in this regard.”
The host city for Intergeo 2016, Hamburg has been quick to position itself with “Hamburg’s Strategy for the Digital City,” which aims to develop a standardized smart city strategy. Key areas include mobility, energy, business and work, accommodation and city life. The city’s residents also will be involved in the strategy.
The roll-out of intelligent solutions for individual segments of the city is done in dialogue with residents, politicians, administrators, business people and scientists. Taking traffic as an example, smart mobility concepts are designed to improve the flow of traffic so as to minimize the delays caused by congestion while also lowering CO2 emissions, Intergeo says. Measures of a smart city include intelligent transport systems, semi-automated vehicle guidance, sharing concepts, intelligent parking facility management, apps for inhabitant participation and city planning processes that help to avoid traffic in the best-case scenario.
Everyone at the preview agreed that a standardized language must be developed and understood if forward-looking, complex processes such as the development of an intelligent digital city are to be successfully rolled out, according to Intergeo.