Tag: Todd Humphreys

  • Going Up Against Time: The Power Grid’s Vulnerability to GPS Spoofing Attacks

    By Daniel P. Shepard, Todd E. Humphreys, and Aaron A. Fansler

    Spoofing tests against phasor measurement units demonstrate their vulnerability to attack. A generator trip in an automatic control scheme could be falsely activated by the GPS spoofing, possibly leading to cascading faults and a large-scale power blackout.


    As electric power grids continue to expand throughout the world and as transmission lines are pushed to their operating limits, the dynamic operation of the power system has become a serious concern and increasingly difficult to accurately model. More effective real-time system control is now seen as key to preventing wide-scale cascading outages like the 2003 Northeast Blackout.

    For years, electric power control centers have estimated the state of the power system (the positive sequence voltage magnitude and phase angle at each network node) from measurements of power flows. But for improved accuracy in the so-called power system state estimates, it will be necessary to feed existing estimators with a richer measurement ensemble or to measure the grid state directly.

    Alternating current (AC) quantities have been analyzed for over 100 years using a construct developed by Charles Proteus Steinmetz in 1893, known as a phasor. In power systems, the phasor construct has commonly been used for analyzing AC quantities, assuming a constant frequency. A relatively new synchronization technique which allows referencing measured current or voltage phasors to absolute time has been developed and is currently being implemented throughout the world. The measurements produced by this technique are known as synchronized phasor measurements or synchrophasors.

    Synchrophasors provide a real-time snapshot of current and voltage amplitudes and phases across a power system, and so can give a complete picture of the state of a power system at any instant in time.  This makes synchrophasors useful for control, measurement, and analysis of the power system.

    A device used to measure synchrophasors is called a phasor measurement unit (PMU). In a typical deployment, PMUs are integrated in protective relays and are sampled from widely dispersed locations in the power system network. They are synchronized with respect to the common time source of a GPS clock. PMUs basically measure AC voltage (or current) and absolute phase angles at selected locations in an electric transmission or distribution system.

    GPS Spoofing

    GPS spoofing is the act of producing a falsified version of the GPS signal with the goal of taking control of a GPS receiver’s position-velocity-time (PVT) solution. This is most effectively accomplished when the spoofer has knowledge of the GPS signal as seen by the target receiver so that the spoofer can produce a matched, falsified version of the signal. In the case of military signals, this type of attack is nearly impossible because the military signal is encrypted and therefore unpredictable. On the other hand, the civil GPS signal is publicly-known and readily predictable.

    In recent years, civil GPS spoofing is becoming recognized as a serious threat to many critical infrastructure applications which rely heavily on the publicly-known civil GPS signal. A number of promising methods are currently being developed to defend against civil GPS spoofing attacks, but it will still take a number of years before these technologies mature and are implemented on a wide scale. Currently, there is a complete absence of any off-the-shelf defense against a GPS spoofing attack.

    See “Generation, Transmission” sidebar at the end of this article for background on the following tests.

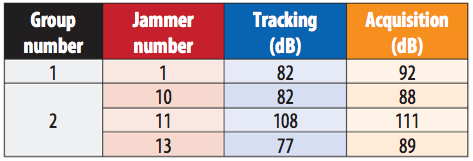
    The Tests. The minimum threshold for success was to show that a GPS spoofer could force a PMU to violate the IEEE C37.118 Standard “Synchrophasors for Power Systems,” which defines accuracy as a vectorial difference between the measured and expected value of the phasor for the measurement at a given instant of time, called the total vector error (TVE).  TVE blends three possible sources of error: magnitude, phase angle, and timing. An error in timing appears identical to an error in phase angle. Without timing and magnitude errors, a phase angle error of 0.573o corresponds to a 1 percent TVE, the maximum allowable by the IEEE C37.118 Standard. This phase angle error could be equivalently and indistinguishably caused by a timing error of 26.5 µs, which was chosen as the threshold for success in the spoofing tests.

    The Spoofer

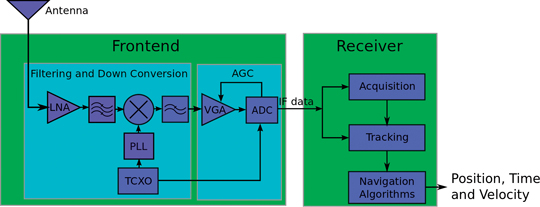
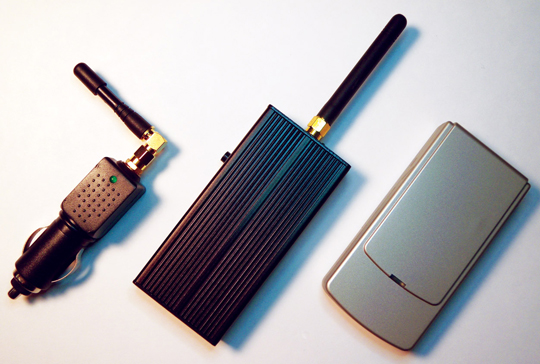
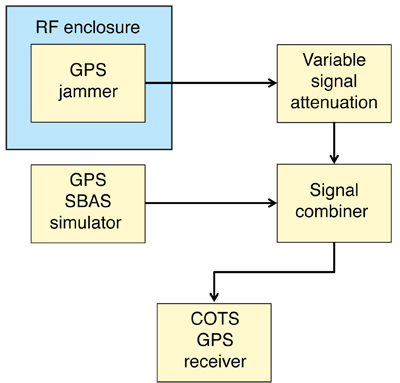
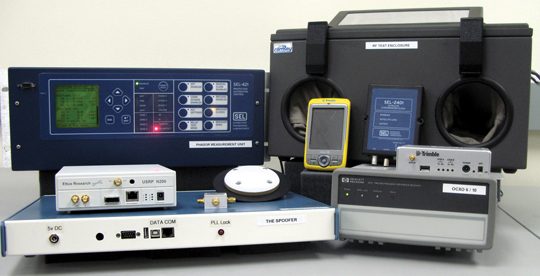
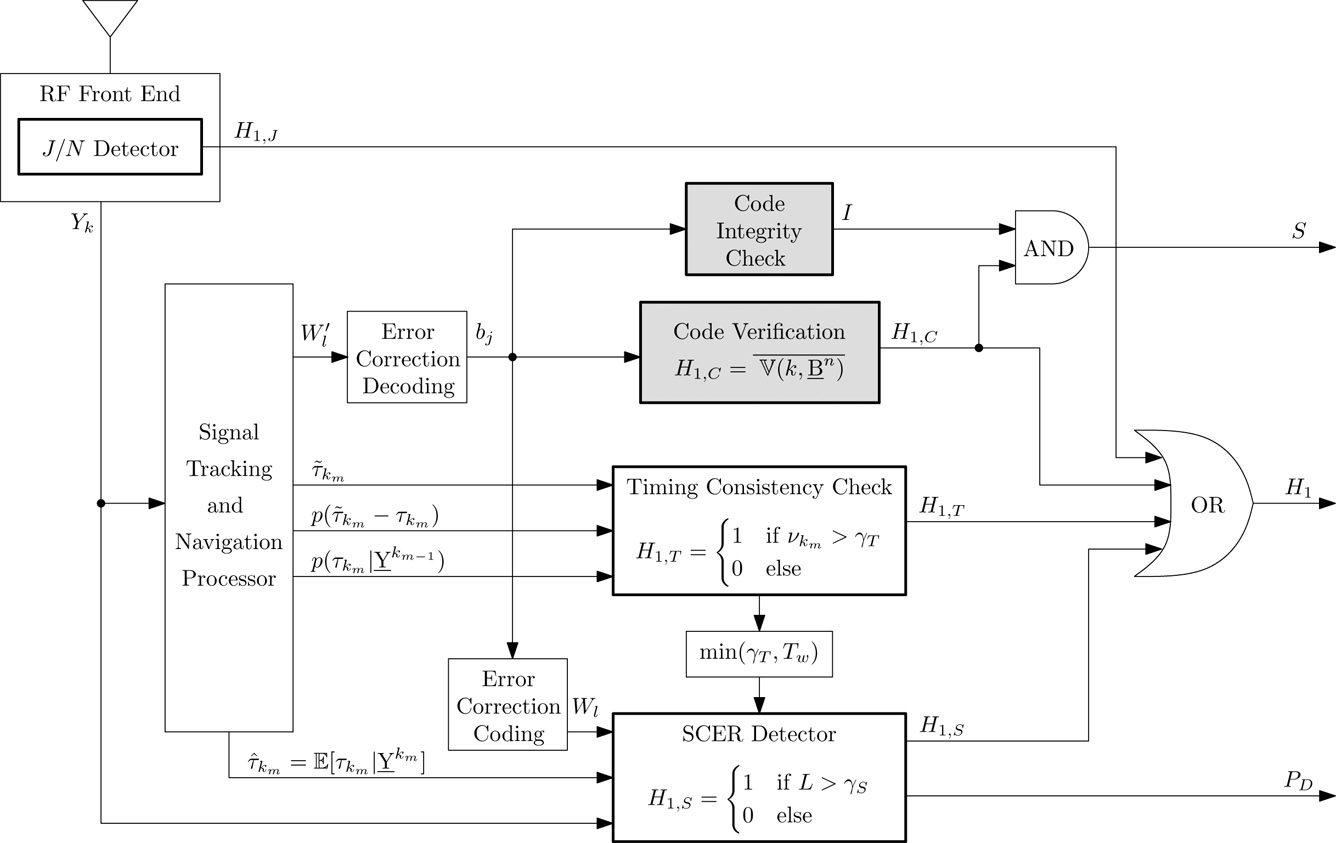
    The civil GPS spoofer used for these tests is an advanced version of the spoofer reported in “Assessing the Spoofing Threat,” GPS World, January 2009. A block diagram of the spoofer is shown in Figure 1. It is the same spoofer used in the tests described in “Drone Hack” in this issue of the magazine, and a detailed description is given in that article.

    The spoofer can carry out a sophisticated spoofing attack in which no obvious clues remain to suggest that an attack is underway. The University of Texas spoofer and attack strategy have been tested against a wide variety of GPS receivers and has always been successful in commandeering the target receiver.

     Figure 1. Block diagram of the University of Texas spoofer used to attack the phasor unit.
    Figure 1. Block diagram of the University of Texas spoofer used to attack the phasor unit.
    Test Setup

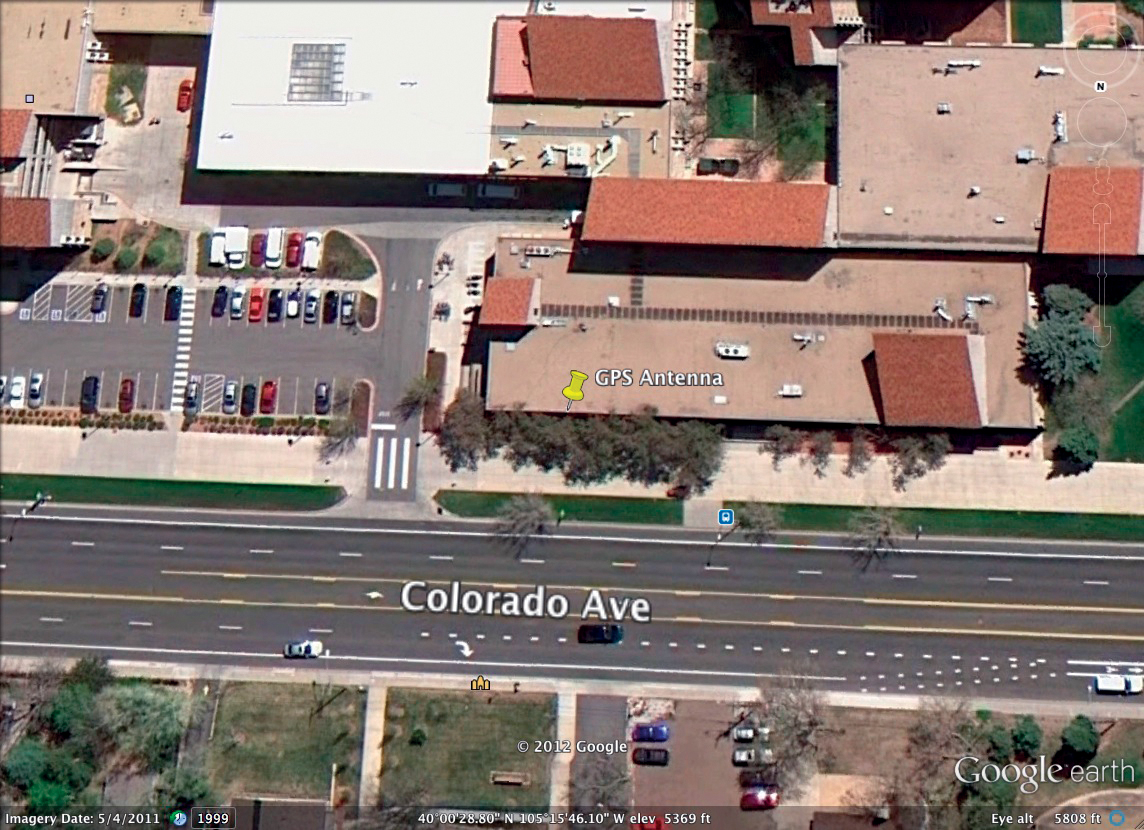
    Figure 2 shows a schematic of the setup used for the open-air tests. The signals received at the roof were routed into the spoofer for use in producing the counterfeit signals and into the RF shielded tent for rebroadcasting. The counterfeit signals were also routed into the tent for broadcasting. In addition to the antennas broadcasting the authentic and counterfeit signals, a third antenna was setup inside the tent to receive the combination of authentic and spoofed signals. This setup is representative of an actual attack scenario where the malefactor does not have physical access to the victim receiver’s antenna input but rather broadcasts the spoofed signals over-the-air. For cable-only tests, the entire setup inside the tent was replaced with a signal combiner that summed the authentic and spoofed signals.

    Figure 2. Schematic of the test setup.
    Figure 2. Schematic of the test setup.

    The combined authentic and spoofed signals were fed to the victim GPS time reference receiver. The output timing signal from the victim receiver was used as the synchronization reference for one PMU, whereas a second PMU was given timing from a separate GPS time reference receiver that was tracking only authentic GPS signals. Since the PMUs were in the same room and measured the local voltage and carrier phasors, both PMUs would report roughly the same phasor measurements under normal circumstances. Thus, any significant differences in the phase angle measurements between the two PMUs could be attributed to the effects of spoofing.

    Test Results

    Both the cable-only and the over-the-air spoofing attacks were successful in leading the PMU phase measurements off from the truth. Figure 3 shows the measured phase angle difference between the reference PMU, which was fed the true GPS signal, and the spoofed PMU throughout one entire test. This value would normally be less than a few degrees in the absence of spoofing, since the two PMUs are co-located. After the initial ten minute capture-and-carry-off, which proceeds slowly to avoid detection, the spoofer accelerates its carry-off and the reference and spoofed phase angles quickly diverge.

    Figure 2. Schematic of the test setup.
    Figure 3. A plot of the phase angle difference between the reference and the spoofed PMUs. Normally the phase angle difference would be nearly zero in the absence of a spoofing attack. Point 1 marks the start of the test. Point 2 marks the point at which the spoofer has completely captured the victim receiver. Point 3 marks the point at which the IEEE C37.118 Standard has been broken. Point 4 marks the point at which the spoofer-induced velocity has reached its maximum value for the test. Point 5 marks the point at which the spoofed signal was removed.

    Figure 4 shows pictures of an oscilloscope and the Synchrowave screen at the start of the test. The oscilloscope shows two pulse-per-second (PPS) signals, with the upper yellow pulse coming from a reference clock being fed true GPS and the lower blue pulse coming from the spoofed timing receiver. Both PPS signals are initially aligned with each other. The Synchrowave screen displays the PMU phase angle data in real-time as phasors with the nominal 60 Hz operating frequency subtracted from the phase angle. The red and green phasors show the phase data from the reference and spoofed PMUs respectively. These phasors are within a few degrees of each other at the beginning of the test.

     Figure 4. Oscilloscope (left) and Synchrowave (right) screen at the start of the test, which is marked as point 1 in Figure 3.
    Figure 4. Oscilloscope (left) and Synchrowave (right) screen at the start of the test, which is marked as point 1 in Figure 3.

    Figure 5 shows pictures of the Oscilloscope and the Synchrowave screen at about 620 seconds into the test. At this point, the spoofer has moved the victim receiver 2 µs off in time and has completely captured the receiver.  The delicate initial capture-and-carry-off is performed at a slow rate to suppress any evidence of the spoofer’s presence. However, this process could be done quicker because the receiver was not looking for such evidence of foul play. At this stage of the test, there is not yet any significant difference between the two phasors on the Synchrowave screen, since the spoofed time offset remains relatively small. The oscilloscope, however, reveals that the PPS output from the victim receiver has moved by about 2 µs relative to the reference PPS. At this point, the spoofer begins to accelerate the victim receiver’s time solution at a distance-equivalent rate of 4 m/s2 until it reaches a final distance-equivalent velocity of 1000 m/s. Distance-equivalent velocity can be converted into the actual time rate of change of time by dividing by the speed of light.

     Figure 5. Oscilloscope and Synchrowave screen at about 620 seconds, point 2 in Figure 3.
    Figure 5. Oscilloscope and Synchrowave screen at about 620 seconds, point 2 in Figure 3.

    The acceleration segment of the attack must be tailored to the individual receiver’s ability to track the spoofer-induced dynamics. Otherwise, the spoofer risks losing control of the victim receiver’s tracking loops by moving too quickly for the receiver to track or by raising alarms. Alternatively, a malefactor could survey possible GPS time reference receivers that might be used and tailor the spoofing attack such that any of the receivers would track and believe the spoofed signals. This would place severe limits on the spoofer’s ability to manipulate timing, but would not make the attack impossible or implausible.

    Figure 6 shows the oscilloscope and Synchrowave screen at about 680 seconds into the test. At this point, the spoofer has broken the IEEE C37.118 Standard for PMUs, which requires accuracy in the measured phase angle of 0.573o. This demonstrates a significant vulnerability for PMU-based monitoring and control, since these applications leverage the accuracy supposedly guaranteed by the standard. There is yet no noticeable difference on the Synchrowave screen, but the oscilloscope clearly shows that the victim receiver has now been offset in time by about 20 µs.

     Figure 6. Oscilloscope and Synchrowave screen at about 680 seconds, point 3 in Figure. 3.
    Figure 6. Oscilloscope and Synchrowave screen at about 680 seconds, point 3 in Figure. 3.

    Figure 7 shows pictures of the oscilloscope and the Synchrowave screen at about 870 seconds into the test. At this point, the spoofer has reached its final velocity of 1000 m/s. A phase angle offset of 10o has also been introduced in a matter of minutes. As expected, there is a marked difference in the phasors on the Synchrowave screen. The oscilloscope also shows a time offset of 400 µs has been induced in the victim receiver.

     Figure 7. Oscilloscope and Synchrowave screen at about 870 seconds, point 4 in Figure 3.
    Figure 7. Oscilloscope and Synchrowave screen at about 870 seconds, point 4 in Figure 3.

    Figure 8 shows pictures of the oscilloscope and the Synchrowave screen at about 1370 seconds into the test. At this point, the spoofed signal was heavily attenuated and instantly realigned with the authentic signals. This was intended to be the end of the test, but when this particular receiver lost lock on the signal it continued to send out a valid time signal to the PMU while fly-wheeling off its internal clock. This caused an alarm to issue on the front panel of the time reference receiver indicating loss of GPS signal lock. The downstream PMU, however, was oblivious to this loss of lock. This state persisted for about half an hour before the clock finally reacquired the authentic signal and instantly realigned its time output, which caused the phasors to realign.  Figure 3 does not show the phase angle data for this entire period, but does show that the phase angle difference exceeds at least 70o before the time reference receiver reacquires the authentic signal.

     Figure 8. Oscilloscope and Synchrowave screen at about 1370 seconds, point 5 in Figure 3.
    Figure 8. Oscilloscope and Synchrowave screen at about 1370 seconds, point 5 in Figure 3.
    Implications

    Synchrophasor data provides a clear picture of the state of the power system in real-time. As the size of the power grid grows and stability margins are reduced (to provide more efficient distribution of power), it will become desirable to use synchrophasors for control purposes. PMU manufacturers are currently selling PMUs capable of implementing automated control schemes that offer response times less than 4 cycles.  Such swift response times are seen as necessary to prevent grid instability or damage to equipment.

    Control schemes based on synchrophasors rely on phase angle differences between two nodes as an indicator of a fault condition. One example of a currently operational synchrophasor-based control system is the Chicoasen-Angostura transmission link in Mexico. This transmission line links together large hydroelectric generators in Agostura to large loads in Chicoasen through two 400-kV transmission lines and one 115-kV transmission line. If a fault occurs in which both of the 400-kV lines are lost, then the hydroelectric generators may experience angular instability. In order to prevent this, a PMU was set up at each end of the transmission lines with a direct communications link between them. It was found that under nominal and single-fault (only one 400-kV line lost) conditions, the phase angle difference between the two locations was less than 7o, whereas a double-fault (both 400-kV lines lost) produced a phase angle difference of 14o. Based on this finding, the PMUs were configured so that if the phase angle difference exceeded 10o, the hydroelectric generators would be automatically tripped.

    If a spoofer were to attack this system in Mexico or a similar implementation elsewhere, then the spoofer could cause a generator trip. In the test described in the previous section, a 10o offset, the threshold for the Chicoasen-Angostura link, was induced by the spoofer about 250 s after capturing the target receiver, as seen in Figures 3 and 7. A malefactor could even lead the phase angle off in the opposite direction (say 7o) before cutting both 400-kV transmission lines. Instead of causing a generator to unnecessarily trip, this would prevent PMUs from tripping the generator when required and potentially cause damage to the generator or remaining transmission lines.

    Beyond tripping a single generator, there is potential for the effects of the attack to propagate through the grid and cause cascading faults across the grid. One example of this type of cascading failure is the 2003 Northeast blackout. Although this blackout did not involve PMUs or a spoofing attack, it demonstrates how an appropriately targeted attack against PMUs used for control on the power grid could cause large scale blackouts that originate with a single generator or transmission line trip.

    On August 14, 2003, at 3:05 p.m., a 345-kV transmission line in Ohio began to sag from increased flow of electric power. When the line sagged too close to a tree, it caused a short-to-ground and tripped offline. This is something that happens fairly frequently on the massive U.S. electrical grid and is usually easily dealt with. However, the tripping of that line in northern Ohio began a cascade of failures that, in a little more than an hour, led to a near total power loss for more than 50 million people in the northeastern U.S. and parts of Canada.

    The blackout is estimated to have cost approximately $6 billion for only four days of power loss. This led the Department of Energy and the North American Electric Reliability Corporation (NERC) to fund and push for an improved “smart grid” with synchrophasor technology as a major component.

    As previously pointed out, PMUs are high-speed, real-time synchronized measurement devices used to diagnose the health of the electricity grid. With synchrophasor data, electric utilities can use existing power more efficiently and push more power through the grid while reducing the likelihood of power disruptions like blackouts. Synchrophasor measurements are being looked at to reduce the likelihood of false and inappropriate triggers of transmission system circuit breakers that protectively shut down electrical flow and contribute to cascading blackouts. However, GPS spoofing poses a significant threat to these objectives for PMUs and can make synchrophasor-based control the cause for these events instead of the cure.

    Conclusions

    Spoofing poses a threat to the integrity of synchrophasor measurements. A spoofer can introduce a time offset in the time reference receiver that provides the timing signal for a PMU without having physical access to the receiver itself. This produces a corresponding phase offset in the synchrophasor data coming from that PMU. Tests demonstrated that a PMU could be made to violate the IEEE C37.118 Standard for synchrophasors in about 11 minutes from the start of a spoofing attack.

    As PMU usage continues to grow throughout the world, PMUs will increasingly be used for automatic control purposes instead of just grid monitoring. The tests described here demonstrate that a spoofer could cause control schemes to falsely trip a generator.  In the presence of other exacerbating factors, this could lead to a cascade of faults and a large scale blackout.


    Daniel P. Shepard is pursuing M.S. and Ph.D. degrees in aerospace engineering at the University of Texas at Austin. He is a member of the Radionavigation Laboratory.

    Todd E. Humphreys is an assistant professor of aerospace engineering and engineering mechanics at the University of Texas at Austin and director of the Radionavigation Laboratory. He received a Ph.D. in aerospace engineering from Cornell University.

    Aaron A. Fansler serves as cyber critical infrastructure protection (CCIP) program manager for Northrop Grumman Information System. He obtained a Master’s degree from Capitol College in information assurance and is currently working on a Ph.D. in that field.


    Generation, Transmission

    The generation, transmission, and distribution of electric power make the power grid the most critical of critical infrastructures in the United States. Past events and numerous government demonstrations have shown just how vulnerable the power grid can be, not only to natural disasters, but more importantly to malicious cyber activity, which is on the rise.  Past consequences of power disruption were annoyance and some economic cost; future disruptions from intentional malicious activity could cascade into crippling failures. Cyber threats now rival the consequences of physical attacks.

    Over the past decade, the power industry has seen an explosion in the use of accurate, synchronized time incorporated into its controlling networks. Accurate timing signals are exploited in power systems from the generation plant down to the distribution substation and now down to individual smart grid component.

    The value of time synchronization is best understood by recognizing that the power grid is a single, complex, interconnected, and interdependent network. What happens in one part of the grid affects operation elsewhere, and in other systems reliant on stable power, as was observed in the 2003 Northeast Blackout.

    With the transition to smart technologies and a unified, synchronized grid, the potential for catastrophic cascading failures increases if proper control measures are not implemented. Time-synchronized measurements are changing the way electric power systems are controlled to protect against these events. Phasor measurement units (PMUs) have recently emerged as one technology which has the potential to one day anticipate failures, making it possible to take remedial actions before failures spread across the network.

    PMUs rely on GPS to provide accurate, synchronized time across the power grid. This reliance creates a vulnerability to a particular type of malicious attack: GPS spoofing. Spoofers generate counterfeit GPS signals that commandeer a victim receiver’s tracking loops and induce spoofer-controlled time or position offsets. The 2001 USDOT Volpe Report noted the absence of any off-the-shelf defense against civilian spoofing. In 2008, researchers demonstrated that an inexpensive portable software-defined GPS spoofer could be built from off-the-shelf components.

    Northrop Grumman Information Systems (NGIS) and the University of Texas (UT) conducted a functional test and evaluation of the effects a spoofed GPS timing signal would have on synchrophasors, to determine if adverse effects could be produced on a sensitive timing-signal-dependent network such as a Supervisor Control and Data Acquisition (SCADA) network and the network devices such as PMUs. This article describes the test.

  • Detecting False Signals with Automatic Gain Control

    By Holly Borowski, Oscar Isoz, Fredrik Marsten Eklöf, Sherman Lo, and Dennis Akos

    A component of most GPS receiver front-ends, the automatic gain control (AGC) can flag potential jamming and spoofing attacks. The detection method is simple to implement and accessible to most GPS receivers. It may be used alone or as a complement other anti-spoofing architectures. This article presents results from a baseline AGC characterization, develos a simple spoofing detection method, and demonstrate the results of that method on receiver data gathered in the presence of a live spoofing attack.

    Growing reliance on GNSS also creates the need to defend against those with the ability to exploit its weaknesses. Specifically, GNSS signal spoofing is recently a growing concern, as an effective spoofing attack can fool a GNSS receiver into producing erroneous navigation and timing information. Although applicable to many GNSS, GPS will be used as the example.

    One example of spoofing seen recently in the popular press was the Iranian claims of bringing down a U.S. unmanned aircraft via a GPS spoofing attack. Although this may be unfounded given the complexity required, spoofing attacks to autonomous vehicles are emerging threats. A second hypothetical example is a fisherman whose location is monitored using GNSS may be motivated to use spoofing, such that illegally fishing in protected waters is not detetcted, increasing profits.

    GPS signals received by a traditional hemispherical antenna are below the thermal noise floor, a physical constant dependent only on temperature. Although multiple signals are transmitted at low power in the same frequency band, they can be acquired and tracked using code-division multiple-access (CDMA). However, low signal power also makes GPS systems vulnerable to intentional radio-frequency interference (RFI) and the more sophisticated spoofing.

    Spoofers range from simple to sophisticated. For example, a simple spoofer may be built from a GPS repeater (known as meaconing) by simply using it to rebroadcast signals at a higher power than the authentic GNSS signals. Receivers close enough to these spoofers then acquire and track the stronger spoofed signal, producing an erroneous position/timing solution. In this case, a position jump is likely to occur in the victim receiver’s reported solution as it transitions from the true signals to the spoofed signal, alerting the user of a potential spoofing attack. Somewhat more complex than a simple repeater would be to broadcast signals from a GPS simulator, which would enable a threat with more control over the signal-to-noise ratios as well as the resulting position. Finally, a very sophisticated spoofing attack first introduced by Humphreys , et al. in 2008 may be implemented by placing a spoofer near the receiver, so that it can correctly align its transmitted false signals to the authentic ones seen by the victim receiver. The spoofer then gradually increases the power of its transmitted signals, eventually capturing the receiver. After the receiver begins tracking the false signals, the spoofer can gradually deviate its transmitted signals from the authentic ones, causing the victim receiver to produce false navigation and timing information. 

    Effective methods have been developed for distinguishing spoofed from authentic GPS signals with a summary most recently presented in a January 2012 GPS World article by Wesson, Shepard, and Humphreys. In short, these methods can be divided into cryptographic and non-cryptographic spoofing detection schemes.Unfortunately the presented methods are not readily available to the majority of current standalone GPS receivers and can be quite computationally expensive. 

    We suggest a method using the Automatic Gain Control (AGC), a component of most GPS receiver front ends, to flag potential jamming and spoofing attacks. The proposed spoofing detection method is simple to implement and accessible to most GPS receivers as a measure of confidence in the authenticity of received and tracked signals. It may be used by itself on receivers without other spoofing detection capabilities or to complement other anti-spoofing architectures.

    AGC Background

    GPS receivers consist of an analog portion and a digital portion: the analog signal, comprised nominally of GNSS signals and white Gaussian thermal noise, is received, amplified, down-converted, and filtered, then converted to a digital signal for processing within receiver acquisition and tracking loops. During signal sampling and quantization by the Analog to Digital Converter (ADC), some quantization losses will occur. These losses depend on the ratio between the ADC’s maximum quantization threshold, L, the number of bits utilized, and the incoming signal standard deviation, σ.

    This is where the AGC comes in. In a typical GPS receiver, it sits between the analog portion of the front end and the ADC, as shown in Figure 1. The AGC acts as a variable gain amplifier, adjusting the power of the incoming signal to optimize the L/σ ratio, minimizing quantization losses. This assumes the receiver is a multibit design which is the norm for GPS receivers today.

    Credit:  Holly Borowski, Oscar Isoz, Fredrik Marsten Eklöf, Sherman Lo, and Dennis Akos
    FIGURE 1. Typical GPS receiver architecture.

    When the GPS band is interference free, which should be the norm due to restrictions on emissions in and near the band, the AGC gain depends almost exclusively on thermal noise, since the received GPS signal power level is below that of the thermal noise floor. Since this thermal noise is a physical constant with minimal fluctuation resulting from the span of temperature variations on earth, the primary role of the AGC is to adjust to different active antenna gain values. However, in the unlikely presence of interference the AGC gain drops in response to increased power in the GPS band. Thus, AGC levels may be used to indicate potential interference. Moreover, AGC levels are expected to respond to the interference before receiver performance is compromised, so useful flags may be established, which could provide a warning before a problem exists.

    Baseline AGC Data Gathering

    Prior to the spoofer experiment, baseline AGC data were collected for 72 hours using both a survey grade and a mass market receiver. The GPS antenna was located on the roof of the Engineering Center at Colorado University (CU) in Boulder (Figure 2). 

    Credit:  Holly Borowski, Oscar Isoz, Fredrik Marsten Eklöf, Sherman Lo, and Dennis Akos
    FIGURE 2. Antenna location for baseline AGC data collection.

    Currently there is no standardization among GPS receivers for AGC reporting units or the measurement itself. Most receivers offer such a metric but it is likely that each needs to be interpreted individually. However, in general this metric provides an indication of the relative gain of the amplifier within the receiver. Should the active antenna be disconnected (loss of gain), the AGC metric will increase showing the increase in internal gain needed to compensate for the loss of the active antenna amplification of the thermal noise floor. Should additional energy be detected in band, the internal gain will decrease accordingly.

    Baseline AGC levels from the survey grade and mass market receiver are shown in Figures 3a and 3b, respectively. The survey grade receiver AGC measurement was more sensitive to changes in the nominal environment; these results will be discussed later in more detail. The mass market receiver provided a much more consistent measure for the entire test period. Interestingly, there was one brief yet noticeable drop in AGC metric from the survey grade and mass market receivers at approximately hour 59 into the collection. Its magnitude was not overly significant, as it did not have an impact on the availability or accuracy of the position solution measurements from either receiver. It is assumed that this is a brief RFI event that occurred during the collection, perhaps from an illegal personal privacy device (PPD) in a vehicle on the nearby road.

    Credit:  Holly Borowski, Oscar Isoz, Fredrik Marsten Eklöf, Sherman Lo, and Dennis Akos
    FIGURE 3A. Nominal AGC values for survey-grade receiver
    Credit:  Holly Borowski, Oscar Isoz, Fredrik Marsten Eklöf, Sherman Lo, and Dennis Akos
    FIGURE 3B. Nominal AGC values for mass-market receiver.

    This RFI event outlier was excluded from the computed mean and standard deviation from the receivers’ AGC data. As shown in Figure 4a, the mean reported AGC gain was approximately 2510, and its standard deviation was approximately 99. For the mass market receiver, the data shows clear evidence of quantiztion in Figure 4b. Here the mean AGC level in this test was approximately 5432, standard deviation was approximately 64. Again, the absolute measures mean little and cannot be compared from various vendors of receivers. It is, of course, possible to calibrate individual receivers and obtain an absolute measure should this be required for a specific application. During the baseline data collection receiver reported position solutions were nominal, with deviations on the order of 2-3 meters in east and north directions, and 5-6 meters in the vertical direction for both receivers. A Gaussian curve was fit to the AGC data and although the data may not be well modeled by a Gaussian, a 2x standard deviation will be used to establish a quick initial flag to indicate potential spoofing/interference. 

    Credit:  Holly Borowski, Oscar Isoz, Fredrik Marsten Eklöf, Sherman Lo, and Dennis Akos
    FIGURE 4A. Histogram of survey-grade AGC data.
    Credit:  Holly Borowski, Oscar Isoz, Fredrik Marsten Eklöf, Sherman Lo, and Dennis Akos
    FIGURE 4B. Histogram of mass-market AGC data.

    AGC Reactions to Live Spoofing

    Live RFI or spoofing experiments are quite difficult to conduct due to the global and national legislation protecting the GPS frequency band. Any such experiments tend to be conducted with significant advanced planning and in locations where the testing will have no impact on any system or application which uses GPS outside the test range. Thus, we are grateful to have been able to test the AGC detection of live transmissions in the GPS band. This was done at the Robotförsökplats Norrland test range in Northern Sweden (Figures 5A, 5B, 5C) with the support of the Swedish Defense Research Agency.

    Credit:  Holly Borowski, Oscar Isoz, Fredrik Marsten Eklöf, Sherman Lo, and Dennis Akos
    FIGURE 5A Robotförsökplats Norrland test range in Northern Sweden (green outline is the test range and red outline is the flight restriction area, approximate 130 x 70 kilometers).
    Credit:  Holly Borowski, Oscar Isoz, Fredrik Marsten Eklöf, Sherman Lo, and Dennis Akos
    FIGURE 5B Repeater spoofer transmission antenna.

    Credit:  Holly Borowski, Oscar Isoz, Fredrik Marsten Eklöf, Sherman Lo, and Dennis Akos
    FIGURE 5C. Test vehicle

    Dynamic GPS receiver measurements (position and AGC) from both the survey grade and mass market receivers were logged in the presence of repeater spoofing. Tests performed involved installing GPS antennas on the rooftop of a vehicle and driving along a 4km stretch of road toward (and away) from a hill top repeater spoofer transmission antenna while logging AGC levels and receiver positions from various GPS receivers. The data from both the survey grade and mass market receivers, used in the baseline collections, will be used here. The repeater spoofer source and transmissions antennas and the road (color shaded by elevation) used to go to/from the spoofer transmission antenna are shown in Figure 6

    Credit:  Holly Borowski, Oscar Isoz, Fredrik Marsten Eklöf, Sherman Lo, and Dennis Akos
    FIGURE 6. Google Earth view of testing environment.

    The baseline receiver data was used to establish the change in AGC levels necessary to flag potential jamming, spoofing, or unintentional RFI. In order to implement the AGC flag proposed in this paper, a known fixed RF chain (antenna, cable, and front end) would be calibrated in a known non RFI environment and the mean AGC would be established. Given the baseline data collection, a mean value has been established and a 2σ threshold is set as the RFI/Spoofing flag for each receiver. When the AGC drops below this flag, the resulting position/time solution should not be trusted.

    In Figure 7 the measurements (AGC metric and survey receiver reported position) are shown as a function of time as the receiver is driven toward the spoofer transmission antenna. Under nominal conditions (no RFI or spoofing) one would expect a constant “safe” AGC value as well as a smooth gradual change in the reported XYZ coordinates (as the drive maintained a constant speed on the road for the duration of the test). However, as expected, due to the additional power in the GPS band, the AGC gain drops as the receiver gets closer to the repeater spoofer. At approximately 138 seconds the receiver fails to report a position and this continues for the next 30 seconds as the vehicle progresses toward the spoofer transmission antenna. At approximately 168 seconds, the survey receiver is captured and reports the fixed position of the spoofer source antenna despite continually moving toward the transmission source. Although the loss of lock and position jump could be utilized as a flag for spoofer detection, the AGC metric here clearly shows the additional power in the band prior to any corruption of the reported GPS receiver position. If the previously computed threshold is used here, the 2σ trigger occurs as the AGC level begins to drop, significantly before any loss of lock or any change in the position solution resulting from the repeater spoofer. 

    Credit:  Holly Borowski, Oscar Isoz, Fredrik Marsten Eklöf, Sherman Lo, and Dennis Akos
    FIGURE 7. Survey-grade RX AGC/position during drive toward spoofer.

    Figure 8 shows this same data for the mass market receiver with similar observations. First, and most importantly, the AGC metric can be used here as a flag well before any corruption of the resulting position solution. The resulting position solution as the receiver becomes “captured” by the spoofer is odd, not going directly to the repeater source antenna location but also not maintaining the true position either. Likely a result of the navigation filtering coupled with individual range measurements transitioning from the true satellite measurements to that from the repeater spoofer. Nevertheless, it is clear from the AGC metric that the receiver output should not be trusted , well before any misleading information is provided.

     FIGURE 8. Mass-market RX AGC/position during drive to spoofer.
    FIGURE 8. Mass-market RX AGC/position during drive to spoofer.

    Figure 9 shows AGC levels and reported positions for the survey grade receiver as it is driven away from the repeater spoofer. At the beginning, the receiver is already captured by the spoofer and reports a false fixed position solution even while the vehicle is moving. While in close proximity to the spoofer, the AGC levels are low, attempting to compensate for the additional power in the GPS band. This would be an obvious flag that the resulting position cannot be trusted (all measurements to the left of the threshold are considered untrustworthy). As the receiver is driven away and exits the spoofer’s region of influence, power levels in the GPS band return to normal, the AGC reacts accordingly by increasing its gain, and the receiver begins to report accurate position solutions. 

    Credit:  Holly Borowski, Oscar Isoz, Fredrik Marsten Eklöf, Sherman Lo, and Dennis Akos
    FIGURE 9. Survey-grade RX AGC/position during drive from spoofer.

    Figure 10 shows this same data for the mass market receiver with similar observations. The AGC metric can be used as a flag indicating the position solution cannot be trusted until the receiver is well outside the range of the repeater spoofer. In this test, the AGC level does not return to a level within the established threshold, indicating that GPS solutions should not yet be trusted. This is likely a result of an overly conservative threshold (perhaps from the poor fit of data which is not well represented by a Gaussian) or perhaps hysteresis or smoothing in the AGC metric for this receiver.

    Credit:  Holly Borowski, Oscar Isoz, Fredrik Marsten Eklöf, Sherman Lo, and Dennis Akos
    FIGURE 10. Mass-market RX AGC/position during drive from spoofer.

    These cases are representative of similar repeater spoofing tests we performed: in all cases this trigger identified potential interference well before the receiver reported false positions with the simple triggers established. 

    Improvements and Optimizations

    These results do demonstrate the power of AGC to detect deception in GPS transmission, rendering these spoofers no more of a threat than the much less sophisticated jammers. However, the spoofer used in this testing was of a simple nature — a repeater spoofer.

    The challenge would be to utilize such an approach to detect the most sophisticated spoofing attacks. This should be possible as the underlying thermal noise floor is a physical constant and in order for a receiver to be spoofed additional energy must enter the RF chain which, again, should be detectable. The optimization will come in via establishing thresholds – similar to GPS signal acquisition/detection. One will not want to set such a loose threshold such that frequent false alarms provide little confidence in the resulting position/time solution. Likewise one would not want to establish threshold so loose that the more sophisticated spoofing attacks would be successful. The key is the calibration and assessment of the underlying AGC measurement.

    Recall the variation observed in the survey grade receiver data. Was this truly random noise that one must overbound as was done to establish the threshold for the experiments in this paper? And why were the noise levels so different for the baseline AGC collections in the survey grade and mass market receiver? We try to address both of these questions to provide a bit of insight into the advantages and shortcomings of the AGC metric.

    First, the AGC measurement across receivers is not equal. In comparing these two receivers, the survey grade receiver has a much higher resolution measurement than that of the mass market receiver. This is obvious from the baseline data which showed little deviation from specific quantized levels in the mass market AGC metric. So although the great majority of GPS receiver already have/report their AGC measurement it may not be of sufficient fidelity for the most sophisticated spoofer detection.

    Second, high resolution provides little benefit in a noisy measurement. So there is a pending question if there is a source for the variation in the AGC measurement for the survey grade receiver during the 72 hour baseline data collection – or was it simply a noisy measurement. Past work in this area led to the association of ambient temperature and the AGC measure, but perhaps not in the way one would initially think. Yes, the thermal noise level is dependent on temperature (from kTB), as well as bandwidth and Boltzmann’s constant, but this is really antenna temperature and in this case the correlation is with ambient temperature.

    The baseline AGC levels were compared to changes in ambient temperatures in Boulder during testing to determine if observed fluctuations were related to temperature. The weather data were gathered in Broomfield, approximately 10 miles from CU; thus plotted temperatures do not exactly reflect the air temperature at the antenna. However, the data do reflect a correlation between approximate ambient temperature and AGC gain, shown in Figure 11a, b, and c.

    Credit:  Holly Borowski, Oscar Isoz, Fredrik Marsten Eklöf, Sherman Lo, and Dennis Akos
    FIGURE 11A. AGC measure (survey-grade RX) and ambient temperature, Day 1.
    Credit:  Holly Borowski, Oscar Isoz, Fredrik Marsten Eklöf, Sherman Lo, and Dennis Akos
    FIGURE 11B. AGC measure (survey-grade RX) and ambient temperature, Day 2.
    Credit:  Holly Borowski, Oscar Isoz, Fredrik Marsten Eklöf, Sherman Lo, and Dennis Akos
    FIGURE 11C. AGC measure (survey-grade RX) and ambient temperature, Day 3.

    Why does this correlation exist? Why, when the temperature increases, must the gain of the receiver also increase? That may initially appear to be counter intuitive in that one may think higher temperature would result in higher thermal noise. Again, it is important not to confuse antenna temperature and ambient temperature which is the basis for the thermal noise floor. Why then must the receiver provide more gain with higher ambient temperatures? The validated hypothesis is that the antenna is an active design with an internal low noise amplifier. The gain, or really efficiency, of this amplifier is dependent on its temperature (and it is quite small, on the order of a dB). So as the ambient temperature increases the efficiency of the amplifier in the antenna decrease so the receiver is required to put more gain into the RF chain to accommodate. 

    This temperature correlation is an attempt to illustrate the power of the AGC metric and its potential sensitivity for detection. Other triggering methods, such as comparing current AGC levels with a moving average of previous values, could be implemented depending on desired performance. If such changes can be incorporated and/or calibrated out, we expect the most sophisticated spoofers could be detected coupled with a low false alarm rate.

    Conclusion

    A trigger based on the AGC, a measure available in a majority of GPS receivers, has been proposed that indicates the presence of potential signal spoofing prior to a compromise in receiver positioning. This proposed trigger is an effective tool for current GPS receivers to establish a low computational complexity measure of confidence of the reported position solution, and may complement other spoofing detection methods. The triggering mechanism may be adapted according to desired sensitivity in AGC changes, thereby either reducing the false alarm rate, or providing a conservative flag of potential RFI. Upon receiving such a flag, other navigation sources may be consulted to determine position, or the trust in the GPS solution may simply be lowered. Thus spoofing would be no more of a threat to satellite navigation/timing receivers than the much less sophisticated jamming.

    Acknowledgments

    Our thanks to the Robotförsökplats Norrland test range in Northern Sweden and the Swedish Defense Research Agency, particularly Peter Johanson and Mickael Alexandersson (who provided many of the photographs) for supporting the experiment.


    Holly Borowski is a Ph.D. student working in the Research and Engineering Center for Unmanned Vehicles at the University of Colorado-Boulder. Her research involves unmanned vehicle path planning for information gathering in uncertain environments.

    Oscar Isoz is a Ph.D. student at Luleå University of Technology. He has studied GPS interference detection and localization and is now focusing on radio occultation.

    Fredrik Marsten Eklöf is the project manager for NAVWAR research at the Swedish Defense Research Agency.

    Sherman Lo is a senior research engineer at the Stanford GPS Laboratory. He is the associate investigator for the Stanford University efforts on the FAA evaluation of alternative position navigation and timing (APNT) systems for aviation.

    Dennis Akos is an associate professor with the Aerospace Engineering Sciences Department at the University of Colorado as well as a consulting associate professor with Stanford University and a visiting professor with Luleå University of Technology.

  • Innovation: Know Your Enemy

    Innovation: Know Your Enemy

    Signal Characteristics of Civil GPS Jammers

    By Ryan H. Mitch, Ryan C. Dougherty, Mark L. Psiaki, Steven P. Powell, Brady W. O’Hanlon, Jahshan A. Bhatti, and Todd E. Humphreys

    GPS jamming is a continuing threat. A detailed understanding of how the available jammers work is necessary to judge their effectiveness and limitations. A team of researchers from Cornell University and the University of Texas at Austin reports on their analyses of the signal properties of 18 commercially available GPS jammers.

    GPS World photo
    INNOVATION INSIGHTS by Richard Langley

    GPS IS AT WAR. It is a major asset for United States and allied military forces in a number of operating theaters around the world in both declared and undeclared conflicts. But GPS is at war on the domestic front, too — at war against a proliferation of jamming equipment being marketed to cause deliberate interference to GPS signals to prevent GPS receivers from computing positions to be locally stored or relayed via tracking networks.

    There have been many notable examples of deliberate jamming of GPS receivers. Many more likely go undetected each day. In 2009, outages of a Federal Aviation Administration reference receiver at Newark Liberty International Airport close to the New Jersey Turnpike were traced to a $33, 200 milliwatt GPS jammer in a truck that passed the airport each day. The driver was reportedly arrested and charged. In July 2010, two truck thieves in Britain were jailed for 16 years. They used GPS jammers to prevent the trucks from being tracked after the thefts. And in Germany, some truck drivers have been using jammers to evade the country’s GPS-based road-toll system.

    The U.S. and some foreign governments have enacted laws to prohibit the importation, marketing, sale or operation of these so-called personal privacy devices. Nevertheless, a certain number of jammers are in the hands of individuals around the world and they continue to be available from manufacturers and suppliers in certain countries. So, GPS jamming is a continuing threat both at home and abroad and a detailed understanding of how the available jammers work is necessary to judge their effectiveness and limitations. This information will also help in developing countermeasures that could be incorporated into GPS receivers to limit the impact of jammers.

    Jammers constitute an enemy force, and as the Chinese General Sun Tzu stated in the Art of War more than 2,000 years ago, battles will be won by knowing your enemy. In the last verse of Chapter Three, he states:

    So it is said that if you know your enemies and know yourself, you can win a hundred battles without a single loss.

    If you only know yourself, but not your opponent, you may win or may lose.

    If you know neither yourself nor your enemy, you will always endanger yourself.

    In this month’s column, a team of researchers from Cornell University and the University of Texas at Austin reports on their analyses of the signal properties of 18 commercially available GPS jammers. The enemy has been exposed.


    The Global Positioning System has become increasingly incorporated into civilian infrastructure. The increase in GPS-integrated systems has caused a proportional increase in the vulnerability of these systems to jamming and interference. The interests of individuals or groups willing to break the law may be served by interfering with the normal operation of GPS-enabled systems. As a result, in recent years many GPS jamming devices have become available for purchase over the Internet. These relatively cheap devices, some costing less than an inexpensive GPS receiver, pose a significant risk to the normal operation of many systems reliant on GPS.

    Many types of intentional radio frequency (RF) interference exist, including tones, swept waveforms, pulses, narrowband noise, and broadband noise. There are a number of methods for mitigating the effects of jamming and interference, and additional methods exist to locate the sources of the interference. Mitigation and location methods can be improved by use of a priori information about the interference source. This article provides such a priori information for a set of jammers and assesses their threats. Its results are based on two tests. The first test records raw RF data from a selection of jammers and analyzes it using fast Fourier transform (FFT) spectral methods. The second test evaluates the effective range of a subset of the GPS jammers using a commercial off-the-shelf (COTS) receiver.

    The article presents results based on 18 civil GPS jammers. There are other types of GPS jammers for sale that were not tested. Furthermore, civil jammer behavior and design is likely to evolve over time. In this article, we draw conclusions based on only the jammers that we tested.

    Overview of Civil GPS Jammers

    Devices that claim to jam or “block” GPS signals are widely available through a number of websites and online entities. The cost of these devices ranges from a few tens of dollars to several hundred. Their price does not seem to correlate with the claims made by the purveyors of these devices regarding the features and effectiveness of the product in question. Effective ranges from a few meters to several tens of meters are advertised, but the actual effective ranges are significantly greater. Claimed and true power consumptions range from a fraction of a watt to several watts.

    We grouped the GPS jammers we examined in this article into three categories based on morphology. The first is a group of jammers designed to plug into an automotive 12-volt auxiliary power supply outlet (cigarette lighter socket); this class of jammer is referred to in the remainder of this article as Group 1. The second category contains those jammers that are both powered by an internal rechargeable battery and that have an external antenna connected via an SMA connector; these jammers are referred to as Group 2. The jammers in Group 3 are disguised as cell phones; they have batteries but no external antennas. Figure 1 shows an example of a device from each of Groups 1–3.

    Credit: Ryan H. Mitch, Ryan C. Dougherty, Mark L. Psiaki, Steven P. Powell, Brady W. O’Hanlon, Jahshan A. Bhatti, and Todd E. Humphreys
    Figure 1. Three jammers are depicted, from left to right Jammers 1, 5, and 15 from Groups 1, 2, and 3, respectively.

    All 18 jammers broadcast power at or near the L1 carrier frequency, six broadcast power at or near the L2 carrier frequency, and none broadcast power at or near the L5 carrier frequency. Some of the jammers also broadcast power at frequencies outside of the GPS bands, typically cellular phone or Wi-Fi bands, but those frequencies are outside the scope of this article. Results in this article are for the current power levels broadcast in the GPS L1 and L2 bands, but examination of power levels in non-GPS bands indicate that many of these devices could be easily modified to broadcast much more power in the GPS bands.

    The jammer antennas have been removed in most of the testing for this article, but their use in a real-world scenario will modify the jammer behavior. The antennas used by Group 1 and Group 2 jammers are loaded monopole antennas, while those used by the Group 3 jammers are electrically short helical antennas that have approximately the same gain pattern as the loaded monopoles. These antennas broadcast linearly polarized radiation, as opposed to the right-hand circular polarization of GPS signals. The polarization mismatch will cause some loss in received power at a right-hand circularly polarized GPS receiver antenna.

    Jammer Signal Characteristics Test

    The goal of the first set of tests was to record complex samples of the jamming signals and to derive the jammer characteristics from these data. A two-step procedure was used to collect useful data. The first step used a spectrum analyzer to find the frequency range of the jamming signal near L1 and L2. The second step used this frequency information to set the center frequency of a general-purpose RF digitization and signal storage device with a 12-drive RAID storage array. Offline analyses were then conducted on the recorded data.

    The test procedure was as follows. For the first two groups, the jammer was placed inside an RF-shielded test enclosure shown in Figure 2, to prevent any signal leakage, and its SMA signal output port was connected to the relevant data collection device using a shielded coaxial cable. The signal had to pass from the inside to the outside of the RF enclosure using the built-in coaxial feed-through. Note, therefore, that no jammer signal radiation occurred for Group 1 and 2 jammers even inside the RF enclosure. The enclosure was used primarily as a precaution.

     Figure 2. RF-shielded test enclosure. Jammers were operated inside the enclosure to prevent emission of their RF signals. Credit: Ryan H. Mitch, Ryan C. Dougherty, Mark L. Psiaki, Steven P. Powell, Brady W. O’Hanlon, Jahshan A. Bhatti, and Todd E. Humphreys
    Figure 2. RF-shielded test enclosure. Jammers were operated inside the enclosure to prevent emission of their RF signals.

    None of the Group 3 jammers had external antennas. Therefore, they were allowed to radiate in the RF enclosure using their internal antennas. To capture the signal, a receiving patch antenna with active amplification was placed in the RF enclosure, and the antenna output was connected to the relevant RF recording device via the enclosure’s coaxial feed-through. The jammer and receiving antenna were separated by about 14 centimeters. The patch antenna field-of-view center was pointed directly at the jammer. The jammer was oriented such that the axis of its helical antenna was pointing perpendicular to the line from the receiving antenna to the jammer.

    Jammer Signal Characteristics Test Results

    Although 18 jammers were tested, only a representative subset is discussed here. The signals were analyzed using FFT spectral methods and measurements of in-band power. Figure 3 displays the results of this analysis for a typical jammer from Group 1.

    The top plot of Figure 3 graphs frequency on the vertical scale versus time on the horizontal scale. The bottom plot graphs power on the vertical scale versus time on the horizontal scale. Each vertical slice of the recorded RF data plot is a single FFT frequency spectrum. It covers 62.5 MHz centered on the L1 band and has a resolution of approximately 1 MHz. The relative power spectral density of each slice is indicated by color. The time axes of both plots span 80 microseconds.

     Figure 3. Jammer 4 power spectral density versus time, with color indicating relative power (top plot) and power versus time in a 62.5-MHz band centered at the L1 carrier frequency (bottom plot). Credit: Ryan H. Mitch, Ryan C. Dougherty, Mark L. Psiaki, Steven P. Powell, Brady W. O’Hanlon, Jahshan A. Bhatti, and Todd E. Humphreys
    Figure 3. Jammer 4 power spectral density versus time, with color indicating relative power (top plot) and power versus time in a 62.5-MHz band centered at the L1 carrier frequency (bottom plot).

    The upper plot of Figure 3 is clearly that of a linear frequency modulation interspersed with rapid resets — a series of linear chirps. Each sweep takes nine microseconds and spans a range of about 14 MHz. This range includes the civil L1 GPS band. The center frequency is depicted by the horizontal red line in the top plot. The power is about 20 milliwatts and remains fairly constant over the sweep.

    Three of the Group 1 jammers appeared to be of the same model and one was slightly different. All of them broadcast power only at L1. Despite their similarities in external appearance, the three jammers of the same model exhibited markedly different signal properties. These differences will be presented later in terms of tabulated frequency modulation characteristics and in-band power levels.

    One of the Group 2 jammers was unusual in two respects, as illustrated in Figure 4. This figure plots the L2 spectrum whose center is indicated by the horizontal red line in the top plot. The first obvious difference from Figure 3 is that the frequency modulation in time is a triangular wave instead of a sawtooth. Additionally, the modulation frequency is very high in comparison to all the other jammers; its period is only about 1 microsecond. Note that the horizontal scale of this figure spans only 8 microseconds, that is, 10 times less than in Figure 3.

    The other Group 2 jammers tended to broadcast sawtooth frequency modulations as in Figure 3. They all broadcast jamming power at L1. Of course, the jammer depicted in Figure 4 broadcast power at L2 as well. Only one other Group 2 jammer had L2 jamming capability. Two of the jammers suffered from poor design of their L1 frequency modulation schemes: they placed no jamming power closer than 4.6 MHz away from the nominal L1 carrier frequency.

     Figure 4. Jammer 10 power spectral density versus time (top plot), with resolution of about 3 MHz and color indicating relative power, and power versus time (bottom plot) in a 62.5-MHz band centered at the L2 carrier frequency. Credit: Ryan H. Mitch, Ryan C. Dougherty, Mark L. Psiaki, Steven P. Powell, Brady W. O’Hanlon, Jahshan A. Bhatti, and Todd E. Humphreys
    Figure 4. Jammer 10 power spectral density versus time (top plot), with resolution of about 3 MHz and color indicating relative power, and power versus time (bottom plot) in a 62.5-MHz band centered at the L2 carrier frequency.

    Another unusual frequency modulation was encountered in a Group 3 jammer. The L1 results for this jammer are depicted in Figure 5. It seems to show a linear-type frequency modulation distorted by sudden frequency jumps, as seen in the upper plot of the figure. Despite its irregular nature, this waveform maintains its jamming efficacy.

     Figure 5. Jammer 15 power spectral density versus time, with color indicating relative power (top plot) and power versus time in a 62.5-MHz band centered at the L1 carrier frequency (bottom plot). Note the additional frequency jumps in the sweep pattern. Credit: Ryan H. Mitch, Ryan C. Dougherty, Mark L. Psiaki, Steven P. Powell, Brady W. O’Hanlon, Jahshan A. Bhatti, and Todd E. Humphreys
    Figure 5. Jammer 15 power spectral density versus time, with color indicating relative power (top plot) and power versus time in a 62.5-MHz band centered at the L1 carrier frequency (bottom plot). Note the additional frequency jumps in the sweep pattern.

    All four jammers in Group 3 broadcast power at L1, L2, and additional frequency bands. Three of the jammers appeared to be of the same model, while a fourth was different. Jammers in this group normally use a standard sawtooth frequency modulation. Figure 5 represents the exception.

    Additional types of distortion from the nominal sawtooth frequency modulation have been observed in some of the jammers. Discussion of each additional variation has been omitted here for the sake of brevity. See the authors’ companion conference paper, listed in the Further Reading sidebar for more details.

    Frequency Modulation Periods and Ranges. The frequency modulation characteristics of all 18 jammers are listed in Table 1. The first two columns identify each jammer by group number and jammer number. The sweep period and frequency range for the L1 sweep are shown in the third and fourth columns. The two numbers in the fourth column are the upper and lower bounds of the jamming tone sweep range in megahertz above and below the L1 carrier frequency. For instance, the period between resets of the linear frequency modulation of Jammer 1 is 26 microseconds and the tone sweeps from 25.4 MHz below L1 to 31.3 MHz above L1. The fifth and sixth columns are analogous to the third and fourth columns, but for jamming in the L2 band, with entries only for those jammers that broadcast in this band.

    The sweep periods were calculated using four contiguous sweeps from near the beginning of each data set and another four sweeps 30 seconds later. The sweep periods exhibited standard deviations of less than 1 microsecond. The reported sweep ranges are the minimum and maximum frequency observed in the same data used to calculate sweep periods. The sweep ranges changed by as much as 2.5 MHz between sweeps.

    One can make a number of observations based on Table 1. First, as mentioned previously, jammers which appeared to be of the same model exhibited significant variations in sweep behavior. For instance, Jammers 1, 3, and 4 appeared to be of the same models, yet Jammer 1 has a sweep period nearly three times as long as Jammers 3 and 4. It also has a sweep range four times as wide. Second, some individual jammers were exceptional. For example, Jammer 10 has a sweep period nearly 10 times shorter than any other jammer, and its L1 sweep range exceeded the 62.5 MHz bandwidth recorded by the RF sampling equipment. The sweep range of Jammer 16 also exceeded the sampled bandwidth, though its sweep period was not exceptional. Jammers 12 and 13 do not sweep through the L1 carrier frequency, as indicated by the negative signs in the fourth column of Table 1. Jammer 17 suffered from the same problem, but for both L1 and L2.

     Table 2. Jammer power levels in frequency bands of interest. Credit: Ryan H. Mitch, Ryan C. Dougherty, Mark L. Psiaki, Steven P. Powell, Brady W. O’Hanlon, Jahshan A. Bhatti, and Todd E. Humphreys
    Table 1. Frequency characteristics of GPS jammers.

    In-Band Jammer Power Levels. The GPS signal is spread over several megahertz by the pseudorandom noise (PRN) codes that modulate the L1 or L2 carrier waves. Different GPS receivers exploit this spreading by processing more or less of the full bandwidth. The RF power of the GPS jamming signal within different bands centered at L1 is an important concern because different receiver RF front-end bandwidths may allow different total amounts of jammer power to pass through them. For example, a C/A-code receiver with a 2-MHz RF front-end bandwidth will pass 10 dB less jammer power than will a 20-MHz bandwidth RF front end of a P(Y)-code receiver if the jammer in question spreads its power evenly over the 20-MHz band centered at the L1 carrier frequency. If the jammer power is concentrated in a 2-MHz range, however, then both receiver front ends will pass equal total jammer power.

    To determine the power in different bandwidths, the raw data were filtered to pass only the bandwidths of interest. The data were digitally filtered using a finite input response (FIR) equiripple band-pass filter, providing 60 dB of attenuation at 2 MHz past the roll-off frequency. Note that a real GPS receiver will probably not have analog filter frequency roll offs as sharp as those used in our work.

    Table 2 presents the results of this study. It reports power measurements averaged over 15 milliseconds in three different bandwidths: 2, 20, and 50 MHz, all centered at the nominal L1 or L2 carrier frequency. The table also indicates whether each jammer broadcasts power at frequencies other than the GPS frequencies. No power data is given for the non-GPS frequencies because they are not the focus of this article.

    A number of observations can be drawn from Table 2. First, there is a large variation in broadcast power among jammers, with Group 2 jammers being on average more powerful. Specifically, Jammer 11 is the most powerful, broadcasting more than a watt in the GPS bands! Second, jammers of the same model broadcast roughly the same amount of power despite the differences in sweep behavior mentioned above. For instance, Jammers 1, 3, and 4 broadcast roughly the same amount of power, and Jammers 15, 17, and 18 do so as well. Third, the poor frequency plans of Jammers 12, 13, and 17 are apparent in the power measurements. These jammers did not sweep a tone through L1 or L2, and effectively no power was measured in the 2-MHz band centered on the L1 or L2 carrier frequencies.

     Table 2. Jammer power levels in frequency bands of interest. Credit: Ryan H. Mitch, Ryan C. Dougherty, Mark L. Psiaki, Steven P. Powell, Brady W. O’Hanlon, Jahshan A. Bhatti, and Todd E. Humphreys
    Table 2. Jammer power levels in frequency bands of interest.

    Although not shown in the tables, Jammers 12, 13, and 14 exhibited periodic variations in broadcast power. Their peak-to-peak power varies as a sawtooth wave with period approximately 15 milliseconds and amplitude on the order of 10 percent of the total broadcast power.

    The measured power values in Table 2 for jammers of Groups 1 and 2 were derived using direct cable connections. Thus, they report the total power into the transmitting antenna. The power received at a GPS receiver’s RF front end will be affected by any antenna inefficiency, the antenna gain pattern, and the space loss, among other effects.

    In contrast, the power reported for Group 3 jammers includes all of those effects for the given test configuration. Specifically, the receiving antenna picked up only a fraction of the radiated power because the receiving antenna subtended only a fraction of the 4π steradians around the transmitting antenna. Also, the power that was received was boosted by the receiving antenna’s active low-noise amplifier. Finally, the radiation environment inside the RF enclosure is uncertain, and the enclosure constrains the separation of the antennas to be on the order of one wavelength, thereby giving rise to near-field effects. Therefore, the indicated power levels for the Group 3 jammers do not constitute measures of absolute power. The tabulated power levels for Group 3 jammers are included primarily for purposes of comparison within the group.

    Maximum Effective Range Test

    The goal of the second set of tests was to determine the effective ranges of the GPS jammers when interfering with a COTS receiver. A constraint on this test was that it could not broadcast harmful radiation to the environment. Ideally, the jammers and a receiver would be taken outside and tested with all antennas attached. However, this type of test would possibly interfere with other equipment and is illegal in the United States. A close approximation to this scenario can be constructed using a high-fidelity simulated GPS signal, a commercial GPS receiver, a GPS jammer in an RF enclosure, and a set of attenuators to simulate various distances. The setup for the second test is shown in the block diagram of Figure 6.

    I-6 . Credit: Ryan H. Mitch, Ryan C. Dougherty, Mark L. Psiaki, Steven P. Powell, Brady W. O’Hanlon, Jahshan A. Bhatti, and Todd E. Humphreys
    Figure 6. Block diagram of the test procedure and equipment used to determine the GPS jammers’ effective ranges.

    Each range test involved running a GPS jammer inside the RF enclosure, passing its signal through the enclosure’s coaxial feed-through, and electrically combining that signal with a GPS simulator signal. The combined signal was then input to the antenna connector of the COTS GPS receiver. Attenuators were inserted in-line with the GPS jammer before it arrived at the combiner. Using this setup, two tests were conducted. The first test determined the jamming signal attenuation level necessary for continuous tacking. The second test determined the attenuation level necessary to allow the receiver to acquire the simulator signal within five minutes from a cold start. As will be shown in the next section, the resulting attenuation values can be converted into effective ranges of the jammers if one makes certain reasonable assumptions about transmitting and receiving antenna gains and path losses.

    The simulator power level was set so that the power into the receiver matched that which it would receive from the actual GPS constellation through a typical roof-mounted passive patch antenna. This power level was checked by comparing the resulting C/N0 for all of the visible satellites when using the simulator against typical C/N0 values when using the roof-mounted antenna. Typical levels reported by the receiver were C/N0 = 43 dB-Hz.

    Maximum Effective Range Results

    The jamming signal attenuation levels resulting from the two tests are presented in Table 3. These tests were conducted on one jammer from Group 1 and three jammers from Group 2. No jammers from Group 3 were included because of the broadcast power uncertainties discussed in connection with Table 2.

    The attenuation values by themselves are not very useful, but they can be converted into distance measurements with a number of assumptions. The ratio of received power to transmitted power can be expressed as

    Screen shot 2013-01-05 at 8.55.31 PM . Credit: Ryan H. Mitch, Ryan C. Dougherty, Mark L. Psiaki, Steven P. Powell, Brady W. O’Hanlon, Jahshan A. Bhatti, and Todd E. Humphreys

    where Gt is the transmitting antenna gain, Gr is the receiving antenna gain, and the term (λ/(4πr))2 is the path loss for radiation of wavelength λ over the distance r. This equation can be solved for the range, r:

    Screen shot 2013-01-05 at 8.55.37 PM . Credit: Ryan H. Mitch, Ryan C. Dougherty, Mark L. Psiaki, Steven P. Powell, Brady W. O’Hanlon, Jahshan A. Bhatti, and Todd E. Humphreys
    The quantity in this formula that equates to the total electrical jammer attenuation produced in each bench-top test is the product of the antenna gains and the ratio of transmitted to received power: Gt Gr(Pt ⁄Pr ).

    To convert the results in Table 3 into effective ranges, the transmitting and receiving antennas can be assumed to be perfect, lossless, isotropic radiators. In this case, the gain terms, Gt and Gr , are unity. Each measured attenuation value can be converted to the unitless ratio, Pt ⁄Pr , and substituted into the equation for r. Use of this equation at the L1 carrier frequency yields the ranges in Table 4. If the range between the jammer and receiver is less than that listed in the third column of the table, then the jammer will prevent the receiver from tracking and acquiring. If the range is less than that listed in the last column but more than that listed in the third column, the receiver will continue to track but be unable to acquire. The effective ranges are at least an order of magnitude greater than the claims of the jammers’ purveyors.

    TABLE 3 Jammer attenuation levels needed to allow COTS GPS receiver acquisition and tracking. Credit: Ryan H. Mitch, Ryan C. Dougherty, Mark L. Psiaki, Steven P. Powell, Brady W. O’Hanlon, Jahshan A. Bhatti, and Todd E. Humphreys
    Table 3. Jammer attenuation levels needed to allow COTS GPS receiver acquisition and tracking.
    Screen shot 2013-01-05 at 8.48.59 PM . Credit: Ryan H. Mitch, Ryan C. Dougherty, Mark L. Psiaki, Steven P. Powell, Brady W. O’Hanlon, Jahshan A. Bhatti, and Todd E. Humphreys
    Table 4. Ranges of jammer effectiveness against COTS GPS receiver when using lossless isotropic antennas.

    Distinct scenarios with different antennas can be approximately tested using Table 3 and the range equation. For example, a patch antenna that is oriented perfectly skyward might have 10 dB of attenuation at very low elevation angles, and the jammer might have an additional 3 dB loss due to polarization mismatch. In this scenario, the effective jamming range would be factored down by 10-13/20 = 0.22. In this case, Jammer 11’s tracking interference range would be reduced from 6.1 kilometers to 1.4 kilometers. Additional jammer signal attenuation might occur if the emissions passed through the reduced RF aperture of a vehicle’s body and windows. Such an effect could be incorporated into the range equation to determine a revised effective range.

    Due to the ignored losses in the real system, it would likely be safe to assume that the effective ranges of the GPS jammers would be no greater than those listed in Table 4. The ranges could potentially be greater if a high-gain receiving antenna were aimed directly at the jamming source, or if the jamming source used a high-gain transmitting antenna aimed at the receiver. None of the jammers tested employed such an antenna.

    Summary and Conclusions

    This article has presented the signal properties of 18 commercially available GPS jammers as determined from two types of live experimental tests. The first test examined the frequency structures and power levels of the jammer signals. It showed that all of the jammers used some sort of swept tone method to generate broadband interference. The majority of the jammers used linear chirp signals, all jammed L1, only six jammed L2, and none jammed L5. The sweep period of the jammers is about 9 microseconds on average, and they tend to sweep a range of less than 20 MHz. Some of the jammers’ sweep ranges failed to encompass the target L1 or L2 carrier frequencies.

    The second test provided an estimate of four of the jammers’ effective ranges when deployed against a typical commercial receiver. An upper bound on the effective ranges was calculated for idealized, lossless, isotropic radiating and receiving antennas with matched polarizations. The weakest of the four jammers affected tracking at a range of about 300 meters and acquisition at about 600 meters, while the strongest affected tracking at a range of about 6 kilometers and acquisition at about 8.5 kilometers.

    Acknowledgments

    The authors thank the U.S. Department of Homeland Security for providing interference devices for testing. This article is based on the paper “Signal Characteristics of Civil GPS Jammers” presented at ION GNSS 2011, the 24th International Technical Meeting of the Satellite Division of The Institute of Navigation, Portland, Oregon, September 19–23, 2011, where it received a best-presentation-in-session award.

    Manufacturers

    The tests discussed in this article used an Agilent Technologies (www.home.agilent.com) model N1996A spectrum analyzer, a National Instruments PXI-5663 RF vector signal analyzer, a Ramsey Electronics model STE3000B RF shielded test enclosure, an Antcom (www.antcom.com) model 53G1215A-XT-1 patch antenna, and a NovAtel ProPakII-RT2 GPS receiver.


    Ryan H. Mitch is a graduate student in the Sibley School of Mechanical and Aerospace Engineering at Cornell University, Ithaca, New York. He received his B.S. degree in mechanical engineering from the University of Pittsburgh.

    Ryan C. Dougherty is a graduate student in the Sibley School. He holds a B.S. degree in aerospace engineering from the University of Southern California.

    Mark L. Psiaki is a professor in the Sibley School. He received a B.A. degree in physics and M.A. and Ph.D. degrees in mechanical and aerospace engineering from Princeton University.

    Steven P. Powell is a senior engineer with the GPS and Ionospheric Studies Research Group in the Department of Electrical and Computer Engineering at Cornell University. He has M.S. and B.S. degrees in electrical engineering from Cornell University.

    Brady W. O’Hanlon is a graduate student in the School of Electrical and Computer Engineering at Cornell University. He received a B.S. degree in electrical and computer engineering from Cornell University.

    Jahshan A. Bhatti is pursuing a Ph.D. degree in the Department of Aerospace Engineering and Engineering Mechanics at the University of Texas (UT) at Austin, where he also received his M.S. and B.S. degrees. He is a member of the UT Radionavigation Laboratory.

    Todd E. Humphreys is an assistant professor in the Department of Aerospace Engineering and Engineering Mechanics at UT Austin and Director of the UT Radionavigation Laboratory. He received B.S. and M.S. degrees in electrical and computer engineering from Utah State University and a Ph.D. degree in aerospace engineering from Cornell University.


    Further Reading

    • Authors’ Conference Paper

    “Signal Characteristics of Civil GPS Jammers” by R.H. Mitch, R.C. Dougherty, M.L. Psiaki, S.P. Powell, B.W. O’Hanlon, J.A. Bhatti, and T.E. Humphreys in Proceedings of ION GNSS 2011, the 24th International Technical Meeting of The Satellite Division of the Institute of Navigation, Portland, Oregon, September 19–23, 2011, pp. 1907–1919.

    • Vulnerability of GPS

    Vulnerability Assessment of the Transportation Infrastructure Relying on the Global Positioning System – Final Report. John A. Volpe National Transportation Systems Center, Cambridge, Massachusetts, August 29, 2001.

    • GPS Jamming

    Car Jammers: Interference Analysis” by R. Bauernfeind, T. Kraus, D. Dötterböck, B. Eissfeller, E. Löhnert, and E. Wittmann in GPS World, Vol. 22, No. 10, October 2011, pp. 28–35.

    “GPS Jamming: No Jam Tomorrow” in The Economist, Technology Quarterly Special Section, Vol. 398, Issue 8724, March 12, 2011, pp. 20–21.

    Modern Communications Jamming Principles and Techniques, 2nd ed., by R.A. Poisel, published by Artech House, Boston, Massachusetts, 2011.

    “Jamming GPS: Susceptibility of Some Civil GPS Receivers” by B. Forssell and R.B. Olsen in GPS World, Vol. 14, No. 1, January 2003, pp. 54–58.

    “A Growing Concern: Radiofrequency Interference and GPS” by F. Butsch in GPS World, Vol. 13, No. 10, October 2002, pp. 40–50.

    “Interference Effects and Mitigation Techniques” by J.J. Spilker Jr. and F.D. Natali, Chapter 20 in Global Positioning System: Theory and Applications, Volume I, published by the American Institute of Aeronautics and Astronautics, Inc., Washington, D.C., 1996, pp. 717–771.

    • Government Regulations and Actions Against Jammers

    Twenty Online Retailers of Illegal Jamming Devices Targeted in Omnibus Enforcement Action,” a Federal Communications Commission press release issued October 5, 2011.

    FCC Enforcement Bureau Steps up Education and Enforcement,” a Federal Communications Commission press release issued February 9, 2011.

    Cell Jammers, GPS Jammers, and Other Jamming Devices,” Federal Communications Commission Enforcement Advisory No. 2011-04 issued February 9, 2011, for consumers.

    Cell Jammers, GPS Jammers, and Other Jamming Devices,” Federal Communications Commission Enforcement Advisory No. 2011-03 issued February 9, 2011, for retailers.

    • Jamming Counter Measures

    Receiver Certification: Making the GNSS Environment Hostile to Jammers and Spoofers” by L. Scott. Presented to the National Space-Based Positioning, Navigation, and Timing (PNT) Advisory Board, 9th Meeting, November 9–10, 2011, Alexandria, Virginia.

    “The Civilian Battlefield: Protecting GNSS Receivers from Interference and Jamming” by M. Jones in Inside GNSS, Vol. 6, No. 2, March/April 2011, pp. 40–49.

    Interference Heads-up: Receiver Techniques for Detecting and Characterizing RFI” by P.W. Ward in GPS World, Vol. 19, No. 6, June 2008, pp. 64–73.

    Jamming Protection of GPS Receivers, Part I: Receiver Enhancements” by S. Rounds in GPS World, Vol. 15, No. 1, January 2004, pp. 54–59.

    Jamming Protection of GPS Receivers, Part II: Antenna Enhancements” by S. Rounds in GPS World, Vol. 15, No. 2, February 2004, pp. 38–45.

    Antijamming and GPS for Critical Military Applications,” by A. Abbott in Crosslink, Vol. 3, No. 2, Summer 2003, pp. 36–41.

  • Straight Talk on Anti-Spoofing: Securing the Future of PNT

    By Kyle Wesson, Daniel Shepard, and Todd Humphreys

    Disruption created by intentional generation of fake GPS signals could have serious economic consequences. This article discusses how typical civil GPS receivers respond to an advanced civil GPS spoofing attack, and four techniques to counter such attacks: spread-spectrum security codes, navigation message authentication, dual-receiver correlation of military signals, and vestigial signal defense. Unfortunately, any kind of anti-spoofing, however necessary, is a tough sell.

    GPS spoofing has become a hot topic. At the 2011 Institute of Navigation (ION) GNSS conference, 18 papers discussed spoofing, compared with the same number over the past decade. ION-GNSS also featured its first panel session on anti-spoofing, called “Improving Security of GNSS Receivers,” which offered six security experts a forum to debate the most promising anti-spoofing technologies.

    The spoofing threat has also drawn renewed U.S. government scrutiny since the initial findings of the 2001 Volpe Report. In November 2010, the U.S. Position Navigation and Timing National Executive Committee requested that the U.S. Department of Homeland Security (DHS) conduct a comprehensive risk assessment on the use of civil GPS. In February 2011, the DHS Homeland Infrastructure Threat and Risk Analysis Center began its investigation in conjunction with subject-matter experts in academia, finance, power, and telecommunications, among others. Their findings will be summarized in two forthcoming reports, one on the spoofing and jamming threat and the other on possible mitigation techniques. The reports are anticipated to show that GPS disruption due to spoofing or jamming could have serious economic consequences.

    Effective techniques exist to defend receivers against spoofing attacks. This article summarizes state-of-the-art anti-spoofing techniques and suggests a path forward to equip civil GPS receivers with these defenses. We start with an analysis of a typical civil GPS receiver’s response to our laboratory’s powerful spoofing device. This will illustrate the range of freedom a spoofer has when commandeering a victim receiver’s tracking loops. We will then provide an overview of promising cryptographic and non-cryptographic anti-spoofing techniques and highlight the obstacles that impede their widespread adoption.

    The Spoofing Threat

    Spoofing is the transmission of matched-GPS-signal-structure interference in an attempt to commandeer the tracking loops of a victim receiver and thereby manipulate the receiver’s timing or navigation solution. A spoofer can transmit its counterfeit signals from a stand-off distance of several hundred meters or it can be co-located with its victim.

    Spoofing attacks can be classified as simple, intermediate, or sophisticated in terms of their effectiveness and subtlety. In 2003, the Vulnerability Assessment Team at Argonne National Laboratory carried off a successful simple attack in which they programmed a GPS signal simulator to broadcast high-powered counterfeit GPS signals toward a victim receiver. Although such a simple attack is easy to mount, the equipment is expensive, and the attack is readily detected because the counterfeit signals are not synchronized to their authentic counterparts.

    In an intermediate spoofing attack, a spoofer synchronizes its counterfeit signals with the authentic GPS signals so they are code-phase-aligned at the target receiver. This method requires a spoofer to determine the position and velocity of the victim receiver, but it affords the spoofer a serious advantage: the attack is difficult to detect and mitigate.

    The sophisticated attack involves a network of coordinated intermediate-type spoofers that replicate not only the content and mutual alignment of visible GPS signals but also their spatial distribution, thus fooling even multi-antenna spoofing defenses.

    Table1 . Credit: Kyle Wesson, Daniel Shepard, and Todd Humphreys
    Table 1. Comparison of anti-spoofing techniques discussed in this article.

    Lab Attack. So far, no open literature has reported development or research into the sophisticated attack. This is likely because of the success of the intermediate-type attack: to date, no civil GPS receiver tested in our laboratory has fended off an intermediate-type spoofing attack. The spoofing attacks, which are always conducted via coaxial cable or in radio-frequency test enclosures, are performed with our laboratory’s receiver-spoofer, an advanced version of the one introduced at the 2008 ION-GNSS conference (see “Assessing the Spoofing Threat,” GPS World, January 2009).

    To commence the attack, the spoofer transmits its counterfeit signals in code-phase alignment with the authentic signals but at power level below the noise floor. The spoofer then increases the power of the spoofed signals so that they are slightly greater than the power of the authentic signals. At this point, the spoofer has taken control of the victim receiver’s tracking loops and can slowly lead the spoofed signals away from the authentic signals, carrying the receiver’s tracking loops with it. Once the spoofed signals have moved more than 600 meters in position or 2 microseconds in time away from the authentic signals, the receiver can be considered completely owned by the spoofer.

    Spoofing testbed at the University of Texas Radionavigation Laboratory, an advanced and powerful suite for anti-spoofing research. On the right are several of the civil GPS receivers tested and the radio-frequency test enclosure, and on the left are the phasor measurement unit and the civil GPS spoofer. Credit: Kyle Wesson, Daniel Shepard, and Todd Humphreys
    Spoofing testbed at the University of Texas Radionavigation Laboratory, an advanced and powerful suite for anti-spoofing research. On the right are several of the civil GPS receivers tested and the radio-frequency test enclosure, and on the left are the phasor measurement unit and the civil GPS spoofer.

    Although our spoofer fooled all of the receivers tested in our laboratory, there are significant differences between receivers’ dynamic responses to spoofing attacks. It is important to understand the types of dynamics that a spoofer can induce in a target receiver to gain insight into the actual dangers that a spoofing attack poses rather than rely on unrealistic assumptions or models of a spoofing attack. For example, a recent paper on time-stamp manipulation of the U.S. power grid assumed that there was no limit to the rate of change that a spoofer could impose on a victim receiver’s position and timing solution, which led to unrealistic conclusions.

    Experiments performed in our laboratory sought to answer three specific questions regarding spoofer-induced dynamics:

    • How quickly can a timing or position bias be introduced?
    • What kinds of oscillations can a spoofer cause in a receiver’s position and timing?
    • How different are receiver responses to spoofing?

    These questions were answered by determining the maximum spoofer-induced pseudorange acceleration that can be used to reach a certain final velocity when starting from a velocity of zero, without raising any alarms or causing the target receiver to lose satellite lock. The curve in the velocity-acceleration plane created by connecting these points defines the upper bound of a region within which the spoofer can safely manipulate the target receiver. These data points can be obtained empirically and fit to an exponential curve. Alarms on the receiver may cause some deviations from this curve depending on the particular receiver.

    Figure 1 shows an example of the velocity-acceleration curve for a high-quality handheld receiver, whose position and timing solution can be manipulated quite aggressively during a spoofing attack. These results suggest that the receiver’s robustness — its ability to provide navigation and timing solutions despite extreme signal dynamics — is actually a liability in regard to spoofing. The receiver’s ability to track high accelerations and velocities allows a spoofer to aggressively manipulate its navigation solution.

     Figure 1. Theoretical and experimental test results for a high-quality handheld receiver's dynamic response to a spoofing attack. Although not shown here, the maximum attainable velocity is around 1,300 meters/second.  Credit: Kyle Wesson, Daniel Shepard, and Todd Humphreys
    Figure 1. Theoretical and experimental test results for a high-quality handheld receiver’s dynamic response to a spoofing attack. Although not shown here, the maximum attainable velocity is around 1,300 meters/second.

    The relative ease with which a spoofer can manipulate some GPS receivers suggests that GPS-dependent infrastructure is vulnerable. For example, the telecommunications network and the power grid both rely on GPS time-reference receivers for accurate timing. Our laboratory has performed tests on such receivers to determine the disruptions that a successful spoofing attack could cause. The remainder of this section highlights threats to these two sectors of critical national infrastructure.

    Cell-Phone Vulnerability. Code division multiple access (CDMA) cell-phone towers rely on GPS timing for tower-to-tower synchronization. Synchronization prevents towers from interfering with one another and enables call hand-off between towers. If a particular tower’s time estimate deviates more than 10 microseconds from GPS time, hand-off to and from that tower is disrupted. Our tests indicate that a spoofer could induce a 10-microsecond time deviation within about 30 minutes for a typical CDMA tower setup. A spoofer, or spoofer network, could also cause multiple neighboring towers to interfere with one another. This is possible because CDMA cell-phone towers all use the same spreading code and distinguish themselves only by the phasing (that is, time offset) of their spreading codes. Furthermore, it appears that a spoofer could impair CDMA-based E911 user-location.

    Power-Grid Vulnerability. Like the cellular network, the power grid of the future will rely on accurate GPS time-stamps. The efficiency of power distribution across the grid can be improved with real-time measurements of the voltage and current phasors. Phasor measurement units (PMUs) have been proposed as a smart-grid technology for precisely this purpose. PMUs rely on GPS to time-stamp their measurements, which are sent back to a central monitoring station for processing. Currently, PMUs are used for closed-loop grid control in only a few applications, but power-grid modernization efforts will likely rely more heavily on PMUs for control. If a spoofer manipulates a PMU’s time stamps, it could cause spurious variations in measured phase angles. These variations could distort power flow or stability estimates in such a way that grid operators would take incorrect or unnecessary control actions including powering up or shutting down generators, potentially causing blackouts or damage to power-grid equipment.

    Under normal circumstances, a changing separation in the phase angle between two PMUs indicates changes in power flow between the regions measured by each PMU. Tests demonstrate that a spoofer could cause variations in a PMU’s measured voltage phase angle at a rate of 1.73 degrees per minute. Thus, a spoofing attack could create the false indications of power flow across the grid. The tests results also reveal, however, that it is impossible for a spoofer to cause changes in small-signal grid stability estimates, which would require the spoofer to induce rapid (for example, 0.1–3 Hz) microsecond-amplitude oscillations in timing. Such oscillations correspond to spoofing dynamics well outside the region of freedom of all receivers we have tested. A spoofer might also be able to affect fault-location estimates obtained through time-difference-of-arrival techniques using PMU measurements. This could cause large errors in fault-location estimates and hamper repair efforts.

    What Can Be Done? Despite the success of the intermediate-type spoofing attack against a wide variety of civil GPS receivers and the known vulnerabilities of GPS-dependent critical infrastructure to spoofing attacks, anti-spoofing techniques exist that would enable receivers to successfully defend themselves against such attacks. We now turn to four promising anti-spoofing techniques.

    Cryptographic Methods

    These techniques enable a receiver to differentiate authentic GPS signals from counterfeit signals with high likelihood. Cryptographic strategies rely on the unpredictability of so-called security codes that modulate the GPS signal. An unpredictable code forces a spoofer who wishes to mount a successful spoofing attack to either

    • estimate the unpredictable chips on-the-fly, or
    • record and play back authentic GPS spectrum (a meaconing attack).

    To avoid unrealistic expectations, it should be noted that no anti-spoofing technique is completely impervious to spoofing. GPS signal authentication is inherently probabilistic, even when rooted in cryptography. Many separate detectors and cross-checks, each with its own probability of false alarm, are involved in cryptographic spoofing detection. Figure 2 illustrates how the jammer-to-noise ratio detector, timing consistency check, security-code estimation and replay attack (SCER) detector, and cryptographic verification block all work together. This hybrid combination of statistical hypothesis tests and Boolean logic demonstrates the complexities and subtleties behind a comprehensive, probabilistic GPS signal authentication strategy for security-enhanced signals.

     Figure 2. GNSS receiver components required for GNSS signal authentication. Components that support code origin authentication are outlined in bold and have a gray fill, whereas components that support code timing authentication are outlined in bold and have no fill. The schematic assumes a security code based on navigation message authentication.  Credit: Kyle Wesson, Daniel Shepard, and Todd Humphreys
    Figure 2. GNSS receiver components required for GNSS signal authentication. Components that support code origin authentication are outlined in bold and have a gray fill, whereas components that support code timing authentication are outlined in bold and have no fill. The schematic assumes a security code based on navigation message authentication.

    Spread Spectrum Security Codes. In 2003, Logan Scott proposed a cryptographic anti-spoofing technique based on spread spectrum security codes (SSSCs). The most recent proposed version of this technique targets the L1C signal, which will be broadcast on GPS Block III satellites, because the L1C waveform is not yet finalized. Unpredictable SSSCs could be interleaved with the L1C spreading code on the L1C data channel, as illustrated in Figure 3. Since L1C acquisition and tracking occurs on the pilot channel, the presence of the SSSCs has negligible impact on receivers. Once tracking L1C, a receiver can predict when the next SSSC will be broadcast but not its exact sequence. Upon reception of an SSSC, the receiver stores the front-end samples corresponding to the SSSC interval in memory. Sometime later, the cryptographic digital key that generated the SSSC is transmitted over the navigation message. With knowledge of the digital key, the receiver generates a copy of the actual transmitted SSSC and correlates it with the previously-recorded digital samples. Spoofing is declared if the correlation power falls below a pre-determined threshold.

     Figure 3. Placement of the periodically unpredictable spread spectrum security codes in the GPS L1C data channel spreading sequence.  Credit: Kyle Wesson, Daniel Shepard, and Todd Humphreys
    Figure 3. Placement of the periodically unpredictable spread spectrum security codes in the GPS L1C data channel spreading sequence.

    When the security-code chip interval is short (high chipping rate), it is difficult for a spoofer to estimate and replay the security code in real time. Thus, the SSSC technique on L1C offers a strong spoofing defense since the L1C chipping rate is high (that is, 1.023 MChips/second). Furthermore, the SSSC technique does not rely on the receiver obtaining additional information from a side channel; all the relevant codes and keys are broadcast over the secured GPS signals. Of course a disadvantage for SSSC is that it requires a fairly fundamental change to the currently-proposed L1C definition: the L1C spreading codes must be altered.

    Implementation of the SSSC technique faces long odds, partly because it is late in the L1C planning schedule to introduce a change to the spreading codes. Nonetheless, in September 2011, Logan Scott and Phillip Ward advocated for SSSC at the Public Interface Control Working Group meeting, passing the first of many wickets. The proposal and associated Request for Change document will now proceed to the Lower Level GPS Engineering Requirements Branch for further technical review. If approved there, it passes to the Joint Change Review Board for additional review and, if again approved, to the Technical Interchange Meeting for further consideration. The chances that the SSSC proposal will survive this gauntlet would be much improved if some government agency made a formal request to the GPS Directorate to include SSSCs in L1C — and provided the funding to do so. The DHS seems to us a logical sponsoring agency.

    Navigation Message Authentication. If an L1C SSSC implementation proves unworkable, an alternative, less-invasive cryptographic authentication scheme based on navigation message authentication (NMA) represents a strong fall-back option. In the same 2003 ION-GNSS paper that he proposed SSSC, Logan Scott also proposed NMA. His paper was preceded by an internal study at MITRE and followed by other publications in the open literature, all of which found merit in the NMA approach. The NMA technique embeds public-key digital signatures into the flexible GPS civil navigation (CNAV) message, which offers a convenient conveyance for such signatures. The CNAV format was designed to be extensible so that new messages can be defined within the framework of the GPS Interference Specification (IS). The current GPS IS defines only 15 of 64 CNAV messages, reserving the undefined 49 CNAV messages for future use.

    Our lab recently demonstrated that NMA works to authenticate not only the navigation message but also the underlying signal. In other words, NMA can be the basis of comprehensive signal authentication. We have  proposed a specific implementation of NMA that is packaged for immediate adoption. Our proposal defines two new CNAV messages that deliver a standardized public-key elliptic-curve digital algorithm (ECDSA) signature via the message format in Figure 4.

    Figure 4. Format of the proposed CNAV ECDSA signature message, which delivers the first or second half of the 466-bit ECDSA signature and a 5-bit salt in the 238-bit payload field. Credit: Kyle Wesson, Daniel Shepard, and Todd Humphreys
    Figure 4. Format of the proposed CNAV ECDSA signature message, which delivers the first or second half of the 466-bit ECDSA signature and a 5-bit salt in the 238-bit payload field.

    Although the CNAV message format is flexible, it is not without constraints. The shortest block of data in which a complete signature can be embedded is a 96-second signature block such as the one shown in Figure 5. In this structure, the two CNAV signature messages are interleaved between the ephemeris and clock data to meet the broadcast requirements.

     Figure 5. The shortest broadcast signature block that does not violate the CNAV ephemeris and timing broadcast requirements. To meet the required broadcast interval of 48 seconds for message types 10, 11, and one of 30–39, the ECDSA signature is broadcast over a 96-second signature block that is composed of eight CNAV messages.  Credit: Kyle Wesson, Daniel Shepard, and Todd Humphreys
    Figure 5. The shortest broadcast signature block that does not violate the CNAV ephemeris and timing broadcast requirements. To meet the required broadcast interval of 48 seconds for message types 10, 11, and one of 30–39, the ECDSA signature is broadcast over a 96-second signature block that is composed of eight CNAV messages.

    The choice of the duration between signature blocks is a tradeoff between offering frequent authentication and maintaining a low percentage of the CNAV message reserved for the digital signature. In our proposal, signature blocks are transmitted roughly every five minutes (Figure 6) so that only 7.5 percent of the navigation message is devoted to the digital signature. Across the GPS constellation, the signature block could be offset so that a receiver could authenticate at least one channel approximately every 30 seconds. Like SSSC, our proposed version of NMA does not require a receiver’s getting additional information from a side channel, provided the receiver obtains public key updates on a yearly basis.

    message_sig_block .  Credit: Kyle Wesson, Daniel Shepard, and Todd Humphreys
    Figure 6. A signed 336-second broadcast. The proposed strategy signs every 28 CNAV messages with a signature broadcast over two CNAV messages on each broadcast channel.

    NMA is inherently less secure than SSSC. A NMA security code chip interval (that is, 20 milliseconds) is longer than a SSSC chip interval, thereby allowing the spoofer more time to estimate the digital signature on-the-fly. That is not to say, however, that NMA is ineffective. In fact, tests with our laboratory’s spoofing testbed demonstrated the NMA-based signal authentication structure described earlier offered a receiver a better-than 95 percent probability of detecting a spoofing attack for a 0.01 percent probability of false alarm under a challenging spoofing-attack scenario.

    NMA is best viewed as a hedge. If the SSSC approach does not gain traction, then NMA might, since it only requires defining two new CNAV messages in the GPS IS — a relatively minor modification. CNAV-based NMA could defend receivers tracking L2C and L5. A new CNAV2 message will eventually be broadcast on L1 via L1C, so a repackaged CNAV2-based NMA technique could offer even single-frequency L1 receivers a signal-side anti-spoofing defense.

    P(Y) Code Dual-Receiver Correlation. This approach avoids entirely the issue of GPS IS modifications. The technique correlates the unknown encrypted military P(Y) code between two civil GPS receivers, exploiting known carrier-phase and code-phase relationships. It is similar to the dual-frequency codeless and semi-codeless techniques that civil GPS receivers apply to track the P(Y) code on L2. Peter Levin and others filed a patent on the codeless-based signal authentication technique in 2008; Mark Psiaki extended the approach to semicodeless correlation and narrow-band receivers in a 2011 ION-GNSS paper.

    In the dual-receiver technique, one receiver, stationed in a secure location, tracks the authentic L1 C/A codes while receiving the encrypted P(Y) code. The secure receiver exploits the known timing and phase relationships between the C/A code and P(Y) code to isolate the P(Y) code, of which it sends raw samples (codeless technique) or estimates of the encrypting W-code chips (semi-codeless technique) over a secure network to the defending receiver. The defending receiver correlates its locally-extracted P(Y) with the samples or W-code estimates from the secure receiver. If a spoofing attack is underway, the correlation power will drop below a statistical threshold, thereby causing the defending receiver to declare a spoofing attack. Although the P(Y) code is 20 MHz wide, a narrowband civil GPS receiver with 2.6 MHz bandwidth can still perform the statistical hypothesis tests even with the resulting 5.5 dB attenuation of the P(Y) code. Because the dual-receiver method can run continuously in the background as part of a receiver’s standard GPS signal processing, it can declare a spoofing attack within seconds — a valuable feature for many applications.

    Two considerations about the dual-receiver technique are worth noting. First, the secure receiver must be protected from spoofing for the technique to succeed. Second, the technique requires a secure communication link between the two receivers. Although the first requirement is easily achieved by locating secure receivers in secure locations, the second requirement makes the technique impractical for some applications that cannot support a continuous communication link.

    Of all the proposed cryptographic anti-spoofing techniques, only the dual-receiver method could be implemented today. Unfortunately the P(Y) code will no longer exist after 2021, meaning that systems that make use of the P(Y)-based dual-receiver technique will be rendered unprotected, although a similar M-code-based technique could be an effective replacement. The dual-receiver method, therefore, is best thought of as a stop-gap: it can provide civil GPS receivers with an effective anti-spoofing technique today until a signal-side civil GPS authentication technique is approved and implemented in the future This sentiment was the consensus of the panel experts at the 2011 ION-GNSS session on civil GPS receiver security.

    Non-Cryptographic Methods

    Non-cryptographic techniques are enticing because they can be made receiver-autonomous, requiring neither security-enhanced civil GPS signals nor a side-channel communication link. The literature contains a number of proposed non-cryptographic anti-spoofing techniques. Frequently, however, these techniques rely on additional hardware, such as accelerometers or inertial measurements units, which may exceed the cost, size, or weight requirements in many applications. This motivates research to develop software-based, receiver-autonomous anti-spoofing methods.

    Vestigial Signal Defense (VSD). This software-based, receiver-autonomous anti-spoofing technique relies on the difficulty of suppressing the true GPS signal during a spoofing attack. Unless the spoofer generates a phase-aligned nulling signal at the phase center of the victim GPS receiver’s antenna, a vestige of the authentic signal remains and manifests as a distortion of the complex correlation function. VSD monitors distortion in the complex correlation domain to determine if a spoofing attack is underway.

    To be an effective defense, the VSD must overcome a significant challenge: it must distinguish between spoofing and multipath. The interaction of the authentic and spoofed GPS signals is similar to the interaction of direct-path and multipath GPS signals. Our most recent work on the VSD suggests that differentiating spoofing from multipath is enough of a challenge that the goal of the VSD should only be to reduce the degrees-of-freedom available to a spoofer, forcing the spoofer to act in a way that makes the spoofing signal or vestige of the authentic GPS signal mimic multipath. In other words, the VSD seeks to corner the spoofer and reduce its space of possible dynamics.

    Among other options, two potential effective VSD techniques are

    • a maximum-likelihood bistatic-radar-based approach and
    • a phase-pseudorange consistency check.

    The first approach examines the spatial and temporal consistency of the received signals to detect inconsistencies between the instantaneous received multipath and the typical multipath background environment. The second approach, which is similar to receiver autonomous integrity monitoring (RAIM) techniques, monitors phase and pseudorange observables to detect inconsistencies potentially caused by spoofing. Again, a spoofer can act like multipath to avoid detection, but this means that the VSD would have achieved its modest goal.

    Anti-Spoofing Reality Check

    Security is a tough sell. Although promising anti-spoofing techniques exist, the reality is that no anti-spoofing techniques currently defend civil GPS receivers. All anti-spoofing techniques face hurdles. A primary challenge for any technique that proposes modifying current or proposed GPS signals is the tremendous inertia behind GPS signal definitions. Given the several review boards whose approval an SSSC or NMA approach would have to gain, the most feasible near-term cryptographic anti-spoofing technique is the dual-receiver method. A receiver-autonomous, non-cryptographic approach, such as the VSD, also warrants further development. But ultimately, the SSSC or NMA techniques should be implemented: a signal-side civil GPS cryptographic anti-spoofing technique would be of great benefit in protecting civil GPS receivers from spoofing attacks.

    Manufacturers

    The high-quality handheld receiver cited in Figure 1 was a Trimble Juno SB. Testbed equipment shown: Schweitzer Engineering Laboratories SEL-421 synchrophasor measurement unit; Ramsey STE 3000 radio-frequency test chamber; Ettus Research USRP N200 universal software radio peripheral; Schweitzer SEL-2401 satellite-synchronized clock (blue); Trimble Resolution SMT receiver (silver); HP GPS time and frequency reference receiver.

    References, Further Information

    University of Texas Radionavigation Laboratory.

    Full results of Figure 1 experiment are given in Shepard, D.P. and T.E. Humphreys, “Characterization of Receiver Response to Spoofing Attacks,” Proceedings of ION-GNSS 2011.

    NMA can be the basis of comprehensive signal authentication: Wesson, K.D., M. Rothlisberger, T. E. Humphreys (2011), “Practical cryptographic civil GPS signal authentication,” Navigation, Journal of the ION, submitted for review.

    Humphreys, T.E, “Detection Strategy for Cryptographic GNSS Anti-Spoofing,” IEEE Transactions on Aerospace and Electronic Systems, 2011, submitted for review.


    Kyle Wesson is pursuing his M.S. and Ph.D. degrees in electrical and computer engineering at the University of Texas at Austin. He is a member of the Radionavigation Laboratory. He received his B.S. from Cornell University.

    Daniel Shepard is pursuing his M.S. and Ph.D. degrees in aerospace engineering at the University of Texas at Austin, where he also received his B.S. He is a member of the Radionavigation Laboratory.

    Todd Humphreys is an assistant professor in the department of Aerospace Engineering and Engineering Mechanics at the University of Texas at Austin and director of the Radionavigation Laboratory. He received a Ph.D. in aerospace engineering from Cornell University.