The National Geodetic Survey (NGS) has revised an important technical document on the modernized National Spatial Reference System (NSRS). Zilkoski explores a use case on flood mapping, discussing an Elevation Certificate example, Flood Insurance Rate Map and Flood Insurance Study. NGS has scheduled a webinar for April 8 to discuss the four use case examples.
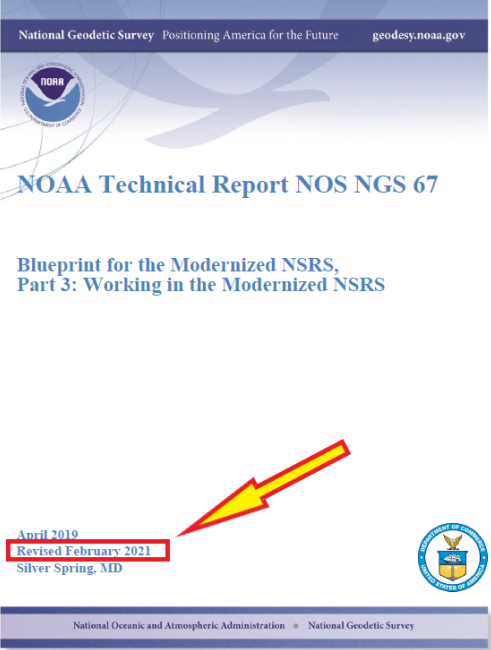
In February 2021, the National Geodetic Survey (NGS) revised NOAA Technical Report NOS NGS 67 Blueprint for the Modernized NSRS, Part 3: Working in the Modernized NSRS. Users can download the publication. See the box titled “NOAA Technical Report NOS NGS 67.”
On March 11, NGS held a webinar describing the revised document (see box titled “Working in the Modernized NSRS”). Download a video of the webinar and the presentation.
The revised document added four use cases to describe how someone might access and use the NSRS in the future:
- Use Case 1: Flood Mapping,
- Use Case 2: Passive Control for a Multi-year Corridor Project,
- Use Case 3: Transitioning Data to the Modernized NSRS, and
- Use Case 4: Leveraging the Modernized NSRS for Airport and Other Infrastructure Monitoring.
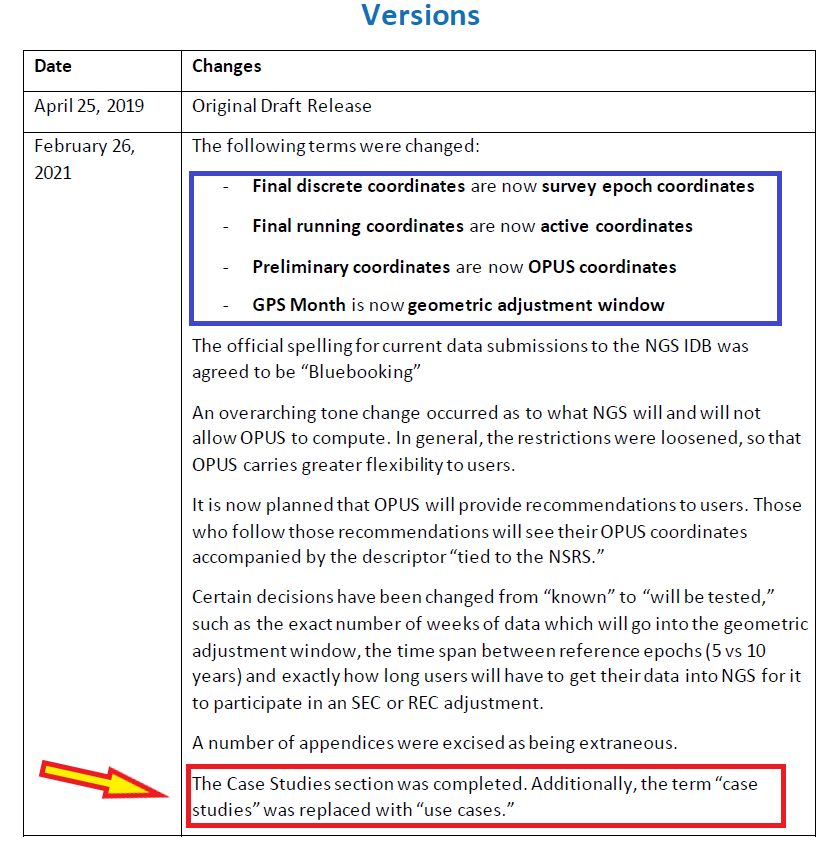
The box titled “Major Changes to NOS NGS 67” highlights the changes in the February 2021 revised version.
This column will highlight one of the four use cases: “Use Case 1: Flood Mapping.” The case study discusses the Elevation Certificate (CE) example, Flood Insurance Rate Map (FIRM), and Flood Insurance Study (FIS).
The following is the scenario that NGS considered in this use case:
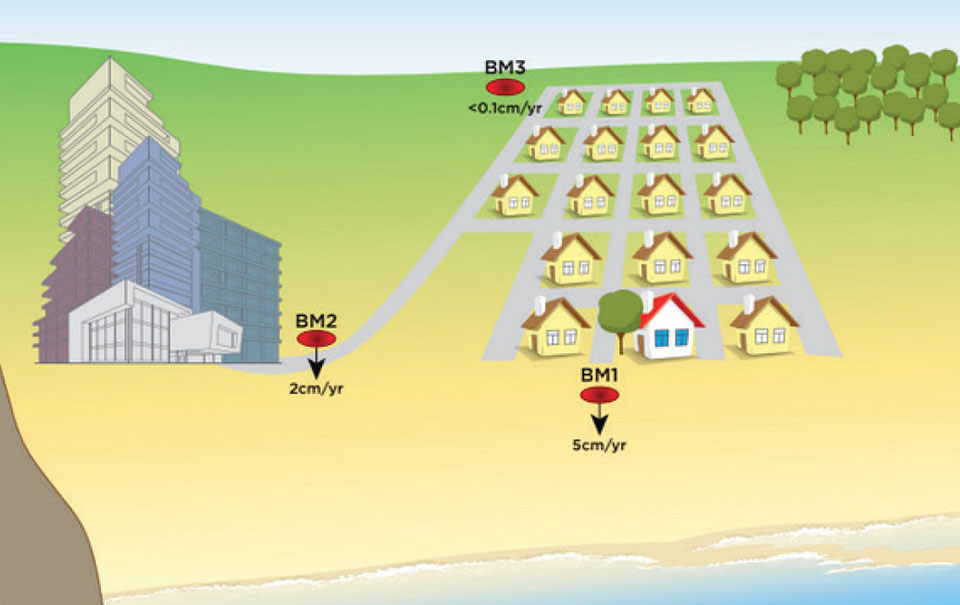
“This use case’s examples are set in an imaginary flood-prone coastal community experiencing non-uniform ground subsidence at the watershed scale (see Figure 10). Although many areas are not subject to this level of vertical motion, the full benefits of NSRS modernization are most apparent in this context. We illustrate differences in the use of the NSRS of today and the modernized NSRS with two common NFIP workflows. First, we consider steps anticipated in the certification of NAPGD2022 elevations for a NFIP Elevation Certificate. Second, we step into the shoes of a FEMA Mapping Partner to examine the ways future NSRS tools support more accurate mapping in Flood Insurance Rate Map (FIRM) and Flood Information Study (FIS) updates.”
I think this is a good scenario to use to demonstrate the full benefits of the NSRS modernization in areas of subsidence, but I believe there are important issues that will need to be addressed before the implementation of NAPGD2022 in flood mapping projects. I will highlight some of these issues later in the newsletter. First, let’s look at NGS example.
As depicted in figure 10 in NOS NGS 67 technical document, the area has three difference subsidence rates (<0.1 cm/yr., 2 cm/yr., and 5 cm/yr.). See the box titled “Diagram of fictional case study location for Use Case 1.” As NGS stated in the document, “Although many areas are not subject to this level of vertical motion, the full benefits of NSRS modernization are most apparent in this context.”
This may not be the typical situation of a flood mapping project but it should be noted that this type of high individual rates and large relative rate differences has occurred in the Houston-Galveston, Texas, region (see the following publications):
- Subsidence at Houston, Texas 1973-87
- The Harris-Galveston Coastal Subsidence District/National Geodetic Survey Automated Global Positioning System Subsidence Monitoring Project
- 2018 Annual Groundwater Project
NGS’s example illustrates differences in the use of the NSRS today and the future NSRS with two common National Flood Insurance Program (NFIP) workflows. The example addresses surveyors performing a FEMA Elevation Certification using NAPGD2022 elevations, and the ways future NSRS tools support more accurate mapping in Flood Insurance Rate Map (FIRM) and Flood Information Study (FIS) updates.
It should be noted that according to the September 27, 2017, Office of Inspector General Department of Homeland Security OIG-17-110 report, FEMA’s goal is to review flood maps every five years.
“According to the National Flood Insurance Reform Act of 1994, FEMA must assess the need to revise and update all floodplain areas and flood risk zones identified once during each 5-year period. Thus, valid miles will expire every five years if not assessed. Failure to assess an NVUE compliant mile within the 5-year window will result in the mile being re-categorized as “Unknown” in the Needs Database. Unknown miles have not been subjected to the validation process to determine whether they reflect the current flood risk or are in need of restudy. In 2009, FEMA set a goal to attain 80 percent NVUE by the end of fiscal year 2014.” — Excerpt from Department of Homeland Security OIG-17-110 report
The modernized NSRS will help facilitate meeting this goal. This is described in NGS’s use case example:
NFIP products will primarily utilize the official NSRS reference epochs
“As the NFIP is structured today, NFIP products will primarily utilize the official NSRS reference epochs. Additionally, some NFIP products such as the EC form itself, as well as guidance, and technical references for FIRM and FIS preparation would benefit from updates that reflect changes to the NSRS. While the time-dependency and incorporation of a gravimetric geoid model will manifest as improved risk assessment reliability in inundation map products, we notably anticipate that NSRS modernization will have a limited impact on the basic structure of most recommended workflows associated with the NFIP of today. The most significant development is therefore the opportunity for FEMA’s National Flood Mapping Program (NFMP) to increasingly leverage the new capabilities of the NSRS to ensure that current, accurate ground elevation data is used, and to better incorporate relevant flood control structure and future conditions mapping data to support decision-making beyond the NFIP. Details of how the modernized NSRS can help FEMA achieve broader NFMP objectives and opportunities for data-driven case studies to explore this are described at the end of the use case.”
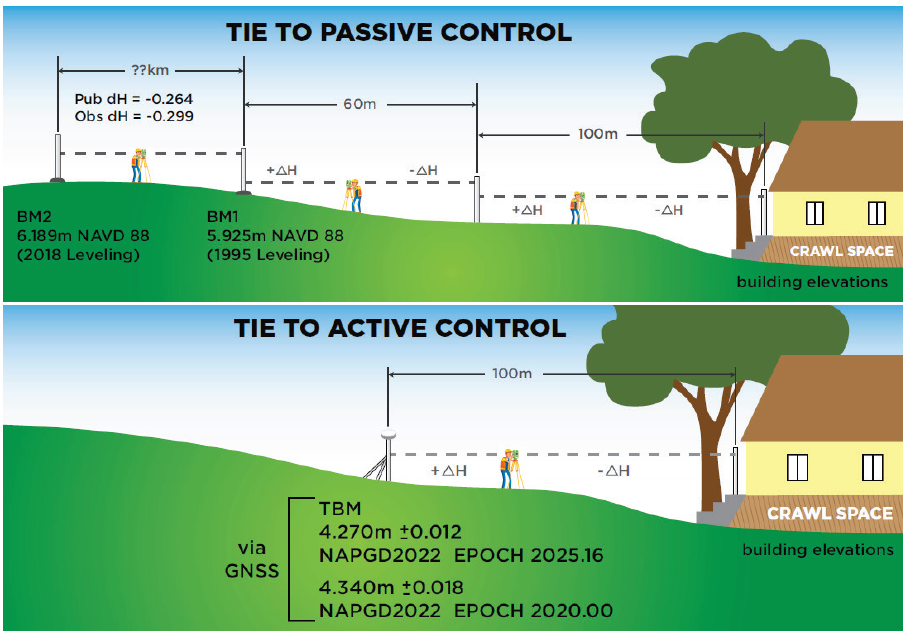
So, what does this really mean? The document uses two diagrams to explain how the new NSRS would be used to estimate a height for a FEMA Elevation Certificate (see box titled “Figure 11 from Use Case 1”). The top cartoon labeled “Tie to Passive Control” describes the process being performed today. That is, a surveyor locates the two closest marks that have published orthometric heights, follows the appropriate surveying procedures to ensure that the marks have not moved since the last time they were leveled to, and then performs the appropriate procedures to obtain the height for the Elevation Certificate. Depending on the location of the published orthometric heights in the area of the structure, this process could be very expensive. The lower cartoon labeled “Tie to Active Control” describes the process that will be used in the modernized NSRS using NADGP2022 heights. The user would occupy a temporary mark near the structure with GNSS to obtain a NAPGD2022 orthometric height computed using the appropriate ellipsoid height and geoid height value, and then perform the appropriate leveling procedures to obtain the height for the Elevation Certificate. This process will provide the most up-to-date height in the area.
There is an issue that should be noted here: the temporary mark determined using active control may provide the most up-to-date height at a particular location but that height may not be consistent with the heights used to establish the Base Flood Elevation (BFE). At first, someone would say, that’s good because it’s indicating that the flood hydraulics have changed on the floodplain map. However, without performing a detailed height analysis in the region, the user won’t really know whether the BFE value should be updated based on the current changes in topography in the floodplain region. In other words, if the entire region has subsidence at the same rate then the relative height difference hasn’t changed, and the new starting height may not be consistent with the published BFE on the FEMA Floodplain Map. In most floodplain mapping regions, the changes in heights are probably less than the accuracy of the maps but using the height of a mark that is not consistent with the BFE could place a homeowner’s house incorrectly in a flood zone. A good surveying practice would include occupying several marks with GNSS (or leveling between marks) that were involved in the creation of the flood insurance study and the generation of the floodplain map to ensure that the height used on the Elevation Certificate is consistent with the BFE. This is a good procedure to use for the current NSRS as well as the modernized NSRS. However, this is not economically practical using the current NSRS but could be in the new NSRS which is a major benefit of the modernized NSRS.
So, let’s look at the Houston-Galveston region using the latest information available.
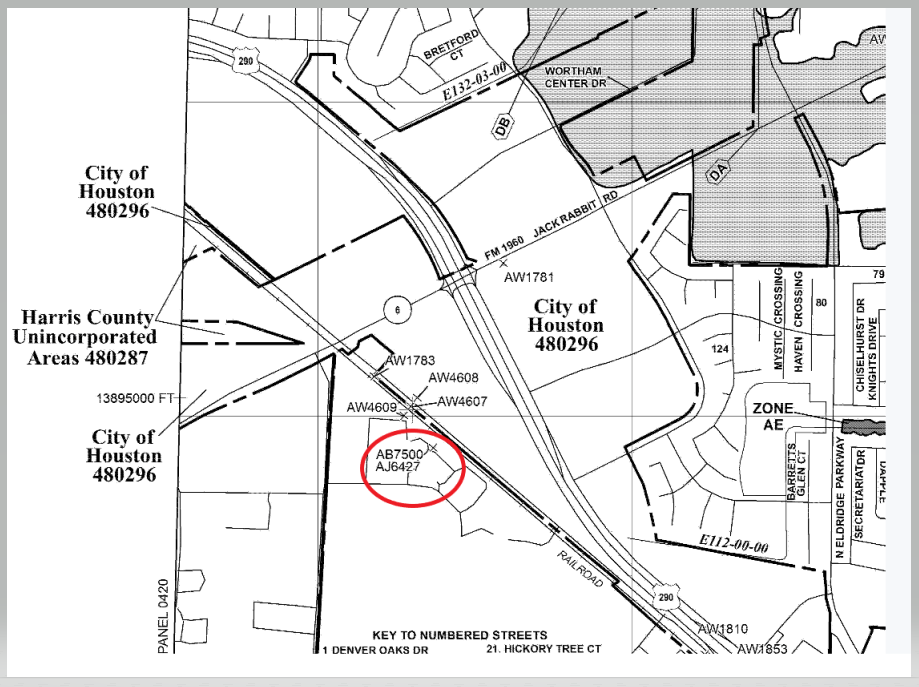
Download latest FEMA Flood Insurance Rate Map (FIRM). See box titled “Excerpt from FEMA FIRM Map Number 48201C0440N.”
According to the latest Flood Insurance Study (FIS), the heights used in the study were based on a 2001 adjustment performed by the county. You can download the FIS from FEMA Flood Map Service Center | Search All Products, 48201CV001G (fema.gov) and map1.msc.fema.gov.
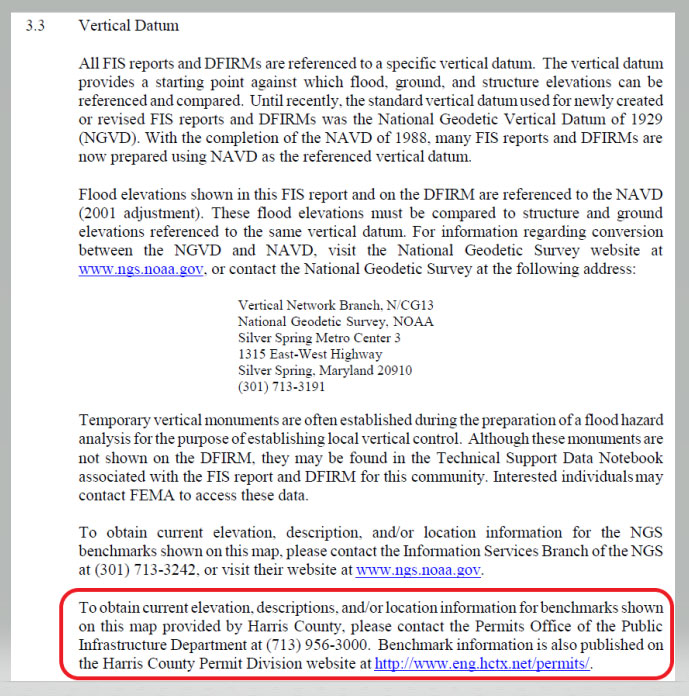
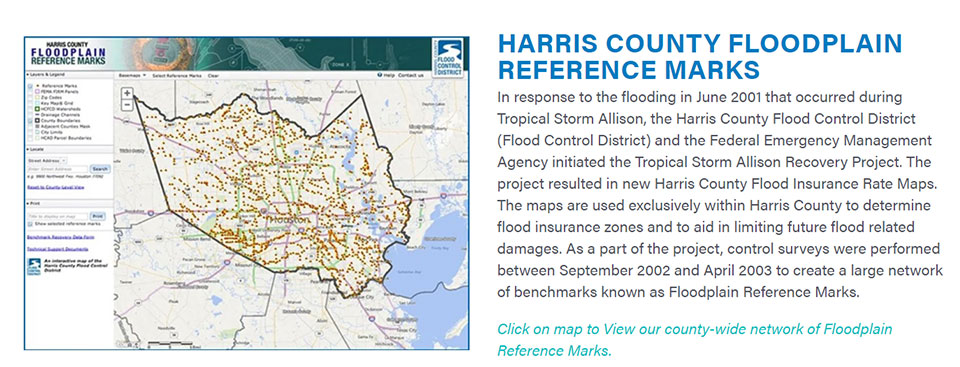
I’d like to highlight a few statements in the FIS. First, the reports states that the FIS and DFIRM are referenced to the NAVD (2001 Adjustment). See the box titled “Page 111 from November 15, 2019 Flood Insurance Study 48201CV001G.” The report provides a link for users to obtain the latest vertical control data. Users can find information about the Harris County Floodplain Reference Marks here (See box titled “Harris County Floodplain Reference Marks.”) Users also can access the vertical control data at the county website.
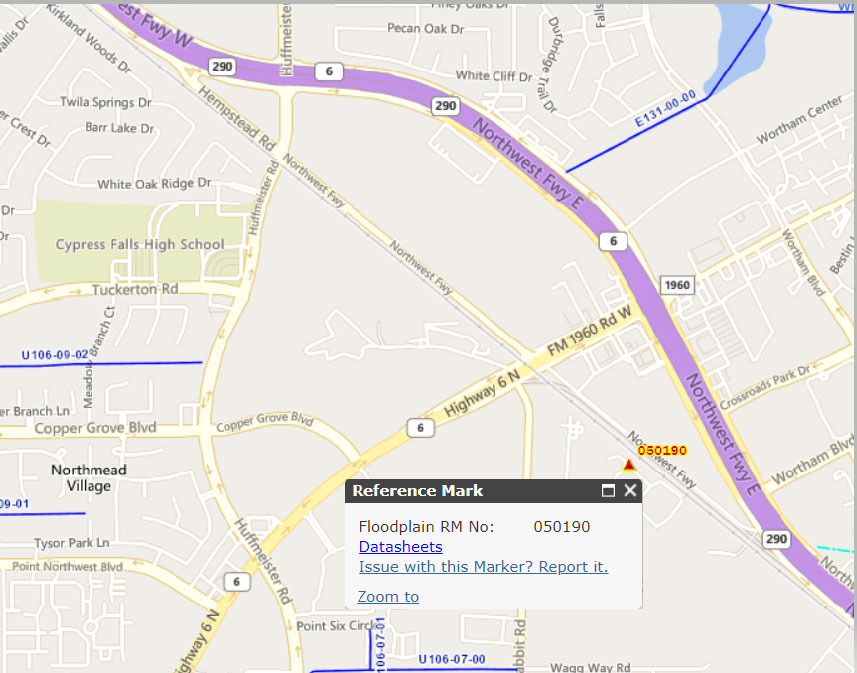
The box titled “Snapshot of Vertical Control from Harris County Floodplain Reference Marks Website” depicts the location of one of the reference marks, denoted as 050190.
Clicking on the datasheets link, provides the information about the floodplain reference mark in the Harris County Flood Control District’s system (see the box titled “Harris County Floodplain Reference Mark Datasheet”).
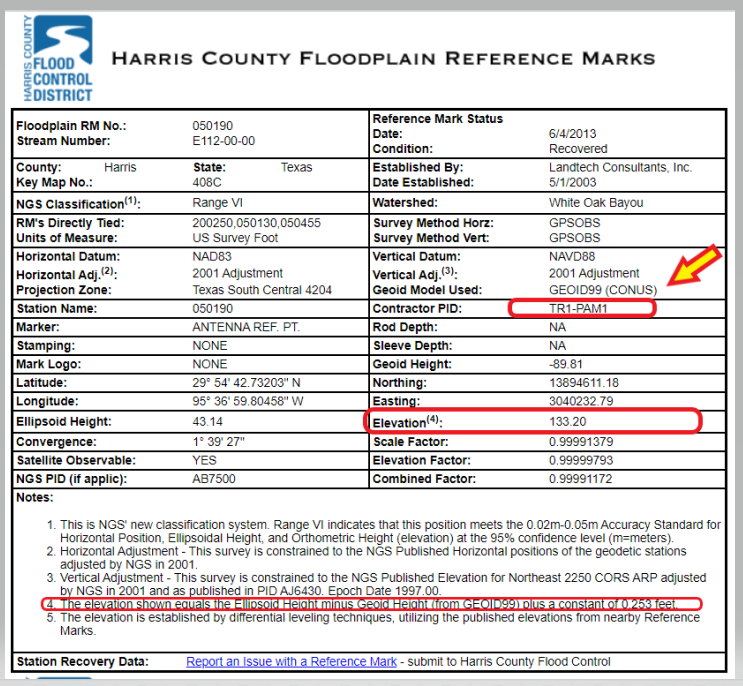
It should be noted that the GNSS-derived orthometric heights were based on GEOID99 and the official hybrid geoid model published by NGS today is GEOID18. A GNSS-derived orthometric height computed using NGS’ webtool OPUS will use GEOID18 not GEOID99. The difference between GEOID99 and GEOID18 at this location is approximately 0.45 feet (0.138 meters). Users must ensure that they are using heights that are consistent with the BFE on the FIRM. The new NAPGD2022 will help to reduce issues associated with effects due to changes in geoid models.
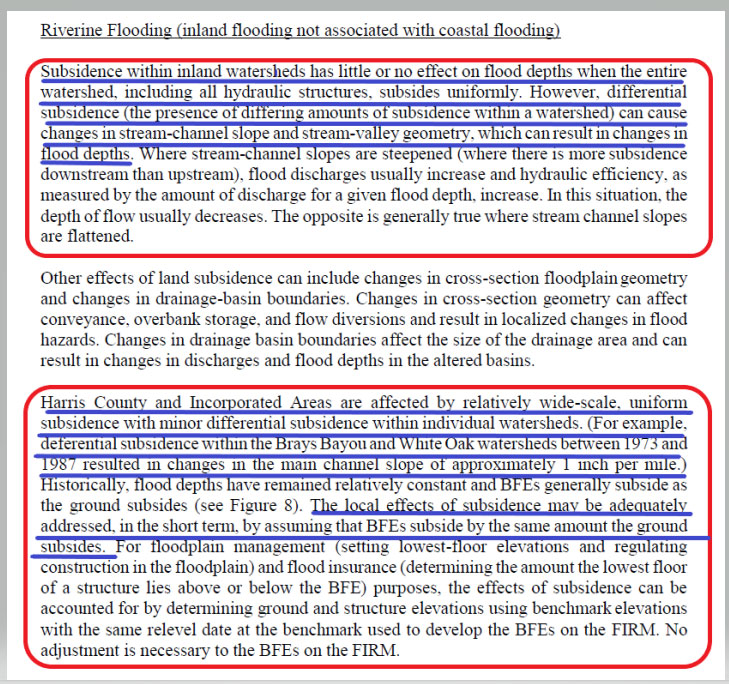
Page 113 from the November 15, 2019 Flood Insurance Study 48201CV001G addresses the issues associated with riverine flood in the region. (See the box titled “Page 113 from November 15, 2019 Flood Insurance Study 48201CV001G.”) The highlighted sections basically state that subsidence within inland watersheds has little or no effect on flood depths when the entire watershed subsides at the same rate. However, it also states that differential subsidence can cause changes in flood depths. The report goes on to say that the “Harris County and Incorporated Areas are affected by wide-scale, uniform subsidence with minor differential subsidence within individual watersheds.” It also states that “The local effects of subsidence may be adequately addressed, in the short term, by assuming that BFEs subside by the same amount the ground subsides.” The Houston-Galveston, Texas, region is a very complicated area due to the differential subsidence and numerous individual watersheds.
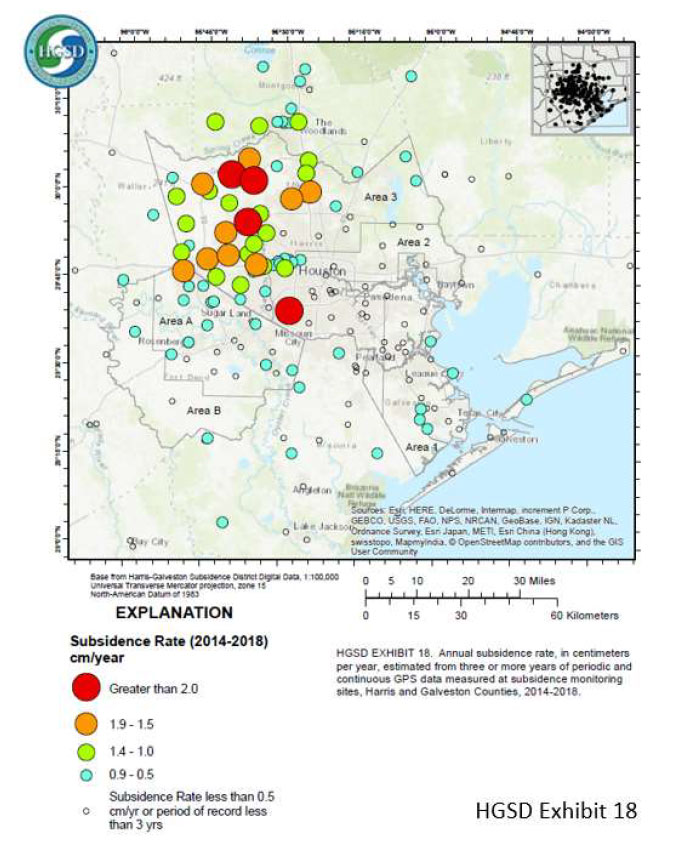
That said, let’s look some of the latest subsidence data in the region. The Harris-Galveston Subsidence District’s 2018 Annual Groundwater Report By Robert Thompson, William M. Chrismer, and Christina Petersen, PhD, P.E. provide some of the latest estimates of subsidence in the region. The box titled “HGSD Exhibit 18” depicts the locations of the GNSS sites used in the study. The plot provides the average compaction in centimeters over the past five years. The values range from 0.0 cm/year to greater than 2.5 cm/year.
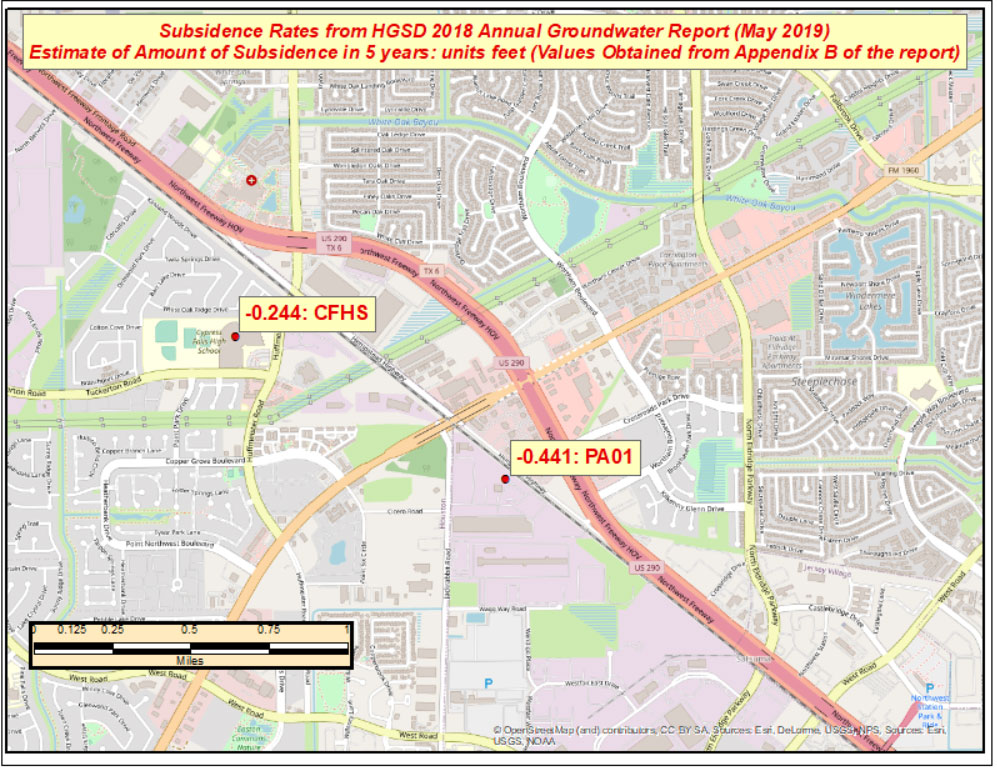
I used the information from Appendix B provided in the report to generate a few plots that show the estimate of subsidence in feet over 5 years. I’ve highlighted some marks that have large relative height changes. (Note: The units of the previous figure are centimeters; the units of the next several plots are feet.)

The relative height change between the two marks PA01 and CFHS, which are about 1.5 kilometers (approximately 1 mile) apart, is 0.197 feet in only 5 years. (See the box titled “Estimate of Amount of Subsidence in 5 Years at Pam 1– Units Feet.”)
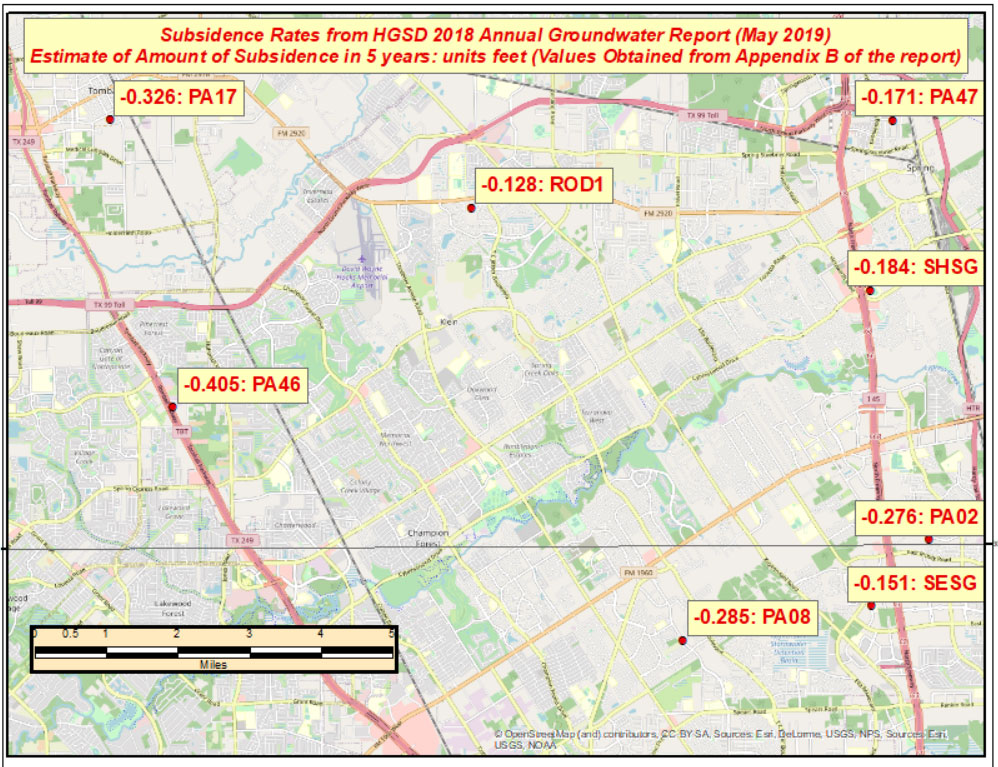
The estimated relative height change between mark PA46 and ROD1, which are about 8 kilometers (approximately 5 miles) apart, is 0.277 feet in five years. (See the box titled “Estimate of Amount of Subsidence in 5 Years at Pam 46 – Units: Feet.”)
The effect of these large relative differences may not have any effect on the BFE on a particular watershed. These subsidence estimates are at a specific mark so they only provide information at a particular location. The new NAPGD2022 along with NGS’s webtools will enable users to economically obtain current, accurate heights in the entire region. Leveraging the capabilities of the new NSRS will help facilitate the implementation of FEMA’s goal of assessing the need to revise and update all floodplain areas and flood risk zones identified once during each five-year period.
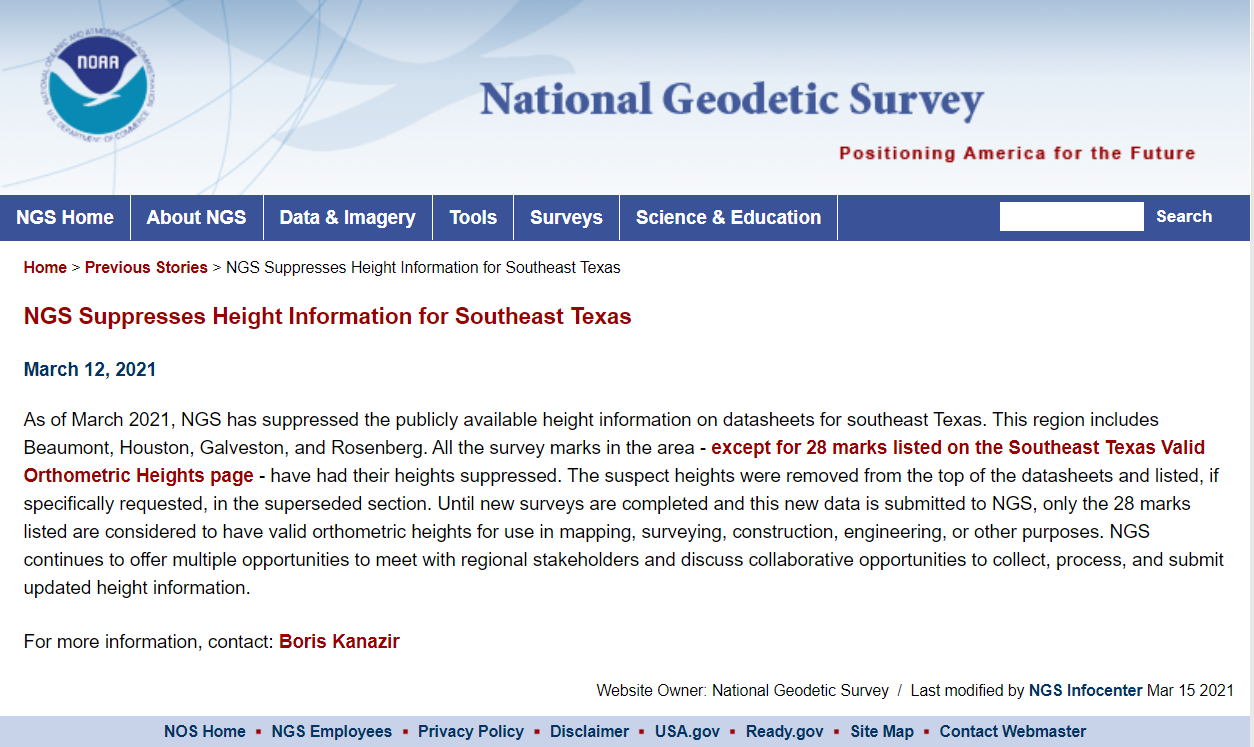
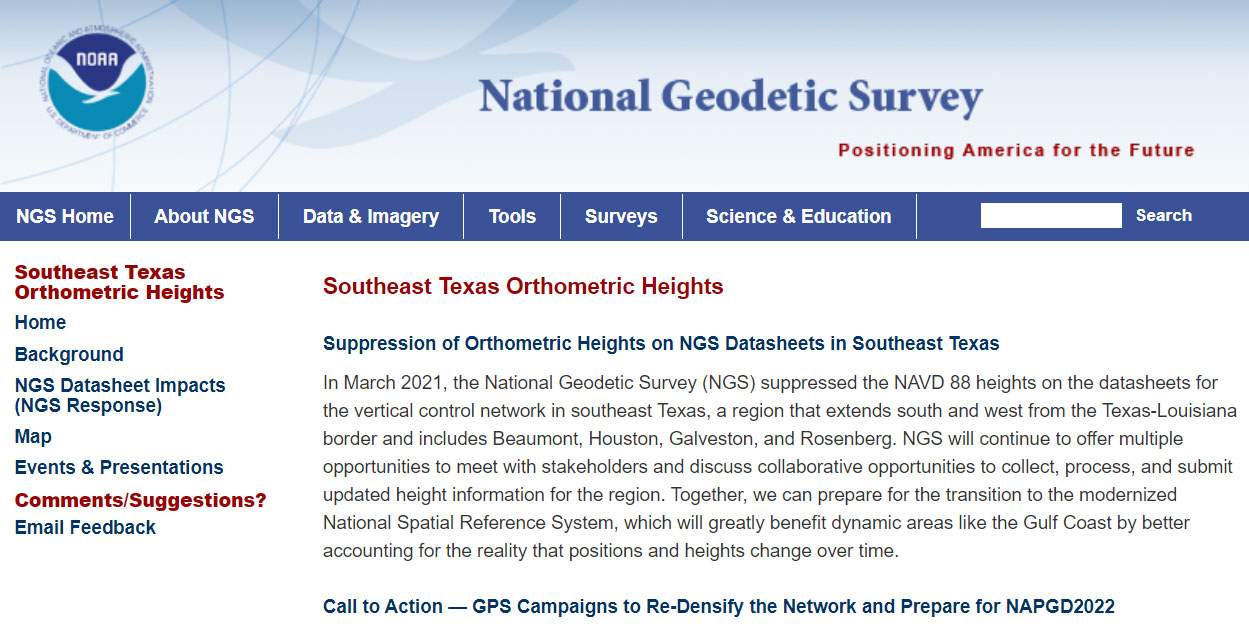
There’s one last item that I’d like to highlight in this newsletter. On March 12, NGS announced that they are suppressing height information in Southeast Texas. See the box titled “NGS Announcement to Suppresses Height Information for Southeast Texas” for more information.
This column highlighted the potential effects of subsidence on published heights in the Houston, Texas, region, which implies that most of the published heights based on older surveys in the region are not current or accurate.
According to the announcement, only 28 marks will have publicly available orthometric heights on NGS datasheets in Southeast Texas. This NOAA website provides more information. See the box titled “NGS Southeast Texas Orthometric Heights.”
I would encourage everyone to check out the website to obtain a better understanding of what this suppression of published heights means to their operations. Future newsletters will address the suppression of the orthometric heights in Southeast Texas, and how users can help densify the network and prepare for the new, modernized NAPGD2022. Again, a benefit of the new modernized NSRS will facilitate the establishment of consistent, accurate NAPGD2022 GNSS-derived orthometric heights.
Lastly, NGS is convening the 2021 Geospatial Summit on May 4 and 5. The 2021 Geospatial Summit will provide updated information about the planned modernization of the National Spatial Reference System (NSRS). Register here.