Broadcast Date: Thursday, June 16, 2016 On Demand available until: Thursday, June 15, 2017 Duration: 60 minutes + time for Q&A Sponsor:u-blox
Connected cars and V2X — connectivity between vehicles and infrastructure — lie around the next bend in the road. Extensive research and development have prepared these revolutionary concepts for implementation very soon.
Join GPS World and our panel of expert presenters as we discuss:
Recent developments in – and the potential safety impact of – V2X technology.
The role of GNSS, and potential challenges in accuracy, reliability, jamming and spoofing.
How radar, lidar, cameras, dedicated short range communications (DSRC) and V2X will combine to create advanced Advanced Driver Assistance Systems (ADAS).
Potential regulations and aftermarket devices.
Speakers: Chaminda Basnayake, Principal Engineer, V2X Systems, Renesas Electronics; John Kenney, Director and Principal Researcher, Network Division Toyota InfoTechnology Center; Nikolaos Papadopoulos, President, u-blox America, Inc.; and Roger Berg, Vice President, Wireless Technologies DENSO North American Research and Development Laboratories.
Moderator: Alan Cameron, Editor-In-Chief, GPS World
Savari Inc., a V2X (vehicle-to-everything) communication and safety technology company, is showcasing its advanced V2X safety communications solutions at TU-Automotive Detroit, taking place June 8-9 in Novi, Michigan.
At the show, Savari will be hosted by Qualcomm Technologies and will offer live demonstrations in Qualcomm booth #C69. The live demonstrations simulate real-life automotive traffic scenarios and how in-car V2X applications make driving safer and more efficient. It will feature predictive applications such as intersection movement assist (IMA), forward collision warning (FCW), blind-spot warning (BSW) and lane-change warning (LCW).
Savari’s and Qualcomm’s V2X technology delivers superior reliability compared to other solutions, eliminating the need for cameras that require line of sight, and ensuring lane level accuracy up to 0.6 mile/1 kilometer of communication range. These capabilities make V2X suitable for for future transportation initiatives, including self-driving cars.
A pioneer in V2X safety communications technologies, Savari delivers a suite of solutions that enable connected vehicles to interact with other vehicles, roadside infrastructure, smartphones and pedestrians, the company said.
Savari has achieved more 400,000 hours of public testing of its on-board units, covering more than 15 million miles traveled. Savari is also an active participant in major public U.S. smart city testbeds, with more than 90 percent of currently installed road-side-units, covering 130 public square miles.
STMicroelectronics and Israel-based Autotalks have announced their fusion of GNSS technology and V2X ranging.
The new V2X-Enhanced GNSS ensures authenticated and secure vehicle localization for extreme accuracy and reliability of positioning information, especially in urban canyons, tunnels and parking structures, where accurate absolute and relative positioning-to other vehicles and infrastructure-is critical in progress toward semi- and fully-autonomous vehicles.
STMicroelectronics is a semiconductor company, and Israel-based Autotalks is a V2X-chipset market company involved in the first wave of V2X deployments.
Development of V2X-Enhanced GNSS builds on the companies’ successes in co-developing a V2X chipset that connects vehicles to other vehicles and infrastructure within wireless range for safety and mobility applications, the companies said in a press release.
The promise of efficient, coordinated, and safe driving of autonomous cars can result only from the accurate positioning that the fusion of GNSS with V2X technology achieves, the companies said.
“Autotalks fully recognizes that autonomous driving requires equal measures of reliability, accuracy, and security and no driver would sacrifice any of these,” said Hagai Zyss, CEO of Autotalks.
“Our solutions have been architected from the beginning to enable automated driving and because we recognize positioning for autonomous vehicles as critical, Autotalks, with ST, continues to optimize accurate V2X positioning-and we believe that our customers understand the value and potential.”
V2X-Enhanced GNSS technology, when coupled with V2X-enabled infrastructure, can uniquely provide absolute positioning to vehicles to assure lane-level accuracy. This precision improves navigation in urban canyons and tunnels and is also being used to develop myriad new applications, such as autonomous on-street and in-garage parking and available-spot identification.
“To fully realize the safety, convenience and other benefits of autonomous driving, we need confidence in the security, reliability and accuracy of the communications between our vehicle and its surroundings to know precisely how close we are to things, whether — and in what direction — they are moving, and what they are telling us — such as when there are roadworks or an accident ahead,” said Antonio Radaelli, director of Infotainment, Automotive Digital Division, STMicroelectronics.
“Building upon our successful collaboration with Autotalks, we are combining ST’s state-of-the-art positioning technology and roadmap for high-precision Automotive GNSS supporting satellite signal authentication with Autotalks’ expertise in advanced signal-processing algorithms for ranging, to smoothly pave the road to secure, accurate, and reliable V2X-Enhanced GNSS.”
Field trials in an Asian country, monitored by a government agency, are being used to test this technology in 2016.
Recent progress with Dedicated Short Range Communications (DSRC) Notice of Proposed Rule Making (NPRM) brings connected cars or V2X — connectivity between vehicles, infrastructure and all road users — closer to reality than ever before. If all goes well, an NHTSA mandate on DSRC in new light vehicles is expected to start around 2020 as a phase-in plan, with completion around 2025.
Regulations for aftermarket devices are expected to come soon after. The mandate is expected to leave auto OEMs to choose the applications and human-machine interface (HMI). This will be the culmination of more than a decade of technology development and standardization by U.S. Department of Transportation (USDOT), automotive OEMs and other industry partners.
Significance of V2X. According to USDOT, V2X technology can positively impact more than 80% of non-impaired vehicle crash types that result in over 30,000 deaths in the U.S. alone. A report by the Federal Highway Administration to Congress states that V2X technology is ready to be deployed in the near future and is expected to yield significant safety and efficiency benefits.
From a consumer’s perspective, V2X will be a part of a vehicle ADAS (Active Safety Driver Assistance System). Initial systems will provide information only, and these systems are expected to evolve into warning and control capabilities. In a future vehicle, information from multiple sensors including V2X will be combined/fused to generate a view of the surrounding environment. Figure 1 gives an example of such sensors including long- and short-range radar, lidar, cameras and V2X. V2X offers unique advantages over other sensors that depend on direct line-of-sight. Information can be received from vehicles not visible to other sensors, giving a much larger field of view. V2X can transmit information directly from traffic control devices, instead of inferring information from camera observations.
Figure 1. Example of a vehicle sensor configuration.
Figure 2 depicts the sensor fusion screen from an ADAS development platform by Renesas Electronics America. Such a platform offers the flexibility to implement an ADAS using all available sensors, for example blind-spot warning from radar, forward collision warnings from combined radar, camera and V2X, surround object detection from combined radar, lidar, vision and V2X, with information presented via an OEM-specific HMI.
Figure 2. Renesas ADAS development platform.
GNSS role and challenges
V2X is built on the assumption that vehicles, infrastructure elements, and other road users are location-aware and can communicate critical information to others around them. As seen in Figure 3, the system will position all communicating V2X entities with respect to the host vehicle and security interface, which validates all relevant DSRC messages. A control area network (CAN) or a similar interface will be needed for direct access to vehicle information such as brake and turn-light status and odometer. Interfaces to long-range connectivity such as cellular networks and other data sources such as maps may also be included. The system will connect to an HMI to display information, and future systems will likely evolve to vehicle control functions.
Figure 3. Components of a V2X system.
Looking at the components of an over-the-air (OTA) V2X basic safety message (BSM), this includes a UTC-based time marker, WGS84-based position, and an estimated position error — all critical data that primarily depend on GNSS. RTCM-formatted data may also be sent as optional attachments. A BSM-like personal safety message (PSM) is also defined for pedestrians with V2X-enabled devices.
As per current Minimum Performance Requirements (MPR), a UTC time source with better than 1 millisecond accuracy is required in a V2X device. While almost all current prototypes use GNSS as source of time, others, such as NTP, may also be used. Accurate time reference is a critical prerequisite for basic DSRC functionality. MPR requires time-marked position estimates with 2D and elevation accuracy of 1.5 and 3 meters or better (1 sigma) under open-sky conditions. The automotive industry has opted to define open sky as unobstructed sky view above 5-degree elevation with seven or more satellites visible with HDOP and VDOP limits. The industry expectation is to use this criteria to select GNSS devices that could eventually support lane-level applications (better than 1.5-meter accuracy).
MPR does not put any requirements on the accuracy of the position error estimate in the BSM. It does require that a vehicle stop transmitting BSM whenever the aforementioned time and position accuracy requirements are not met. This implies that a V2X-enabled vehicle may disappear from the V2X view of others in a dense urban canyon or similar environments, leaving at least two questions for system designers from a GNSS perspective alone. First, how to reliably declare that the system cannot meet time and position accuracy requirements, and second, how to deal with the vehicle itself and other V2X entities that may cease to function or broadcast due to GNSS or other limitations. V2X systems are assumed to include inertial and vehicle sensor integration.
Road Ahead. Starting in 2017, connected vehicle pilots (CVP) in New York, Tampa, Florida, and Wyoming will be the next major milestone for V2X. These deployments will be limited to commercial fleets (taxis, public transit, city/road crews and delivery trucks) and some limited road-user categories.
Among the automotive OEMs, Toyota was the first to offer V2X-based driver-assistance technology as ITS Connect in Japan in 2015. General Motors is the first to announce a V2X technology offering in a passenger vehicle in the U.S. with an initial rollout in select 2017 models. The first phase of V2X deployments will only provide driver assistance information while subsequent iterations are expected to bring in safety-focused functions leading to control capabilities.
There is a growing interest in the cellular industry to support V2X-like communication in an upcoming release of the 3GPP standards commonly referenced as 5G. This would enable low latency, peer-to-peer communication with the advantage of an existing device provisioning/authentication infrastructure, something that needs to be built up for DSRC. However, 5G is still a concept, and judging by the lifecycle of LTE, a 5G deployment will take several years to start and several more years to fully deploy while still leaving some rural areas with legacy technology. A framework to manage commercial traffic vs. likely free safety traffic will also be required. These raise the question as to how 5G alone can support vehicle safety applications nationwide.
The FCC has recently proposed a rule to potentially open up the DSRC band for unlicensed Wi-Fi devices, provided Wi-Fi users do not interfere with the primary safety use. Automotive and wireless industry and other stakeholders are investigating the feasibility of possible co-existence in the future. Among the proposed solutions are the rechannelization of DSRC to use a smaller bandwidth and a mechanism for Wi-Fi devices to Detect-and-Vacate the DSRC band when a safety user is detected.
From a technology point of view, V2X has reached a significant milestone with R&D in various technology areas converging and critical standards being adopted recently. With Toyota V2X offering in Japan and GM V2X commitment in the U.S., customers will have V2X as an option this year, further proof that V2X will be on the roads soon. However, significant further work is needed to address the GNSS accuracy and reliability needed for next-generation systems and to address GNSS-specific vulnerabilities such as jamming or spoofing. The New York CVP, which includes deep urban canyons, will probably be a great opportunity for GNSS and V2X communicates to work together on some of these limitations.
Attention-grabbing graphic from “Navigating Autonomous Requirements” at ION-ITM.
The talk veered off into rather heady philosophical realms at the plenary session for ION’s International Technial Meeting in late January. Two of the three speakers had been encouraged to go well outside the box — and not to employ any equations in doing so — to address or envision the autonomously navigated future.
We are caught in the act of seeing ourselves become obsolete, at least behind the steering wheel of an automobile. The Google driverless car has logged more than a million miles, exploring the traffice terrain that will soon be home to millions of autonomous vehicles. What has it found? That the human in the loop (HiL) is the biggest source of error and catastrophe.
There remain a few technical issues to sort out before this particular future is upon us. One of these, one that excites John Fischer of Spectracom, is the time-sensitive network concept: a standard and securable network that provides a platform for connecting critical system infrastructure with IT features. These networks deal in velocity accuracies of centimeters per millisecond, The V2V and V2X (vehicle-to-vehicle and vehicle-to-network) systems that will support autonomous driving must reduce latency to nearly imperceptible levels for functions like crash avoidance and lane awareness to work reliably.
We were encouraged to consider the ethics of autonomous navigation by Mikel Miller of the Air Force Research Lab, Sensors Directorate. Once the vehicle becomes autonomous, it decides for the driver — including life or death choices.
Imagine a situation that could actually happen less than a decade from now. Riding in a driverless car on a curving coast highway, you round a curve to see a group of children crossing the road. Detecting them, the car begins to brake, but quickly calculates it cannot stop in time. Programmed to avoid collisions with pedestrians and other vehicles, it is also programmed to protect its passengers. It must choose between carnage on the highway or driving you off the adjacent cliff into the ocean.
Which to choose? Four lives versus one. Other ethical dilemmas have arisen in the history of GPS, GNSS, and precise PNT, chiefly concerning privacy. We are about to enter a more difficult realm.
The presence of different types of devices, spanning multiple GNSS receiver types, configurations, hardware, software, and consequent widely varying capabilites, among a user mix of vehicles, cyclists, and pedestrians, poses several engineering challenges for a V2X scheme in which all road users share data with each other and with the road infrastructure.
The use of location awareness for transportation safety, efficiency, and security — a major area of research and development for academics, automotive manufacturers, and organizations such as the U.S. Department of Transportation — has focused attention on enabling communication between vehicles and other road user entities in a concept know as V2X, a term encompassing both vehicle-to-vehicle (V2V) and vehicle-to-infrastructure (V2I) systems, so that they can share location and other status information. As a result, any road user entity may see all others around it. This capability is almost always built on GNSS technology.
Future V2X systems will be able to include all road user entities, ranging from vehicles to cyclists to pedestrians, in this information-sharing system. While it sounds natural for everyone to talk to each other and share data for collective benefit, the presence of different types of devices among this user mix poses several engineering challenges. As an example, a V2X device in a vehicle may have a built-in GNSS receiver with a roof-mounted antenna and another vehicle may have a retrofitted V2X device with a passive antenna and relatively limited accuracy capabilities. As the GNSS technology further develops, some vehicles may have multiple-frequency GNSS capability compared to legacy single-frequency devices. In essence, all compatible V2X devices will have to be carefully designed to ensure their interoperability with the rest of the system.
This article investigates positioning challenges arising from multiple GNSS receiver types, configurations, hardware, and software in a V2X operational environment. This produces a clear need to have minimum performance standards for V2X-capable GNSS receivers. The article further investigates the implications of land-based visibility obstructions on relative positioning, and implications on standalone position accuracy both as a result of limited GNSS satellite visibility and WAAS satellite visibility.
V2X Background
V2X systems rely on two critical enabling technologies: communications and positioning. Organizations and industry collaborations have developed and demonstrated various V2X systems over the last few years. These efforts have produced interoperable prototype V2V and V2I systems and over-the-air (OTA) messaging standards.
Figure 1 illustrates the general concept of combined V2V and V2I, or V2X. In a fully operational system, all vehicles and other road users carry short-range communication and positioning technology. At present, these technologies are expected to be based on dedicated short-range communication (DSRC) and GNSS, respectively. This enables each user to be location-aware and capable of sharing their location with others. Vehicles may use built-in systems, retrofitted devices, or those based on the occupant’s personal mobile device. Infrastructure elements and other road users such as pedestrians also form part of the V2X user community.
V2X Relative Positioning. Relative positioning of all communicating entities with respect to a given user is a required functional capability of a V2X system. To enable this functionality, positioning information from all communicating entities must be exchanged. For automotive V2X applications, Society of Automotive Engineers (SAE) J2735 DSRC Message Set Dictionary serves as the primary standard for message definitions. Current version of the messages consists of a basic safety message (BSM) , an optional variable rate message (VRM), and an option for including proprietary messages.
With BSM and VRM, vehicle position, speed, heading, and GNSS measurements can be communicated to others. GNSS relative positioning techniques such as real-time kinematic (RTK), code-based differential, or individual position differing (that is, distance between the positions reported by individual vehicles) can be used for relative positioning. The latter method, also known as DPOS, is a particular focus of this article.
Given the above, a system developer may develop a V2X relative positioning system that can operate based on techniques that can be broadly classified as position-based techniques, which include DPOS, and measurement-based differential techniques, including RTK and others.
The Simpler Approach. The SAE J2735 BSM accommodates the simpler approach of using the DPOS method, as it enables the sharing of critical state parameters. This approach is very attractive as it requires minimal OTA data volume compared to sending GNSS measurements. Secondly, DPOS relative position estimation process requires only a fraction of the processing resources required compared to measurement-based differential processing. Thirdly, any GNSS receiver in the market today is capable of outputting a position solution and most of the critical GNSS state parameters required for the V2X BSM. In contrast, most low-cost devices do not output measurements required for other methods.
However, there are quite a few challenges associated with DPOS. A vehicle or any other road-user entity, such as a location-enabled handheld device, will share its location information via BSM only. A relative positioning engine in each entity will use this information to provide lane-level and road-level data (relative distance, speed, and orientation) for its V2X applications. The challenges associated with DPOS method arise from multiple stages in this process.
The presence of many road-user types brings in the possibility of thousands of GNSS receiver types, models, hardware, and software in the user group. Thus the system must be interoperable with devices with a wide range of performance characteristics.
Secondly, each entity will transmit BSM only. This OTA information offers no information about the constellation the GNSS device sees or how the solution was derived in terms of filtering or applied constraints.
Thirdly, the position accuracy reported by each entity is a GNSS device-dependent variable, an estimate of the actual error as derived by a user device.
Finally and most importantly, V2X applications expect relative positioning information for each communicating entity classified in one of three possible accuracy categories: Which Road, Which Lane, or Where-in-Lane (see “Is GNSS up to the V2X Challenge?” GPS World, October 2010). The V2X system must be able to reliably identify this accuracy classification for each communicating entity with the limited information provided via the BSM.
Study Goals. To illustrate the impact of these challenges, several GNSS receiver types, configurations, and operational scenarios were investigated.
Between multiple receiver types: In a V2X environment, vehicles and other road user entities may have different GNSS receiver types and makes: dual-frequency, single-frequency, and so on.
Same receivers using different parts of visible constellation: In an urban canyon, it is possible for two adjacent vehicles to see two different parts of the GNSS constellation, due to obstructions.
WAAS-enabled and non-WAAS receivers.
Data Collection
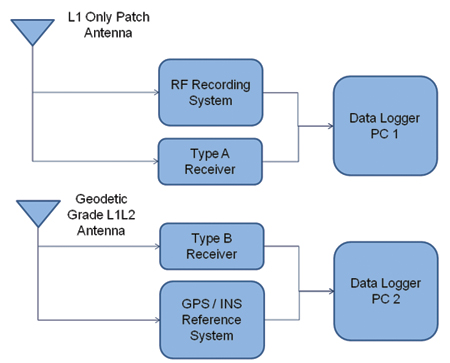
This data is a combination of field-data collections and a series of RF record playbacks. The field vehicle-mounted test setup included two GPS receivers, a GNSS L1 RF data recording device, and a high quality GPS/INS reference system (Figure 2). Type A receiver is a hi
gh-sensitivity enabled, automotive-grade GPS L1 receiver using a patch antenna, WAAS-capable although WAAS usage was disabled in the real-time data collection. Type B receiver is a high-quality L1/L2 receiver using a geodetic-grade antenna, used with WAAS enabled. The GPS/INS system was connected to the geodetic-grade antenna. The RF recording system was also connected to the automotive-grade GPS L1 antenna.
Figure 2. Vehicle test set-up.
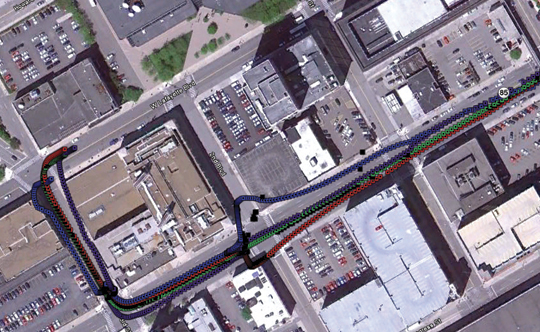
The data was collected on a test route in Detroit, Michigan, that included durations of urban and deep urban canyon (40 miles per hour (mph) or less), freeway (55–70 mph), and suburban/local (30 mph) driving.
The RF data were subsequently replayed to GNSS receivers that were not a part of the field set-up. RF data was also replayed to receivers with forced sky-visibility obstructions and various WAAS settings. For limited sky-visibility tests, certain satellites were removed from each receiver’s view by receiver-specific configuration software. The satellite selection and restriction was done to mimic typical sky-view obstructions encountered in normal driving.
Type A receiver was chosen to illustrate the impact of visibility differences. A total of 13 satellites were visible in the entire data set (Figure 3). To create obstructed sky-view scenarios, two Type A receivers were configured to not use certain satellites in their position solutions. These configurations were:
Configuration 1 (C1): PRNs 7, 10, and 13 blocked
Configuration 2 (C2): PRNs 6, 16, 21, and 31 blocked
C1 mimics a vehicle/receiver with no visibility in the Northwestern part of the sky, whereas C2 mimics a receiver without visibility in the East/Northeastern part of the sky. Sky visibility restrictions do not vary with the heading changes of the vehicle. For example, for C1 receiver, Northwestern sky is always obstructed regardless of the vehicle orientation.
Figure 3. Sky view during the test.
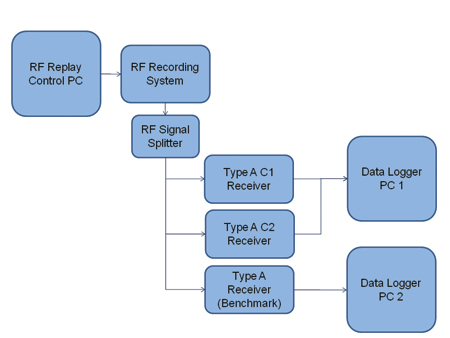
Figure 4 shows an example RF data replay setup. The record and replay system was controlled through a PC and the recorded data was also stored in the controller PC. The output RF signal was split into multiple outputs such that multiple receivers can be tested at the same time. For each replay of the RF data, a benchmark receiver was also used to verify that there is no run-to-run difference as a result of the RF replay.
Outputs from each GPS receiver from field and replay runs were logged to PCs using receiver specific binary formats. The recorded output from each receiver included its position, position error estimate, velocity, satellite-specific measurements and indicators such as pseudorange, carrier phase, and signals-to-noise ratio.
Figure 4. RF data replay set-up.
Data Processing and Analysis
The data was first decoded from the receiver-specific formats to a common format, then corrected for antenna offsets. To simplify the process, the reference system position solution was translated to the position of the test antenna using the known between-antenna distance and orientation of the vehicle as measured by the reference system. As a result, all the receivers and the reference system are reporting the location of the test antenna. Then, data fields such as position and velocity for each receiver were time-matched with the reference solutions, and the actual error was calculated.
For a limited dataset, additional measurement-level differential processing was done to show the difference between a DPOS and an RTK or a code-based differential relative position solution.
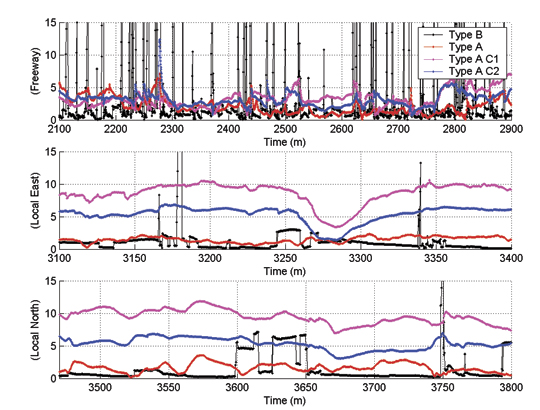
Figure 5 shows a plot of the 2D position error observed from each receiver during the test as a function of driving environment. Overall, Type B receiver shows better accuracy as expected from a dual frequency high quality receiver. However, it shows spikes of large error increases at times, mostly observed in the freeway scenario with large error excursions. With Type A receivers, relatively larger errors are observed with the limited-constellation receivers.
Figure 5. Position error (2D) of each receiver as a function of driving environment.
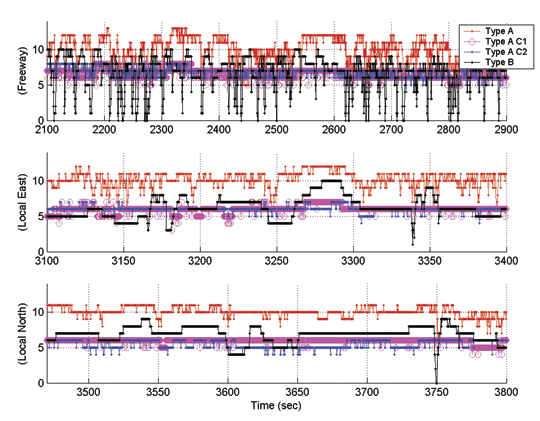
Figure 6 shows the number of satellites used by each receiver in the same environments as in Figure 5. Overall, Type A receiver tracks and uses on average 2–3 satellites more compared to the Type B receiver, likely due to its high-sensitivity capability. Type A C1 and C2 receivers also track and use 2–3 satellites fewer compared to the all-in-view Type A receiver.
Figure 6. GPS satellites used by receivers.
Freeway Data. The vehicle heading in this segment was predominantly north or northwest. The sky view can be considered a combination of urban and open sky conditions. As highlighted in Figure 6, all-in-view Type A receiver was able to use up to 11 GPS satellites with an average of around 9 satellites. Type A C1 and C2 receivers used, on average, about 3 satellites fewer than the all-in-view receiver. All three receivers show satellite count drops down to 4 at certain times in this segment.
The satellite count of the Type B receiver shows the limitations of not using the high-sensitive tracking capability. The satellite count shows frequent drops below 4 satellites and on occasion down to no satellites used.
Although the satellite count difference between all-in-view Type A and C1/C2 receivers was forced by means of receiver configuration, short-term sky visibility restrictions that resemble these conditions are in fact possible. Examples include a passenger car driving next to a semi truck or the side wall of the freeway in below-ground road sections.
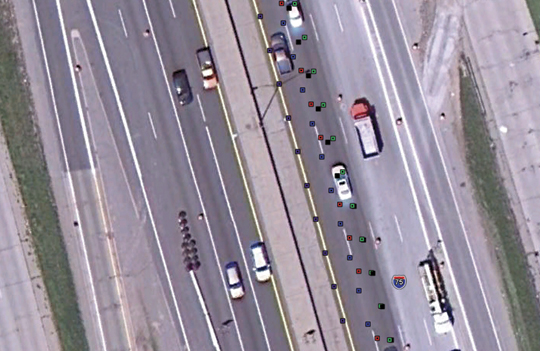
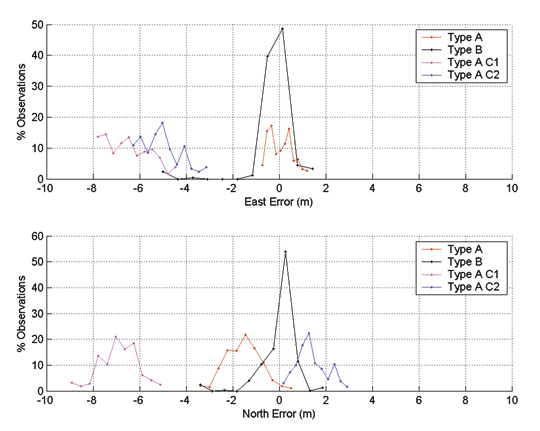
Figure 7 shows the position outputs of all four receivers on a satellite image of a short segment of the freeway. The true location (reference) is shown in green. Type A, Type B, Type A C1, and Type A C2 are shown in red, black, purple, and blue, respectively. These colors identify the four receiver types in all figures for the rest of this paper. While biases can be seen in the outputs of all four receivers with respect to the reference, the Type A C1 shows the largest offset with the magnitude of more than a lane width.
Figure 7. Freeway positioning accuracy.
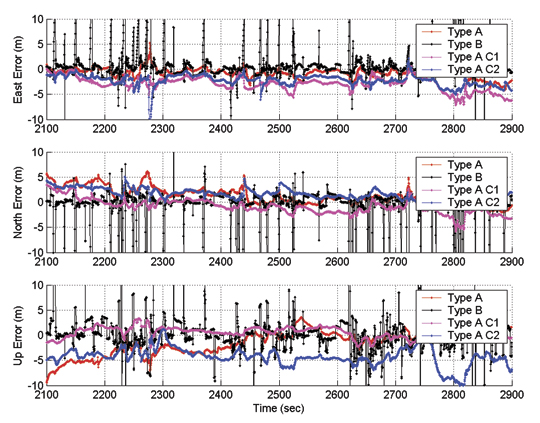
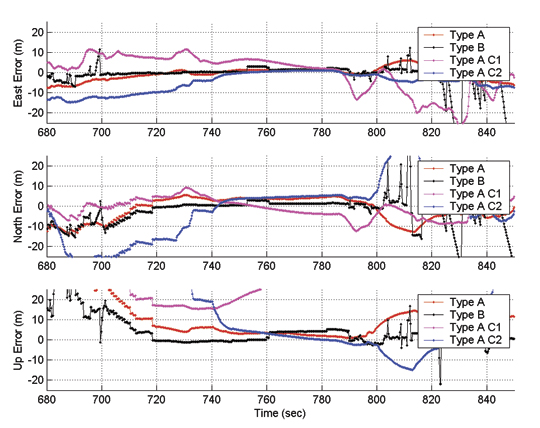
Figure 8 illustrates a time series of the positioning error components of all four receivers. It clearly shows error ramp-ups from the Type B receiver at frequent intervals. These coincide with the satellite count drops of Type B shown in Figure 6. No such error ramp-ups are observed for any of the Type A receivers, although relatively large biases of the order of few meters can be seen. As anticipated, larger errors are observed in the height direction.
Figure 8. Freeway positioning accuracy time series.
Local Road, Eastbound. This segment includes data gathered on an eastbound multi-lane local road with 40 mph posted speeds. As shown in Figure 6, a relatively larger number of satellites were continuously tracked in this segment as compared to the freeway. Therefore, this segment is considered to be an open-sky scenario with very limited number of obstructions. As shown in Figure 6, Type B receiver has used about 6 satellites on average, whereas the Type A has used around 3 more satellites most of the time. Type A C1 and C2 have also used around 3 satellites less compared to the all-in-view Type A receiver.
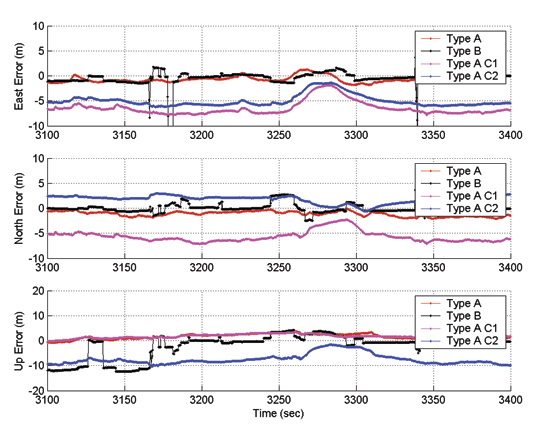
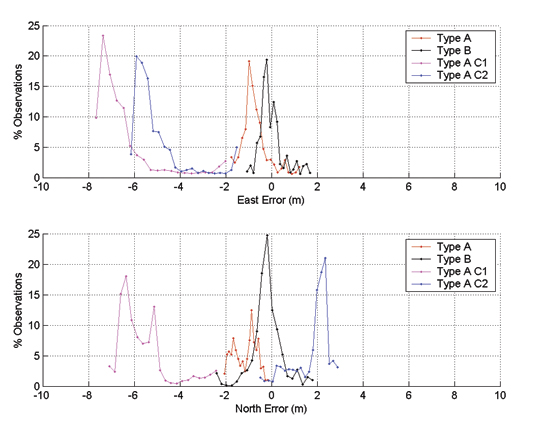
Figure 9 shows the vehicle position as reported by all three receivers and the reference system output for a short road segment in this drive. It clearly illustrates the lateral offsets of both C1 and C2 solutions. The C2 receiver (Blue) generated about a lane width offset towards north whereas the C1 receiver output is biased by around two lane widths to the south. Figure 10 presents a time series look of the positioning biases evident in Figure 9. It clearly shows large (more than 5 meter) biases in North and East position error components for C1 and C2 receivers.
Figure 9. Local (east) positioning accuracy.Figure 10. Local (east) positioning accuracy time series.
Local Road, Northbound. In roadway characteristics, this resembles Local Eastbound. Figure 6 shows the sky view remained almost unchanged for Type A receivers. For Type A C1, the count remained at 6 throughout. C1 and C2 receivers tracked 2–3 satellites fewer compared to all-in-view Type A. Interestingly, Type B experienced two dropouts of 4 or fewer satellites during the run. Figure 11 shows the position output of all receivers on a short road segment. As in the case of Local (East), significant biases can be readily observed in the output of C1 and C2.
Figure 11. Local (North) accuracy.
Figure 11. Local (North) accuracy.
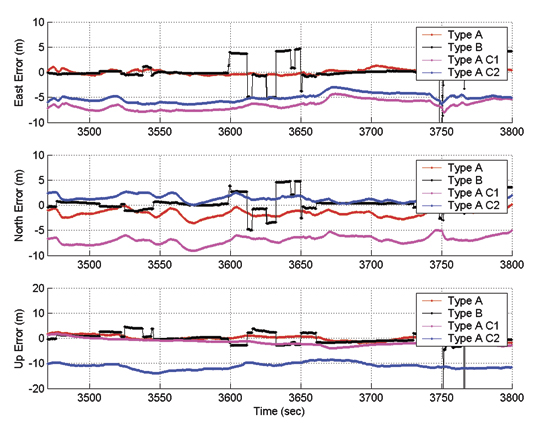
Figure 12 shows the time series view of the positioning error in this segment, confirming that the biases observed in Figure 11 are not short-term biases, but are in fact vehicle heading-dependent biases. The short-term biases seen in the Type B receiver output coincide with the change in the number of satellites used (shown in Figure 6). This illustrates the implications of different estimation methods used in the two receiver types. For instance, Type B receiver allows stepwise changes in its position estimate whereas Type A output tends to gradually converge to different states.
Figure 12. Local (North) positioning accuracy time series.
Urban Canyon. Results of the urban canyon segment of the drive are shown in Figures 13 and 14. A statistical analysis is not presented for this segment, as receiver type and configuration dependent biases and errors are difficult to isolate from the errors that are the result of multipath and measurement noise. In Figure 14, much larger biases in the order of 10 meters or more can be seen for all three Type A receivers. In comparison, Type B receiver tends to output a relatively accurate position solution whenever it has sufficient satellites visible. In the case of less than optimal satellites availability, Type B receivers tend to show rapidly degrading positioning accuracy, which may be reliably detected using its quality indicators.
Figure 13. Urban canyon accuracy.
Figure 14. Urban canyon positioning accuracy time series.
Position Error Distributions
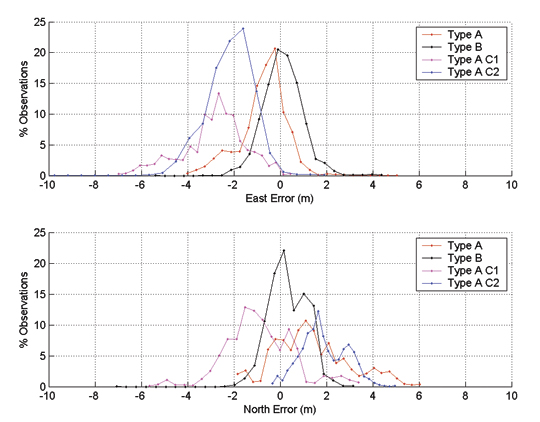
Position error probability distribution functions were generated for the first three road segments using the time series data above. Figures 15-17 show these functions for Freeway, Local (East), and Local (North) segments, respectively. They lead to these general conclusions:
Based on the mean and the spread of the distributions, Type B receiver has consistently provided the most unbiased and accurate positioning performance out of all the receivers considered. Overall, the output appears to be unbiased, as should be the case for a high quality dual frequency receiver with WAAS capability.
Type A all-in-view receiver shows the next best overall accuracy statistics with some biases in certain cases. These biases can be time-of-day-dependent and may differ for different times of the day or if observed over a longer time.
Type A C1 and C2 receivers show very significant vehicle-heading-dependent biases/errors. This is with very limited sky view obstructions (that is, C1 only restricts less than 1/8 of the entire sky view whereas C2 covers around 1/4) and with the same type of the receiver.
Although enabling WAAS should theoretically help minimize the biases observed in these tests, the availability (open line-of-sight) of WAAS satellites for automotive applications in these environments must be taken into consideration for WAAS accuracy benefits to be applicable. For these datasets, WAAS signals availabilities for a Type B receiver were 58 percent of total driving time in urban canyon, 60 percent in the freeway scenario, 95 percent and 99 percent in the local road scenarios.
Figure 15. Freeway position error distribution.Figure 16. Local road (east) position error distribution.Figure 17. Local road (north) position error distribution.
Velocity Domain Performance. For each test segment, velocity estimates from each receiver were logged at the default data rate of 4 Hz. For analysis purposes, North and East velocity readings from each receiver were converted to 2D speed estimates. These were used with reference system speed estimates to generate 2D speed error statistics (Table 1).
Based on Table 1, no significant biases or errors were observed from any particular receiver or configuration. The only exception was the increased errors in the Urban Canyon segment, particular for C1 and C2. This is expected .to be a result of limited satellite availability in a challenging environment with additional forced satellite eliminations.
Virtual Two-Vehicle Analysis. Assume that Type A and Type A C1 receivers were located in two vehicles. Ideally, both receivers should report the same location, as they were both connected to the same antenna on a single vehicle, creating a zero-baseline scenario. However, as shown in the previous section, a meter-level separation was observed between the two solutions.
In this virtual two-vehicle scenario, relative position of one receiver (Type A) with respect to the other (Type A C2) was estimated by three methods, using GNSS data processing software in post-mission. The methods were:
Differenced Positions (DPOS). Latitude and longitude reported by each vehicle were time-matched; distance between the two points was calculated.
Code and Carrier. Single frequency (L1) GPS RTK positioning with float ambiguity estimation.
Code Only. GPS code measurements generated a relative position solution.
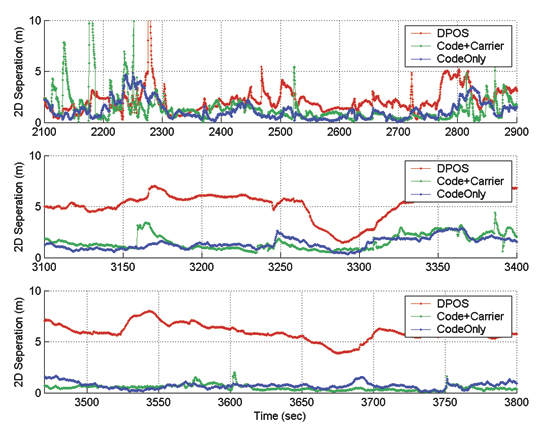
The 2D receiver separation results of this processing are shown in Figure 19 as three subplots for freeway (top), local/east (middle), and local/north (bottom) scenarios. The 2D separation results for local scenarios show clear performance benefits for the GNSS measurements-based methods. In both east and north local scenarios, around a 5-meter bias is observed in the DPOS solution whereas this is reduced to around a meter in both code-only and code and carrier methods. The freeway scenario shows relatively smaller difference potentially due to measurement noise, multipath, and frequent interruption of sky view. Table 2 shows mean values of these results.
Figure 18. Position separation for processing methods.Table 2. Mean Accuracy (meters) using processing methods.
Discussion
OTA transfer of certain GNSS measurement data elements appears to be a critical requirement for reliable lane-level positioning capability. However, the method must be capable of supporting a certain level of performance even in challenging environments for GNSS. The solution for such challenging environments is likely to be GNSS integration methods with vehicle-based sensors (that is, GNSS/INS) for the foreseeable future.
Given these facts, a reliable and accurate V2X relative position method will require the OTA transfer of a combination of critical vehicle states which include the vehicle location, a confidence measure, and certain GNSS measurement data elements. With its ability to support all of these needs, the SAE J2735 provides a basic framework for further refinement of relative positioning technologies for automotive applications.
A reliable position confidence measure broadcast over-the-air is also a critical need, particularly if GNSS measurement data is not broadcasted on a regular basis. This also holds true for conditions under which a vehicle may be operating in a GNSS and vehicle sensor integrated mode or with less than optimal number of satellites in view. However, estimating such a parameter that can be trusted with high degree of confidence can be challenging given the presence of various biases that can depend on the environment, vehicle, GNSS receiver, and sensors and methods used. Potential examples are time-of-day, vehicle heading, vehicle speed, GNSS receiver/sensor type, model, and configuration. However, developing a parameter similar to the RTCA Horizontal Uncertainty Level (HUL) for automotive applications is an important consideration.
While there are many other candidate receivers to be considered for a study of this nature, only two receiver types were used in this analysis. Analysis of more receiver types can be beneficial to identify the desired characteristics for a certain applications. A consideration could be achieving a desirable balance between accuracy and the sensitivity of the GNSS receivers, as increased sensitivity often produces higher solution availability at the cost of degrading accuracy.
Another area to investigate in related work is the benefits of using WAAS under the test conditions given in this paper. The general expectation is to see less bias in the position solution with WAAS as the ranging errors are likely to be smaller as a result of WAAS corrections. However, for automotive applications in particular, availability of WAAS signals to land vehicles need to be investigated.
CHAMINDA BASNYAKE is a senior research engineer at General Motors Global Research and Development and GNSS technology expert for GM OnStar. He leads GNSS-based vehicle navigation technology R&D efforts at GM and holds a Ph.D. in geomatics engineering from the University of Calgary.
By Chaminda Basnayake, Tom Williams, Paul Alves, and Gérard Lachapelle
Communication-enabled vehicle safety has the potential to change transportation’s future, particularly vehicle-to-vehicle (V2V) and vehicle-to-infrastructure (V2I), collectively represented as V2X. An automakers’ consortium conducted extensive field trials to determine GNSS service availability and accuracy for the V2X challenge.
V2X can include applications based on communications between any two or more entities on the road. Of all the potential V2X applications, V2V applications probably lead the way in terms of maturity of prototype development and test efforts. General Motors (GM) demonstrated the first working prototype V2V system in 2005. Information on further industry collaborative efforts in V2V system developments can be found at the U.S. Department of Transportation’s (DOT’s) IntelliDrive website. While a multitude of applications could be developed based on V2I capability, most of the related system prototype development efforts have taken place under the DOT’s Cooperative Intersection Collision Avoidance (CICAS) program.
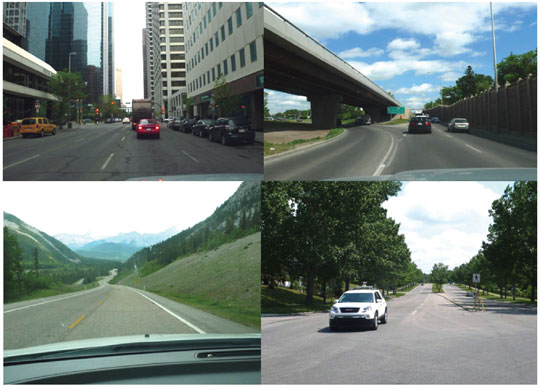
Driving environments encountered in testing. Clockwise from top left: deep urban, urban thruway, local roads, mountains.
Accuracy Requirements
In terms of positioning accuracy requirements, Vehicle Safety Communications-Applications (VSC-A) prototype system capabilities as well as all V2X applications can be classified as:
Which Road. In this case, accuracy is only required to the extent of identifying the road traveled. For instance, if a vehicle is in a service road parallel to a freeway, knowing that it is on the service road and not on the freeway is sufficient. The need of a typical vehicle navigation device is another good example of this requirement category. The typical accuracy requirement for this case is better than 5 meters. However, this could be a relative accuracy requirement for certain applications. For instance, in a V2V scenario, one vehicle may only need to know if the other is on the same road or not, while in the absolute sense both vehicles could be in error by more than 5 meters. For V2I applications, however, this becomes an absolute accuracy requirement, as the infrastructure is always mapped and identified with respect to a global coordinate frame.
Which Lane. This accuracy level enables applications to identify other entities with lane level resolution. The typical requirement is 1.5 meters or better, which approximately corresponds to half of a lane width. A blind-spot advisor is a good example that requires this accuracy.
Where-in-Lane. This accuracy level enables the relative positioning of entities to better than 1 meter. Further refinements of blind-spot advisor-like applications are examples.
Availability Requirements
GNSS as a line-of-sight technology has obvious limitations in certain environments, and these limitations are well understood by the GNSS community. The focus of this study was to understand the limitations associated with a GNSS-only V2X solution such that requirements for augmentation technologies can be defined. Therefore, no availability requirements were set for the system; estimating availability of a GNSS-only solution was the goal.
Why So Complicated? At first glance, what needs to be done is straightforward; all V2X-capable entities need to be aware of each other’s positions. Hence, if all entities transmit their own location with respect to the same coordinate system, the problem is solved. Unfortunately, it’s not that simple.
Designing the system so that hundreds of entities, potentially using all sorts of GNSS software and hardware, can work together presents a significant challenge. This includes keeping backward compatibility way out into the future.
Even within the same receiver make and type, inclusion of a particular satellite in the solution of one vehicle can significantly affect the solution difference between vehicles. Inclusion of SBAS also contributes as a differentiator. In a V2X scenario, out of two adjacent vehicles, one vehicle may use SBAS while the other may not, due to hardware configuration or visibility. If none of the above situations occurred and everything else were ideal, transmitting just the current horizontal position of a V2X entity over-the-air (OTA) would be sufficient to do everything needed.
V2X thus requires a positioning system architecture that minimizes the impact of these complications and many other potential compatibility issues. Major system design considerations include:
Performance Requirements. The system must provide relative positioning accuracy that fits Which Road, Which Lane, or Where-in-Lane category and should identify the solution quality. For instance, a vehicle on a freeway with relatively open sky view may function in the Which Lane mode and may transition to Which Road mode as it enters an urban area with sky visibility limitations.
Deployment Constraints. The system must be affordable for automotive applications. This may also include considerations such as antenna placement, processing resource requirements, and power requirements.
Bandwidth Constraints. The volume of data transmission constitutes a major consideration for OTA communications. While some methods manage communication range and frequency as a way of optimally using the communication channels, keeping the OTA data volume to a minimum by design was a goal.
Study Goals
This study investigated the performance of two relative positioning methods: DPOS, a method of using the difference in position reported by two entities to calculate the 3D separation between the points; and real-time kinematic (RTK). While there are many other possible relative positioning methods, these two were selected as they collectively represent the most desirable availability and accuracy performance. In DPOS, vehicle coordinates are transmitted between vehicles in order for position differences between vehicles to be derived at each vehicle. In RTK, raw code and carrier-phase data is transmitted between vehicles, and the inter-vehicle position differences are calculated using RTK software in either fixed or float carrier-phase ambiguity mode at each vehicle. The RTK method is more intensive both from a data transmission and computational aspect, but retains only common satellites in the solution, eliminating the problem described earlier. Its use of carrier-phase measurements also makes it more accurate.
The study included two GPS receiver types. The first, a single-frequency L1 automotive-grade receiver, is identified as Type B receiver in this study. The second, identified as Type A, was of a higher quality with proprietary multipath mitigation technologies. Both receivers were capable of using WAAS support. Receiver B also allowed the user to reject selected satellites from its solution. These two devices were selected as they were capable of supporting both processing methods, and represent on the one hand an existing automotive-grade receiver, and on the other hand one that is expected to be a good representation of a product with technologies available for automotive deployment a few years from now.
Specific study goals were:
Accuracy performance of DPOS and RTK methods when all vehicles use same GPS receiver type.
Same when a receiver type or a receiver configuration mix is used.
Dependency of the accuracy performance on the driving environment.
Solution availability with same receiver and mix receiver combinations.
Implications of non-continuous V2I coverage.
Prototype System
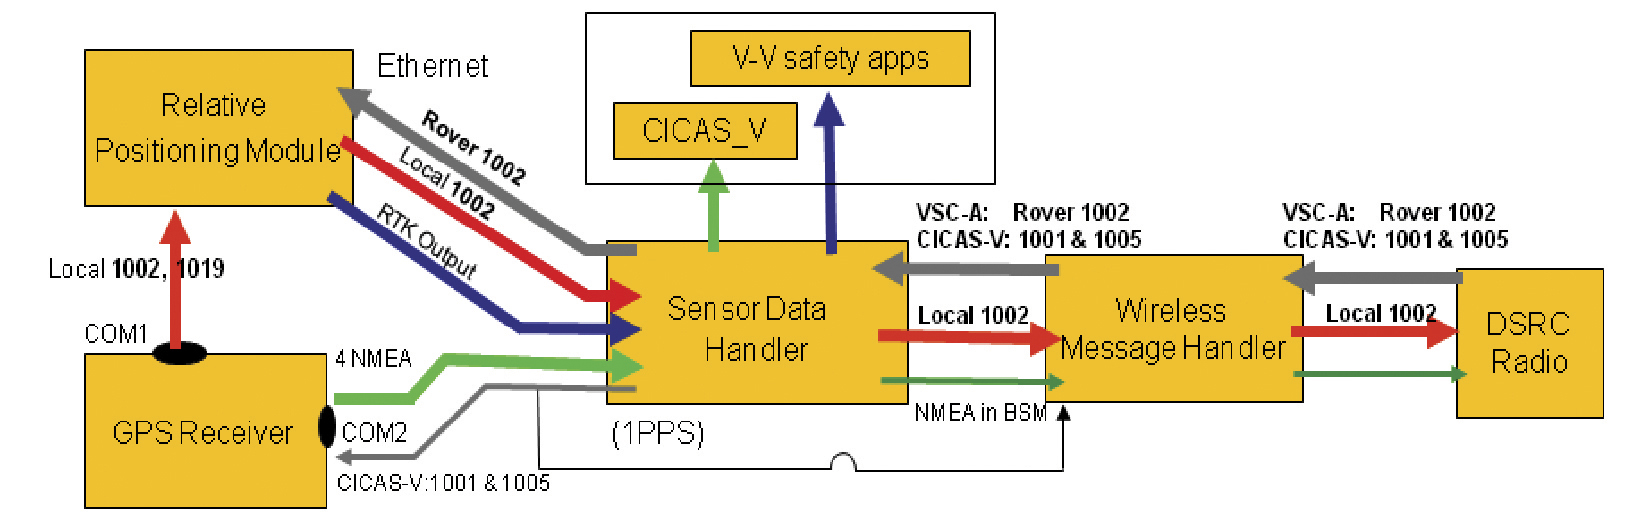
The system prototype (Figure 1) used for the study was a replica of the prototype relative positioning system implemented in the VSC-A project. It consists of a dedicated short-range communicatin (DSRC) interface with a DSRC radio, a GPS receiver/relative positioning module, and a sensor data handler.
In operation, a vehicle generates its own location information and GPS raw data in RTCM format and shares this data with other vehicles. OTA messaging was done using the SAE J2735 messages set with GPS raw data in RTCM format attached as optional data. As shown in Figure 1, RTCM v3 1002 messages were used to exchange VSC-A data. The system was also capable of using RTCM v3 messages 1001 & 1005 for V2I operation. The DPOS relative positioning logic was implemented in the sensor data handler, while the RTK implementation was done in a separate relative positioning module. This module takes in local and remote 1002 messages and outputs RTK data to the sensor data handler. Applications could access both RTK and DPOS relative positioning information from the sensor data handler.
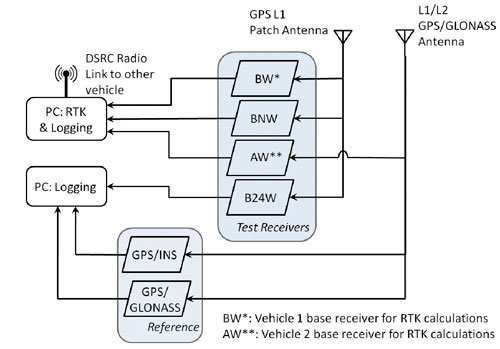
Vehicle Setup. Two vehicles were used for the V2X data collection. Four different GPS L1-only test receiver types were installed on each vehicle:
AW: high-quality receiver using WAAS corrections.
BW: high-sensitivity automotive-grade receiver with WAAS ranging and corrections enabled.
BNW: high-sensitivity automotive-grade receiver with WAAS ranging and corrections disabled.
B24W: high-sensitivity automotive-grade receiver using a maximum of the four primary satellites in each of the six planes (minimum guaranteed constellation) and with WAAS ranging and corrections enabled.
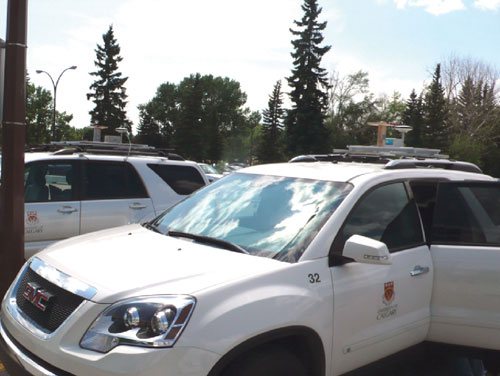
As shown in Figure 2, the AW and B type receivers were connected to different GNSS antennas. These antennas were mounted on roof-racks attached to the vehicles (see Photo). The patch antenna for the Type B receivers was mounted on an aluminum-topped wooden pedestal to bring it to approximately the same height as that used by the AW receivers, to provide a ground plane and to prevent shading from other equipment on the roof-racks. The spacing between the antennas was accounted for in all analysis.
Figure 2. High-level V2V hardware setup on each of the two test vehicles.
Figure 2 also shows that only three of the four test receivers, AW, BW, and BNW, were connected to the computer that ran the RTK software. This computer calculated the inter-vehicle vector (IVV) using information exchanged over the DSRC radio link in real time. The vehicles each had a designated base relative to which the IVV was calculated; for Vehicle 1 it was BW and for Vehicle 2 it was AW. Thus the computer on each vehicle calculated three instances of the IVV, for example, the computer on Vehicle 1 calculated BW1–BW2, BW1–BNW2, and BW1–AW2 (where Ri denotes the receiver of type R on vehicle i).
Transmission and reception of data between the two vehicles required for the IVV RTK calculations were achieved using wave radio modules with two magnetically mounted 802.11p antennas on each vehicle for redundancy. During testing, Vehicle 1 generally followed Vehicle 2. To minimize potential interference of roof-mounted instruments on between-vehicle communications, the antennas on Vehicle 1 were located close to the front of the roof, while those on Vehicle 2 were located close to the rear of the roof. In each case, 15 centimeters of roof space were left to provide ground planes for the antennas.
We used the single-point navigation solutions logged from each test receiver to calculate the IVV for each receiver combination using the DPOS method in post-processing. No real-time data transfer between the vehicles was used for this method.
Reference values of the IVV were calculated in post-processing using both geodetic grade GPS/GLONASS L1/L2 receivers and GPS/INS integrated systems in differential mode. Both were connected to the antenna used by the AW receiver. Differential GPS calculations were enabled by using stationary receivers with antennas at precisely known WGS84 locations on top of a building at the University of Calgary.
Two study vehicles with antennas attached to the roof-racks.
Test Scenarios
V2V data was collected in and around the city of Calgary in August 2009. In the majority of the tests, Vehicle 1 followed Vehicle 2 with a separation of less than 300 meters, the stated effective range of the DSRC link. For most tests the inter-vehicle separation was between 30 and 150 meters. Some driving environments forced modifications of the default behavior; for example, on highways, vehicles moved in between the two test vehicles, necessitating lane changes. Approximately 52 hours of data was collected over 12 days. After rejecting data due to various faults such as reference-system malfunction, more than 45 hours of data remained.
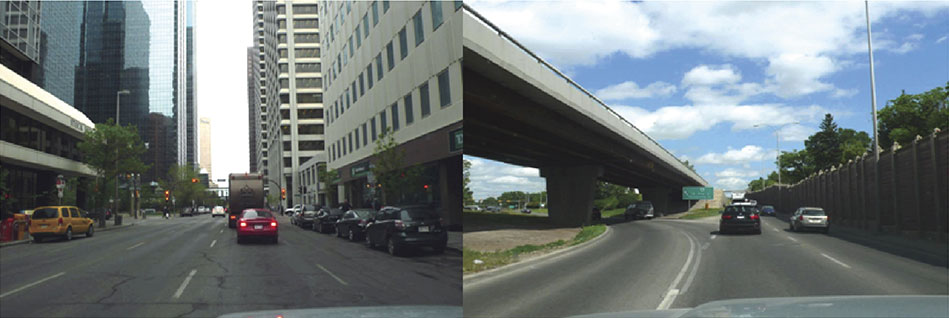
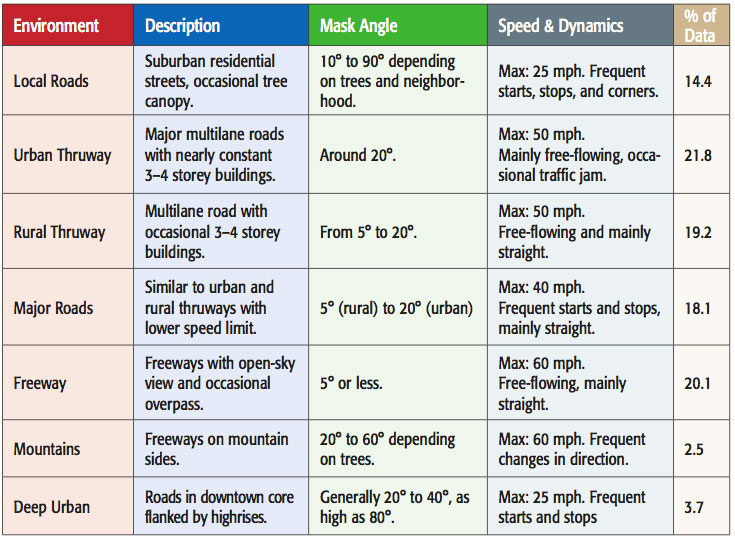
Data was collected in the seven test environments listed in Table 1. These environments were selected in accordance with Federal Highway Administration descriptions. Each environment provided different challenges for GNSS-based positioning. Obviously the deep urban environment was challenging because the reduced number of visible satellites and the large amount of multipath meant that navigation solutions were both rare and of poor quality. As another example, the mountain environment was interesting because often almost half the sky was occluded by trees on the mountain side, leading to an asymmetrical visible GPS satellite constellation with the associated solution degradation. The photos at the beginning of this article show selected driving environments encountered during testing.
Table 1. Description of driving environments used in V2V tests.
V2V Solution Accuracy. Positioning accuracy of the individual receiver was first investigated to estimate the V2V relative positioning accuracy when using the DPOS method. This was done for the entire dataset.
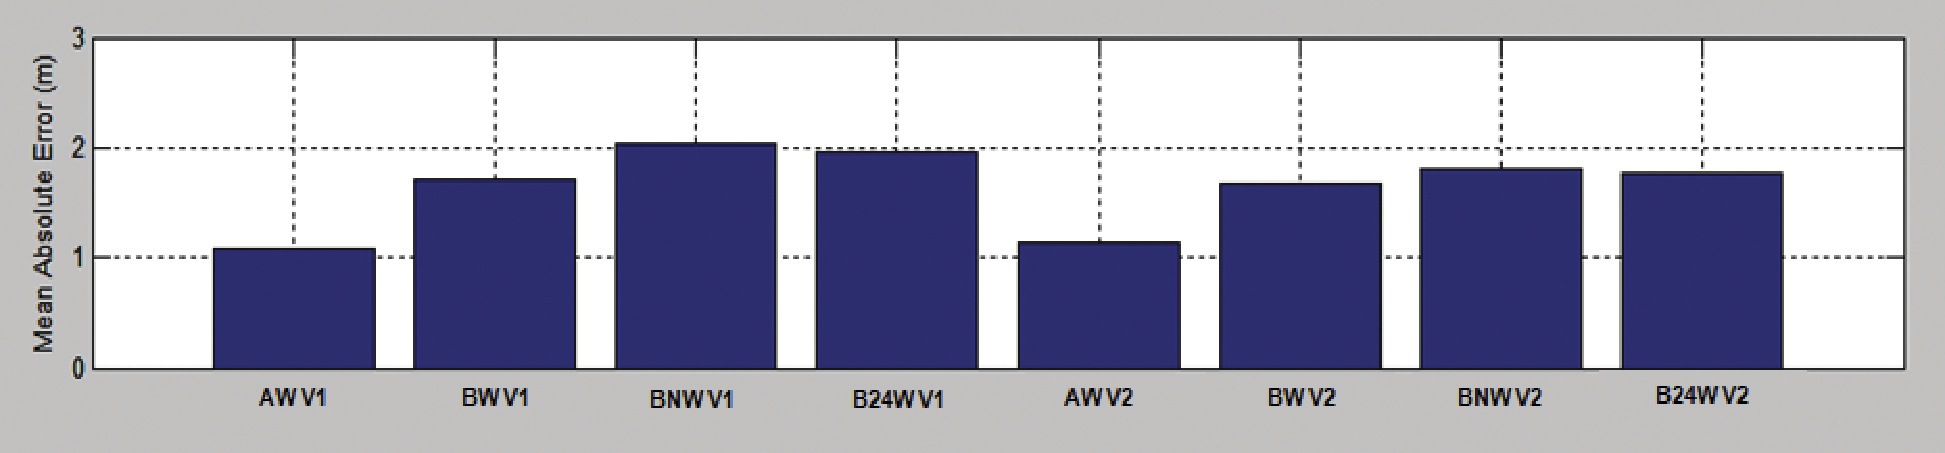
Figure 3A shows a representative freeway dataset to illustrate overall trends: the absolute 2D mean position errors observed from all eight GPS receivers used in both vehicles. The first set of four receivers shown were the AW, BW, BNW, B24W receivers in the first vehicle (V1), and the second set of receivers were the same type in the second vehicle (V2). As a general trend, Type A receivers provided better absolute accuracy meeting the Which Lane accuracy, whereas the Type B receivers provided Which Road accuracy. Also, the use of WAAS with receiver Type B has yielded some absolute accuracy improvement. Limiting the constellation to 24 (B24W) did not significantly degrade accuracy in this case.
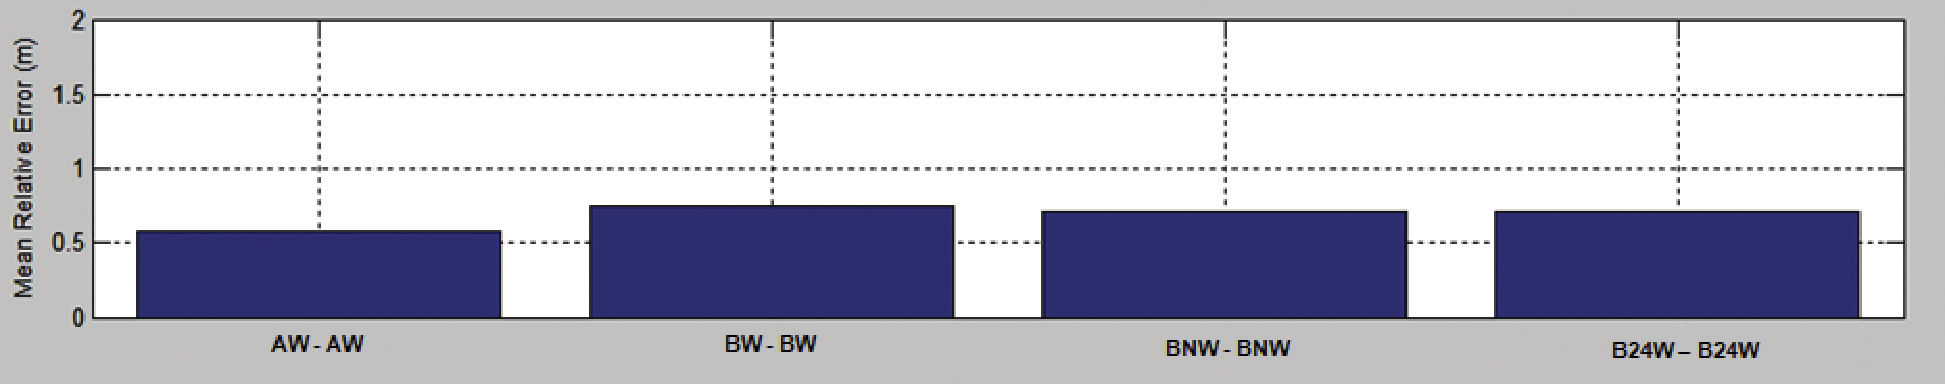
As a second step, V2V relative accuracy when the same receiver type was used was estimated, and the mean errors are shown in Figure 3B. Based on the mean error for each pair, all four receiver pairs were able to provide Where-in-Lane relative position accuracy. The geodetic grade Type A receiver pair (AW–AW) yields the best relative accuracy at around 0.5 meters relative 2D error. In comparison with the mean absolute errors, the V2V relative accuracy is greatly improved as a result of cancellation of correlated errors, indicating a high degree of correlation of absolute errors in receivers under these test conditions.
The relative accuracy with mixed receiver types or configurations was also estimated. With r
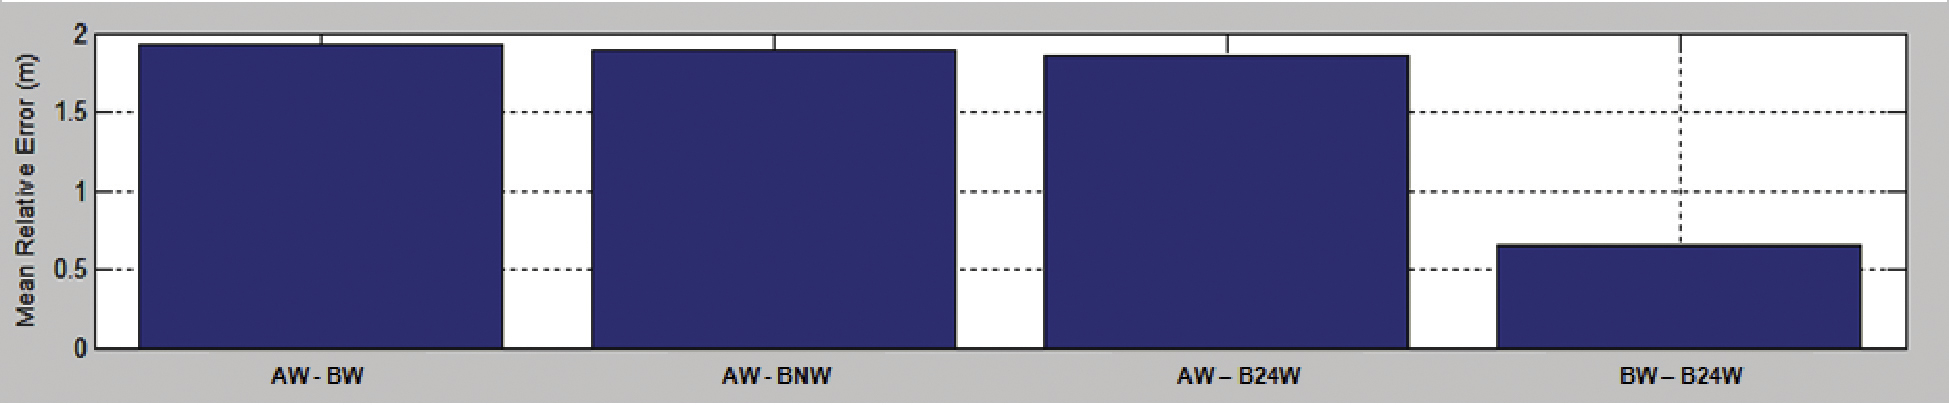
espect to receiver type mixes, the Type A receiver from vehicle 1 was used with the three Type B receivers in vehicle 2, yielding three combinations as AW–BW, AW–BNW, and AW–B24W. Mean error statistics for these three combinations and the combination of BW from vehicle 1 and B24W from the second vehicle are shown in Figure 3C. In comparison to the same type receiver pairing, this shows much larger mean errors. For instance, for all AW receiver mixes, the mean relative error is around 2 meters. Therefore, it is fair to conclude that error characteristics and modeling in the navigation solutions in receiver A and B are type-dependent, and they may not be compatible when a receiver mix is used. The BW–B24W combination does not show a significant increased mean error, indicating that the constellation difference in this test was not significant enough to result in an increased relative positioning error.
Figure 3A. Individual receiver absolute accuracy.Figure 3B. Relative accuracy with same receiver type.Figure 3C. Relative accuracy with receiver/configuration mix.
V2V Solution Availability
Availability statistics were generated for all accuracy categories (Which Road, Which Lane). At a more abstract level, solution availability statistics were also calculated for the DPOS and RTK methods. RTK solutions were defined as available whenever the software yielded a solution for that particular epoch. Data gaps in the RTK method could be caused by either communication failure due to, for example, a large truck entering the line of sight between vehicles, or one vehicle disappearing around a corner, or because insufficient observations from common satellites were available at the two vehicles. DPOS solutions, calculated in post-processing, were defined to be available whenever both receivers had observations from four or more satellites and were therefore able to calculate the necessary independent position solutions. While the two definitions of availability are not quite congruous, because only that for the RTK includes the possibility of communication failure, comparison of logs of data transmitted between the vehicles showed that out of approximately 45 hours of data, only 0.22 percent of missing RTK solutions could be attributed to failure of the DSRC link.
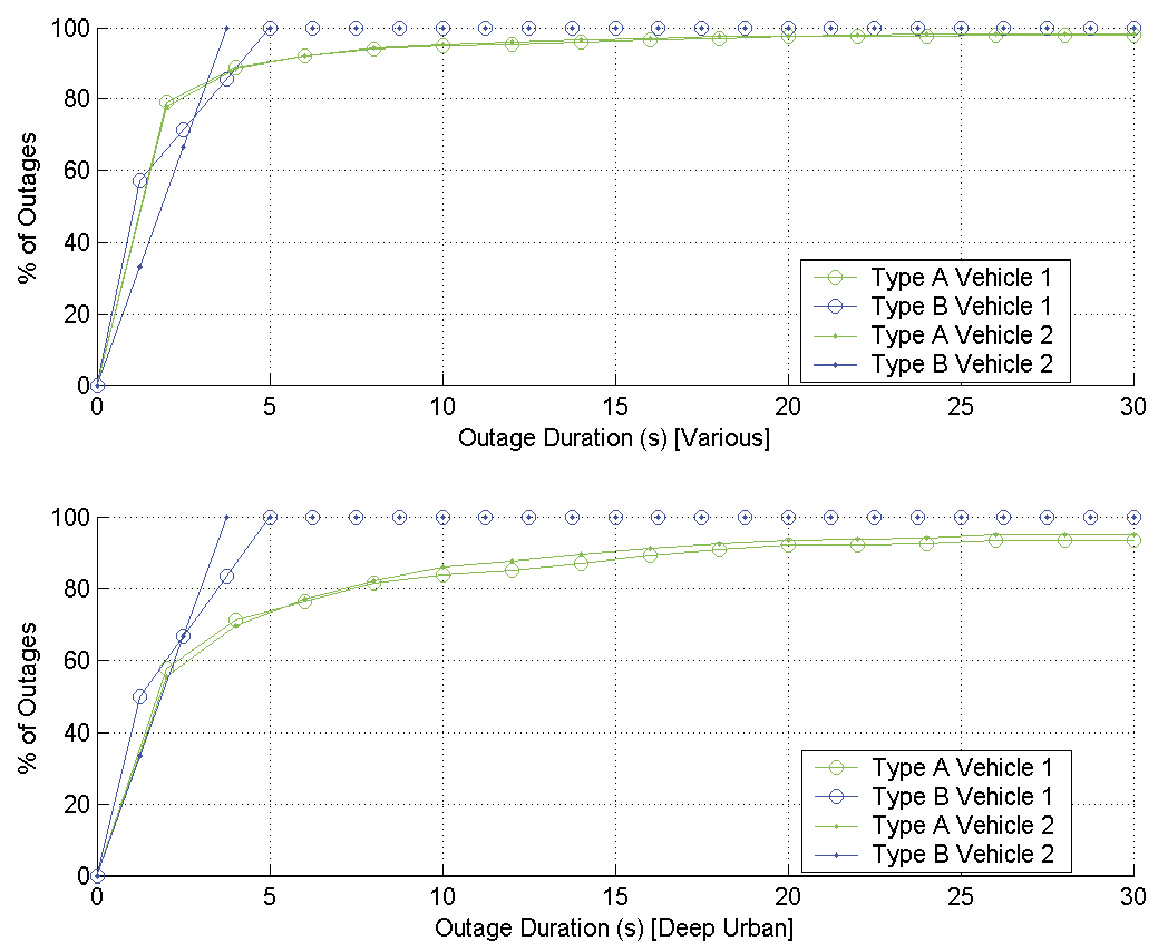
Figure 4 plots the distribution of GPS service outages observed by AW and BW receivers in individual vehicles in all of the test environments including deep urban. Here, as described for the DPOS method, an outage for a single receiver is identified on an epoch basis whenever the receiver has observations from less than four satellites. The total driving time included in this dataset is 45 hours and 4 minutes for each receiver. Figure 4 [deep urban] shows the same statistics for deep urban environment driving only, and this contains 1 hour and 40 minutes of driving for each receiver. The latter was selected specifically as this environment contained the most challenging conditions.
Figure 4. Distribution of GPS service outages for individual vehicles.
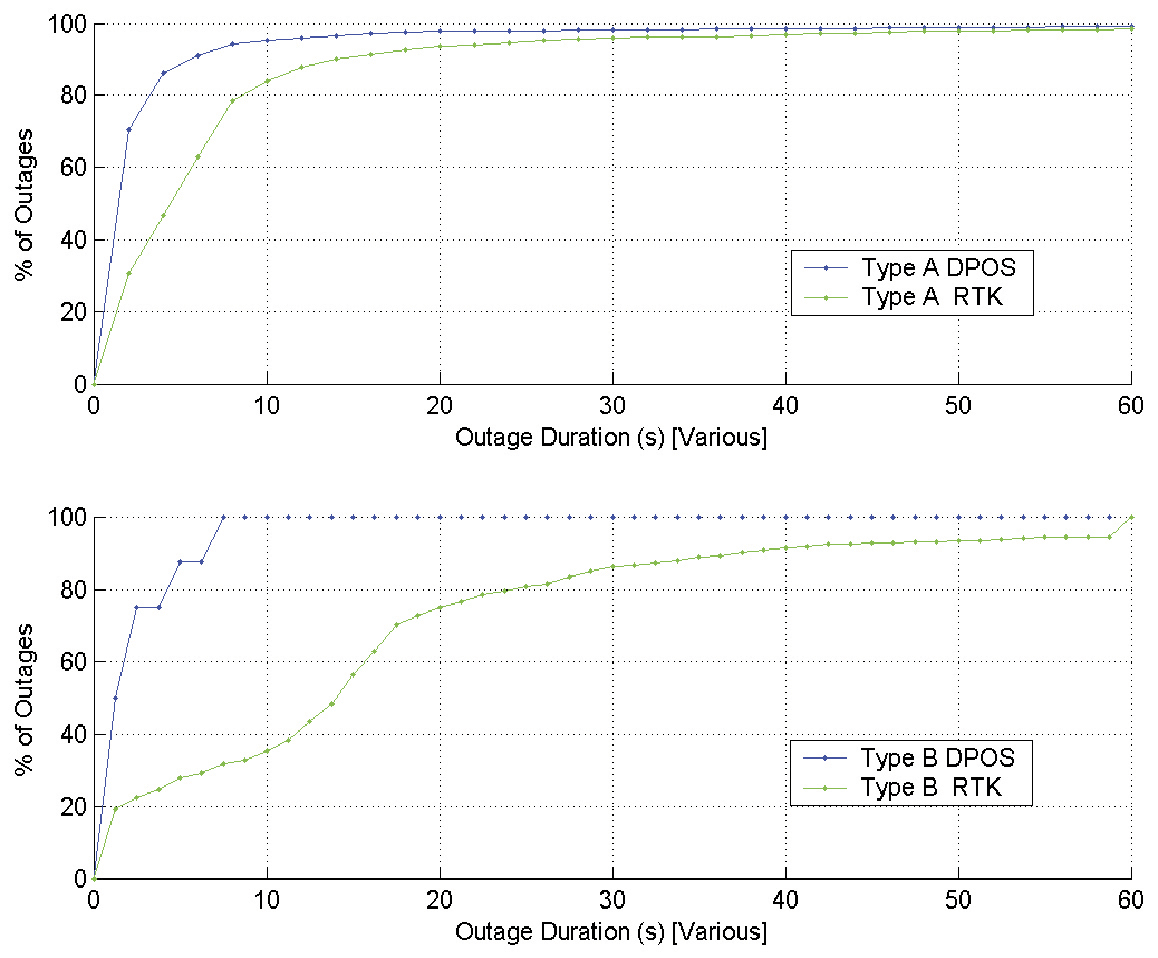
An important conclusion based on this data is that more than 98 percent of the individual vehicle-level service outages in the entire study lasted less than 30 seconds using any one of the receiver types. For the deep urban environment, 93 percent of the outages lasted less than 30 seconds. However, when using the high-sensitivity enabled Type B receivers, 100 percent of the outages lasted less than 5 seconds. No significant outage difference is seen between the observations from the same receiver type in the two vehicles.
GPS service availability for V2V applications was calculated using two approaches for the two relative positioning methods. For the DPOS method, individual vehicle service availabilities were time-synchronized in post-mission, and V2V DPOS solution availability was estimated. Figure 5 compares V2V solution outages using both receiver types and both relative positioning methods.
Figure 5. Distribution of GPS service outages for V2V applications.
The DPOS method yields better solution availability statistics than RTK. With both receiver types, more than 95 percent of DPOS solution outages are less than 10 seconds. With the RTK method, relatively longer outages were observed, especially for Type B receivers. With Type A receivers, the difference is only significant for outages shorter than 30 seconds. For Type B receivers, larger percentages of longer RTK outages were observed; this can be potentially attributed to poor carrier-phase tracking loop performance of these receivers and the impact on RTK.
Using GNSS Data
We anticipated performance issues arising from receiver type and configuration incompatibilities going into the prototype development effort. We identified use of raw GPS measurements instead of the DPOS method as one method to overcome this limitation, as the differencing techniques with measurement data guarantees correlated error cancellation. This was one reason to include the RTK capability in the prototype system. Therefore, confirming the fact that use of raw measurements eliminates the receiver type and configuration-related incompatibilities was a major goal of the study.
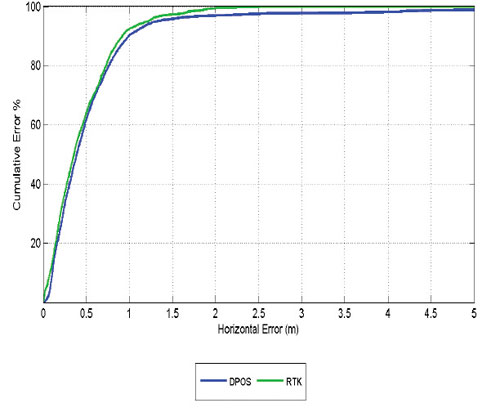
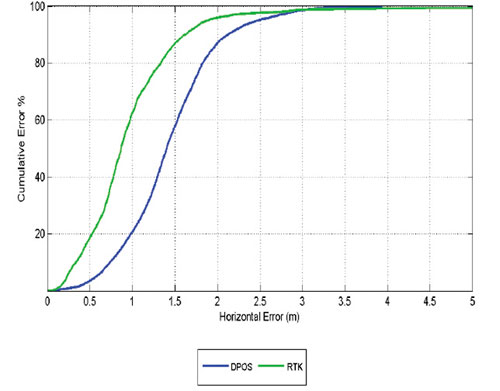
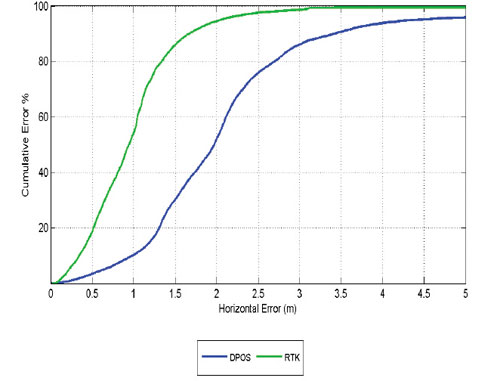
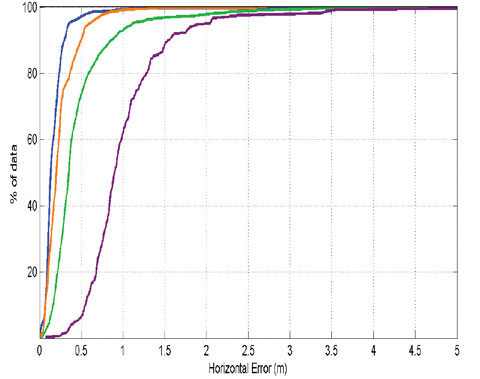
As discussed earlier, V2V relative position solutions using RTK were logged in real time as a part of the test setup. We compared these real-time RTK solutions and the DPOS solutions estimated in post-mission for all datasets. Figure 6 shows three cumulative probability distribution (CDF) plots generated using RTK and DPOS accuracy data from a freeway test dataset. The first CDF plot (left) shows the comparison of accuracy when both vehicles use Type A receivers with RTK and DPOS methods. The second CDF plot (center) shows the same CDFs when both vehicles use the Type B receivers. The third shows the DPOS and RTK accuracy CDFs when vehicle 1 uses Type A receiver and the other uses Type B receiver.
Figure 6 demonstrates that if higher quality GPS receivers similar to Type A are used in both vehicles, both RTK and DPOS methods would provide a solution of better than Which Lane accuracy more than 90 percent of the time. However, if Type B receivers are used, a solution with similar accuracy will only be available 60 percent of the time if the DPOS method is used for relative positioning of the vehicles. If the RTK method is used, this availability can be increased up to 90 percent.
The performance difference between the two methods becomes even more prominent when the two vehicles use a mix of receiver types. In the right-most CDF of Figure 6, a solution with Which Lane accuracy is only available 30 percent of the time if DPOS method is used with the mixed receiver configuration. The RTK solution availability still remains around 90 percent even with the mixed configuration. This confirms that use of measurement data eliminates some of the limitations associated with the DPOS method.
Comparison of only the RTK performance between all three CDFs in Figure 6 shows that RTK V2V performance is only limited by the worst-performing receiver in the receiver combination. Out of the three CDFs, the middle (both vehicles using Type B) and the right (Type A and B mix) CDFs have almost identical RTK performance curves. Given that the RTK curve with both using Type A receivers shows much better performance, it is fair to conclude that in the mixed-receiver case, the RTK curve is limited by the performance of th
e Type B receiver. Figure 6 also shows that at Which Road accuracy, all receiver combinations and both processing methods yield almost identical performance.
Figure 6A. Comparison of V2V solutions using RTK and DPOS methods.Figure 6B. Comparison of V2V solutions using RTK and DPOS methods.Figure 6C. Comparison of V2V solutions using RTK and DPOS methods.
Other Approaches
Given that carrier-phase measurements are subject to cycle slips in some road environments, we ran a test using code measurements only in relative mode, using selected data sets collected on a mountainous highway. Only common satellites were used. Given that code measurements are not affected by a loss of phase lock, such a solution is more robust, but is subject to code noise and multipath. The RMS horizontal position differences between these solutions and the reference inter-vehicle separations were 25 centimeters and 1 meter for receiver Types A and B, respectively. Both receiver types meet the Where-in-Lane requirement in this test. Type A, with its low code noise and excellent code multipath-reduction capability, has a clear advantage.
Such an approach would represent a compromise between the DPOS and RTK approaches. Its advantage over the RTK approach is a lower data transmission-rate requirement, while that over the DPOS approach is the use of common satellites only. The latter is quite significant, since low-elevation satellites contribute the most to horizontal position solutions, but their measurements are affected more by atmospheric transmission errors that are most effectively removed in differential mode on a satellite-by-satellite basis.
V2V Operation with V2I
While infrastructure support can almost always improve the performance of other V2X applications, it can pose a challenge for positioning when such coverage is not continuous. The complication arises as a result of vehicles transitioning in and out of V2I coverage areas. V2I systems are highly likely to include GNSS augmentation capability so that vehicles within a coverage area benefit from better positioning capability. However, when vehicles transition from standard (V2V) operation mode to a V2I enhanced mode, some effects in the vehicle position domain can pose potential challenges for DPOS-based V2V.
The field study included test scenarios with limited V2I coverage in different driving environments: all of those described above with the exceptions of deep urban and mountains. In deployment, the infrastructure points (IPs) would broadcast aiding information to the vehicles within their coverage area, allowing real-time calculations. In the field study, in which the role of the IP was filled by a stationary high-grade receiver with a tripod-mounted antenna, all V2I estimates of the IVV were calculated using post-processing. Further, V2I estimates of the IVV were only calculated when at least one of the vehicles was within the coverage area of the IP, here chosen to be a circle of radius 300 meters centered at the IP. This range was chosen since it is the nominal effective range of the DSRC link.
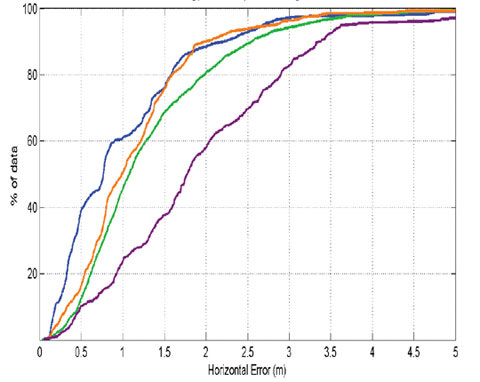
The location of the IP, that is, the phase center of the stationary antenna, was determined using commercial RTK network software with additional stations at precise locations on the rooftop of a building at the University of Calgary. The estimated accuracy of this position was 5 millimeters (1 sigma). The distances of the vehicles from the IP, used to indicate when the vehicles transitioned into and out of the IP coverage area, were determined using the GPS/INS reference trajectories. In post-processing, once a vehicle was identified as having entered the IP coverage area, commercial RTK software was used to estimate the position of the vehicle, using the IP as base and each of the test receivers on that vehicle as rovers. The IVV was then calculated using the difference of the positions of the two vehicles. Thus, the V2I estimate of the IVV was determined using what is essentially the DPOS method with stationary base RTK-indicated vehicular positions, instead of the less accurate single-point GPS position solutions. When only one vehicle was within the coverage area, single-point solutions were used for the distal vehicle, resulting in a solution called V2I-S.
Figure 7 shows two sets of CDFs generated to illustrate the V2V positioning accuracy with V2I capability. The left plot corresponds to AW–AW receiver combination, and the right plot corresponds to the BW–BW combination. Each plot includes four curves. One pair of curves shows the V2V positioning accuracy without V2I, which includes performance when using the DPOS method (green) and another when using RTK (blue). The second pair shows the accuracy of the V2I and V2I-S estimates.
The most striking observation from Figure 7 is the separation of the V2I-S case from others for both receiver combinations (purple). It shows much worse positioning accuracy compared to the other three curves. For instance, using a BW–BW pair, the system will meet the Which Lane accuracy requirement around 80 percent of the time for either DPOS or RTK V2V without V2I support. However, when V2I coverage is available to only one vehicle, the V2I-S case, the accuracy requirement is only met at 40 percent confidence.
Figure 7A. Average relative positioning accuracy as a function of V2I positioning modes (orange V2I; green DPOS; blue RTK; purple V2I-S).Figure 7B. Average relative positioning accuracy as a function of V2I positioning modes (orange V2I; green DPOS; blue RTK; purple V2I-S).
Thus, system accuracy performance degrades when vehicles are operating in DPOS mode and are transitioning in and out of the V2I zones. This is because the V2I-S estimate is the difference of an accurate position solution for the vehicle within the coverage zone, and a potentially inaccurate single-point solution for the one outside the coverage zone. The beneficial cancellation of similar errors that occurs for DPOS estimates (using similar receivers and with common satellite observations) does not occur for V2I-S.
Potential solutions to this problem include using a V2I method of IVV calculation that is not dependent on the estimated position alone (that is, use RTK or other measurement-based methods as opposed to DPOS), or using a position-mode indicator with the DPOS mode such that a DPOS-based V2V solution is only generated when both vehicles are operating in the same mode (that is, V2I). However, the latter does not provide a remedy for the complications when the two vehicles are operating in two different modes. One could also consider a variation of the latter method whereby a V2I-augmented position and a non-augmented position is maintained by each vehicle, such that one of them could be used to generated a mode-matched DPOS V2V solution for a given sender.
Recommendations
These extensive trials provided valuable data demonstrating technical challenges associated with V2X positioning.
Error characteristics and modeling in the navigation solutions in receivers A and B are type-dependent, and they may not be compatible when a receiver mix is used with the DPOS mode. This is very likely to be the case for many other commercial receivers. Therefore, it is important to develop receiver hardware and software minimum-performance standards that define acceptable performance for measurement quality, satellite tracking and selection criteria, reliability estimates, navigation-solution parameters, and other such indicators.
Findings with RTK confirm the fact that use of measurement data eliminates some of the limitations associated with the DPOS method. While RTK is the most demanding raw data-based method in terms of processin
g requirements and OTA data needs, the study also conducted limited investigation on other methods that use raw code data and are less resource-intensive, and at the same time better performing than DPOS. Such an approach would represent a compromise between the DPOS and RTK approaches.
An important conclusion based on this data is that more than 98 percent of the individual vehicle-level service outages in the entire study lasted less than 30 seconds using any one of the receiver types. For the deep urban environment, 93 percent of the outages were less than 30 seconds. These statistics are useful for future research on suitable GNSS augmentation methods.
System accuracy performance degrades when vehicles operate in DPOS mode and transition in and out of the V2I zones. Potential solutions should be incorporated into the systems to take care of these limitations.
Acknowledgments
The authors thank the Crash Avoidance Metrics Partnership Vehicle Safety Communications-Applications team, in particular the Vehicle Positioning Technology Development team, for input. This work was conducted as a part of a CAMP VSC-A project under a cooperative agreement with the U.S. DOT.
CHAMINDA BASNYAKE is a senior research engineer at General Motors Global Research and Development and GNSS technology expert for GM OnStar. He leads GNSS-based vehicle navigation technology R&D efforts at GM and holds a Ph.D. in geomatics engineering from the University of Calgary.
TOM WILLIAMS is a postdoctoral researcher in the PLAN group in the Department of Geomatics Engineering at the University of Calgary.
PAUL ALVES is a Calgary-based geomatics consultant specializing in RTK. He obtained his doctorate from the University of Calgary.
GERARD LACHAPELLE holds an iCORE/CRC Chair in Wireless Location and heads the PLAN Group in the Department of Geomatics Engineering at the University of Calgary.