The European Union Space Programme Agency (EUSPA) has signed a framework contract entrusting France’s space agency with providing Galileo search-and-rescue (SAR) services. The 137 million euro 10-year contract includes maintaining assets in operational condition, coordinating with the host sites and interfacing with the Cospas-Sarsat community.
Image: EUSPA
The National Centre for Space Studies (CNES) has been responsible for operations of SAR-Galileo services for the European Union since 2016, providing the SAR-Galileo Forward Link Service and the Return Link Service. The coordination of operations and maintenance of the ground segment, deployed across Europe, is headquartered at the space center in Toulouse, France.
A network of reference beacons enables evaluation of the performance of the systems in real-time. CNES also provides its expertise to EUSPA for the definition of international standards, performance monitoring and future developments.
Emergency position-indicating radio beacon-based services is an addition to the framework contract. CNES has already been identified as the future operator of the Emergency Warning Service, an alert service for European communities scheduled to begin operations in 2024.
By Xavier Leblan and Giuseppe Rotondo, GUIDE-GNSS, Toulouse, France Miguel Ortiz, Université Gustave Eiffel, Nantes, France and Christelle Dulery,CNES (French Space Agency), Toulouse, France
Geolocation errors, degraded signal and environmental masking
In a perfect world, the positions calculated by trilateration using the signals transmitted by GNSS satellites would always be accurate to within a few centimeters. Unfortunately, in addition to the intrinsic quality of the receivers, many factors alter the measurements made by a GNSS receiver and degrade the final geolocation data.
To begin with, the GNSS system itself suffers from multiple imperfections including so-called “global” errors. For this reason, the satellite navigation system is complemented with the broadcasting of assistance messages to increase the performance of receivers compatible with SBAS systems, such as EGNOS for the European continent.
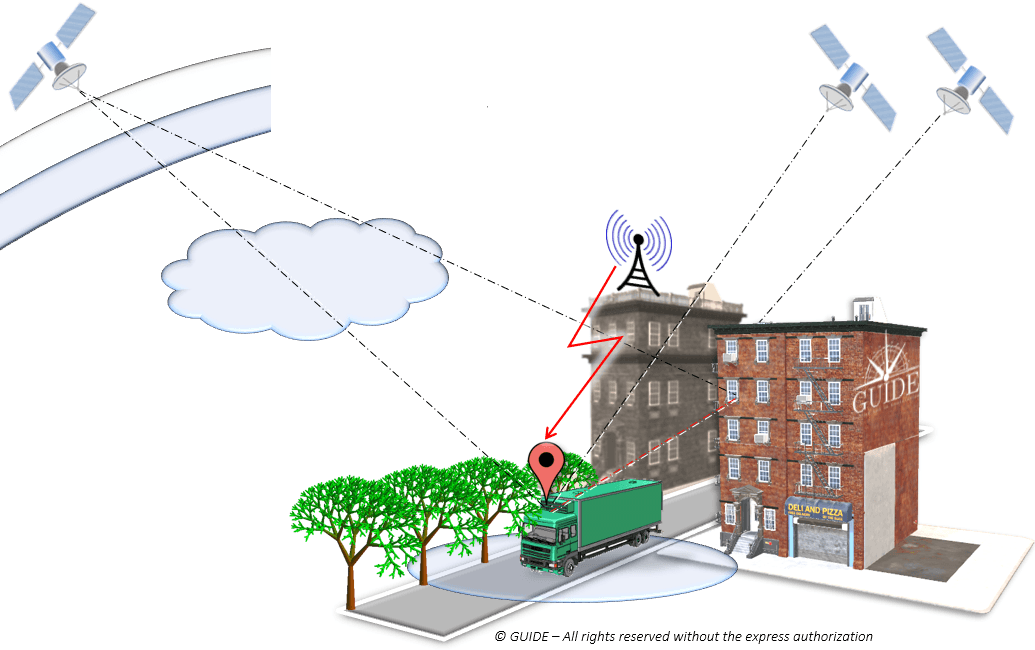
In addition, for terrestrial applications, the satellite signals are affected by several phenomena caused by the immediate surroundings of the receiving antenna. These are the so-called “local” errors, such as terrain, bridges, infrastructures, vegetation and interference of any type. Depending on the areas covered, the trajectories calculated by the terminals deviate more or less from that actually taken by the vehicle (antenna), i.e. the “reference trajectory,” also called “ground truth.”
Figure 1. Sources of error in urban geolocation. (Image: GNSS-GUIDE)
Sources of error in urban geolocation include:
Global errors
Orbits and clocks
Satellite geometries
Ionosphere, troposphere
Local errors
Obstruction, attenuation
Multipath and diffraction
Interference, jamming, spoofing
Terminal errors
Receiving chain
Algorithms and services
Navigation sensors
Classification of position errors
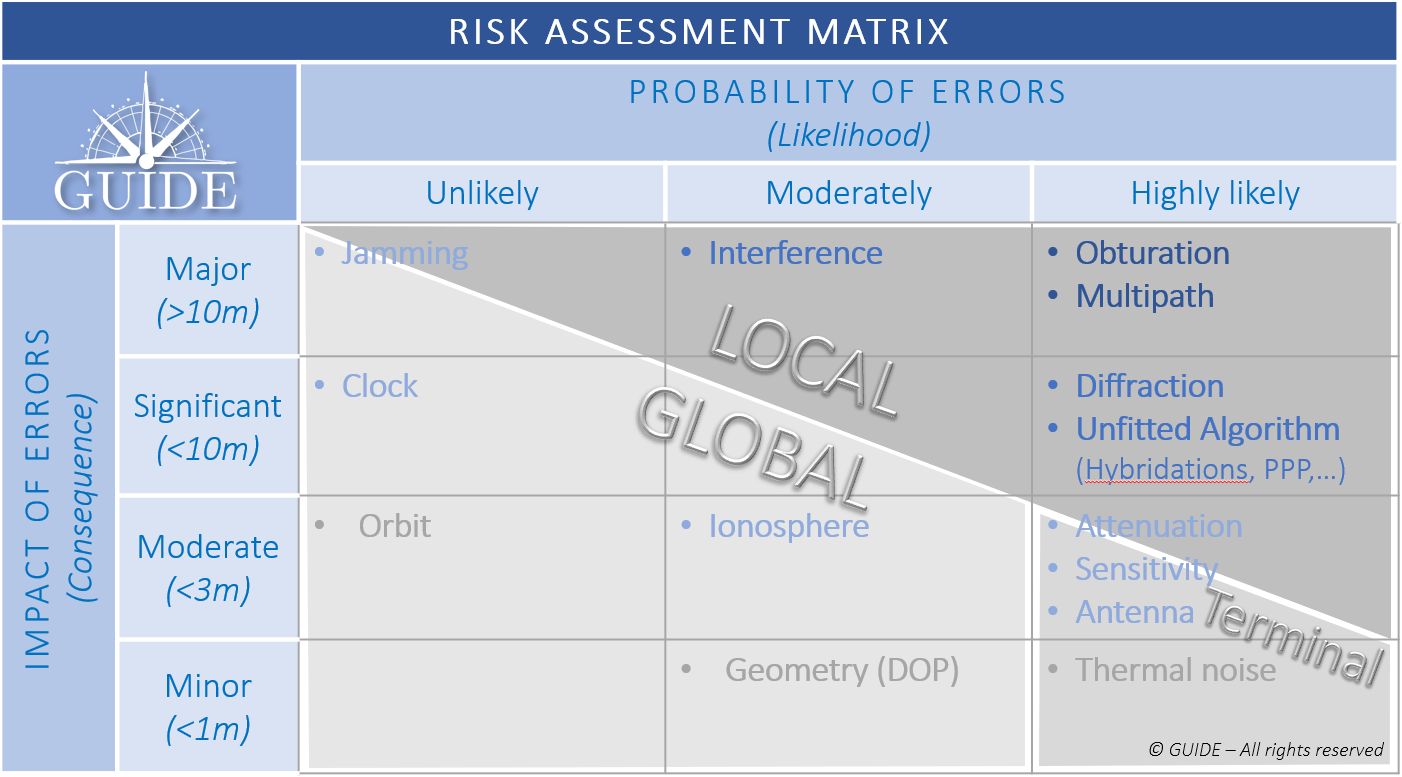
To study those phenomena having the greatest impact and likely to be the most frequent, the different types of errors are displayed as a risk matrix. As the “global” errors can be considered to be handled by the regional SBAS system, the pre-eminence of the so-called “local” errors should be addressed.
Figure 2. GNSS Risk Matrix. (Image: Authors)
Description of the main sources of local errors
To observe the effects of local phenomena on the propagation of signals, a dozen identical receivers — with the same configuration and sharing the same antenna — were mounted on a vehicle and driven through urban and peri-urban areas.
We focus on four particularly impacting phenomena to visualize the trajectories calculated by the receivers.
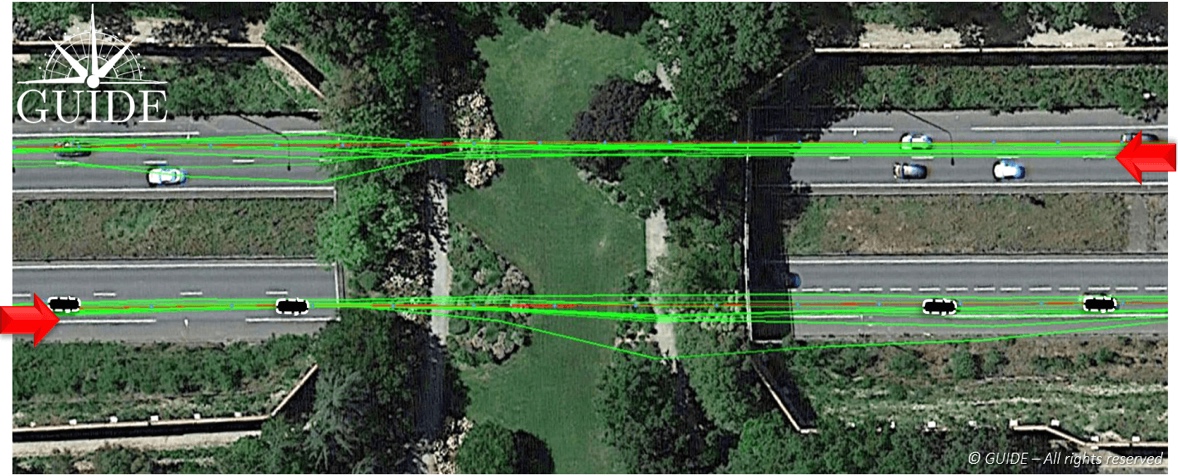
Positioning errors due to bridges
In the picture, below, the test vehicle passes under a bridge in both directions. In both cases, the trajectories diverge under the bridge and converge further on. Here it is easy to understand the shortcomings of results based on a single pass, in other words based on a single measurement.
Figure 3. Effect of alteration of GNSS signals on receivers passing under a bridge. (Image: Auhors)
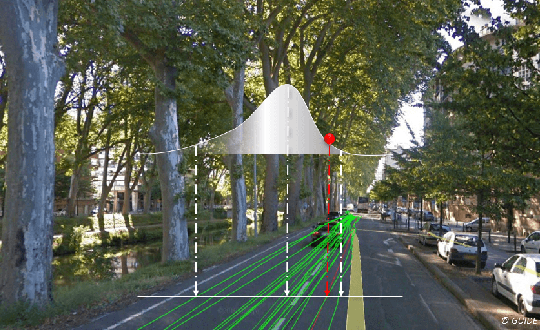
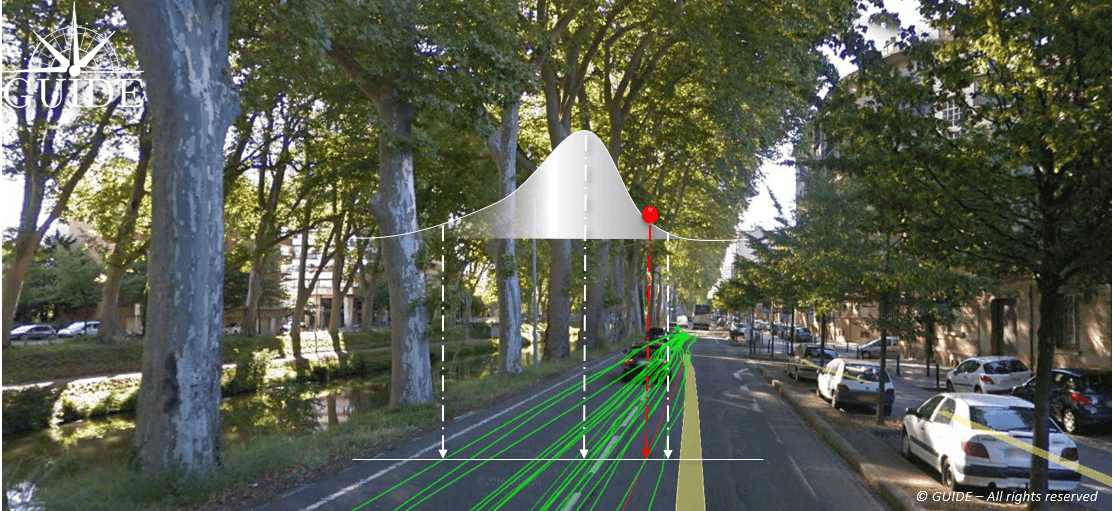
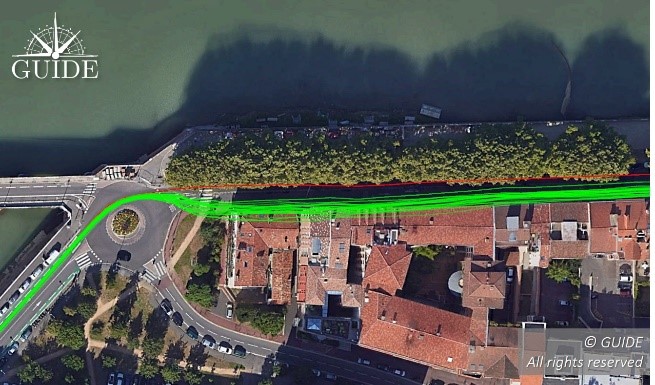
Positioning errors due to vegetation
In the image below, the test vehicle is on an avenue lined by trees whose branches and canopy cover the road. The foliage attenuates and, more importantly, diffracts the radio waves arriving from the satellites, thus degrading signal reception. This results in dispersed trajectories. Each receiver provides a different measurement. Note that due to the proximity of buildings, the center of the position distribution, in the presence of multipath, deviates slightly from the reference trajectory.
Figure 4. Effect of diffraction of GNSS signals on receivers passing under tree canopies. (Image: Authors)
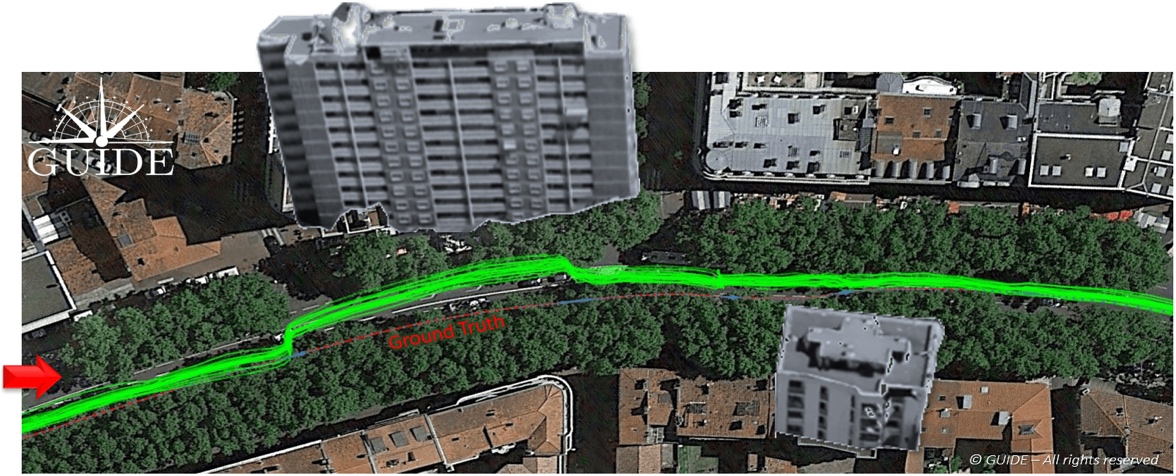
Positioning errors due to buildings
In the composite image (in order to show the main building) below, all the receiver trajectories are deviated towards the building alongside the avenue. The situation highlights the consequences of a phenomenon called “multipath.” When a receiver captures reflected waves, the signal propagation time — used to calculate the pseudoranges — is increased and the accuracy of the end position is degraded. This effect is well known and easily observable during static measurements.
Figure 5. Effects of GNSS signal propagation on receivers near a building. (Image: Authors)
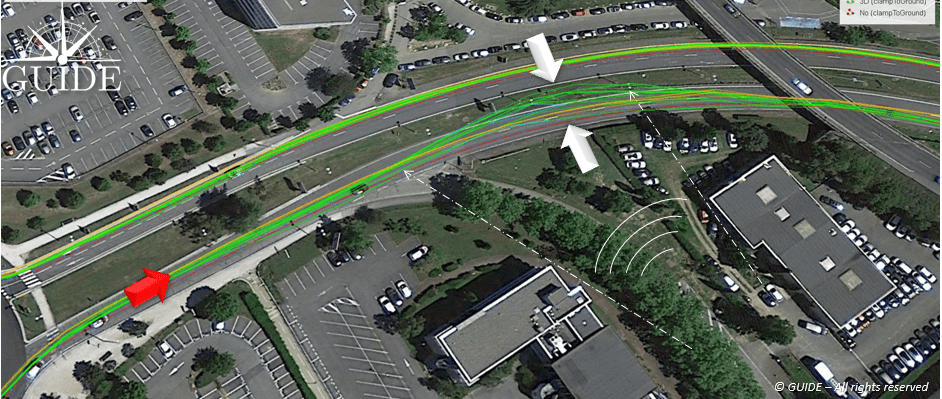
Positioning errors due to interferences
In the image below, the on-board receivers have been disturbed by “transitory” interference. On the outward journey, twenty minutes earlier, no problem had been detected for the trajectories on the other side of the expressway.
On the return journey, this unidentified interference degrades the accuracy of the receivers with a visible dispersion of the trajectories. In other situations, intentional or unintentional interference could completely block out the GNSS band preventing any position measurement.
In this case, the source of the interference seems to come from the bottom right, guided by the two parallel buildings.
Figure 6. Effect of unidentified temporary interference on signals for GNSS receiver. (Image: Authors)
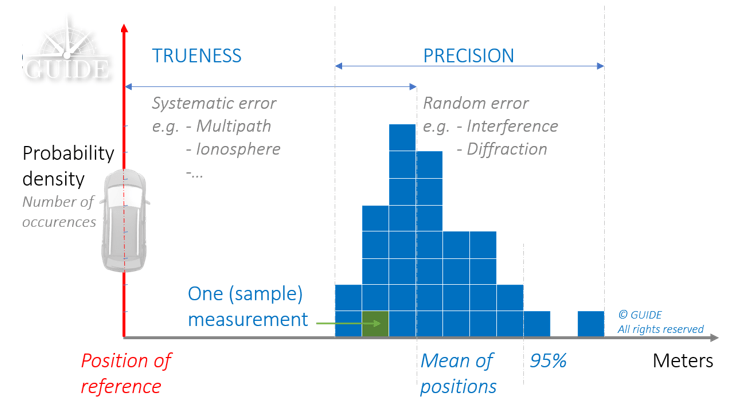
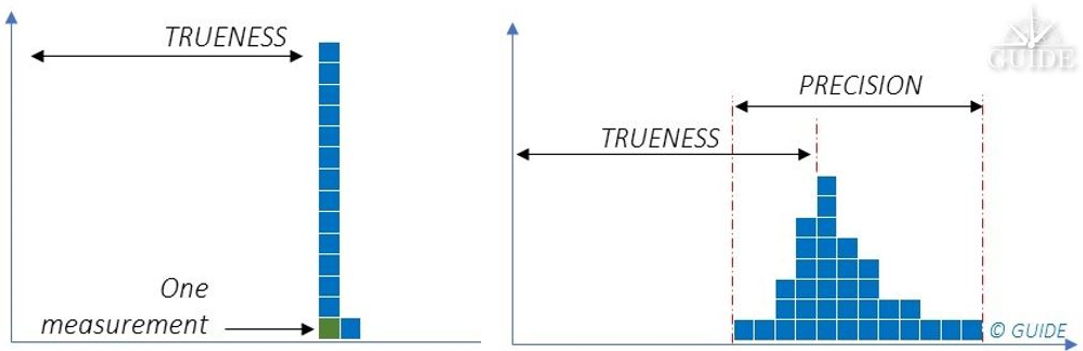
Trueness and precision of position measurements
Receivers of the same batch behave differently depending on the environment. For a predominantly multipath situation, they all converge to the same wrong position. On the other hand, when the propagation phenomena become more complex with multiple diffractions, such as reception under foliage, each receiver produces a position with a different error. For complex environments, we have a combination of these two behaviors.
The first behavior is deterministic. Metrology uses the term measurement “trueness,” which stands for “closeness of agreement between the average of an infinite number of replicated measured values and a reference value.”
The second behavior is non-deterministic. In this case, metrology uses the term measurement “precision,” which stands for “closeness of agreement between indications or measured values obtained by replicated measurements on the same or similar objects under specified conditions.”
Terrestrial applications often offer a varied mix of environments where “trueness” and “precision” errors accumulate. It is essential to consider both components in order to characterize and study GNSS receiver performance.
Statistic distribution of the different positioning errors:
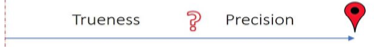
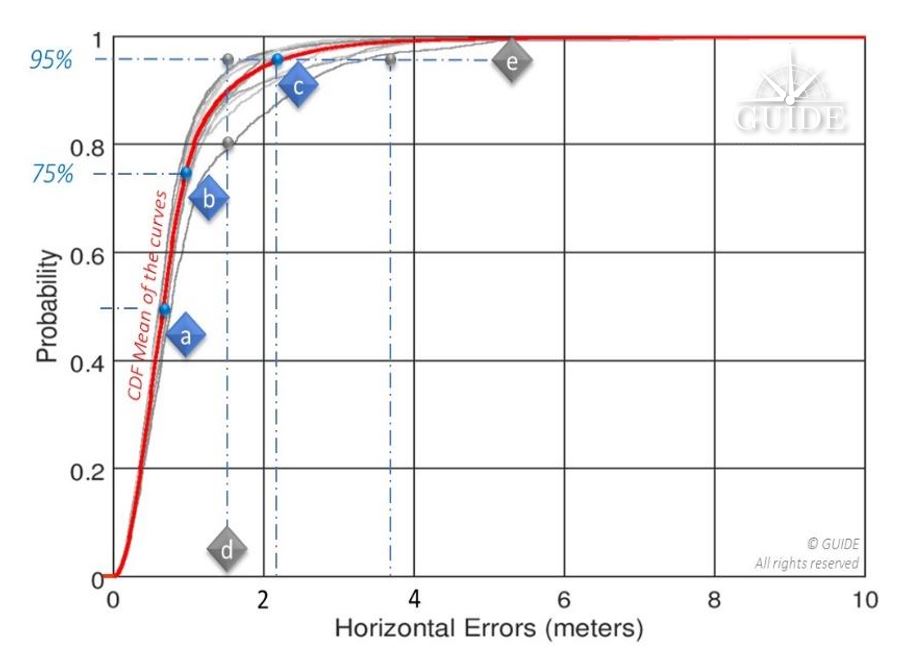
Figure 7. Combination of deterministic and non-deterministic errors. (Image: Authors)Figure 8. A single position measurement at a point has two unknowns: The weight of deterministic (trueness) errors compared to those that are not (precision). (Image: Authors)Figure 9. Statistical distributions of errors for a trajectory (scenario), that is the percentage of all errors (probability) lying beneath a given accuracy level. (Image: Authors)
Above, 95% of the positions calculated during a replay have an accuracy better than 1.5m; this same value is only reached with ~80% of the positions calculated during another replay — see vertical line [d]. The horizontal line [e] illustrates the spread of the horizontal position by considering 95% of the positions of two replays: for one the displayed accuracy is ~ 1.5m and for the other it is degraded to 3.5 m. This curve will always point to the same reference points [a], [b] and [c] recommended by the standard EN16803-1 and corresponds to the percentage of measurements respectively less than 50%, 75% and 95%.
By way of example, the evaluation of a single receiver on board a vehicle travelling in an urban environment does not allow separation of these two components. Indeed, signal degradation determines the degree of dispersion of the “random” component of the measurements. Thus, in certain environments, each additional receiver will produce a different result. However, the analyses of a single onsite campaign relies on just one single sample (single trajectory of the terminal under test), where a panel of measurements is essential. In fact, the available statistics prove insufficient to characterize a receiver, even at the cost of doing long runs.
Figure 10. Visualization of the combined deterministic and non-deterministic errors. (Image: Authors)
Live testing is therefore rather intended for final integration.
On the other hand, a constellation generator will synthesize ideal signals derived from mathematical models, and, in any case, not representative of the real environment. The measurements will then only be deterministic, that is, subject to “systematic” errors. Repeated simulations on the same receiver will always produce the same measurements. Nevertheless, this type of test bench offers many advantages for simulating unobservable situations in the real world.
Disparities in analysis possibilities on position errors based on:
Figure 11. Typical results for repeated measurements obtained, respectively from left to right, with synthetic signals and real-world signals. (Image: Authors)
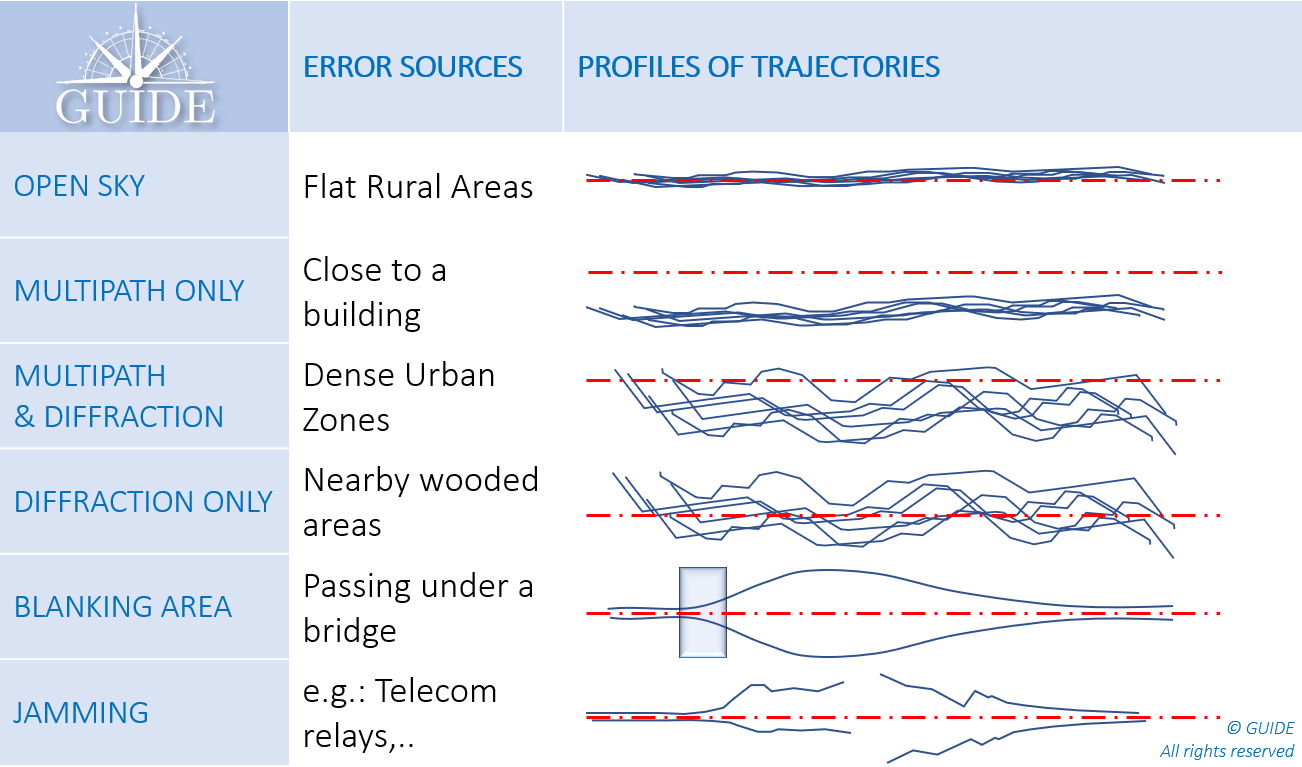
In summary, the main error profiles are described below.
Each situation combines both trueness and precision errors. This latter component requires several runs in the same configuration to determine the potential measurement spread.
Figure 12. Position error profiles (measured trajectories/DUT) depending on the environment. (Image: Authors)
What is GNSS metrology?
As a first approach, characterization of GNSS performance would require many receivers on the same test vehicle. This method is certainly useful in the experimental stage, especially to understand the impact of propagation phenomena on positioning errors. However, it has major disadvantages, both from a logistics point of view and because of the basic metrological requirements.
To obtain reliable and useful measurements, from an operational point of view, the tests must be “representative” of the areas to be covered and “reproducible” to check the results and make valid comparisons, for example, between two receivers, two firmwares, two settings, two antennas and even two hybridizations.
Under these conditions, replay techniques, often referred to as “record and replay,” meet the expected requirements. For the record, this metrology method consists in digitizing the GNSS signals received by the antenna on board the definition vehicle, taking care to collect all the data associated with the tests (VIDEO, INS, DMI, NRTK, …), above all, the ground truth. Thus, at the end of the campaign the GNSS signals and other data are synchronized and restored on a replay bench consisting of an “SDR replayer.”
Replaying the same scenario on a receiver makes it possible to reproduce the recording conditions identically. Each pass generates new measurements, equivalent to using an additional unit, virtually onboard. Compiling the results thus highlights the non-deterministic errors, that is, those which by their random nature emerge from the others.
Test laboratories such as GNSS GUIDE design and market test data that can be replayed directly on the main simulation instruments capable of operating in two modes: simulation and replay. The replay configurations are generally much more affordable than the larger, structurally more complex constellation generators. In addition, the implementation of replay sessions is simple, fast and requires no special training.
In addition to scenarios made on request, the available libraries already cover a multitude of cases, previously inaccessible for an isolated user. They open up the possibility of testing terminals in different latitudes with varied terrain and neighborhoods composed of typical architectures.
Conclusion
The French Space Agency (CNES) has financed several R & D contracts for the development and validation of this replay technique (record and replay). It is already recommended by CEN / CENELEC through the series of EN16803 standards to characterize and classify the performance of GNSS terminals. This methodology complies with the basic principles of metrology.
The test conditions are reproducible and representative of operational conditions. The measurements are repeatable and allow separating the systematic errors (trueness) from the random errors (precision). Measurement uncertainties are also accurately established.
During an on-site measurement campaign, the statistical distributions of two identical receivers on board the same vehicle lead to different results. Thus, no characterization can be established at this stage.
With a replay bench, after several iterations of the same scenario, the average values of the measurements on a CDF tend toward a curve characterizing the performance for that scenario.
Instrumentation dedicated to replay operations is less complex and less expensive. Statistical models of simulations are replaced by scenarios of GNSS signals previously digitized in the field or on constellation generators. Thus, whether they come from a real or synthetic environment, these GNSS signals are easily restored, while drastically reducing the preparation and execution times. The economic benefits of this test technique are now evident and are favoring its adoption by the transportation industries.
References
Niels Joubert, Tyler G.R. Reid, and Fergus Noble (2020), Developments in Modern GNSS and Its Impact on Autonomous Vehicle Architectures
Andrej Tern and Anton Kos (2018), Positioning Performance Assessment of Geodetic, Automotive, and Smartphone GNSS Receivers in Standardized Road Scenarios
Ni Zhu, Juliette Marais, David Betaille, Marion Berbineau (2018), GNSS Position Integrity in Urban Environments
C. Rouch, B. Bonhoure, F.X. Marmet, T. Chapuis, H. Secretan, V. Bienfait, X. Leblan (2016), Measurement campaigns and PVT experiments with new Galileo satellites
B. Calvet, L. Montoya, P. Grandjean, X. Leblan (2015), The GUIDE High-Precision test facility (GNSS laboratory)
G. Duchâteau, X. Leblan, Y. Capelle, W. Vigneau and F. Peyret (2014), Certification of Road User Charging: Approach, standardization and role of laboratories
A team of companies and government agencies is developing satellite services provided by ASECNA’s A-SBAS (Satellite-Based Augmentation System) for Africa and the Indian Ocean. Besides the current SBAS, the joint venture will deliver precise point positioning (PPP, through CNES and Geoflex) and danger warnings for a wide range of applications in Africa.
Working together are the Agency for Air Navigation Safety in Africa and Madagascar (ASECNA), Nigerian Communications Satellite Ltd. (NIGCOMSAT) and Thales Alenia Space, the joint venture between Thales (67%) and Leonardo (33%). The project is backed by Geoflex, a provider of cloud services that deliver improvements to GPS/GNSS applications to achieve positioning accuracy to within 4 centimeters on land, at sea and in the air.
The new SBAS services are expected to aid agriculture and other sectors in Africa. Here,volcanic cinder cones and farming in rich volcanic soils on the border of the Democratic Republic of Congo and Rwanda. (Photo: iStock/Getty Images Plus)
Demonstrations
The three partners successfully demonstrated the additional services on July 7 and 8 in Brazzaville, Congo, by calling on the SBAS signal they have broadcast over the Africa and Indian Ocean (AFI) region since September 2020 to provide the first SBAS open service in this part of the world via the NigComSat-1R satellite. This trial follows successful flight demonstrations this year in Lomé in January and Douala in June.
The first demonstration of the special urgent situation warning service via satellite showed the system’s ability to broadcast a warning message via the A-SBAS signal to mobile phones, without requiring a terrestrial network. This service sends a message to the populations concerned, providing information on the type of danger and instructions to be followed.
The second demonstration entailed the transmission of GNSS corrections based on CNES/Geoflex PPP technology and also using the A-SBAS signal. This approach showed the system’s ability to achieve positioning accuracy to within centimeters across the entire African continent.
The new satellite service paves the way for applications in a broad range of sectors, including precision agriculture, land and maritime transport, rail safety, drone navigation, mapping and surveying. The ASECNA SBAS was developed as part of the ‘’SBAS for Africa & Indian Ocean’’ programme as a first step towards providing robust navigation services in the aviation sector.
ASECNA’s 18 Member States are Benin, Burkina Faso, Cameroon, Central African Republic, Comoros, Congo, Côte d’Ivoire, France, Gabon, Guinea Bissau, Equatorial Guinea, Madagascar, Mali, Mauritania, Niger, Senegal, Chad and Togo.
Geoflex, a geolocation company, won the Jury Award of SPRING 50, a competition of deep tech startups that took place on May 20 in Paris-Saclay, the largest French research cluster, located south of Paris.
Geoflex is a cloud service operator that enhances GPS/GNSS-based applications to provide 4-centimeter positioning on land, at sea and in the air.
Geoflex was initially selected among the 10 most promising companies within the 50 startups promoted at the event. All 10 startups founders were subsequently showcasing their companies in a 4 minutes pitch, and Geoflex’s CEO Romain Legros won this last leg of the competition.
Geoflex’s hyper-geolocation service has been available globally since 2018. The service, which corrects inherent GNSS inaccuracies, is provided in real time or in post processing. It works across all types of GNSS hardware receivers and includes correction data for all constellations: GPS, GLONASS, Galileo and BeiDou and for all their frequencies.
The technology was initially developed by the French space agency CNES in a 12-year research project. It is protected by seven patents licensed to Geoflex, which continues co-development of the technology with the CNES.
Geoflex also has developed a positioning engine that includes sensor fusion with other technologies such as inertial, optical and communications. A hardware development kit is available.
ITSNT is an annual event organized by the French space agency CNES and Ecole Nationale de l’Aviation Civile for professionals and researchers working with or interested in navigation and timing technologies and their use.
The ITSNT preliminary program is now available, with experts discussing PNT resilience, multi-sensor navigation, autonomous/automated vehicles and much more. Also included are tutorials, exhibits and networking opportunities.
ITNST is an annual event organized by Centre National d’Etudes Spatiales (CNES) and Ecole Nationale de l’Aviation Civile (ENAC) for professionals and researchers working with or interested in navigation and timing technologies and their use.
The 2018 edition of the ITSNT will take place Nov. 13-16 in Toulouse, France, on the campus of ENAC.
This event is composed of two types of sessions:
Invited Guest sessions: special guests are invited by the scientific committee to give a presentation related to the generic topic of the session. Typically, there are four guest speakers per session, and the session ends with a round table. The programme of the “invited guest” sessions is available on the website.
Peer-Reviewed Paper sessions: the presenters of these sessions are selected by the scientific committee based on a call for abstract. The deadline for the call for abstracts is May 25. The final programme of these sessions will be available in October.
The ITSNT also provides a great environment for networking and visiting sponsors’ exhibition stands.
The symposium includes tutorials given by some of the invited guest speakers on their topic of excellence.
The International Technical Symposium on Navigation and Timing, also known as the ITSNT, is an annual event organized by Centre National d’Etudes Spatiales (CNES) and Ecole Nationale de l’Aviation Civile (ENAC) for professionals and researchers working with or interested in navigation and timing technologies and their use.
The 2018 edition of the ITSNT will take place Nov. 13-16 in Toulouse, France, on the campus of ENAC.
This event is composed of two types of sessions:
Invited Guest sessions: special guests are invited by the scientific committee to give a presentation related to the generic topic of the session. Typically, there are four guest speakers per session, and the session ends with a round table. The programme of the “invited guest” sessions is available on the website.
Peer-Reviewed Paper sessions: the presenters of these sessions are selected by the scientific committee based on a call for abstract. The deadline for the call for abstracts is May 25. The final programme of these sessions will be available in October.
The ITSNT also provides a great environment for networking and visiting sponsors’ exhibition stands.
The symposium includes tutorials given by some of the invited guest speakers on their topic of excellence.
French space agency CNES has made available two applications on the Google Play store for Android apps. Both are compatible with Android N (Nougat).
RTCM Converter: This app aims to convert the smartphone GNSS raw measurements to Radio Technical Commission for Maritime Services (RTCM message type 1077) and send them to a caster, for use by third-party software.
PPP WizzLite: This app is a port of the CNES PPP client (code and Doppler only, light version) on Android. Accuracies of 1-2 meters can be reached in kinematic mode, and sub-meter in static mode (using external SBAS data). To do so, users need to pull external RTCM streams for orbits/clocks corrections and broadcasts, such as ones available from the International GNSS Service Real-Time Service (IGS RTS).
Both apps have been validated on a Nexus 5X device with no phase support.
A region in France is working with SNCF (the French National Railway Company) to foster the emergence of new solutions — including GNSS technologies — for the operation and control of regional trains and railway infrastructure.
On Sept. 1, the Occitanie/Pyrénées-Méditerranée Region and GUIDE (GNSS Testing Laboratory) signed an agreement to open a railway line to field tests for companies seeking to perform assessments aboard trains. The agreement is supported by the French space agency CNES and the Aerospace Valley Center.
The Geofer project, managed by GUIDE, will allow the testing of applications in operational situations. The applications are based on radionavigation and telecommunication data initially intended for other business sectors.
Through the Geofer project, the Occitanie/Pyrénées-Méditerranée Region is pursuing two strategic goals. The first aims to strengthen mobility within the region through better control of operating costs. The second is to diversify industrial activities with rail. The project could lead to modernization of secondary lines of the national railway network by embedding, for example, some functions of railway signaling.
The test region — the Tessonnières-Rodez line (Tarn/Aveyron) — crosses a mountainous area conducive to tests in constrained environments.
As leader of the project, GUIDE is working to geo-reference the line and to instrument a train that will calibrate future embedded applications. The collected data will then be re-used and replayed on test benches to help solution developers tune their embedded systems more easily.
A co-financer of Geofer, CNES is actively involved in the tests. A receiver implementing an algorithm (PPP-WIZARD) developed by its engineers will be tested on board, using software to exploit future satellite services to achieve decimetric accuracy. This technology could make possible many rail applications such as precise dock stops or a better prediction of maintenance operations.
M3 Systems will supply the mission receiver responsible for dispatching accurate and real-time data about the positioning and speed of the train to embedded applications. This device merges the satellite measurements with those of other sensors used to ensure the quality of the geolocation messages.
For example, devices such as shock sensors to detect unusual efforts of the pantograph against the overhead cable, speed control systems for eco-driving, and roaming systems for telecommunication will be developed, implemented and evaluated on the line and on simulation benches.
French Space Agency CNES has signed a cooperation agreement with the company Geoflex, granting it the right to spin off software developed by CNES that employs satellite precise point positioning (PPP) technology.
Under the agreement, CNES is granting Geoflex a license to use its patented technologies in this field with a view to offering a global commercial operational service. This partnership ties in with the agency’s strategy of spinning off its research and development results.
The agreement was signed June 28 at the Toulouse Space Show by Lionel Suchet, CNES’s director of innovation, applications and science, and Romain Legros, chairman of Geoflex.
The Geoflex team was able to draw on more than 10 years’ experience in GNSS precise positioning when they founded their start-up to pursue this project. Through this cooperation agreement with CNES, Geoflex is set to benefit from significant opportunities worldwide in real-time precise positioning, navigation and timing, serving a broad customer base employing applications such as topographic mapping, construction and civil engineering, agriculture, shipping, rail, driverless vehicles and unmanned aerial systems.
“Today’s space technologies will drive revolutionary changes in usage in the future,” Suchet said after signing the agreement. “Through their commitment to developing a global GNSS precise positioning service, CNES and Geoflex are showing that France has a key role to play in innovating and in growing our future economy. The people at this start-up are looking to shake up the status quo, so it was natural that CNES should support them.”
The navigation satellite set to become the 16th in the Galileo constellation has been taken through a Europe-wide rehearsal for its launch and early operations in space.
Sitting in the cleanroom environment of ESA’s ESTEC technology centre in Noordwijk, the Netherlands, the satellite was last week linked to a trio of sites across the continent: the Galileo control centres in Fucino, Italy and Oberpfaffenhofen, Germany, as well as ESA’s ESOC operations centre in Darmstadt, Germany.
Galileo’s Ground Control Segment (GCS) in the Oberpfaffenhofen Control Centre in Germany is in charge of overseeing the performance of the Galileo satellites. (Photo: ESA)
“These System Compatibility Test Campaigns (STSCs) occur on a regular basis,” explained Liviu Stefanov, lead Flight Operations Director for the next Galileo launch in May. “Last December saw a campaign using one of the two Galileo satellites due to be launched in May, while our February rehearsal used another satellite from the quadruplet being launched by Ariane 5 later this year. So with this most recent task, we have reached a frequency of three system tests in less than four months.”
A joint team from ESA and France’s CNES space agency oversee Galileo’s Launch and Early Operations Phase (LEOP) – the initial switching on and checking and configuration of satellite systems. LEOP is run from either ESOC or CNES Toulouse, on an alternating basis.
ESOC will host the LEOP team for the next launch of two Galileo satellites by Soyuz from French Guiana in May. Then the team will switch to Toulouse for the first launch of four Galileo satellites by Ariane 5, scheduled for this autumn.
Members of the joint Galileo Launch and Early Operations Phase (LEOP) team at work in CNES Toulouse. A joint team from ESA and France’s CNES space agency oversee Galileo LEOPs – the initial switching on and checking and configuration of satellite systems. LEOP is run from either ESOC or CNES Toulouse, on an alternating basis. (Photo: ESA)
Liviu added: “From our point of view, this SCTC was a useful final opportunity to try out communications with a satellite that is actually due to fly, before our next Galileo LEOP takes place for real.
“It is the last end-to-end test of the ground segment with a real satellite before the launch.”
“Communicating with and controlling satellites still on the ground is one of the essential exercises the LEOP team has to perform before launch,” said Christelle Crozat, lead Spacecraft Operations Manager for the next LEOP.
“It is an opportunity to test and validate the operational products with a satellite to identify and correct any issues of compatibility with the real hardware while the satellite is still ‘on Earth’. It is always a thrill for the operational engineers to interact with the satellite instead of the simulator.”
Money spent by European taxpayers on spacecraft operations represents an excellent investment in infrastructure and in high-tech, value-added jobs, with strong benefits flowing back to ESA Member State citizens. (Photo: ESA)
In practice, LEOP encapsulates crucial activities such as separation from the rocket’s upper stage, deployment of solar wings and first attitude acquisition, followed by the gradual configuration of the platform system for orbit manoeuvres and the mission to follow.
ESOC and CNES Toulouse both host their own functionally identical LEOP control centre. New Galileo satellites are launched on a regular basis: bringing them to life is demanding. Pooling this crucial responsibility between two agencies and two locations adds efficiency, delivering greater flexibility and redundancy.
“This efficiency has been demonstrated by the three successful LEOPs conducted over the course of last year, in March, September and December,” stressed Hervé Côme, Galileo LEOP Service Manager.
“It is also shown by the capability of CNES/ESOC to support the introduction of one additional Soyuz LEOP on a relatively short four-month notice, for this May.”
Once each LEOP is completed, control of the satellite platform is passed to the Oberpfaffenhofen control centre, with Fucino overseeing the navigation payloads and the positioning services they enable.
Galileo’s Ground Mission Segment in the Fucino Control Centre in Italy oversees Galileo navigation services and satellite payload operations. (Photo: ESA)
Examining the interoperability of precise point positioning products
By Garrett Seepersad and Sunil Bisnath
INNOVATION INSIGHTS with Richard Langley
CARRIER PHASE. We’ve all heard the term and recognize it as a more precise observable for GNSS positioning, navigation and timing than code phase, more commonly called the pseudorange. The carrier-phase measurement is the phase of the received continuous radio-frequency sinusoidal waveform that “carries” the pseudorandom noise ranging codes and the navigation messages. The underlying carrier of a satellite signal can be recovered and its phase measured at regular intervals by the receiver once it locks onto the signal.
As long as there is no interruption in the carrier tracking, the receiver can generate a continuous series of measurements of the cumulative phase or cycle count including fractional cycles. The initial value at signal lock-on is arbitrary. Ideally, it would equal the exact number of cycles (and fractional cycle) of the waveform between the antenna of the satellite and the antenna of the receiver.
If that was the case, then we could simply multiply that cycle count by the wavelength of the carrier in meters, say, and we would have the initial geometric distance (or range) to the satellite. Then we could update this value as time progresses with the receiver’s measurements and have a continuous sequence of range values, which, when corrected for satellite and receiver clock errors and other effects, would allow the receiver’s position to be accurately determined. But because we don’t know the true initial cycle count, the carrier-phase measurements are ambiguous by a constant integer amount (when measured in cycles). This characteristic of the observable is referred to as the integer ambiguity.
It was realized early in the development of GPS, that if the integer ambiguity of carrier-phase measurements could be resolved, we would have a very precise observable for positioning, navigation and timing, some two orders of magnitude more precise than the code-based pseudorange. Instead of measurement precisions of tens of centimeters, we could have precisions of tenths of millimeters.
In the early 1980s using the few test GPS satellites in orbit at the time, surveyors and geodesists developed a series of clever techniques that allowed them to make use of carrier-phase measurements to determine the baseline between pairs of receivers by estimating combinations of the ambiguities as unknowns along with the receiver relative coordinates or, for short baseline work, use a calibration procedure before starting a survey.
Now jump forward a few decades. While it is still common practice to double difference carrier-phase measurements between pairs of satellites and pairs of receivers to determine relative receiver coordinates, the technique of precise point positioning or PPP, which uses carrier-phase (and pseudorange) measurements from a single user receiver, is growing in popularity. But, the integer ambiguity problem is still with us and has to be addressed by the analysis software. The ambiguities are often estimated as real- rather than integer-valued quantities, in part because of the contribution of satellite hardware biases to the carrier-phase measurements.
However, it is possible to resolve the ambiguities to integer values by using PPP ambiguity resolution products distributed by several research organizations. In this month’s column, we take a look at the interoperability of these products for increasing the reliability and precision of position solutions and reducing the time required for a solution to converge to a required level of accuracy.
Ambiguity resolution in precise point positioning (hereafter, PPP-AR) requires that hardware delays within the GPS measurements be mitigated, which will then allow for resolution of the integer ambiguities within the carrier-phase measurements. Resolution of these ambiguities converts the carrier-phases into precise “range” measurements, with measurement noise at the centimeter-to-millimeter level compared to the meter-to-decimeter level of the C/A- and P(Y)-code pseudoranges. If the ambiguities could be isolated and estimated as integers, then that information could be exploited to accelerate PPP convergence to provide, for example, few-centimeter horizontal positioning accuracy within tens of minutes or even minutes from a cold start.
Integer ambiguity resolution of measurements from a single receiver can be implemented by applying additional satellite products, where the fractional component — representing the satellite hardware delay — has been separated from the integer ambiguities in a network solution. One method of deriving such products is to estimate the satellite hardware delay by averaging the fractional parts of steady-state real-valued or floating-point (float) ambiguity estimates, and the other is to estimate the receiver clock offset in the pseudorange and carrier-phase measurements independently by fixing the undifferenced ambiguities to integers in advance.
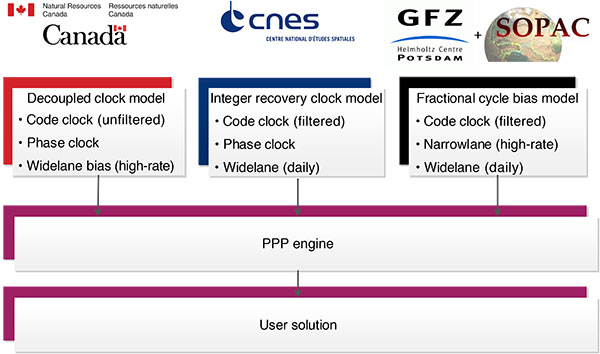
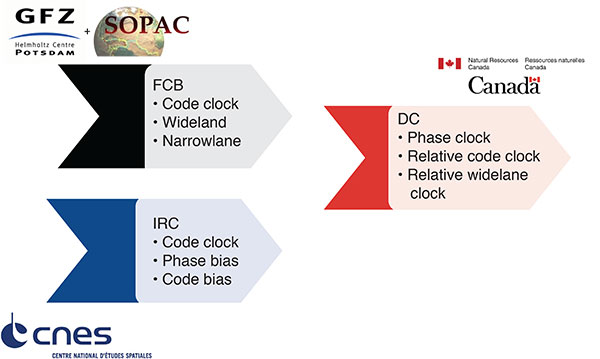
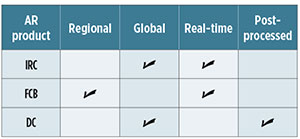
Similar positioning performances have been demonstrated among three approaches of different groups or agencies using the two methods: FCB (Fractional Cycle Bias), IRC (Integer Recovery Clock) and DC (Decoupled Clock). For the PPP user, the mathematical model is similar. The different PPP-AR products contain the same information and, as a result, should allow for one-to-one transformations, allowing interoperability of the PPP-AR products. The advantage of interoperability of the various products is to allow the PPP user to transform independently generated products to obtain multiple fixed solutions of comparable precision and accuracy, with no changes to the core PPP user software. An overview of the different providers and their products is presented in FIGURE 1.
FIGURE 1. Public providers of PPP-AR products. (Source: Richard Langley)
The ability to use different products would increase the reliability of a positioning solution in real-time processing, for example. If there was an outage in the generation of a particular PPP-AR product, a user could instantly switch streams to a different provider. The research presented in this article examines the PPP-AR products generated from the FCB and IRC models that have been transformed into the DC format and applied within a PPP user solution. The novelty of the research is the solution analysis using the transformed product. We examine the convergence time (time-to-first-fix and time to a pre-defined performance level), position precision (repeatability), position accuracy and solution outliers. The temporal and spatial behavior of these estimated terms is examined for the different products applied to understand the unmodeled effects responsible for incorrect solution fixes.
The Role of PPP-AR Products
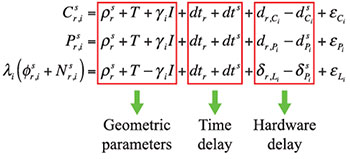
The standard GPS pseudorange ( and ) and carrier-phase () observation equations are given by
(1)
where i denotes the frequency-dependent GPS measurements for frequencies L1 or L2, s represents the tracked satellite, r represents the receiver, is the geometric range between the satellite s and the user position, T is the tropospheric delay, is the first order slant ionospheric delay, γi is the frequency dependent coefficient, dts is the satellite clock and is the pseudorange hardware delay. is the ambiguity term and is the carrier-phase hardware delay, both of which are expressed in cycles and scaled by the wavelength λi . The error sources can be grouped into two main components, the geometric parameters and the timing parameters. Included in the timing parameters are the clock offsets and the hardware delay terms. Understanding the role of the hardware delays is critical in isolating the integer ambiguities.
The following equations illustrate the effects of not mitigating the hardware delay. The set of equations was simplified by combining the clock and hardware delay parameters. Processing the carrier-phase measurements with the pseudoranges (code measurements) ensures that the pseudoranges provide a reference for the carrier-phase measurements and for the clock parameters. An implication of this is the manifestation of the hardware delay present in both the estimated clock parameters and the ambiguities.
(2)
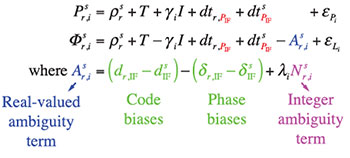
By not mitigating the hardware delay terms ( and), they are absorbed within the estimated ambiguity terms, rendering the integer nature of the ambiguity term inaccessible. The user observation equations do not contain sufficient information to solve for an integer-ambiguity-resolved user position. Ambiguity resolution would only become possible if information about the satellite hardware delays were provided to the user. The receiver hardware delay can be removed by single differencing (between satellites).
In the following section, we present an overview of the different public providers of products that enable PPP-AR, their products and how they are applied to the PPP user equations.
Public PPP-AR Products
Currently, there are three main public providers of products that enable PPP-AR. These are Scripps Institution of Oceanography, which provides regional real-time FCB products; Natural Resources Canada (NRCan), which provides post-processed and real-time DC products; and Centre National d’Etudes Spatiales (CNES), which provides post-processed and real-time IRC products.
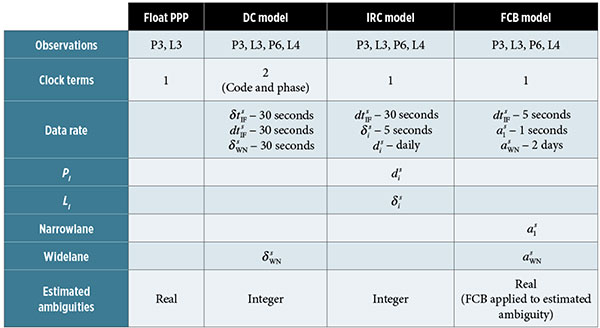
FCB Model. The initial application of ambiguity resolution to PPP was the Uncalibrated Phase Delay (UPD) model, now called the Fractional Cycle Bias (FCB) model. The FCB method estimates the hardware delay by averaging the fractional parts of the steady-state float ambiguity estimates to be removed from common satellite clock estimates. The FCB products consist of , and , where WN indicates the Melbourne-Wübbena (widelane ambiguity) combination and IF indicates the ionosphere-free linear combination.
DC Model. The underlying concept of the decoupled clock model is that the carrier-phase and pseudorange (code) measurements are not synchronized with each other at an equivalent level of precision. The timing of the different observables must be considered separately if they are to be processed together rigorously. The decoupled clock model is a reformulation of the ionosphere-free carrier-phase and pseudorange observation equations. When combined with the narrowlane pseudorange and the widelane phase, ambiguity resolution is possible. The DC products transmitted to the user are , and .
IRC Model. The integer recovery clocks estimate constant daily widelane pseudorange/carrier-phase hardware delays by averaging arc-dependent estimates. Using float-solution estimates of the range parameters, narrowlane ambiguity resolution is performed and the ionosphere-free satellite carrier-phase clocks are estimated. In 2014, the format of the IRC products was changed from , and to a state-space uncombined representation, such that the satellite hardware delay is provided for each observable (, ) and satellite pseudorange clock ().
Summary. The three publicly provided products to enable real-time PPP-AR are listed in TABLE 1 along with their primary characteristics. The table summarizes the various measurements used, different products transmitted and the varying data rate of the transmitted products.
TABLE 1. Comparison of different publicly provided real-time products to enable PPP-AR.
Product Transformation
While the different strategies (FCB, FC, IRC) make different assumptions, there are fundamental similarities among them. The mathematical models for the PPP user are similar, as the different products contain the same information and as a result would allow for a one-to-one transformation. The following sections examine the transformation matrix used to transform the IRC and FCB products to the DC format (see Figure 2.)
FIGURE 2. Transformation of FCB and IRC products to DC input format.
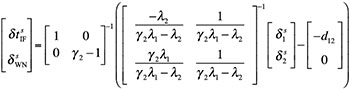
FCB. The FCB products consist of , and , which are estimated in the network solution using International GNSS Service (IGS) ultra-rapid orbit and clock products. The fundamental difference between the FCB and DC products is that is not determined in the DC method, but assimilated within the clock estimates. Also, is assumed constant over a 48-hour time period, whereas in the DC method the is neither constrained nor smoothed. Here is the transformation matrix used to transform from FCB to the DC model:
(3)
where z1 is the single-differenced L1 ambiguity and zw is the single-differenced widelane ambiguity.
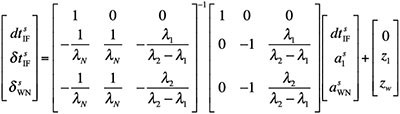
IRC. The original IRC products used a decoupled-like approach, where independent clocks ( and ) were transmitted for the pseudorange and carrier-phase measurements and widelane satellite hardware delays () were estimated. A redefined model was presented in 2014, where a state-space approach was adopted such that one phase bias per phase observable ( and ) was identified and broadcast. The primary benefit of such an approach is interoperability, allowing the network and user side to implement different ambiguity resolution methods. Here is the transformation matrix used to transform from IRC to the DC model: (4)
where d12 represents .
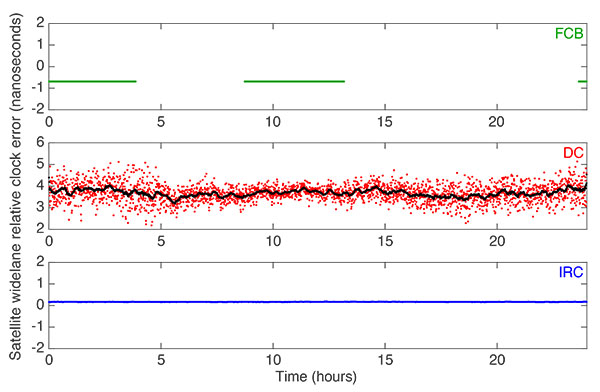
Analysis of Transformed Products. In FIGURES 3 to 5, we present the FCB and IRC products transformed to the DC format. The presented format was selected because it represents the nature of the transmitted real-time DC products. The philosophy of the DC model refers to the satellite hardware delay as an unmodeled timing error and, as such, the satellite carrier-phase clocks in Figure 3 are in units of seconds and in Figures 4 and 5 are in units of nanoseconds. Nanoseconds were selected because of the magnitude of the relative satellite pseudorange and widelane clock error, as well as being more bandwidth efficient.
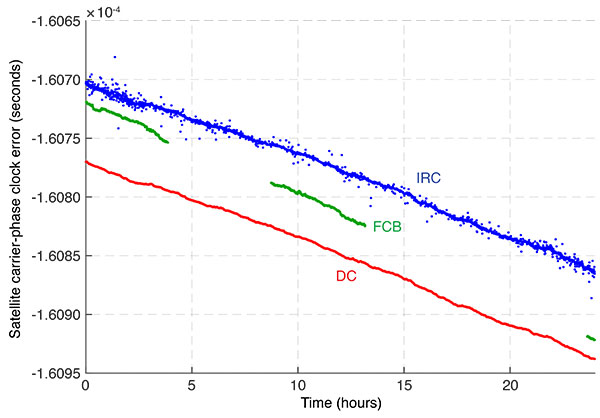
FIGURE 3. Transformed FCB and IRC satellite carrier-phase clock correction on day-of-year 28 of 2015 for PRN 10. DC was included for comparison.
Figure 3 illustrates the FCB and IRC products transformed to the DC satellite carrier-phase clock. The satellite-clock corrections presented were not differenced with respect to a reference satellite, to illustrate their differences in an absolute nature. If the clocks are differenced, in a relative nature, they are equivalent. The data gaps in the FCB products are expected because of the regional nature of the products. Unlike the DC and IRC products, the FCB pseudorange clocks illustrate different trends such as those between hours 3 and 4. The noise illustrated in the IRC clock can be removed either by filtering or by differencing with respect to another satellite clock.
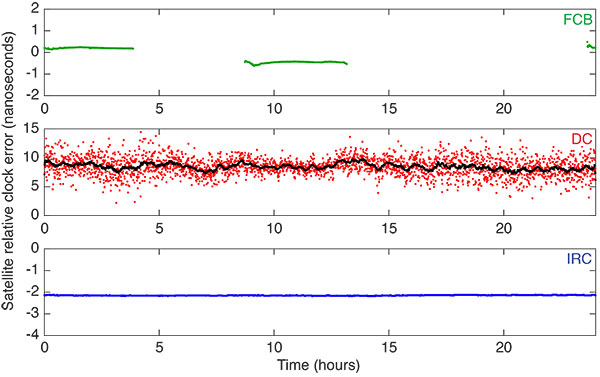
In Figure 4, we present the relative satellite clock error ( − ) for the transformed FCB (upper subplot) and IRC (lower subplot) products. For the original DC product (middle subplot), a simple moving average filter was applied with a bin size of five minutes to reduce the noise and illustrate the underlying equipment delay. The relative satellite clock error represents the difference between the pseudorange and carrier-phase clocks. The distinct differences of the products are easily visible, such as the filtering present within FCB and IRC products in contrast to the DC. The underlying relative satellite clock error is also significantly different in contrast to the DC product, such that FCB and IRC have an average relative satellite clock error of -0.041 ± 0.101 nanoseconds and -0.645 ± 0.005 nanoseconds, respectively, whereas the DC has an average of 8.465 ± 1.546 nanoseconds.
FIGURE 4. Transformed FCB and IRC products to code-phase relative clock correction on day-of-year 28 of 2015 for PRN 10. DC was included for comparison. Linear trend has been removed.
Figure 5 shows the relative satellite widelane clock error for the transformed FCB (upper subplot) and IRC (lower subplot) products. For the original DC product (middle subplot), a simple moving average filter was applied with a bin size of five minutes, to reduce the noise and illustrate the underlying equipment delay. The relative satellite clock error represents the difference between the widelane clocks and phase clocks. Similar to the relative satellite clock error, the differences in the transformed relative satellite widelane clock error are noticeable. As expected, the transformed FCB has a constant widelane estimate of -0.24 nanoseconds, whereas the transformed IRC and DC have an average widelane estimate of 0.0589 ± 0.002 and 3.6704 ± 0.34 nanoseconds, respectively.
FIGURE 5. Transformed FCB and IRC products to code-phase relative widelane clock correction on day-of-year 28 of 2015 for PRN 10. DC was included for comparison. Linear trend has been removed.
Performance of Transformed Products
One of the metrics we can use to examine the performance of the transformed products is the quality of the solution in the position domain. The solutions were examined with respect to the time for convergence to a pre-defined threshold and position stability. We used five stations from the Scripps Orbit and Permanent Array Center (SOPAC) network for days 23 to 30 of 2015. These five stations were selected because of the regional nature of FCB products provided by SOPAC. We show the results for site Brand Basin (BRAN) on day-of-year 30 of 2015 as it reflects the performance of the whole dataset processed.
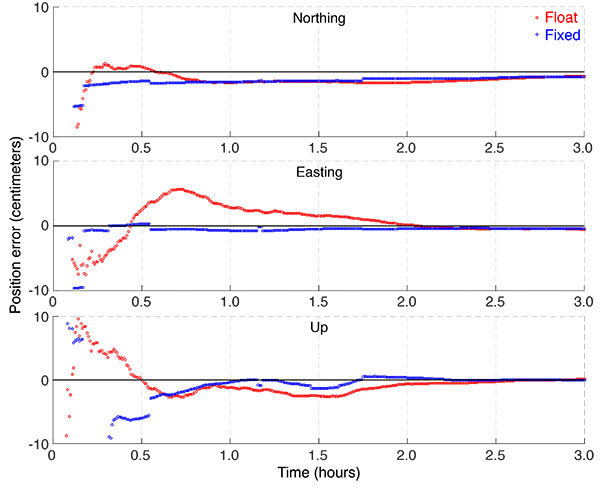
In FIGURES 6 to 8, we show the varying convergence periods at the site BRAN on day-of-year 30 for the “float” and “fixed” solutions using the different PPP-AR products, where fixed means the ambiguity-resolved solution and float the unresolved solution. Figure 6 uses the decoupled clock products, and the fixed solution performs as expected. After a few minutes, the solution attains the correct ambiguity candidate, and a fixed state is maintained.
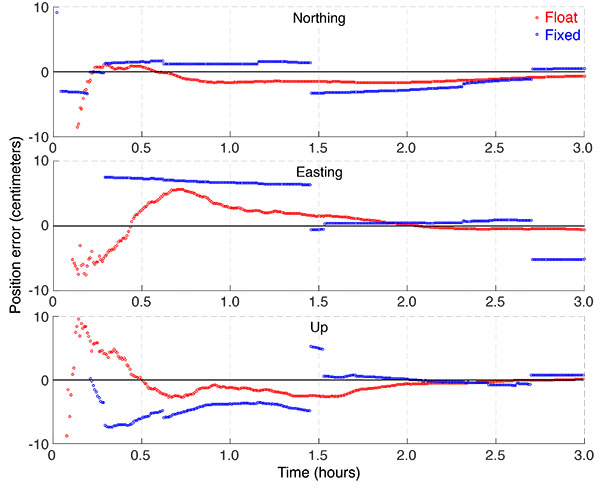
FIGURE 6. Position errors for site BRAN located in Burbank, Calif., on day-of-year 30 of 2015 illustrating the difference between the float and fixed solutions using the DC products.FIGURE 7. Position errors for site BRAN located in Burbank, Calif., for day-of-year 30 of 2015 illustrating the difference between the float and fixed solutions using the IRC products.FIGURE 8. Position errors for site BRAN located in Burbank, Calif., for day-of-year 30 of 2015 illustrating the difference between the float and fixed solutions using the FCB products.
The performance of the fixed solution using the IRC products is depicted in Figure 7. Initial convergence is similar to the DC products in the northing and easting components where a fixed state is attained after a few epochs. In the up component, the solution quality deteriorates after 30 minutes. What is also easily visible is the solution sensitivity to changes in the satellite geometry. As the number of satellites changes, the fixed ambiguities change, causing datum shifts in the user solution.
Similar trends were also observed when the transformed FCB products were used, with the results presented in Figure 8. The solution deterioration is most evident in the easting component, as the incorrect integer candidate is selected.
Challenges of Interoperability
Interoperability of the various PPP-AR products is a challenging task because of the different qualities of the publicly available products, limited literature documenting the conventions adopted within the network solution of the providers, and unclear definitions of the corrections.
In TABLE 2, we summarize the various qualities of the products we used in the study, showing why it was challenging to perform a consistent comparison. IRC products were generated from a network of reference stations globally distributed and in real time. Similar to the IRC products, the DC products were generated from a global network of solutions, but post-processed, and the FCB products were based on a regional network of reference stations, but were available in real time. Post-processed orbits and clocks have an accuracy of ~2.5 centimeters and ~75 picoseconds, respectively, whereas the predicted half of ultra-rapid orbits and clocks have an accuracy of ~5 centimeters and ~3 nanoseconds, respectively. While it is evident in the existing literature that PPP-AR is possible in real time, the solution is rather sensitive to changes experienced by the PPP user solution, such as varying local conditions and satellite geometry. The sensitivity is illustrated in Figures 7 and 8 with solution jumps typically occurring when there is a change in the number of satellites.
TABLE 2. Summary of the different quality of products provided by public providers to enable PPP-AR.
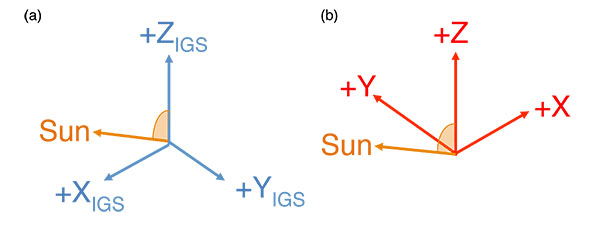
The general assumption when PPP-AR products are estimated within a network is that the PPP user would follow similar conventions when using the products. Consequences of different conventions adopted may result in incorrect ambiguities being resolved. For example, if inconsistent satellite antenna conventions were adopted between the network and user, then when phase wind-up corrections are applied, fractional cycles would be introduced. The introduced fractional cycles would result in incorrect ambiguities being resolved. FIGURE 9 shows the orientation of the spacecraft body frame for GPS Block IIR/IIR-M satellites adopted in the IGS axis convention (subplot (a)) and those provided in the manufacturer specifications (subplot (b)). The difference between the manufacturer specifications and IGS axis convention is the orientation of the x- and y-axes.
FIGURE 9. Orientation of the spacecraft body frame for GPS Block IIR/IIR-M satellites as (a) adopted within the International GNSS Service axis convention, and (b) those provided in the manufacturer specifications.
Conclusions
The mathematical model for the PPP user is similar for all PPP-AR products, as the different products contain the same information and, as a result, would allow for one-to-one transformations, allowing interoperability of the PPP-AR products. Interoperability of the various PPP-AR products would allow the PPP user to transform independently generated PPP-AR products to obtain multiple fixed solutions of comparable precision and accuracy. The ability to provide multiple solutions would increase the reliability of the solution such as in real-time processing: if there was an outage in the generation of the PPP-AR products, the user can instantly switch streams to a different provider.
We looked at the PPP-AR products provided by three organizations and examined position solutions for a set of stations in the SOPAC network with respect to convergence time to the pre-defined threshold and position stability.
Using the decoupled clock products, we found that the fixed solutions performed as expected. After a few minutes, a solution attains the correct ambiguity candidate and a fixed state is maintained. Unlike the fixed solutions using the decoupled clock products, instantaneous convergence was not attained in the horizontal and vertical components when the transformed IRC and FCB products were used. The ambiguity-resolved solutions were sensitive to changes in the satellite geometry. As the number of satellites change, the fixed ambiguities change, causing datum shifts in the user solution.
The unstable solutions from both transformed products are attributed to the magnitude of the relative satellite code and widelane clock errors. Additional refinement of the transformation model is required as the satellite hardware delay has not been completely mitigated. Mismodeling of the hardware delay was absorbed by the ambiguity terms, causing incorrect fixed solutions.
Future Research
Future prospective research includes refinement of the proposed transformation models to include the mismodeled effects, thus providing the user with a more reliable solution. The functional model needs to be further examined to ensure that the corrections were applied consistently. Further analysis of the instability of the user solution is required, as solution jumps typically occur when there are changes in the number of satellites tracked. Also to be analyzed are the post-fit residuals, to examine the effects of mismodeling. The temporal and spatial behavior of the estimated terms will be examined for the different products used to understand the unmodeled effects that introduce incorrect solution fixes. We would also consider increasing the number of reference stations to further test the reliability of the transformed products under varying user conditions.
Acknowledgments
We acknowledge Paul Collins, Jianghui Geng and Denis Laurichesse for our valuable discussions and their suggestions. The research was funded by the Natural Sciences and Engineering Research Council of Canada. The results we have presented were derived from data and products provided by Natural Resources Canada, Scripps Institution of Oceanography, Centre National d’Etudes Spatiales and the International GNSS Service.
This article is based on the paper “Examining the Interoperability of PPP-AR Products” presented at ION GNSS+ 2015, the 28th International Technical Meeting of The Satellite Division of the Institute of Navigation held in Tampa, Fla., Sept. 14–18, 2015.
GARRETT SEEPERSAD is a Ph.D. candidate at York University, Toronto, Canada, in the Department of Earth and Space Science and Engineering. He completed his B.Sc. in geomatics at the University of the West Indies and his M.Sc. in geomatics engineering at York University. His area of research currently focuses on the development and testing of PPP functional, stochastic and error-mitigation models.
SUNIL BISNATH is an associate professor in the Department of Earth and Space Science and Engineering at York University. His research interests include geodesy and precise GNSS positioning and navigation.
Further Reading
• PPP Ambiguity Resolution Techniques
“Review and Principles of PPP-RTK Methods” by P.J.G. Teunissen and A. Khodabandeh in Journal of Geodesy, Vol. 89, No. 3, 2014, pp. 217–240, doi: 10.1007/s00190-014-0771-3.
“A Novel Un-differenced PPP-RTK Concept” by B. Zhang, P.J.G. Teunissen and D. Odijk in Journal of Navigation, Vol. 64, Supplement S1, 2011, pp. S180–S191, doi: 10.1017/S0373463311000361.
“Isolating and Estimating Undifferenced GPS Integer Ambiguities” by P. Collins in Proceedings of the 2008 National Technical Meeting of The Institute of Navigation, San Diego, Calif., January 28–30, 2008, pp. 720–732.
“Resolution of GPS Carrier-Phase Ambiguities in Precise Point Positioning (PPP) with Daily Observations” by M. Ge, G. Gendt, M. Rothacher, C. Shi and J. Liu in Journal of Geodesy, Vol. 82, No. 7, 2008, pp. 389–399, doi: 10.1007/s00190-007-0187-4.
“Integer Ambiguity Resolution on Undifferenced GPS Phase Measurements and Its Application to PPP” by D. Laurichesse and F. Mercier in Proceedings of ION GNSS 2007, the 20th International Technical Meeting of the Satellite Division of The Institute of Navigation, Fort Worth, Texas, Sept. 25–28, 2007, pp. 839–848.
Improved Convergence for GNSS Precise Point Positioning by S. Banville, Ph.D. dissertation, Department of Geodesy and Geomatics Engineering, Technical Report No. 294, University of New Brunswick, Fredericton, New Brunswick, Canada. Recipient of The Institute of Navigation 2014 Bradford W. Parkinson Award.