Tag: Eric Gakstatter

  • NGS Beta OPUS released, accepting RTK and post-processed data

    NGS Beta OPUS released, accepting RTK and post-processed data

    On Sept. 16, the National Geodetic Survey (NGS) released the latest beta version of OPUS, called Beta OPUS Projects 5.0.  This version of OPUS now accepts real-time kinematic data and post-processed GNSS vectors from vendor software. See the box titled “Beta OPUS Projects 5.0 Webpage” on the website.

    As stated in the announcement, NGS has developed a file format for submitted real-time kinematic (RTK) data and post-processed GNSS vectors from vendor software to NGS. It is denoted as GNSS Vector Exchange Format (GVX).  This format enables NGS to incorporate the data into its GNSS processing routines.

    This is similar to the original Receiver Independent Exchange Format (RINEX) developed for making post-processing more efficient when combining GNSS data from manufacturers outputting raw GPS data in varying file formats. In my opinion, this is a significant improvement to NGS’s OPUS web utility.

    Beta OPUS Projects 5.0 Webpage

    Image: NGS website
    Image: NGS website

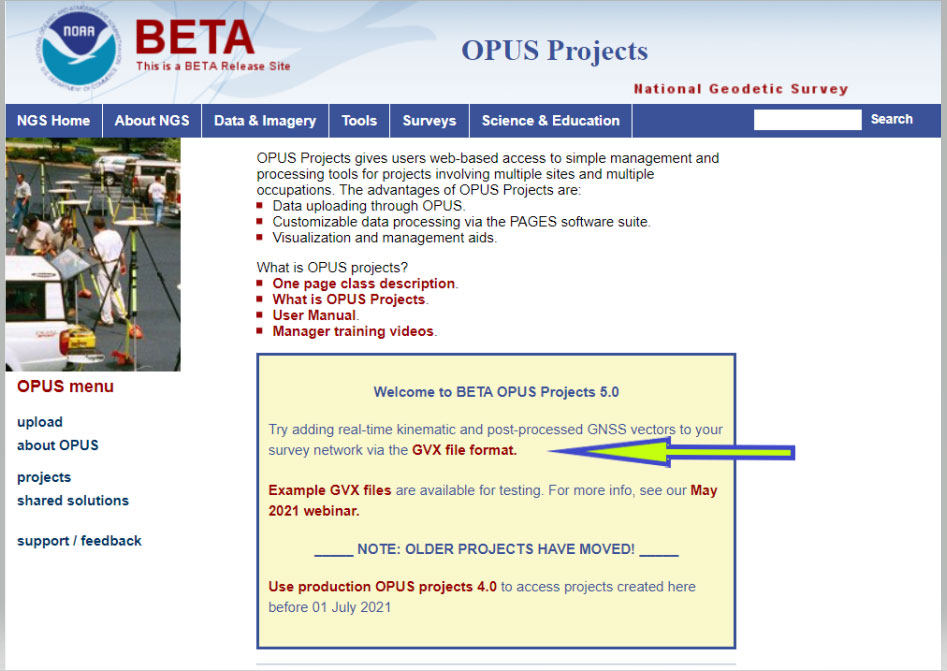
    Users can obtain background information about the GVX file format by clicking the link GVX file format. More detailed information about the GVX format can be obtained by clicking on the Documentation link.

    GNSS Vector Exchange File Format Webpage

    Image: NGS website
    Image: NGS website

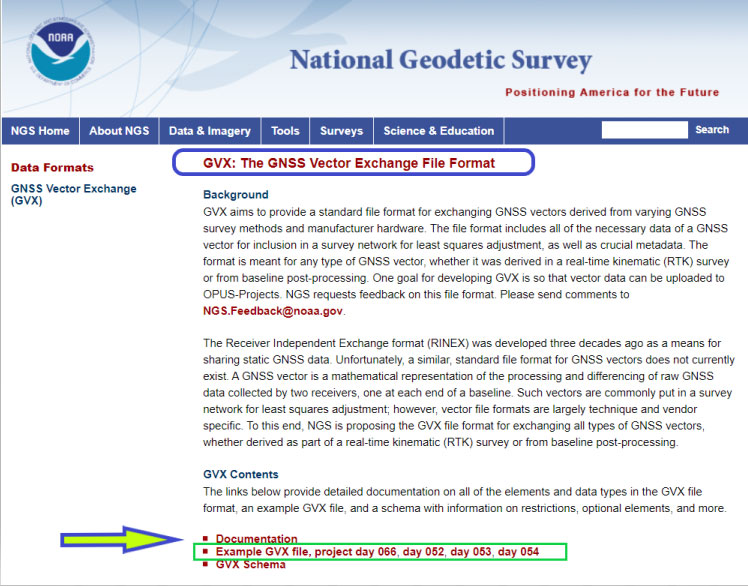
    Basically, GVX is a standardized format for exchanging GNSS vectors derived from GNSS survey data using any manufacturer hardware and software results (see the box titled “Excerpt from Documentation of GVX”).  NGS designed the format so that it included all of the necessary data (including metadata) of a GNSS vector for incorporation into a survey network for performing a least-squares adjustment.

    Excerpt from Documentation of GVX

    (Link to PDF of GVX Documentation)

    To this end, this document proposes a new standardized file format known as the GNSS Vector Exchange Format (GVX). GVX aims to provide a standard format for exchanging GNSS vectors derived from varying GNSS survey methods and manufacturer hardware. The file format includes all of the necessary data of a GNSS vector for inclusion in a survey network for least squares adjustment, as well as metadata which describes the vector. The format is meant for any type of GNSS vector, whether it was derived in real-time or from baseline post-processing. GVX has been written in extensible markup language (XML). XML was chosen because it was designed to carry and store data in plain text format, it is easy to expand and/or upgrade to new operating systems, and it can be read by both humans and machines.

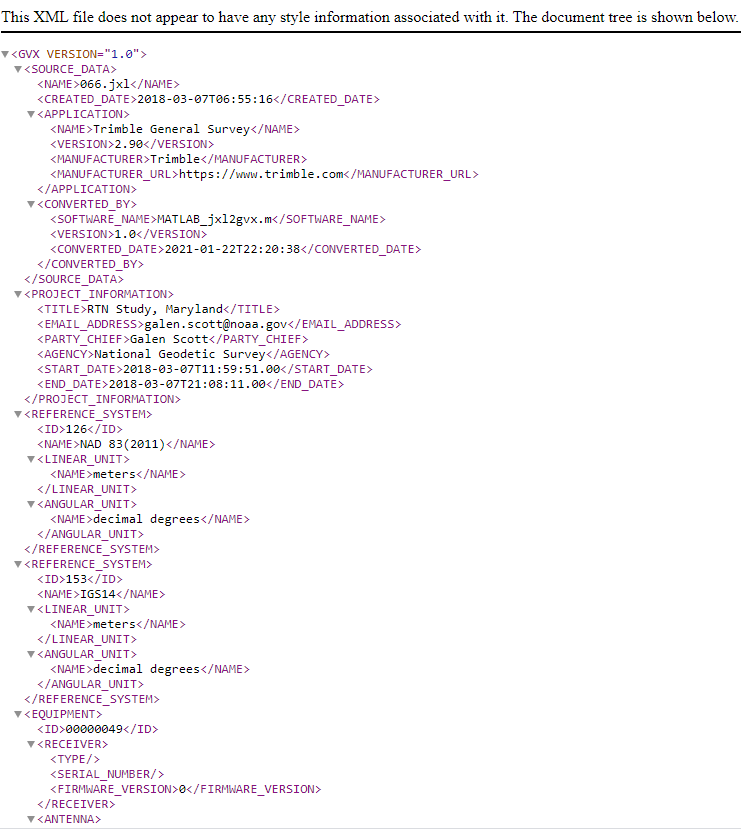
    A sample GVX file can be obtained by clicking on the link titled “Example of GVX file, project day 066, day 052, day 053, day 054.” As NGS states in the documentation, the output can be read both by humans and machines. What’s important is that it can be read by machines so the information can be incorporated into software programs. GNSS vendors have all the information they need to generate the output file to enable users to import the data into OPUS Project 5.0. Users will have to contact their software providers to determine whether their software routines generate the GVX output files.

    Example of GVX file, project day 066

    Image: NGS website
    Image: NGS website

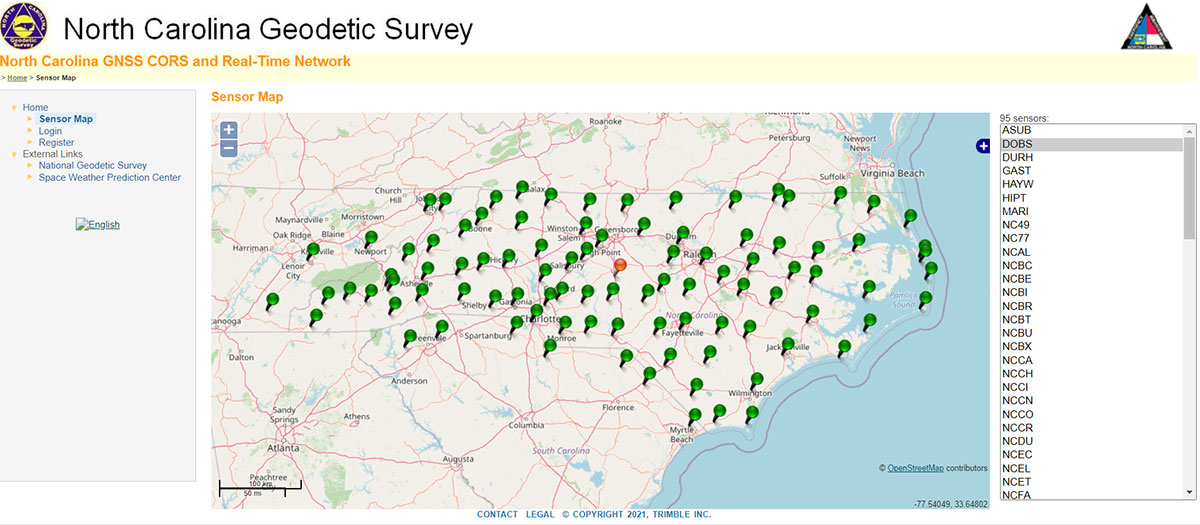
    As I previously mentioned, this new option in OPUS Projects 5.0 is a significant improvement because many surveyors use RTK networks to obtain coordinates of marks. It will also facilitate the occupation of benchmarks with GNSS equipment to support the NGS 2022 Transformation tool. North Carolina, my home state, has a real-time network (RTN) that includes 96 GNSS CORS. (See the box titled “NC GNSS CORS and Real-Time Network.”) Currently, the North Carolina GNSS CORS and RTN has 4584 RTN service subscriptions.

    NC GNSS CORS and Real-Time Network

    Image: North Carolina Geodetic Survey Website
    Image: North Carolina Geodetic Survey Website

    I could not find a current list of public RTK networks in the United States, but I did locate a Jan. 7, 2014, GPS World article by Eric Gakstatter that provided a list of public RTK base stations in the country. It’s not up-to-date, but it highlights that, more than seven years ago, more than half of the U.S. states  had some kind of public RTK network. I would like to update the table, so I’d appreciate receiving information on the status of any public RTK network. Please feel free to send me an email at [email protected].

    List of Public RTK Base Stations in 2014

    Based on GPS World 2014 Article by Eric Gakstatter

    Note: States not listed did not have a public RTK network.

    State

    Status of Public Network

    Alabama Alabama Department of Transportation. Leica network.
    Alaska Two PBO RTK bases. One in Fairbanks and one in Palmer. Otherwise, no public service.
    Arizona Arizona State Cartographer’s Office. Leica network. Plate Boundary Observatory (single baseline).
    California California Real Time Network (CRTN) (single baseline).  Plate Boundary Observatory. Single baseline.
    Colorado Mesa County (Trimble network) and Plate Boundary Observatory (single baseline).
    Florida Florida Department of Transportation. Leica network.
    Idaho Plate Boundary Observatory (single baseline).
    Indiana Indiana Department of Transportation. Leica network.
    Iowa Iowa Department of Transportation. Leica network.
    Kentucky Kentucky Transportation Cabinet. Trimble network.
    Louisiana Louisiana State University. Trimble network.
    Maine Maine Department of Transportation. Trimble network.
    Massachusetts Massachusetts Department of Transportation. Leica network.
    Michigan Michigan Department of Transportation. Leica network.
    Minnesota Department of Transportation. Trimble network.
    Mississippi University of Southern Mississippi. Trimble network.
    Missouri Missouri Department of Transportation. Trimble network.
    Montana Plate Boundary Observatory (single baseline).
    Nevada Washoe County. Trimble network. Las Vegas Valley Water District. Leica network. Plate Boundary Observatory (single baseline).
    New Mexico Plate Boundary Observatory (single baseline).
    New York New York Department of Transportation. Leica network.
    North Carolina N.C. Department of Environment and Natural Resources. Trimble network. $500 one-time sign-up fee.
    Ohio Ohio Department of Transportation. Trimble network.
    Oregon Oregon Department of Transportation. Leica network. Plate Boundary Observatory (single baseline).
    South Carolina South Carolina Geodetic Survey. Public but charges a usage fee. Trimble network.
    Tennessee Tennessee Department of Transportation. Public but charges a usage fee. Topcon network.
    Texas Texas Department of Transportation. Public but only available to TxDOT employees and TxDOT contractors. Trimble network.
    Utah Utah Automated Geographic Reference Center.  Public but charges a usage fee. Trimble network. Plate Boundary Observatory (single baseline).
    Vermont Vermont Geodetic Survey. Trimble network.
    Washington Washington State Reference Network (Seattle Public Utilities). Trimble network. Public but charges a usage fee. Pierce County (Leica Network). Plate Boundary Observatory (single baseline).
    West Virginia West Virginia Department of Transportation. Trimble network.
    Wisconsin Wisconsin Department of Transportation. Trimble network.
    Wyoming Plate Boundary Observatory (single baseline).

    Why do I believe that this new option in OPUS Projects 5.0 is so important? Because it facilitates the incorporation of accurate GNSS-derived ellipsoid and orthometric heights into the National Spatial Reference System (NSRS).  With the development of improved algorithms, the results of coordinates computed using GNSS CORS/RTNs are more accurate today than ever before. During the last decade, there have been many studies analyzing GNSS data to estimate the accuracy values of coordinates from RTN data.

    A study titled “Accuracy of GNSS Observations from Three Real-Time Networks in Maryland, USA” by Daniel Gillins, Jacob Heck, Galen Scott, Kevin Jordan and Ryan Hippenstiel presented at FIG Working Week 2019 in Hanoi, Vietnam, April 22–26, 2019, provided a comparative evaluation on the accuracy of three independent RTNs constructed with differing hardware and software. Their study was based on 486, 5-minute duration GPS + GLONASS network RTK (NRTK) observations. The results indicated that repeat NRTK vectors could be combined to meet 1 cm horizontally and 2 cm vertically (ellipsoid height) accuracies at 95%. confidence.  See the box below.  It should be noted that the repeat observations should be observed at different times of the day (for instance, separated by > 2–3 hours), as well as, in my opinion, if possible at least more than two different days.

    Conclusions from Daniel Gillins, et al. 2019 FIG Paper

    A total of 486, 5-min duration, GPS+GLONASS NRTK observations were collected on nine bench marks distributed over a 4,000 square km area with rovers connected to three different RTNs in Maryland. Each RTN was developed with equipment and software from a different manufacturer, yet all three RTNs performed similarly in terms of accuracy. When differenced with coordinates from a static GNSS survey campaign, the horizontal and vertical RMSE of the NRTK-derived coordinates was 2.3 cm horizontally and 4.5 cm vertically at 95% confidence. Repetitive NRTK vectors on each baseline differed between ± 2.4 cm horizontally and ± 3.4 cm vertically at 95% confidence. As a final accuracy evaluation, hybrid survey networks consisting of repeat NRTK vectors and baseline solutions from post-processing static GPS data collected at RTN base stations and CORSs were adjusted by least squares. Prior to adjustment, the VCV matrices of the vectors were scaled by variance-component estimation. Adjustment of hybrid survey networks with four repeat NRTK vectors per bench mark produced network accuracies at 95% confidence for the adjusted coordinates at all bench marks less than 1 cm horizontally and 2 cm vertically (ellipsoid height). In addition to the benefits of using efficient and accurate NRTK vectors, the hybrid survey network approach makes use of redundant vectors for checking data and avoiding blunders. The approach also provides traceability because the NRTK vectors are tied to an RTN base station which is tied to CORS. Finally, these networks ensure the survey is referenced to the published coordinates of the CORSs which are held as constraints in the adjustment.

    Lastly, I would like to remind users that only three months remain until the December 31, 2021, cutoff to submit GPS on Benchmarks data that NGS can guarantee will be analyzed to compute the initial set of 2020.0 Reference Epoch Coordinates (RECs) that will be released with the Modernized NSRS. This initial set of RECs is currently the only set that NGS can guarantee will be used to build the 2022 Transformation Tool.  Once the transformation model is finalized, the NAVD 88 – NAPGD 2022 transformation values will be locked in and will not be updated as additional sets of RECs are computed.  If you have questions or concerns about this cut-off date, please contact your NGS Regional Geodetic Advisor, or drop NGS a line at [email protected].

    Beta OPUS Project 5.0 is a web-based tool that makes it easier to submit data to NGS.  I would encourage NSRS users to occupy as many benchmarks with GNSS equipment and submit the data to NGS before the Dec. 31 deadline.  Not only will these data help in improving the transformation model, but the marks will be included in the first computation of Reference Epoch Coordinates (RECs).  You can obtain information about Reference Epoch Coordinates in NGS’s NOAA Technical Report NOS NGS 67 publication titled “Blueprint for the Modernized NSRS, Part 3: Working in the Modernized NSRS.” A future column will address the different types of coordinates that will be distributed by NGS with the modernized NSRS.

  • The Great American Solar Eclipse of 2017 — GIS-style

    The media is buzzing about the Great American Solar Eclipse that takes place Monday, Aug. 21. 

    It’s a historic event that last occurred 99 years ago. To be clear, 99 years ago is when the last total solar eclipse traversed the entire continental United States (lower 48 states).

    To put that timeline in perspective, only one of the following inventions existed 99 years ago: FM radio, electric hair dryer, electric washing machine, frozen food, folding wheelchair and “talky” movies. Read further for the answer.

    The last total eclipse that traversed part of the United States was 38 years ago, but in 1979 the total eclipse was only visible in five U.S. states (Washington, Oregon, Idaho, Montana, North Dakota). Have a look at the following map of the 1979 total eclipse path through the United States.

    Figure 1- 1979 total eclipse path through the US. Source: NASA
    Figure 1- 1979 total eclipse path through the US. Source: NASA

    It’s painful to think that in February 1979, when this eclipse occurred, I was a junior in high school in Oregon, living right in the path of the umbra (the moon’s shadow). I don’t recall the 1979 solar eclipse, but that doesn’t surprise me given the mind of a 16-year-old, at least mine.

    Or, it could be the fact that was about 8:15 a.m. in February. Februaries in Oregon can be depressing due to the lack of sunlight. Anyway, it’s painful because today there are 37-year-old adults who were born after I graduated from high school. Time has flown by.

    One of the points I was going to make in this article is how much GIS technology has improved since the last total solar eclipse in 1979, but that was 38 years ago. Given Moore’s Law, it should have improved exponentially in the past 38 years, and it has.

    One way the evolution of GIS is displayed are the maps of the Great American Solar Eclipse of 2017. Let’s start with this basic one illustrating the path of the moon’s shadow as it traverses the United States:

    Figure 2 - Solar Eclipse 2017 path. Source: eclipse2017.org
    Figure 2 – Solar Eclipse 2017 path. Source: eclipse2017.org

    My office is in Lake Oswego, and my house is just east of Lake Oswego, as illustrated here:

    Figure 3- Solar Eclipse 2017 Oregon path. Source: eclipse2017.org
    Figure 3- Solar Eclipse 2017 Oregon path. Source: eclipse2017.org

    As you can see in the above map, my house and office are really close to the 100 percent eclipse path. In fact, using the following interactive map, I determined that from my house the sun will be 99.77 percent eclipsed.

    Figure 4- Interactive 2017 Eclipse Map (click to explore the map). Source: NASA
    Figure 4- Interactive 2017 Eclipse Map. Source: NASA

    Now, for some cool animations. Back in 1979 (even 2000), animations were tough to produce. With today’s computing power and software, it’s quite straight-forward and quick to produce high-quality animations. The following is a screenshot from a 48-second animation from NASA’s YouTube channel showing the path of the total eclipse.

    Figure 5- 2017 Solar Eclipse animation (click to play). Source: NASA
    Figure 5- 2017 Solar Eclipse animation. Source: NASA

    As GISers, you know that software is the engine. Engines need fuel to run. With GIS, fuel is data. For this next animation, two key pieces of data enable a new level of accuracy in plotting the umbra.

    The first is the topography (surface map) of the moon. It’s not as round as it appears from Earth. Its surface has jagged edges from varied terrain just like the Earth.

    The second is the vantage point on the Earth. In producing the following animation, NASA used SRTM elevation data collected from the Space Shuttle Endeavor mission in 2000. In 2014, the U.S. government released high-resolution SRTM data (30-meter) to the public. As a result, the following animation incorporates high-resolution data with unprecedented accuracy.

    Figure 6 - 2017 Solar Eclipse animation using high-accuracy topo and SRTM data (click to play). Source: NASA
    Figure 6 – 2017 Solar Eclipse animation using high-accuracy topo and SRTM data. Source: NASA

    Where are you going to be on August 21st?

    The fascinating part of this event is that no matter where you are located in the continental United States, you’re going to experience the effect of the solar eclipse.

    As I mentioned above, at my house and office, I’ll experience about 99.77 percent eclipse. If I drive 15 miles south, I can experience 100 percent eclipse. The challenge is going to be traffic. It is expected that a few hundred thousand tourists will visit Oregon for this experience.

    Traffic is already heating up. Gas stations may run out of fuel. Grocery stores may run low on food. I have no idea what to expect for traffic if I decide to make the 15-mile drive. I assume country roads as well as I-5, Oregon’s major interstate road, will be jammed and everyone will be driving at a snail’s pace and when the actual event is in progress, stop on the side of the road.

    If I was a betting man, I’d say I’ll make the trek with a tank full of fuel and a sack lunch (~10:15am is go-time in Western Oregon). I’ll take one piece of equipment to document the event, my drone. If I plan it right, I should be able to grab some incredible images, not necessarily of the solar eclipse itself, but of the crowds of people mesmerized by the event. Follow my Twitter for updates.

    Lastly, it was the electric washing machine. That’s the only invention listed in the opening paragraph that existed in 1918, when the last event like this occurred. The next one won’t be until 2045. I think I’ll make the 15-mile drive on Monday.

  • UAVs, high-accuracy GNSS: Red-hot, right-now tech

    By Eric Gakstatter

    It’s been a few months since I’ve published a GSS Monthly newsletter column. What a busy few months it has been. It’s been all about UAVs, high-precision GNSS projects and GIS, with some conferences and workshops sprinkled in between. High-accuracy GNSS technology and UAV technology are hot trends— red hot.

    UAVs: Prosumer and mapping on a slope

    Obviously, consumer UAVs have exploded in the mainstream consumer electronics market during the past five years. Since the FAA began requiring UAVs to be registered in late 2015, far more UAVs have been registered (~700,000 to date) with the FAA than manned aircraft (~320,000).

    In fact, the number of registered UAVs aircraft eclipsed registered manned aircraft more than a year ago! The FAA reported that at any one point during the day, there are ~7,000 manned aircraft flying in the U.S. airspace. That begs the question, how many UAVs are flying above our heads at any one point in time? No one can answer that question.

    On the coattails of consumer UAVs in mainstream America is the use of UAVs in the USA’s commercial world. Since the FAA opened the floodgates in August 2016 to allow almost anyone to fly UAVs for business ($150 and answer 42 out of 60 questions correctly), lots and lots of companies are buying inexpensive “prosumer” UAVs and extracting tremendous value from them.

    Prosumer electronics is equipment and software targeted at the consumer market but also good enough to be used for business. The UAV market is a perfect example of this. DJI, by far the biggest UAV manufacturer in the world at $1B+ in annual revenue, targets the mainstream consumer market and sells a huge number of low-, medium- and high-end UAVs to businesses. Think about it: You can buy a DJI Phantom 4 Pro at your local Apple Store and the next day be generating one-foot elevation contours on a project site!

    Following is an example of a papermill I flew a few weeks ago. I flew it in less than one hour (50 acres), generated an orthophoto with 2.4-cm/pixel resolution and a digital elevation model (DEM) with 4.79-cm/pixel resolution.

    Figure 1 - 2.4cm/pixel resolution orthophoto - 50 acres
    Figure 1.  2.4-cm/pixel resolution orthophoto, 50 acres.
    Figure 2 -DEM with 4.79cm/pixel resolution of the same flight
    Figure 2.  DEM with 4.79-cm/pixel resolution of the same flight.
    Figure 3- Zoomed in image of the same DEM
    Figure 3.  Zoomed-in image of the same DEM.

    The detailed data above, generated from a $1,500 UAV, is clearly outstanding. By the way, the purpose of the project was to determine the volume of the various stockpiles, which I’ve not computed yet. But if the volume calcs are close enough to the traditional terrestrial-based measuring methods, the UAV return on investment (ROI) argument will be hard to beat.

    It takes ~14 hours each month to measure all the stockpiles on this site using traditional terrestrial measurement tools. Also, the measurements must be taken on the weekend when the site activity is minimal. It took less than one hour to fly the entire site, and I flew it twice (one time west-east direction at 80/80 overlap and one time north-south at 70/70 overlap) to make sure I had enough data. I mean, seriously, I drove 1.5 hours to the site. Why not spend another 20 minutes to fly it in a perpendicular direction?

    To date, I’ve only flown relatively flat sites such as construction sites, agricultural fields, and industrial sites. That was until a couple of weeks ago. While I’ve become pretty comfortable at flying open and relatively flat sites over the past 18 months, I’ve not ventured into flying a site with a lot of elevation changes and tree canopy. I finally did that earlier this month, and it was both challenging and rewarding. There are a few problems on sites with major elevation changes and tall tree canopy:

    A. Maintaining visual line of sight (VLOS) as required by the FAA.

    B. Flying in such a manner that the image-processing software has good quality data to work with so you can generate the products you need.

    The mission planning/control software plays a very important roll in this process. Well, it always does, but it really does in this case. Typically, the mission planning/control folks want you to fly at a consistent height above the ground so your overlap is consistent. This is very difficult to accomplish if you’re flying a site with a lot of elevation change. In that case, they typically tell you to launch from the highest (or nearly the highest) elevation point and fly at that elevation.

    The problem this causes is that you could end up flying 500, 600 or 700 feet above ground level (AGL). For example, if you are flying a site with 500 feet of elevation change and you instruct the mission planning/control software to fly at 350 feet AGL, at some point in the project the UAV will be at 850 feet AGL. That can be a problem from both a regulatory standpoint (FAA allows UAV flights up to 400 feet AGL) and an image-processing standpoint.

    Fortunately, the mission planning/control software I use just introduced a Terrain Awareness feature. It uses SRTM (Shuttle Radar Topography Mission) elevation data. Granted, it’s 30-meter pixel elevation data, so each elevation block is 30 meters x 30 meters, so I really wondered if the resolution was high enough. The site I was going to fly was only 60 acres in size and had 550 feet of elevation change. Note that the trees on the site had already been harvested, so the land was relatively clear. There’s about a 550-foot difference from the projected launch point (purple dot) to the northern and western end of the site. Following is the mission plan for the site I was planning to fly.

    Figure 4- 60-acre site with ~550 feet of elevation change
    Figure 4. 60-acre site with ~550 feet of elevation change.

    To give you an idea of the slope, the solid red lines in the following image are 100-foot elevation contour lines. The green triangle is the projected UAV launch point. This was a great launch point because I could see the entire site and maintain VLOS.

    Figure 5- Site topo with projected UAV launch point
    Figure 5.  Site topo with projected UAV launch point.

    I chose to fly the mission at 300 feet AGL. I figured it would be high enough if there was some “slop” in the SRTM elevation model. Still, I was concerned about the resolution of the SRTM data because at 300 feet AGL, my UAV would be flying below the launch elevation due to the extreme elevation slope on the site. Remember, the Terrain Awareness feature of the mission planning/control software is based on the SRTM elevation data, and not based on any sensors in the UAV itself — if the SRTM elevation data was incorrect, my UAV might crash into the ground.

    Following is the SRTM elevation data along with the flight path data displayed in the mission planning/control software.

    Figure 6 - The projected UAV flight path based on the SRTM elevation data
    Figure 6.  The projected UAV flight path based on the SRTM elevation data.

    The moment of truth came when I launched the UAV from the start point (purple dot) and watched it rise to 300 feet AGL to start its mission. The first few swaths were uneventful. After that, it started to fly into the canyon, following the terrain as programmed, then rise up from the canyon during each pass. It was a thing of beauty to watch.

    Unfortunately, about 70% of the way through the mission, it started raining, so we called it quits. However, we proved that at least on the four sites I flew that day, the SRTM data and Terrain Awareness feature were effective in collecting data in steep-slope environments. Following is the 2.69-cm/pixel orthophoto generated from the flight. Note the tracks where the logging rigs pulled the logs up the steep slope.

    Figure 7 - 2.69cm/pixel resolution orthophoto
    Figure 7.  2.69-cm/pixel resolution orthophoto.

    Following is a zoomed-in view of the UAV launch site.

    Figure 8 - Zoomed in view of the orthophoto
    Figure 8.  Zoomed-in view of the orthophoto.

    Following is an image of the 5.37-cm/pixel DEM generated from the flight data. Notice the logging tracks.

    Figure 9 - 5.7cm/pixel image of the DEM generated from the flight data
    Figure 9.   5.7-cm/pixel image of the DEM generated from the flight data.

    Following is a zoomed in view of the 5.37-cm/pixel DEM image.

    Figure 10 - Zoomed in 5.37cm DEM image of UAV launch point
    Figure 10.  Zoomed-in 5.37-cm DEM image of UAV launch point.

    The mission was successful in proving that SRTM elevation data was sufficient enough to fly a mission with a dynamic AGL. It handled the steep slopes by maintaining a sufficient AGL elevation as I hoped it would despite only having 30-meter x 30-meter block elevation resolution. The image processing software seemed to like the UAV data, as you can see from the results above. I didn’t have to spend any additional processing time over and above what I usually spend in order to generate these products.

    I did experience a hiccup with the mission planning/control software running on my iPad Mini 2. It turns out that the Terrain Awareness feature in my mission planning/control software requires some extra CPU horsepower — the software overpowered my iPad Mini and crashed once during a mission. The UAV kept flying its intended course as instructed, but it stopped taking photos when the software crashed, so I brought it back to the launch point.

    After visiting the software vendor’s website, it became clear to me that it’s probably time to upgrade my iPad Mini to the latest model to keep up with the new features being implemented in the software.

    A Quick Note on High-Accuracy GNSS

    In March, I attended the Hawaii GIS conference and decided to perform some benchmark testing on a survey mark using WAAS and a high-accuracy GNSS receiver.

    My goal was two-fold.

    1. See how WAAS is behaving in Hawaii. WAAS in Hawaii is an anomaly because it’s far away from the Continental U.S. (CONUS) where all the WAAS reference stations are located (there’s one in Honolulu, but that’s it). In other words, Hawaii is the most challenging place for WAAS accuracy in North America.
    2. See how many GNSS satellites I could track and use in Hawaii.

    Holy moly, was I surprised at how good it was. I’ve tested WAAS in Hawaii several times in the past many years. The last time I tested it was in 2013 and the GNSS receiver I used (GPS + GLONASS) achieved a steady 80-cm accuracy. That was pretty darned good for WAAS in Hawaii at that time.

    I packed up some receivers and hiked about 4 miles to a survey mark I could find in Honolulu. I was a great survey mark for testing because it was on the sidewalk of a quiet residential street. Following is a photo of the survey mark.

    Figure 11 - PID DK4162 survey mark in Honolulu
    Figure 11. PID DK4162 survey mark in Honolulu.

    I set up on the survey mark and then looked at the satellites the receiver was tracking. I wanted to know how many GPS, GLONASS, Galileo and BeiDou satellites were being used. Following is a screen shot.

    Figure 12 - Total number of GNSS satellites being used – 23
    Figure 12.  Total number of GNSS satellites being used – 23.

    Twenty-three GNSS satellites being used! Are you kidding me? This is more than double the number of GPS satellites being used. This illustrates the power of four-constellation GNSS that is only going to continue to get better over the next several years.

    What surprised me the most was the number of Galileo satellites being used, and this was before two Galileo satellites were declared healthy in late May.

    My next test was to evaluate WAAS accuracy. Who cares how many satellites the receiver is using if the accuracy isn’t improved? I plumbed the receiver antenna on the survey mark and plotted ~7 minutes of data.

    Figure 13- Accuracy plot compared to the DK4162 survey mark coordinates
    Figure 13. Accuracy plot compared to the DK4162 survey mark coordinates.

    Yep, that’s about 30-cm accuracy over a 7-minute period. That’s better by a factor of two compared to the accuracy I saw in 2013. Sure, WAAS has improved somewhat, and maybe the ionosphere was particularly happy that day, but I have to believe that the additional GNSS satellites contributed the most to the improvement in accuracy. In the next few months, I’m going to be performing more tests with WAAS and RTK on my GNSS test course near my office. I’ll keep you posted on the results of those tests.

    The Esri International User Conference – July 10-14

    As usual, I’ll be attending the largest gathering of GIS professionals in the U.S. next month, the Esri International User Conference. 16,000 of our colleagues will descend upon San Diego to share, network and enjoy the spatialness that we have for one another.

    If you’re interested, I’m giving a couple of presentations at the Esri UC:

    • Tuesday (July 11), 08:30 a.m., Room 28B (subject to change)

    Paper Title: An Efficient, Accuracy Mobile GIS Workflow using RTK GNSS

    Session Title: Mobile Data Collection

    This is cool project I worked on with WaterOne, a large water utility, to design a real-time, high-accuracy GNSS workflow in the Esri environment. They are collecting data at the centimeter level for mapping their above-ground assets as well as new construction using tablet computers and RTK GNSS receivers.

    • Thursday (July 13), 8:30 a.m., Room 29C (subject to change)

    Paper Title: UAV (drone) applications for water utilities

    Session Title: Applied GIS: Three Unique Examples

    This is some groundbreaking work I’ve done with American Water on using UAV technology for mapping and inspection. We did a lot of experimenting during the proof-of-concept phase to figure out what applications are practical and which aren’t.

    Thanks, and see you next time.

    Follow me on Twitter at https://twitter.com/GPSGIS_Eric

    All Provided by Eric Gakstatter

  • FAA makes progress accommodating commercial UAS operations

    The sensefly eXom UAV in flight.
    The sensefly eXom UAV in flight.

    The Federal Aviation Administration (FAA) took a major step forward in expanding commercial UAS/UAV operations in the U.S. airspace. It’s chief said April 19 that the FAA is preparing to take another major step forward in further opening up commercial UAS/UAV operations by eliminating the need for a 333 Exemption for operating small UAS/UAV.

    On March 29, the FAA announced it was doubling the altitude for blanket nationwide CoAs (Certificates of Waiver or Authorization) to 400 feet above ground level (AGL). The FAA has typically issued a blanket nationwide CoA with each 333 Exemption it has granted.

    Before the announcement, the maximum altitude allowed for commercial operations under the blanket CoA was 200 feet AGL. Now, it is 400 feet AGL. At the stroke of a pen, the 3,000+ 333 Exemption holders with blanket CoAs are now authorized to fly to 400 feet. This is significant because UAS operators can now fly higher and cover more area more efficiently, and still meet the precision and accuracy requirements of most clients.

    Another announcement, perhaps even more important, was made by FAA Administrator Michael Huerta, who spoke at the 2016 FAA UAS Symposium held April 19-20 in Daytona Beach, Florida. Huerta announced that the FAA is close to finalizing the FAA rules for small UAS.

    “In late spring we plan to finalize our small UAS rule to eliminate the need for most 333 exemptions,” Huerta said. He was referring to the Small UAS Notice of Proposed Rulemaking (NPRM) that was announced Feb. 15, 2015, and opened for public comment through April 24, 2015. There were 4,650 public comments made. You can read the comments about the proposed rule here.

    The proposed small UAS rule differs significantly from the current FAA requirements for operating UAS in the United States for commercial purposes. One of the major differences is that there will be a “UAS operator’s certificate” created so that commercial UAS pilots will no longer be required to have a FAA Pilot Certificate. Currently, the FAA requires commercial UAS pilots to have at least an FAA Sport Pilot certificate, which requires a substantial investment in money and time to achieve.

    To summarize, the general proposed small UAS rules are:

    UAS pilot

    • Must be at least 17 years old.
    • Must pass an aeronautical test at FAA-approved testing center, and renewed every 24 months.
    • Must be vetted by the Transportation Security Administration (TSA).
    • Must obtain an unmanned aircraft operator certificate with a small UAS rating

    UAS operation

    • UASmust weigh less than 55 pounds.
    • Pilot in Command or Visual Observer must maintain visual line of sight (VLOS).
    • Can’t operate over people who are not part of the UAS operation.
    • Daylight operations only.
    • Yield to manned aircraft.
    • May use Visual Observer (VO), but not required.
    • First-person view camera cannot satisfy “see-and-avoid” requirement but can be used as long as requirement is satisfied in other ways.
    • Maximum airspeed of 100 mph.
    • Maximum altitude of 500 feet AGL (above ground level).
    • Minimum weather visibility of 3 miles from control station.
    • Can’t operate more than one UAS at a time.
    • No careless or reckless operations.
    • Operations in Class B, C, D and E airspace are allowed with the required ATC permission.
    • Operations in Class G airspace are allowed without ATC permission.

    With these rules, neither a 333 Exemption nor a CoA is required, which would significantly ease the requirements for a surveying or geospatial company to begin offering UAS services.

    Phantom-4-Action-4-O
    The DJI Phantom 4 UAV.

    In addition, the small UAS rule includes a framework to adapt future rules such as Micro UAS (0.55 pounds and under) rules that are being actively discussed within the FAA as well as a discussion about commercial operation of UAS over people.

    In the meantime, consumer UAS are becoming more powerful with each new product introduction. DJI, the world’s largest UAS manufacturer (by far) introduced the Phantom 4. It’s a huge step forward due to one new feature: automatic collision avoidance. This feature will help operators avoid trees, buildings and potentially other UAS. I’m pretty sure this feature will eventually be included in all commercial UAS.

    Intel CEO Brian Krzanich demonstrated the broad capabilities UAV technology during his keynote presentation at the 2016 Consumer Electronics Show Jan. 5, in Las Vegas. Krzanich showcased the Yuneec Typhoon H with Intel RealSense Technology. (Photo: Intel)
    Intel CEO Brian Krzanich gives his keynote presentation at the 2016 Consumer Electronics Show Jan. 5, in Las Vegas, where he also announced the acquisition of Ascending Technologies for drone collision avoidance. (Photo: Intel)

    Automatic collision avoidance is such a hot subject that in January, Intel acquired Ascending Technologies, a UAS manufacturer that has incorporated automatic sense and avoid technology in their UAS. According to the announcement, Intel sees “incredible opportunity for innovation across a multitude of industries. As a result, Intel is positioning itself at the forefront of this opportunity to increasingly integrate the computing, communications, sensor and cloud technology required to make drones smarter and more connected.”

    Thanks, and see you next month.

    Follow me on Twitter at GPSGIS_Eric

  • 2015 Field Technology Conference Registration Opens

    The Western Forestry and Conservation Association (WFCA) has announced that registration for the Fifth Annual Field Technology Conference (FTC) is open. FTC 2015 is hosted by WFCA, Pacific Northwest Aquatic Monitoring Partnership (PNAMP) and StreamNet. The conference will be held Nov. 18-19 at the Holiday Inn Convention Center in Portland, Ore.

    The Field Technology Conference offers attendees an insightful look at trends in field data collection hardware (smartphones, handheld/tablet computers, GPS receivers, laser rangefinders, and other data collection instruments), remote sensing (UAVs, photogrammetry, lidar) and mapping software (data collection, data processing, map building) along with outdoor demonstrations and a field trip.

    “This will be our fifth conference. With the addition of the fisheries track and participation from the Civil GPS Interface Committee, we should have a significant attendance increase this year,” said moderator/co-organizer Eric Gakstatter. “We continue to attract speakers with strong expertise in their disciplines to present their work and thought leadership.”

    The conference offers three tracks:

    • Common field technology: Discussing field data collection technology used across all disciplines such as UAVs, GPS, and mobile devices.
    • Forestry: Forestry-specific technology presentations.
    • Fisheries: Fisheries-specific technology presentations.

    In addition to the three technical tracks, there will be outdoor technology demonstrations as well as a fisheries field trip to a local slough for a live demonstration of field data collection technology (space limited).

    On the second day of the two-day conference, there will be presentations from the Civil GPS Interface Service Committee (CGSIC). CGSIC is the only forum in which civilians have the opportunity to interact directly with US GPS authorities.

    FTC 2014 attendees included representatives from Federal/State/Local government, Fortune 1000 companies, Native American tribes, higher education and natural resource consultancies.

    The registration fee is $250 if registered by Nov. 5 and $295 if registered after that date. The government rate is $195 and $245 if registered after that date. Attendance to the CGSIC presentations on November 19 is free of charge and open to the public (lunch not included).

    The registration fee includes lunch on both days as well as refreshments during breaks. The conference room rate is $99/night plus tax. After Oct. 27, the reduced rate will be subject to availability.

    To register or learn more about the conference agenda, go to the conference website.

    Sponsorship opportunities are available. Please contact Richard Zabel [email protected], 503/226-4562.

  • Esri UC Plenary Explores Democratization of Geography

    Last week, Esri held its 36th International User Conference in San Diego. With 15,000+ attendees from 130 countries, it is the largest gathering of geospatial professionals in North America.

    The general plenary presentation on Monday morning is always an interesting event. Founder Jack Dangermond leads the plenary and presents his vision for the year, and years, to come. Here’s the opening Plenary video (3 minutes):

    The message of this year’s Plenary was “Applying Geography Everywhere” with the central theme was Web GIS. Here is a video of Mr. Dangermond’s GIS vision (12:42 minutes):

    For the past few years, he’s spoken quite a bit about the democratization of geography by making GIS capability available to an audience other than the GIS professional by expanding its impact across an organization at many levels. Here’s a slide he’s presented in the past, and I think it’s consistent with where he sees GIS heading; a global awareness and global usage of GIS apps and data.

    Plenary-Dangermond-Esri

    Esri thinks that Web GIS is an enabling technology that will be a catalyst for the democratization of GIS across all of an organization’s departments.

    How GIS has evolved. (Credit: Eric Gakstatter)
    How GIS has evolved. (Credit: Eric Gakstatter)

    During the Plenary, Bern Szukalski outlined Esri’s take on the current trends in Web GIS:

    • Portals. The windows into GIS. Thousands of public and private portals serve up GIS data and services.
    • Content. A collection of authoritative and curated content that Esri calls a living atlas, with some data being updated daily or even hourly.
    • Analysis tools. For the non-GIS professional to answer simple (or complex) queries such as emergency services coverage in a particular municipality, leveraging the living atlas content to use the most up-to-date data.
    • Smart mapping. New data-driven web cartography functionality and data exploration that leverages the right tools presented at the right time. Think of it like Google search that shows you relevant web sites based on your past web surfing.
    • Story maps. A combination of Web GIS and rich media to tell a compelling story. A new and unreleased type of Story map presented by Bern is the Story map Cascade, an immersive experience as you advance through the story and interact with map, amplifying the value of GIS.

    If you want to view Bern’s plenary presentation on Web GIS trends, see the following 9-minute video:

    Esri Product Roadmap

    I get the feeling that ArcGIS Pro will be Esri’s premiere desktop product. When you buy ArcGIS, in addition to ArcMap, you also get a concurrent license for ArcGIS Pro (and ArcGIS Online), and you can see from the following slide that ArcGIS Pro incremental upgrades follow ArcMap. The following slide also shows the timing for the ArcGIS 10.4 release.

    July 2015 GSS_html_6392f0d8

    Another product Esri is going to release later this year to further promote the democratization of digital geography is a product called ArcGIS Earth. Just by the name, you can imagine the type of product it’s going to be. It’s all about 3D visualization.

    Esri-3D-visualization-plenary

    Lastly, many of you may have missed the discussion about a new Esri Mobile GIS app called Survey123. There wasn’t a big announcement made, but it seems to be a powerful little app. For those of you who think Collector is a bit too structured, Survey123 might be the app for you. You can easily author smart forms following the XLSForm specification and quickly set up data-collection workflows. This is a really neat feature of Survey123, because you can create your mobile GIS data-collection pick lists and use form logic in an Excel spreadsheet instead of having to create it in the Esri environment.

    It might end up being my favorite Esri mobile GIS app. But, you’ll have to wait to give it a spin because it’s not slated for release until later this year.

    In other mobile GIS news at the conference, it appears as though Microsoft is concerned about Android and iOS dominating the mobile device space, so much so that Microsoft co-founder Bill Gates made a recorded presentation at the plenary. Even more interesting is that Mr. Dangermond suggested that perhaps Mr. Gates might make a live appearance at the Esri UC sometime in the future.

    Bill Gates delivers an address to the Esri plenary audience. (Photo: Eric Gakstatter)
    Bill Gates delivers an address to the Esri plenary audience. (Photo: Eric Gakstatter)

    On the technical side of Microsoft, it looks like the end is in sight for the separate software development platforms for Windows Desktop and Windows Phone. With Windows 10, I heard that the software development environment for Windows Desktop and Windows Phone (or whatever it’s going to be called) is going to be the same, so you should start seeing Windows devices pick up some momentum next year.

    That’s it for now. See you next month.

    Follow me on Twitter.

  • Eric Gakstatter Gives InterGeo 2014 Synopsis

    Eric Gakstatter, contributing editor for GPS World and Geospatial Solutions, gives an overview of InterGeo 2014, held October 7-9 in Berlin.

  • InterGeo Interviews Eric Gakstatter

    Eric Gakstatter discusses positioning technology, mapping, UAVs and the industry during an interview with InterGeo TV. Eric is GPS World contributing editor for survey, editor of Survey Scene, and editor of Geospatial Solutions.

    For more InterGeo videos, see our playlist.

  • Supergeo Technologies Showcases its SuperGIS Server, GIS solutions at InterGeo

    Eric Gakstatter, contributing editor of GPS World and Geospatial Solutions, talks with Sarah Liu of Supergeo Technologies, Inc., about the company’s GIS solutions for worldwide users while at InterGeo, held October 7-9 in Berlin.

    See more InterGeo videos at GPS World’s YouTube Channel.

  • GPS World, Geospatial Solutions Report from Esri Conferences

    GPS World, Geospatial Solutions Report from Esri Conferences

    Geospatial Solutions Editor Eric Gakstatter, who is also a contributing editor to GPS World magazine, will be attending the 2013 Esri Survey Summit and Esri International User Conference, providing continuous new and analysis for the duration of both conferences. The conferences are being held this week in San Diego, California.

    On Tuesday at 1:30 p.m. in Room 24A of the San Diego Convention Center, Gakstatter will deliver a presentation entitled “High-Precision GPS/GNSS on your Smartphone, Handheld and Tablet,” discussing trends and new product innovations for sub-meter and centimeter mapping on smartphone, handheld and tablet devices, including Windows Mobile, Android and iOS (Apple) devices.

    Steve Copley, GPS World and Geospatial Solutions associate publisher, shared images of the event on his Twitter account. A few of them are below.

    For live coverage all week follow:

    Eric Gakstatter @GPSGIS_Eric

    Steve Copley @SteveCopleyGPS

    Geospatial Solutions @GSS_NCM


  • Sign up Now to Experience ‘Nightmare on GIS Street’

    GPS World’s next webinar, “Nightmare on GIS Street: GNSS Accuracy, Datums and Geospatial Data,” is accepting registrations. The webinar will be held Thursday, June 20, 10 a.m. PDT / 1 p.m. EDT / 6 p.m. GMT. Registration is free.

    “‘Nightmare on GIS Street: GNSS Accuracy, Datums and Geospatial Data’” is a look at the challenge of dealing with horizontal datums in your GIS,” explained moderator Eric Gakstatter, survey editor and editor of Geospatial Solutions. “We are moving into a new era in dealing with datum transformations. Geodata 2.0 is coming, and it can create big headaches when attempting to combine disparate geospatial databases. Sensors such as GPS receivers, remote sensing imagery, and 3D scanning provide much more accurate data, setting up a collision with outdated and mismatched legacy horizontal datums.”

    Scheduled speakers include:

    Kevin Kelly,Geodesist, ESRI, Inc.
    Kevin Kelly is a Geodesist with ESRI in Redlands, California where he researches and implements geodetic algorithms and applications for the ArcGIS software. His experience spans over 35 years in hydrography, geodesy, surveying and most recently, geographic information systems. He has held the posts of Manager of Geodetic Services for the Province of Ontario, Chief Geodesist for the Kingdom of Saudi Arabia’s Military Survey Department and Senior Project Surveyor for The Keith Companies (now Stantec, Inc.). Mr. Kelly received a Master of Applied Science in Geodesy at the University of Toronto, Canada and holds an Honors Diploma in Hydrographic Surveying Technology from Humber College in Toronto. He is also a licensed Geodetic Surveyor in the Province of Ontario, Canada.


    Craig GreenwaldCraig Greenwald, Technical Director, GeoMobile Innovations

    Craig Greenwald is the Technical Director and a principal at GeoMobile Innovations Inc. He has worked in the GPS and Mobile GIS industry for over 13 years, including seven years for GIS software leader, ESRI and is well known for his work on the ESRI ArcPad team. Craig leads the GeoMobile software development and consulting team specializing in Mobile GIS and field data collection applications and technology providing Mobile GIS software, consulting, and training services to GeoMobile Innovations? clients. Craig has real world experience designing, implementing, and consulting on all sizes of projects, ranging from local campground trash mapping to the U.S. national census, and has been a key developer in GeoMobile?s commercial applications such as LaserGIS for ArcPad and Geo-Photo Inventory Tool for Garmin GPS solutions.

    Michael L. DennisMichael L. Dennis, RLS, PE, Geodesist, NOAA
    Michael L. Dennis, RLS, PE, is a geodesist at NOAA’s National Geodetic Survey (NGS) where his duties include analysis of geometric (“horizontal”) and vertical datums; evaluation of data processing and survey network adjustment procedures; development and promotion of standards and guidelines; integration of NGS products and services with GIS; and public outreach. Mr. Dennis is also a registered professional engineer and surveyor with private sector experience, including ownership of a consulting and surveying firm. Mr. Dennis is an officer of the American Association for Geodetic Surveying (AAGS), an American Congress on Surveying and Mapping (ACSM) Fellow, and a member of the Arizona Professional Land Surveyors Association and the Geomatics Division of the American Society of Civil Engineers.

    Moderator:

    Eric Gakstatter

    Eric Gakstatter, Editor of Geospatial Solutions Monthly and Survey Scene
    Eric Gakstatter has been involved in the GPS/GNSS industry for more than 20 years. For 10 years, he held several product management positions in the GPS/GNSS industry, managing the development of several medium- and high-precision GNSS products along with associated data-collection and post-processing software.


    To learn more about our webinars, visit our webinar page.

  • GNSS Constellation Update

    Original Broadcast Date: 10/25/12

    Summary: This month, a new GPS satellite was launched, India launched a new SBAS satellite, and two Galileo satellites are scheduled to launch. Last month, China launched two more BeiDou satellites. There’s a lot of activity of the satellite navigation industry. In the webinar, I will discuss what these new developments mean to the surveying/mapping user, as well as other current events.

    Speaker:
    Eric Gakstatter
    Contributing editor for survey and GIS