Tag: Hawaii

  • See NASA’s GUARDIAN Catch a Tsunami

    See NASA’s GUARDIAN Catch a Tsunami

    News from NASA

    A new data visualization illustrates how an experimental NASA technology can provide extra lead time to communities in the path of a tsunami. Called GUARDIAN (GNSS Upper Atmospheric Real-time Disaster Information and Alert Network), the software detects slight distortions in satellite navigation signals to spot hazards on the move.

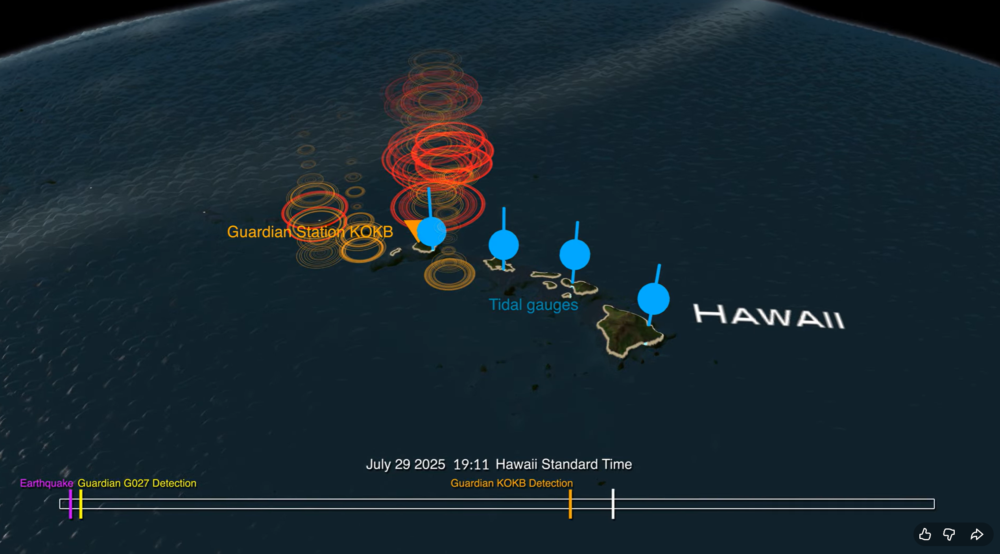
    The animation breaks down a real-life case study: 2025’s massive Kamchatka earthquake and the tsunami that it sent racing across the Pacific and towards Hawaii at more than 500 mph (805 kph).

    The visualization shows the magnitude 8.8 earthquake (seen in purple) strike off the Russian coast on July 29, 2025, triggering the tsunami. The red, orange, yellow, and green ringlets represent real-time readings from ground stations tracking GPS and other navigational satellite signals. The disturbances were spotted by GUARDIAN’s artificial intelligence-powered detection algorithms as soon as eight minutes after the earthquake.

    For the next several hours, signs of the tsunami were picked up by GUARDIAN across the Pacific Ocean in near real time. The system flagged an incoming wave off the coast of Kauai some 32 minutes before it made landfall and was detected by tide gauges (shown in blue).

    The results highlight GUARDIAN’s potential to augment existing early warning systems, said Camille Martire, one of its developers at NASA’s Jet Propulsion Laboratory in Southern California.

    Currently, determining whether an earthquake generated a tsunami remains a challenge. Forecasters rely on seismic data and computer simulations to make their best prediction, then wait for pressure sensors attached to the ocean floor to confirm a passing wave. Those sensors work well but are expensive and thinly dispersed. Gaps in coverage remain. And in those gaps, warning time disappears.

    The GUARDIAN approach is complementary and cost effective because it monitors existing data from GPS and other constellations that make up the Global Navigation Satellite System. It’s also free to access, though for now best suited to analysts trained to interpret its findings.

    How GUARDIAN works

    All day, every day, geopositioning constellations transmit radio signals to ground stations around the globe. On the ground, the data is refined to sub-decimeter (less than 10 centimeters) positioning accuracy by JPL’s Global Differential GPS System. Before the signals get there, however, they must travel through an electrically charged skin of plasma called the ionosphere.

    Solar storms and other space weather can wreak electrical mayhem in the ionosphere, and so can events on Earth. Tsunamis and earthquakes, by displacing large amount of air at Earth’s surface, unleash pressure waves that can slightly perturb the radio signals coming down from satellites. While systems are in place to correct for this “noise,” GUARDIAN considers it a useful signal.

    Currently, GUARDIAN scours data from more than 350 GNSS ground stations around the Pacific Ring of Fire, a hotbed for the ocean’s deadliest waves. And the system is not confined to tsunamis. Earthquakes, volcanic eruptions, missile tests, spacecraft reentries, meteoroid splashdowns — anything that produces a large rumble on Earth is potentially fair game. While the Kamchatka event didn’t cause widespread damage to people or property, it showed how the next time disaster strikes, NASA science could give communities a few more minutes to act.

    GUARDIAN is being developed at JPL by the GDGPS project, which is partially supported by NASA’s Space Geodesy Project.

  • Seen & Heard: Free autonomous shuttle service launches in Detroit, Maui’s wildfire recovery and more

    Seen & Heard: Free autonomous shuttle service launches in Detroit, Maui’s wildfire recovery and more

    “Seen & Heard” is a monthly feature of GPS World magazine, traveling the world to capture interesting and unusual news stories involving the GNSS/PNT industry.


    FAA Greenlights Life-Saving UAV BVLOS Operations

    Photo: photovs / iStock / Getty Images Plus / Getty Images
    Photo: photovs / iStock / Getty Images Plus / Getty Images

    The Northern Plains UAS Test Site (NPUASTS) has assisted the Grand Forks, North Dakota, Fire Department in obtaining a Tactical Beyond Visual Line of Sight waiver from the Federal Aviation Administration, allowing first responders to operate unmanned aircraft systems (UAS) beyond visual line of sight (BVLOS) in extreme emergencies. This capability can be used to assess large fires, conduct aerial searches and locate missing persons. The NPUASTS team trained 11 first responders in UAS operations and flight protocols.

    Free Autonomous Shuttle Service Launches in Detroit

    Photo: Detroit
    Photo: Detroit

    A free autonomous shuttle program has launched in Detroit, Michigan. The four electric, wheelchair-accessible “Connect” shuttles will operate every 10 to 15 minutes during peak hours along a 10.8-mile route from Michigan Central to Bedrock’s 200 Walker Street on the East Jefferson Riverfront. Initially, the shuttles will be manually operated to allow for route adjustments and ensure smooth operation of autonomous features. Full autonomous driving is expected later this year.

    Maui Recovers One Year After Deadly Wildfires

    Photo: Maxar Technologies
    Photo: Maxar Technologies

    New satellite images from Maxar Technologies reveal the extent of damage in Lahaina, Maui, nearly a year after the catastrophic wildfires on Aug. 8, 2023, which resulted in more than 3,900 properties being destroyed and 100 fatalities. Despite the devastation, the satellite image shows signs of recovery, with debris removal progressing and new temporary housing being constructed for displaced residents. The images show cleared lots and returning greenery.

    Sea Lions on a Mission

    Photo: Nathan Angelakis
    Photo: Nathan Angelakis

    Researchers have attached lightweight video cameras to sea lions to explore previously uncharted areas of the ocean off the south coast of Australia. The footage, combined with a machine learning model, produced detailed maps of the ocean floor, revealing the distribution of different habitats and species. This method allows scientists to access deep and remote habitats that are unreachable by traditional hydrographic surveys. The study, published in Frontiers in Marine Science, highlights the potential of using animal-borne cameras for marine exploration and conservation efforts.

  • Innovation Insights: Science in paradise

    Innovation Insights: Science in paradise

    Innovation Insights with Richard Langley
    Innovation Insights with Richard Langley

    This is an introduction to the November 2023 Innovation article, “Using GNSS Phase Reflectometry on Maui’s Haleakalā”


    We’ve all seen the news reports of the terrible devastation and loss of life in the town of Lahaina on the island of Maui by a wildfire this past August. Those terrible reports jarringly contrasted with happy memories of visits to Hawaii and its paradise islands. I recalled my visit some years ago to Maui in particular. My wife and I traveled all around Maui, but we particularly enjoyed the drive up to the top of Mount Haleakalā.

    Rising to just over 3,000 meters, Haleakalā is a large, active (though currently dormant) shield volcano that forms about 75% of Maui. Just below its summit there is a visitor center with informative panels describing the geology of the volcano and the flora and fauna to be found on its flanks. On the drive up, for example, you can see endangered nēnē, the Hawaiian Goose, and the threatened silversword plants, which only bloom once in their lifetimes. And the sunrise and sunset views from the summit are quite beautiful.

    A few hundred meters away from the visitor center is the Haleakalā High Altitude Observatory Site — a complex informally known as “Science City.” The site accommodates various optical telescopes and other instruments, including among others the 4-meter-aperture Daniel K. Inouye Solar Telescope (the largest solar telescope in the world), a satellite laser ranging station, and the Maui Space Surveillance Complex, which consists of a suite of telescopes operated by the Department of Defense for satellite tracking.

    Also at the site is an innovative system observing the ocean surface far below using the phase of GNSS signals. Not only receiving normal line-of-sight signals from satellites, this system also receives signals that are reflected by the ocean surface, a technique called GNSS reflectometry or GNSS-R. GNSS-R can be thought of as a bi-static radar, where the transmitters (the GNSS satellites) and the receiver are separated by a large distance. The receiver can be on Earth’s surface, on an aircraft or on a low-Earth-orbiting satellite. The reflected signals contain information about the surface from which they were reflected. Depending on the receiver’s location and with suitable data processing, parameters such as ground surface elevation and its variation, water level and tide height, sea state (wave height, wind speed and wind direction), soil moisture content, and even snow depth can be deduced.

    Over the years, we have had a number of articles on GNSS-R in this column using different receiver platforms (April, 1999; October, 2007; October, 2009; September 2010; September 2014; and October, 2019). In this quarter’s “Innovation” column, we have an article by some members of the team who built and operate the GNSS-R system on the top of Haleakalā. They explain how the system works and some of the preliminary observations and results they have obtained. More science in paradise!

  • Using GNSS Phase Reflectometry on Maui’s Haleakalā

    Using GNSS Phase Reflectometry on Maui’s Haleakalā

    Read Richard Langley’s introduction to this article:Innovation Insights: Science in paradise”


    Originally developed for navigation and timing applications, signals from global navigation satellite systems (GNSS) are now commonly used for geophysical remote sensing applications, including observation of Earth’s surface and atmosphere using near sea-level ground stations as well as mountaintop, airborne and spaceborne platforms. GNSS reflectometry (abbreviated GNSS-R), which is the technique of using reflected signals to measure properties of Earth’s surface, has been a growing area of research and application for GNSS remote sensing. Notably, the Cyclone Global Navigation Satellite System (CYGNSS) satellite mission produces delay-Doppler maps (DDMs) that are used to monitor ocean surface wind speeds during hurricanes. Meanwhile, terrestrial and airborne GNSS-R has been used to monitor soil moisture, snow depth and vegetation growth. One area of increasing interest is precision reflectometry using signal carrier-phase measurements. The first attempt to perform precision (phase) altimetry over sea ice using GPS reflectometry measurements from the low-Earth orbiting TechDemoSat-1 was reported by researchers in 2017. Subsequently, researchers demonstrated the use of reflections collected by a Spire satellite to perform altimetry over Hudson Bay and the Java Sea and how reflections off ice in the polar regions can be used to measure ionospheric total electron content over the polar caps. While these demonstrations of GNSS-R for precision carrier-phase-based reflectometry are promising, more work needs to be done to characterize when carrier-based altimetry is feasible and what challenges it faces.

    To study the challenges associated with processing reflected and low-elevation-angle radio occultation signals, the University of Colorado (CU) Boulder Satellite Navigation and Sensing (SeNSe) Laboratory has deployed a GNSS data collection site on top of Mount Haleakalā on the island of Maui, Hawaii. Recent collection campaigns aim to use this site as a testbed for GNSS-R algorithms that utilize multi-frequency and multi-polarization measurements. Previously, we carried out delay map processing for left-hand circular (LHC) and right-hand circular (RHC) polarizations for L1 and L2 GPS signals. Those results validate the open-loop processing methodology and provide an initial assessment of the data quality. We observed that the received reflected signals show deep and rapid fading in amplitude. In the work reported in this article, we extend our assessment to triple-frequency GPS (L1CA, L2C, L5Q) signals and document our methodology for extraction of the signal carrier phase. Our initial results indicate that coherent signal phase extraction is challenging, and may not be feasible for this particular experiment setup. We discuss ways in which the experiment may be improved for the purpose of obtaining coherent ocean surface reflections in the future.

    EXPERIMENT BACKGROUND

    The current form of the CU SeNSe Lab Mount Haleakalā GNSS experiment was deployed in June 2020. It consists of a side-facing dual-polarization horn antenna, which is shown in the left panel of FIGURE 1, along with a zenith-facing reference antenna. The horizontally- and vertically-polarized wideband signals from the horn antenna are fed into front-end hardware and are combined using 90-degree phase combiners to form LHC and RHC polarized signals, which are then recorded by a set of Ettus Universal Software Radio Peripherals (USRPs). Meanwhile, the signal from the reference antenna is sent to a Septentrio PolaRxS receiver. The right panel in Figure 1 illustrates the system setup. Note that the Septentrio onboard oven-controlled crystal oscillator is used to drive the USRPs. This allows us to use the Septentrio outputs to estimate the receiver clock variations and use them in the receiver clock component of our open-loop models, which we discuss below.

    Figure 1 The side-facing horn antenna in its radome enclosure (left panel) and the hardware block diagram of the data collection system (right panel). (All figures provided by the authors)
    Figure 1: The side-facing horn antenna in its radome enclosure (left panel) and the hardware block diagram of the data collection system (right panel). (All figures provided by the authors)

    Each USRP can record up to four signals at two different mixdown frequencies, allowing for recording of both the RHC and LHC polarized signals on up to four different bands. The first USRP records the L1 and L2 bands with center frequencies at 1575.42 and 1227.6 MHz, respectively, at a bandwidth of 5 MHz. The second USRP records the L5 and E6/B3 bands at center frequencies of 1176.45 and 1271.25 MHz and at a 20 MHz bandwidth. TABLE 1 lists the IDs for each receive channel along with its corresponding band, polarization and sampling rate. Note that the recorded signals covering the E6 band also capture BeiDou B3 signals, but we restrict our analysis to GPS L1, L2 and L5 signals in this article. The samples from these USRPs are written to disk along with the Septentrio Binary Format (SBF) output of the PolaRxS receiver.

    Table 1 Receiver IDs with corresponding band and polarization.
    Table 1: Receiver IDs with corresponding band and polarization.

    Starting in June 2021, periodic collections were taken for around one hour at a time, which is about the amount of time it takes for a GPS satellite to pass from an elevation angle of 0 degrees to one of more than 20 degrees. The collection times were adjusted to target the passes of satellites whose specular reflection point passed within the azimuthal range of the horn antenna, which faces roughly to the south and has a beam width of around 60 degrees. FIGURE 2 summarizes the available datasets from the first month of collections. The right-most panels of FIGURE 3 show examples of the specular track for GPS PRN 6 as it sets over the horizon on June 13, 2022, at around 12:00-13:00 UT. This is the pass on which we focus in this work, since PRN 6 transmits the L1CA, L2C and L5 signals and consistently had a specular point in our region of interest.

    Figure 2 Available data during the first month of collections. The average significant wave height in the region south of Haleakalā is also plotted. Numbers near the bottom indicate the datasets analyzed for this article.
    Figure 2: Available data during the first month of collections. The average significant wave height in the region south of Haleakalā is also plotted. Numbers near the bottom indicate the datasets analyzed for this article.

    METHODOLOGY

    Our processing method for open-loop tracking of the reflected GNSS signals is based on our previous work in which we produced DDMs and delay maps of the signal-to-noise ratio (SNR) measurements for multiple signal frequencies and received polarizations.

    Pseudorange Model. We start by generating a model of the pseudorange for both the direct and reflected signal. The model only needs to be accurate down to the chip level, since we correlate across several chips of delay for the received signals. Setting a somewhat arbitrary accuracy requirement of 0.5 chips (equivalent to a delay of around 150 meters for L1CA/L2C or 15 meters for L5 signals), allows us to ignore path delays from the ionosphere and troposphere, which should only account for up to several meters of delay. The model has three terms that we estimate relative to GPS System Time (GPST): the receiver clock error, the satellite transmitter clock error and the geometric range. We use a surveyed position of the horn antenna along with International GNSS Service precise orbit and clock products for the transmitter clock error and positions. These allow us to compute the transmitter clock error and path delay for the direct signal. The reflected signal path delay can be found by computing the specular reflection point on the WGS84 ellipsoid and adding the distances from the transmitter to the specular point and the specular point to the receiver. The remaining term to estimate is the receiver clock error. Recall that our USRPs are driven by the Septentrio internal oscillator. Therefore, the clock error in Septentrio measurements is associated with variations in the reference oscillator for the USRPs. We utilize a geodetic detrending technique to estimate these clock variations and apply them to our pseudorange model. To construct the full receiver clock error, we estimate the time-alignment of the samples near the beginning of the collections to GPST by tracking one minute of a strong, mid-elevation-angle satellite and decoding its timing information. This provides us with an estimate of GPST at the start of the file, which we can use to construct a full estimate of the GPST at any sample in the file. Also, given our pseudorange model, we can find the received code phase and the Doppler frequency.

    Figure 3 Example of delay maps from GPS PRN 6. The panels to the left show delay maps for the L1CA, L2C and L5 signals, both RHC and LHC polarizations. The bottom panel shows the corresponding elevation angle over the duration of the pass. The maps to the right show the specular point location during the pass, along with a contour of the WW3 model for significant wave height and swell-significant wave height.
    Figure 3: Example of delay maps from GPS PRN 6. The panels to the left show delay maps for the L1CA, L2C and L5 signals, both RHC and LHC polarizations. The bottom panel shows the corresponding elevation angle over the duration of the pass. The maps to the right show the specular point location during the pass, along with a contour of the WW3 model for significant wave height and swell-significant wave height.

    Signal Correlation. Using the established code phase and Doppler models, we generate correlations for both reflected and direct signals. We correlate a reference signal over each 1-millisecond interval, and for sanity-checking purposes, we compute correlations over ± 3 chips at 0.5 chip spacing. This results in in-phase and quadrature (I/Q) correlation outputs every 1 millisecond. The left panels in Figure 3 show examples of the processed reflected signals for RHC and LHC polarization L1CA, L2C and L5Q signals from PRN 6 on June 13, 2021, at 12:00-13:00 UT. Note that as the satellite sets, at around 4 degrees elevation angle, the reflected signals merge with the stronger direct signal on the L1 and L2 signals. This happens later on L5 due to its higher bandwidth. We use the 0.0 chip bin to obtain I/Q outputs for carrier-phase processing for L1 and L2. For L5, we use the 0.0, -0.5, or -1.0 chip bin to account for model mismatch toward the end of the file.

    Signal Fading and the WW3 Ocean Model. An eventual goal of the Haleakalā reflectometry experiment is to compare the characteristics of processed reflected signals with the ocean surface parameters near the specular point and glistening zone. To this end, we have incorporated data from the Hawaii regional WaveWatcher 3 (WW3) model. The model outputs information about wave height, direction and period due to both wind and swell, and has a resolution of around 5 kilometers. The data from this model is available in NetCDF format from several web services. The right panels of Figure 3 show contours of the wind- and swell-significant wave height in the South Haleakalā region. Meanwhile, note that the reflected signals (left panels) show high variability in the received power throughout the duration of the collection. While we hoped to be able to immediately observe a correlation between these wave parameters and the power fluctuations, it is clear that we need additional processing to tease out such a signal, and the changing satellite geometry will likely make this difficult to observe and validate. Even still, our results at the end of this article will show that there is likely some correlation between fading and wind parameters, though to what extent is unknown. Finally, note that the LHC polarizations (RX6, RX8, RX2) show much stronger reflected signals than the RHC polarizations. Since we are interested in processing the phase for the reflected signals, we report exclusively on the use of the LHC polarization signals in the rest of this article.

    Carrier-Phase Processing. Once the correlations are performed, we take the I/Q correlations for both direct and reflected signals and process them to retrieve the cleaned reflected signal phase. The first series of steps in this process involve processing the direct signal to determine navigation / overlay symbol alignment and to estimate any residual phase fluctuations, which are mostly due to unmodeled receiver clock fluctuations. FIGURE 4 illustrates this process for the L1CA signal. The raw I/Q correlations are shown in the top panel. To these we apply a Costas phase-lock loop (PLL) to track the residual phase fluctuations without being sensitive to navigation / overlay symbol transitions. Next, we remove these residual phase fluctuations to obtain the detrended I/Q values.

    Figure 4 The I/Q data cleaning process for the L1CA direct signal.
    Figure 4: The I/Q data cleaning process for the L1CA direct signal.

    As shown in the second panel, these quadrature components of the detrended I/Q values are centered at zero while the in-phase component now shows the data bits / overlay symbols. We use the detrended I/Q values to estimate the navigation bit sequence on the L1CA and L2C signals. Likewise, we estimate the alignment of the Neumann-Hoffmann overlay sequence for the L5 signal. Finally, we wipe off the estimated data bits or overlay sequence to verify the procedure. The results of wiping off the estimated navigation bits for the L1CA signal are shown in the third panel of Figure 4.

    Having obtained the residual phase fluctuations and navigation / overlay symbols for the direct signal, we next apply these to clean up the reflected signal. Specifically, we remove residual phase fluctuations from the raw reflected signal I/Q values and then wipe off the corresponding navigation bits or overlay code. FIGURE 5 shows an example of the reflected I/Q data before and after this procedure. The navigation bits are clearly removed, but the reflected signal still shows fairly significant fluctuations in the cleaned I/Q values. It is from these values that we hope to extract the residual reflected signal phase.

    Figure 5 The reflected signal raw I/Q (top) and the I/Q after detrending and wiping off navigation bits for the L1CA signal.
    Figure 5: The reflected signal raw I/Q (top) and the I/Q after detrending and wiping off navigation bits for the L1CA signal.

    Under coherent conditions, the phase of the clean reflected I/Q data should contain only the unmodeled effects, including any signature of ocean surface height variation. However, the effect of multipath due to the rough ocean surface causes fluctuations in the received signal amplitude and phase, and can additionally cause cycle slips when we unwrap the phase. To filter out these cycle slips, we apply our simultaneous cycle slip and noise filtering (SCANF) method, which is essentially just a Kalman filter PLL with an additional step that tries to estimate and remove cycle slips. The figures in the next section show the results of applying this entire procedure to the reflected signals. The black and blue lines show the phase before and after applying SCANF. The reflected signal I/Q SNR is also included for reference. Note how the jumps in the black line coincide with SNR fades, and the blue line effectively recreates the phase trend of the black line without these jumps. This is good qualitative evidence that the SCANF algorithm was effective.

    RESULTS

    FIGURES 6, 7, 8, 9, 10, and 11 show the reflected signal SNR and phase for GPS PRN 6 on 6 different days. Note that these days correspond to the marked days in Figure 2, from which we observe that the wind-significant wave height is relatively high on days 1, 5, and 6, moderate on days 2 and 3, and relatively low on day 4. We noticed that the SNR fluctuations on days 1, 5, and 6 are comparatively more frequent than on other days, which we believe may be a signature of the ocean surface conditions. A more detailed analysis of this result is a topic for our future work.

    Figure 6 Reflected signal residual phase before (blue) and after (black) applying the SCANF filtering for the June 11, 2021 dataset. Amplitude and phase are shown in alternating panels for L1CA, L2C and L5 respectively.
    Figure 6: Reflected signal residual phase before (blue) and after (black) applying the SCANF filtering for the June 11, 2021 dataset. Amplitude and phase are shown in alternating panels for L1CA, L2C and L5 respectively.

    Figure 7: Phase processing results for June 13, 2021.
    Figure 7: Phase processing results for June 13, 2021.

    Overall, we observe that the phase trend is not consistent across the three signals (L1CA, L2C, L5) for any of the days. With all the multipath signatures in the cleaned reflected signal, it was uncertain whether the extracted phase will be useful for applications such as ocean surface altimetry, and these qualitative results suggest that they probably will not be. However, season and hours of the day that were processed for our work discussed in this article are very limited. It is possible that processing more data will shed further insight onto whether the reflected signal phase is usable in this experiment.

    Figure 8 Phase processing results for June 21, 2021.
    Figure 8 Phase processing results for June 21, 2021.

    Figure 9 Phase processing results for June 25, 2021.
    Figure 9: Phase processing results for June 25, 2021.

    ACKNOWLEDGMENTS

    The Haleakalā data collection system has been established with support from the University of Hawaii Institute of Astronomy, and the Air Force Research Laboratory. The authors appreciate the assistance from Michael Maberry, Rob Ratkowski, Daniel O’Gara, Craig Foreman, Frank van Graas and Neeraj Pujara. This research is funded by a subaward from the National Oceanic and Atmospheric Administration through the University Corporation for Atmospheric Research to CU Boulder and with partial funding support from the NASA Commercial Smallsat Data Acquisition program.

    This article is based on the paper “Initial Carrier Phase Processing for the Haleakala Mountaintop GNSS-R Experiment” presented at ION ITM 2023, the 2023 International Technical Meeting of the Institute of Navigation, Long Beach, California, Jan. 23–26, 2023.

    Figure 10 Phase processing results for July 1, 2021.
    Figure 10: Phase processing results for July 1, 2021.

    Figure 11 Phase processing results for July 5, 2021.
    Figure 11: Phase processing results for July 5, 2021.


    BRIAN BREITSCH is a postdoctoral fellow at the University of Colorado (CU) Boulder, where he received his Ph.D. in aerospace engineering sciences.
    JADE MORTON is a professor in the Ann and H.J. Smead Department of Aerospace Engineering Sciences and the director of the Colorado Center for Astrodynamics Research at CU Boulder.

  • Mapping marvel: Mapping Earth’s wildfires

    Mapping marvel: Mapping Earth’s wildfires

    Image: FrankRamspott/E+/Getty Images
    Image: FrankRamspott/E+/Getty Images

    It is no secret that the world has been burning for months. Devastating wildfires have encompassed Greece, Canada, the United States, and other parts of the world. These wildfires have incinerated entire communities, taken lives, and has had disastrous environmental effects. This wildfire outbreak can be attributed to several factors, but mainly the global climate crisis.

    Why are these wildfires a monumental problem?  

    Widespread wildfires displace of thousands of people from their homes, raze entire communities and cities, wipe out farmland and other essential resources, create horrific air pollution that causes inflammation of lung tissue and increases vulnerability to infectionsand many other devastating effects. 

    Image: NASA
    Image: NASA

    As reported by NASA, July has been the hottest month on record since the 1880’s. This has caused extreme dry conditions that are ideal for wildfire outbreaks, among other natural disasters. 

    Image: Screenshot of BBC video
    Image: NASA

    Flames engulfed parts of Hawaii the morning of Wednesday, August 9, which destroyed a centuries-old town and killing at least 106 people as of August 16. The wildfires took natives and tourists on the island by surprise. Residents and tourists were forced to evacuate the area – including some who reportedly jumped into the ocean to escape the flames. The National Weather Service stated the combination of high winds and low humidity is what caused the dangerous fire conditions across the island. The devastating fire left behind burned-out cars on once busy streets and smoking piles of debris where historic buildings once stood.  

    Image: Screenshot of BBC video
    Image: Screenshot of BBC video

    The Greece wildfires swept across the island of Rhodes, Corfu and Evia in July, creating thick clouds of smoke and forcing thousands of people the evacuate. These fires were caused by several human imposed factors such as campfires, arson and sheer negligence. However, the deadly heatwave that scorched Europe this summer — caused by carbon emissions — has not helped prevent the start and spread of these wildfires.  

    Image: VichienPetchmai/iStock/Getty Images Plus/Getty Images
    Image: VichienPetchmai/iStock/Getty Images Plus/Getty Images

    The Air Quality Index (AQI) measures the density of five pollutants: ground-level ozone, particulates, carbon monoxide, nitrogen dioxide, and sulfur dioxide. It was originally established by the Environmental Protection Agency to communicate the cleanliness of the air Americans are breathing every day. The index runs from zero to 500 — the higher the number the more polluted the air is. Effects of air pollution can range from mild symptoms, such as eye and throat irritation, to serious ones such as heart and respiratory issues. Pollution can cause inflammation of the lung tissue and increase the vulnerability to infections. 

    During wildfires, fine particles in the soot, ash and dust can fill the air. The AQI identifies the concentration of particles smaller in diameter than 2.5 μM. When these particles are inhaled, the tiny specks can increase the risk of heart attacks, cancer, and respiratory infections — especially in children and older adults. 

    Image: NASA
    Image: NASA

    Based on data from the Canadian Interagency Forest Fire Centre, there are 1037 active fires in Canada: 652 are out of control, 161 are being held in place, and 224 are under control as of August 23. Many of these fires were caused by lightning; however, with above-average temperatures this year and dry conditions, wildfires have been breaking out in Canada since May.  

  • The world is on fire: Fire strikes Maui

    The world is on fire: Fire strikes Maui

    Satellite images taken on June 25 and August 9 show an overview of southern Lahaina, Hawaii, before and after the recent wildfires. (Image: Maxar Technologies)
    Satellite images taken on June 25 and August 9 show an overview of southern Lahaina, Hawaii, before and after the recent wildfires. (Image: Maxar Technologies)

    The number of wildfires this year only increases as the island of Maui, Hawaii has been struck by several wind-whipped wildfires fueled by Hurricane Dora. Flames engulfed parts of Hawaii the morning of Wednesday, August 9, destroying a centuries-old town and killing at least 90 people, reported NBC News.

    The fires took people on the island by surprise on Tuesday, as it left behind burned-out cars on once busy streets and smoking piles of debris where historic buildings once stood. Residents and tourists were forced to evacuate the area – including some who reportedly jumped into the ocean to escape the flames.

    The National Weather Service believes the combination of high winds and low humidity is what caused the dangerous fire conditions across the island.

    On Wednesday, a series of maps from NASA’s Fire Information for Resource Management System were released, highlighting the number of wildfires still burning on the island.

    Satellite images also were taken, showing hundreds of shops and homes burned to the ground. The satellite images focus on the historic Lahaina area, which dates to the 1700s and has long been a popular tourist destination rich with native Hawaiian culture.

    In one image from Maxar Technologies, the historic area of Banyan Court in Lahaina appears to have been mostly reduced to ash. Some 271 structures were damaged or destroyed, the Honolulu Star-Advertiser reported, citing official reports from flyovers conducted by the U.S. Civil Air Patrol and the Maui Fire Department.

    The fires in Maui come after scientists have warned that wildfires are becoming more frequent and more widespread across the globe.

    Rising global temperatures and the increased extreme weather has led to a surge in the number of wildfires rapidly consuming extensive areas of vegetation and forested lands. Wildfires have recently spread across Greece, Italy, Spain, Portugal, Algeria, Tunisia and Canada — resulting in mass environmental and economic damage as well as human casualties.

  • Seen & Heard: Driving blind and keeping ballots valid

    Seen & Heard: Driving blind and keeping ballots valid

    “Seen & Heard” is a monthly feature of GPS World magazine, traveling the world to capture interesting and unusual news stories involving the GNSS/PNT industry.


    From paradise to panic… Or not

    Tourists at the Honokohau Small Boat Harbor in Kailua-Kona, Hawaii, drove their car into the harbor after following directions on a mobile map application, and were surprised when the car filled with water, reported Insider and the Washington Post. A witness to the incident took a video showing two women in a Dodge Caravan driving “confidently” into the harbor. The witness also stated that the women were not panicked and were smiling as the car tipped forward into the water. The driver and passenger eventually climbed out of the car and were not injured in the incident. An information specialist for the Hawaii Department of Transportation stated that mobile mapping applications are inaccurate and tourists should always be aware of their surroundings.


    Image: Lorado/E+/Getty Images
    Image: Lorado/E+/Getty Images

    Apple tags to the rescue again

    New York City will give out free Apple AirTags to residents in an effort to stunt an increasing number of car thefts, reported the New York Post. A local nonprofit donated 500 AirTags to the city to be handed out to residents, especially those in New York Police Department’s (NYPD) 43rd Precinct in The Bronx. NYPD encourages drivers to purchase the device if they are not able to receive one from the city. An equitable distribution plan is being designed by the Crime Prevention Unit of NYPD’s Community Affairs Bureau. The city will also be fundraising to purchase more AirTags or similar devices.


    Image: adamkaz/iStock/Getty Images Plus/Getty Images
    Image: adamkaz/iStock/Getty Images Plus/Getty Images

    Keeping ballots valid

    The Ottawa County Clerk’s office in West Olive, Michigan, is using location data to track vital election data around the county in real time, reported KATV News Channel 7. Once the election machine scans the results of a ballot, the data is uploaded to a flash drive and sealed with a tabulator. Then, a bipartisan group of election workers places the flash drive in a sealed container with a GPS receiver and a radio transmitter that communicates the container’s location in real time to the county clerk’s office. Ottawa County Clerk, Justin Roebuck, believes the receivers add an extra layer of security and will instill faith in voters that nobody is tampering with their ballots.


    Credit: vvectors/iStock/Getty Images Plus/Getty Images
    Credit: vvectors/iStock/Getty Images Plus/Getty Images

    Driving blind

    GPS plays a quiet, but integral role in Formula 1 (F1) racing. In a sport where split-second reactions are vital, GPS helps drivers and their teams improve race to race and navigate tracks safely. The importance of live location data was seen in the opening practice session at the 2023 Australian Grand Prix FP1. A red flag was flown due to loss of location data triggered by a glitch in the distribution of live tire information. This caused several near-misses on the track because drivers no longer received traffic advisory calls from their teams, reported Autosport. It took more than nine minutes to restore the real-time location data.

  • Volcanic GIS: Mapping and imaging the Kilauea eruption

    A number of geospatial companies played a key role in the government’s response to the Kilauea Volcano eruption. The volcano on the Big Island of Hawaii began erupting May 3, and while quiet for more than a week, it could resume erupting at any time.

    Mapping the flow. As a resident of Hawaii, Brennan O’Neill, Hawaiian branch manager of Frontier Precision, was in a unique position to offer support. Frontier Precision provided free access to technology and expertise to assist in mapping the lava flow.

    “I had to help out,” O’Neill said. “It was tearing at my soul. For a geologist, it’s even more powerful than that. The lava flow is like a living mass that has a mind of its own, creeping, glowing — an upside-down conveyor belt surging forward and burning everything in its path.”

    Through Frontier Precision, O’Neill offered high-tech mapping equipment, his own expertise, and the help of Nathan Stephenson, an applied geospatial engineer working in the company’s Denver office.

    “We used a combination of Trimble R10s and Trimble R8s to gather accurate data points on the ground,” Stephenson said.

    This thermal map shows the fissure system and lava flows as of 6 a.m. on Saturday, Aug. 11. The thermal map was constructed by stitching many overlapping oblique thermal images collected by a handheld thermal camera during a helicopter overflight of the flow field. The base is a copyrighted color satellite image (used with permission) provided by Digital Globe. (Map: USGS)
    This thermal map shows the fissure system and lava flows as of 6 a.m. on Saturday, Aug. 11. The thermal map was constructed by stitching many overlapping oblique thermal images collected by a handheld thermal camera during a helicopter overflight of the flow field. The base is a copyrighted color satellite image (used with permission) provided by Digital Globe. (Map: USGS)

    The mapping team flew UAS drones over the flow to gather visual imagery data, matched it to the ground reference points, stitched the photos together and draped it over county maps. The process was repeated as often as needed — daily, and sometimes even hourly — to show the speed and direction of the flow.

    Stephenson isn’t new to mapping lava flows. As a graduate student at the University of Hawaii – Hilo, he worked on collecting data on the Pahoa eruption in 2014, and he’s seen advances in technology in just a few years.

    “One thing we have now that we didn’t have in 2014 was a thermal radiometric camera that helps us map more accurately at night and enables us to capture large heat signatures.”

    The collected data helps Hawaii Civil Defense and other agencies keep the public informed and safe, and in the long term it also contributes to the store of scientific knowledge about eruptions and lava flow behavior.

    Lidar image of the Hawaii dataset showing the Kilauea Calderand the Halena'uma'u Crater and within it. (Image: Quantum Spatial)
    Lidar image of the Hawaii dataset showing the Kilauea Calderand the Halena’uma’u Crater and within it. (Image: Quantum Spatial)

    Airborne lidar insights. Another technology that aids in volcano response is lidar. High-resolution lidar surveys help first responders, scientists and government agencies monitor Kilauea conditions and predict future lava flows.

    Independent geospatial data firm Quantum Spatial Inc. (QSI) has conducted high-resolution lidar surveys of areas surrounding the Kilauea volcano eruption in Hawaii.

    The emergency response effort was part of the U.S. Geological Survey’s (USGS) Rapid Response Imagery Products (RRIP) in support of the Kilauea’s 2018 East Rift Zone – Remote Sensing Acquisition Requirement.

    The USGS Hawaiian Volcano Observatory (HVO), along with emergency responders, government agencies and academics, will use the data to better understand the conditions and characteristics of the volcano, and help planners model potential lava flows, which may better predict and respond to future flows and enhance safety of residents.

    The QSI team, which included GEO1 and Windward Aviation, deployed within days to acquire high-resolution lidar at point densities averaging from 40 to 80 ppsm, with up to 150 ppsm in select areas and 100-mp digital imagery using a Riegl dual VUX-1 LR sensor pod equipped with ABGPS/IMU mounted on a Hughes 500D helicopter.

    The project required 11 missions over the course of six days, operating at times as low as 500 feet above the ground and above active flows and nearby erupting calderas. With a need for a quick turn around, QSI deployed an analyst with the flight crew to post process each mission within hours of collection.

    The data was uploaded to the Geospatial Repository and Data Management System (GRiD) interface, developed by the U.S. Army Corps of Engineers (USACE), where additional data products have been developed and provided to the response team that includes FEMA, Hawaii’s Emergency Operations Center (EOC) and the Hawaii County Civil Defense.

    After data collection, QSI measured topographic shifts during the processing by comparing new data with a 2011 lidar collection from the same area. Survey specialists and USGS experts confirmed within hours of processing QSI’s lidar data that areas within the site had shifted up to 1.5 meters east, 2 meters to the north and 1 meter in elevation.

    USGS scientists will continue to examine the new topographic data to better understand the nature of these shifts, and integrate it into lava flow models for more accurate predictive modeling.

    The eruption in action. Using small unmanned aerial systems (sUAS) together with air-quality sensors, advanced imaging tools and Esri’s spatial analytics and mapping, a team from the Center for Robot-Assisted Search and Rescue (CRASAR) provided real-time aerial views of the eruption.

    The five volunteers armed with drones, advanced sensor systems and GIS technologies joined the response effort May 14-19 at Kilauea Volcano Lower East Rift Zone to assist in tracking and predicting the ongoing volcanic eruption. The team supplemented the University of Hawaii Hilo’s (UHH) sUAS capabilities, allowing UHH sUAS operators to focus on geographical and volcanology.

    The CRASAR team identified a new fissure not visible from the ground, projected the lava flow rate during the night when manned helicopters were not allowed to fly, and provided ongoing data collection from new thermal sensors technology.

    After the project, CRASAR published lessons learned on its blog:

    • Night flights of UAVs are very effective.
    • Rotorcraft UAVs can effectively sample gas.
    • Rotorcraft UAVs with thermal sensors are very effective.
    • Rotorcraft UAVs provide a quick look at lava flow rates.
    • Plumes will interfere with photogrammetric mapping.
    • Hanger 360 (software) rapidly produced panoramas.

    During the six-day Leilani deployment, the CRASAR team flew 44 sUAS flights, including 16 at night, using DJI 200, 210, Inspire, and Mavic Pro drones. Esri’s Drone2Map for ArcGIS together with Hangar’s Enterprise Platform for 360-degree imaging enabled rapid 360-imaging for situational awareness.

    DJI’s new XT2 thermal sensor provided unprecedented drone-based air-quality monitoring. Video and data were shared with local first responders using FirstNet, the first high-speed, nationwide wireless broadband network dedicated to public safety.

    The CRASAR response marks the first known use of sUAS for emergency response to a volcanic eruption and first known use of sUAS for sampling air quality.

    The GIS mapping and imaging technologies responders used on the scene at Kilauea Volcano Lower East Rift Zone are available here.

  • Quantum Spatial lidar surveys provide volcano eruption insights

    Looking southwest towards Leilani Estates with Fissure 8 erupting in the background. (Image: Ron Chapple/GEO 1)
    Looking southwest towards Leilani Estates with Fissure 8 erupting in the background. (Image: Ron Chapple/GEO 1)

    High-resolution lidar surveys help first responders, scientists and government agencies monitor Kilauea conditions and predict future lava flows.

    Independent geospatial data firm Quantum Spatial Inc. (QSI) has conducted high-resolution lidar surveys of areas surrounding the Kilauea volcano eruption in Hawaii.

    The emergency response effort was part of the U.S. Geological Survey’s (USGS) Rapid Response Imagery Products (RRIP) in support of the Kilauea’s 2018 East Rift Zone – Remote Sensing Acquisition Requirement.

    The USGS Hawaiian Volcano Observatory (HVO), along with emergency responders, government agencies and academics, will use the data to better understand the conditions and characteristics of the Kilauea volcano, which has been continually erupting since May 3.

    Data also will assist planners in modeling potential lava flows, which may better predict and respond to future flows and enhance safety of residents.

    The USGS National Geospatial Program (NGP) selected QSI to perform the first of two planned surveys over the active volcanic area. The QSI team, which included GEO1 and Windward Aviation, deployed within days to acquire high-resolution lidar at point densities averaging from 40 to 80 ppsm, with up to 150 ppsm in select areas and 100-mp digital imagery using a Riegl dual VUX-1 LR sensor pod equipped with ABGPS/IMU mounted on a Hughes 500D helicopter.

    Five distinct locations, covering an area of 57 square miles, were targeted:

    • Kīlauea Summit Caldera
    • Pu’u O’o Crater and flow
    • Chain of Craters Road / Kaoe
    • Puna Geothermal Venture (PGV)
    • Western Leilani Estates lava field.

    The project required 11 missions over the course of six days, operating at times as low as 500 feet above the ground and above active flows and nearby erupting calderas. With a need for a quick turn around, QSI deployed an analyst with the flight crew to post process each mission within hours of collection.

    The data was uploaded to the Geospatial Repository and Data Management System (GRiD) interface, developed by the U.S. Army Corps of Engineers (USACE), where additional data products have been developed and provided to the response team that includes FEMA, Hawaii’s Emergency Operations Center (EOC) and the Hawaii County Civil Defense.

    After data collection, QSI measured topographic shifts during the processing by comparing new data with a 2011 lidar collection from the same area. Survey specialists and USGS experts confirmed within hours of processing QSI’s lidar data that areas within the site had shifted up to 1.5 meters east, 2 meters to the north and 1 meter in elevation.

    USGS scientists will continue to examine the new topographic data to better understand the nature of these shifts, and integrate it into lava flow models for more accurate predictive modeling.

    “Airborne lidar and imagery remote sensing surveys are invaluable tools for understanding the effects of active volcanic eruptions, which change the topography as fissures emerge and lava flows extend to the ocean,” said Michael Shillenn, vice president at QSI. “We were honored to work with the USGS and others on this critical project. We believe that data and analysis provided by the QSI team will provide insights into future scenarios, enabling emergency responders to protect the surrounding community.”

  • California, Hawaii drone operators get shortcut to authorizations

    California, Hawaii drone operators get shortcut to authorizations

    Commercial drone operators in California and Hawaii — as well as a few areas in Nevada, Utah and Arizona — now can get quickly authorized to fly in controlled airspace, Skyward announced.

    Screenshot: Skyward
    Screenshot: Skyward

    Skyward is an FAA-approved airspace vendor. With Skyward, pilots can access the FAA’s LAANC (Low Altitude Airspace Notification Capability) across the five states.

    This means that pilots with a Part 107 license can get permission to fly in regulated airspace in seconds compared to manual authorizations that can take months, making it significantly easier for businesses of all sizes, particularly in the construction and warehousing industries, to manage a fleet of drones to access valuable, cost-saving data.

    The LAANC platform lets UAV operators take advantage of this digital timesaver. Skyward was the first provider approved by the FAA to offer LAANC, and Skyward saw quick adoption by its customers as soon as the prototype was released on Oct. 23, 2017.

    This phase of Skyward’s LAANC expansion includes airspace in some of the country’s busiest metro areas, including Los Angeles, the Bay Area, San Diego, Las Vegas and more than 50 smaller air markets. It will help the full diversity of businesses in the west find new ways to use drones in their operations through LAANC capability.

    Below is the full list of airspace covered in the latest rollout of LAANC (download a PDF, “The Complete Guide to the 2018 LAANC Rollout”).

    Los Angeles Air Route Traffic Control Center (ZLA)

    Blythe Airport (BLH), Blythe, CA

    Imperial County Airport (IPL), Imperial, CA

    Needles Airport (EED), Needles, CA

    St. George Regional Airport (SGU), St. George, UT

    Tonopah Airport (TPH), Tonopah, NV

    Jacqueline Cochran Regional Airport (TRM), Thermal, CA

    Meadows Field (BFL), Bakersfield, CA

    Chino Airport (CNO), Chino, CA

    McClellan–Palomar Airport (CRQ), Carlsbad, CA

    San Gabriel Valley Airport (EMT), El Monte, CA

    Grand Canyon National Park Airport (GCN), Grand Canyon Village, AZ

    Long Beach Airport (LGB), Long Beach, CA

    Montgomery – Gibbs Executive Airport (MYF), San Diego, CA

    Brackett Field (POC), La Verne, CA

    Palm Springs International Airport (PSP), Palm Springs, CA

    Gillespie Field (SEE), El Cajon, CA.

    Santa Monica Municipal Airport (SMO), Santa Monica, CA

    Zamperini Field (TOA), Torrance, CA

    North Las Vegas Airport (VGT), Las Vegas, NV

    Van Nuys Airport (VNY), Los Angeles, CA

    Hollywood Burbank Airport (BUR), Burbank, CA

    Ontario International Airport (ONT), Ontario, CA

    John Wayne Airport (SNA), Orange County, CA

    Santa Barbara Municipal Airport (SBA), Santa Barbara, CA

    Los Angeles International Airport (LAX), Los Angeles, CA

    San Diego International Airport (SAN), San Diego, CA

    McCarran International Airport (LAS), Paradise, NV

    Camarillo Airport (CMA), Camarillo, CA

    Oakland Air Route Traffic Control Center (ZOA)

    Eastern Sierra Regional Airport (BIH), Bishop, CA

    Mammoth Yosemite Airport (MMH), Mammoth Lakes, CA

    Paso Robles Municipal Airport (PRB), Paso Robles, CA

    Red Bluff Municipal Airport (RBL), Red Bluff, CA

    Lake Tahoe Airport (TVL), South Lake Tahoe, CA

    Ukiah Municipal Airport (UKI), Ukiah, CA

    Yuba County Airport (MYV), Olivehurst, CA

    Merced Regional Airport (MCE), Merced, CA

    Sacramento McClellan Airport (MCC), Sacramento, CA

    Reno-Tahoe International Airport (RNO), Reno, NV (already live)

    Fresno Yosemite International Airport (FAT), Fresno, CA

    Visalia Municipal Airport (VIS), Visalia, CA

    Napa County Airport (APC), Napa, CA

    Buchanan Field Airport (CCR), Concord, CA

    Hayward Executive Airport (HWD), Hayward, CA

    Livermore Municipal Airport (LVK), Livermore, CA

    Palo Alto Airport (PAO), Palo Alto, CA

    Reid–Hillview Airport (RHV), San Jose, CA

    Stockton Metropolitan Airport (SCK), Stockton, CA

    Charles M. Schulz–Sonoma County Airport (STS), Santa Rosa, CA

    Monterey Regional Airport (MRY), Monterey, CA

    Oakland International Airport (OAK), Oakland, CA

    Sacramento International Airport (SMF), Sacramento, CA,

    Norman Y. Mineta San José International Airport (SJC), San Jose, CA (already live)

    San Francisco International Airport, (SFO) San Francisco, CA

    Honolulu Area Control Facility (ZHN)

    Waimea-Kohala Airport (MUE), Kamuela, HI

    Lanai Airport (LNY), Lanai City, HI

    Hilo International Airport (ITO), Hilo, HI

    Kahului Airport (OGG), Kahului, HI

    Daniel K. Inouye International Airport (HNL), Honolulu, HI

  • GPS actively monitoring Kilauea’s eruptions, lava flows

    GPS actively monitoring Kilauea’s eruptions, lava flows

    GPS measurements are playing a key role in monitoring the erupting Kilauea volcano in Hawaii.

    The floor of the Pu’u ‘O’o Crater started to collapse on April 30, following weeks of uplift and increasing lava levels within the cone and seismicity in the East Rift Zone. The eruptions began on May 3, when a magnitude 5 earthquake struck, causing further collapse of the crater.

    The Hawaiian Volcano Observatory (HVO) has monitored volcanic activity on the islands since 1912. The HVO is operated by the U.S. Geological Survey (USGS) and is issuing continuous updates on Kilauea.

    The HVO is closely monitoring the biggest fissures in what is known as the lower East Rift Zone. Geologists are onsite to track ongoing and new fissure activity and the advance of lava flows.

    Kilauea eruption map as of 8 a.m. HST, May 21. Shaded purple areas indicate lava flows erupted in 1840, 1955, 1960 and 2014–2015. (Photo: USGS)

    GPS stations monitor land movement of Kilauea. The Big Island’s most active volcano has erupted nearly continuously for more than three decades.

    “Magma supplied to the Lower East Rift Zone was indicated by the northwest displacement of a GPS monitoring station,” the HVO said in its May 26 status update, but the station ceased movement a few hours later, telling a new story.

    “Magma continues to be supplied to the Lower East Rift Zone; however, a GPS instrument near the Lower East Rift Zone is no longer moving, suggesting that the rift zone is no longer inflating in this area,” the HVO stated. “Elevated earthquake activity continues, but earthquake locations have not moved farther downrift in the past couple of days.”

    Map of GPS stations installed near the Pu’u O’o vent on Kilauea. (Photo: USGS)

    The GPS stations also monitor earthquake activity associated with the volcano. For instance, the May 4 magnitude 6.9 earthquake resulted in seaward motion of 1.5 feet along portions of Kīlauea’s south flank as measured by GPS stations across the volcano.

    “Because active volcanoes make for unstable land, highly sensitive seismometers come in handy to track the frequency and strength of micro-earthquakes,” the HVO explained. “Global Positioning System (GPS) devices and another satellite-based technology, InSAR (Interferometric Synthetic Aperture Radar), map ground deformation (inflation and deflation) to within a fraction of an inch while tiltmeters measure slope from ground level. Together, these technologies help track lava’s movement underground and help pinpoint where it might break through the surface.”

  • USGS map locates lava flows before an eruption

    lava inundation zones: In this USGS map, colors depict 3 of 18 lava Inundation zones for Mauna Loa. Yellow indicates the volcano’s Northeast Rift Zone, an area along which lava could erupt. The extent of the 1984 eruption and lava flow is superimposed on the map (red).

    New U.S. Geological Survey (USGS) maps show areas that could be affected by Mauna Loa lava flows — information critical for response planning. Each zone identifies a segment of the volcano that could erupt lava and send flows downslope.

    Hawaii-laval-maunaloa-map-WThe volcano has erupted 33 times since 1843. Typically, eruptions began in the summit caldera, with a curtain of fire (a 1- to 2-kilometer line of lava fountains).

    Using detailed geologic mapping and modeling of how a fluid (in this case, lava) responds to surface topography, the USGS Hawaiian Volcano Observatory constructed nine maps depicting 18 inundation zones on Mauna Loa, Island of Hawai’i.

    Colored regions on these maps show areas on the volcano’s flank that could potentially be covered by flows from future Mauna Loa eruptions. These eruptions could originate from the volcano’s summit, rift zones or radial vents. It’s likely, however, that only part of a zone would be covered in a single eruption.

    When a Mauna Loa eruption starts, the maps can help decision makers quickly identify communities, infrastructure and roads between possible vent locations and the coast, facilitating more efficient and effective allocation of response resources, the USGS said. The public can also use the maps to consider where lava flows might go once an eruption starts.

    A pamphlet about the maps is available here.

    lava flow glow: Had the Mauna Loa inundation maps been available in April 1984, when the volcano last erupted, the maps could have been used to determine that the northern portion of Hilo was the most likely area to be impacted by the main lava flow. (Photo: David Little)