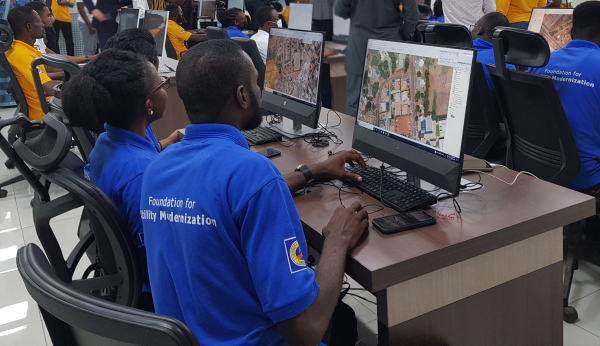
Hexagon’s Safety, Infrastructure & Geospatial division successfully deployed an advanced utility geographic enterprise asset management (EAM) system for the Electricity Company of Ghana (ECG). The smart EAM, featuring Hexagon’s G/Technology, will allow ECG to plan, manage and efficiently operate its distribution network to meet the growing needs of 4.5 million customers.
The enterprise system from Hexagon unifies data from a variety of geographic information systems (GIS), enabling bi-directional data flow with other systems based on the Common Information Model (CIM) standard. The system enhances ECG’s ability to geographically reference and manage assets with integrated tools for data surveying, capture and maintenance and network planning and calculation.
Mobile capabilities enable efficient inspections and maintenance, while a web portal assists employees with locating assets, reviewing the network and more. Migrating to Hexagon’s system will increase process efficiency and reduce asset-management costs by harmonizing systems, validating existing data and capturing missing data.
“The utility GIS is the critical component that fuels innovation in the utility,” said Keli Gadzekpo, board chairman of ECG. “This project is the foundation and the first step to modernizing ECG operations. It is the platform for digitization of electrical network assets, a prerequisite for bringing efficiency in the wire business.”
Photo: Hexagon
Part of ECG’s Modernizing Utility Operations Activity, the project was commissioned by Millennium Development Authority (MiDA), Ghana, on behalf of the Government of Ghana’s Millennium Challenge Account Entity Program and funded by the U.S. government.
“We are exceedingly grateful to Hexagon for working tirelessly to deliver this innovative product,” said Julius K. Kpekpena, Ag CEO and COO, Millennium Development Authority. “The technology sets Ghana’s biggest electric distribution utility on the path to modernizing its operations. The GIS is the foundation for modern tools to help ECG plan its networks, reduce losses, collect revenues and serve customers more efficiently.”
The project included procurement and installation of system software, server hardware, mobile field units and services for data migration by Hexagon, field validation of assets by PDSA Ghana (part of Hexagon), and production of aerial imagery by ILV Wagner using Hexagon’s Leica Geosystems surveying and airborne imaging technologies.
“Reliable electricity requires accurate data and tools to plan, design and manage networks, which can also reduce overall maintenance costs,” said Maximillian Weber, senior vice president, Global Utilities & Communications, Hexagon’s Safety, Infrastructure & Geospatial division. “We are proud to support Electricity Company of Ghana in delivering quality service to its customers.”
The Center for Systems Science and Engineering at Johns Hopkins University is tracking the coronavirus, COVID-19, via an Esri ArcGIS map.
The map is updated in almost real time, and it includes a zoomable map identifying confirmed cases of the virus throughout the world. It also includes numerical data on how many cases have been confirmed in each country, as well as deaths and recoveries.
“In response to this ongoing public health emergency, we developed an interactive web-based dashboard hosted by the Center for Systems Science and Engineering at Johns Hopkins University, to visualize and track reported cases in real-time,” John Hopkins stated on its website. “The dashboard, first shared publicly on Jan. 22, illustrates the location and number of confirmed COVID-19 cases, deaths and recoveries for all affected countries. It was developed to provide researchers, public health authorities and the general public with a user-friendly tool to track the outbreak as it unfolds.”
Men wearing white bio-suits entered the market from the main entrance. A panic ensued at the sight, and a commotion quickly spread through the crowd.
Shop keepers, sensing the worst, hurriedly gathered their belongings. People rushed towards the exits. More armed soldiers in white bio-suits pressed in, sealing off escape. Screams and weeping filled the market with the din of anxiety and fear. The Huanan Seafood Market was under lock down. The order was not to hurt anyone, but no one was to leave. The quarantine had begun.
Empty semi-trucks lined the main road. The trucks entered the parking lot one by one, and masked soldiers guided people into the backs of the empty trucks. Once filled, the trucks drove away until the market was empty. The people were transported to “isolation centers” several hundred kilometers outside the city.
Image: Duncan A Smith, CASA UCL. Data from Global Human Settlement Layer, https://ghsl.jrc.ec.europa.eu/index.php
In Wuhan, the situation had deteriorated rapidly. A month earlier videos went viral about a mysterious flu with pneumonia-like symptoms. Most of the information was coming from citizen journalists. People speculated the Huanan Seafood Market was the source of the illness, but no official statements had been made.
Anxiety spread. People began fleeing Wuhan ahead of the Chinese New Year, which is the world’s largest annual human migration. Making matters worse, Wuhan is a major transportation hub in Central China, servicing 400,000 commuters per day through the Hankou Railway Station, a short, 15-minute walk to the Huanan Seafood Market.
Alerting the world
On Dec. 31, 2019, China notified the World Health Organization (WHO) of the infection. The cause was a new strain of coronavirus along the same viral spectrum as the severe acute respiratory syndrome (SARS) and the Middle East respiratory syndrome (MERS). The next morning, on Wednesday, Jan. 1, 2020, the WHO declared the novel coronavirus 2019 (COVID-19) a public health emergency. It was also that morning that the seafood market was shutdown.
Above: One of the first and only videos coming out of China that covers the outbreak. Copyright: DW News, posted 23-JAN-2020
Twenty-three days after China notified the WHO, the city of Wuhan and the entire province of Hubei were quarantined and cut off from the rest of the world — an area comprising 57 million people, unprecedented in the history of public health.
Still, even with such extraordinary measures, it was already too late. The people moved faster than the system could adjust. Five million people, almost half the residents of Wuhan, had already evacuated. Many traveled to other parts of China to stay with family while others left China altogether, some finding themselves in countries they were banned from entering.
Containment and quarantine
China is now dealing with a containment issue at some level in every one of its provinces. In total, 174 million people in China are under some level of travel restriction. By comparison, that is equal to more than half the population of the United States.
China immediately began leaning on its massive surveillance network and facial recognition technologies to control the outbreak. Using these technologies, Chinese authorities could narrow the search for those most likely to carry the virus. The situation transitioned from a medical emergency to a national security emergency on Tuesday, Feb. 11, when China fired its two highest ranking medical officials in Hubei province, replacing them with a senior Chinese government party official.
Additionally, China continues working with the three cellular phone carriers in the country to gain access to users’ location data. This information will enable China to conduct geospatial analysis at an individual scale to identify those who have come into contact with infected areas. This practice is very controversial, placing privacy and human rights in conflict with public health security.
Roots of GIS in epidemiology
Epidemiology is the study of people, place and disease, perfectly suited for geospatial technologies. Not surprisingly then, the true origins of geographic information systems (GIS) are founded in epidemiology, harkening back to John Snow’s Cholera map in 1854. The location of infected people clearly pointed to the Broad Street water pump as the cause. That changed the scientific understanding of the time from believing cholera was transmitted in the air to realizing it was a waterborne disease.
John Snow’s 1854 map of the London Broad Street Cholera outbreak. (Image: public domain)
Similarly, the scientific consensus of COVID-19 has also changed since it first emerged. When the outbreak began, it was believed to be zoonotic, meaning the virus originated from animals and transmitted to humans. It was then believed the virus could only be transmitted directly from person to person. Now, it is known to be carried through the air or by touching infected surfaces.
Each of these modes changes the transmission rate of the disease. This is known as the reproduction number, written as R0 and referred to as the R-naught number. The larger the R-naught, the more infectious the disease. COVID-19 is estimated to have an R-naught between 1.4 and 6.6, which is similar to its cousin the SARS virus; however, SARS only infected 8,096 people and this virus is already more than 10 times that amount.
In terms of GIS, the higher the R0, the greater the geographic area potentially infected. Narrowing the area to concentrate resources more efficiently requires improved modeling and collecting more data, both of which increase the time required before effective measures can be taken. This creates a dilemma between acting swiftly and acting accurately. This explains some of the images coming out of China showing people forcibly removed from their homes and placed in quarantine.
Image: John Hopkins CSSE, https://systems.jhu.edu/research/public-health/ncov/
Controlling the spread of the virus also requires knowing the source of each outbreak. The originating source, called the reservoir, once discovered can be cordoned off. Afterwards, through a process called “contact tracing,” all potentially infected people are tracked down and monitored or quarantined if necessary.
Probability models based on geospatial analysis use factors such as age, sex, pre-existing health conditions and distance from the reservoir overlaid with data such as population density to create an intensity map showing the areas most favorable to the spread of infection. People in the defined areas can be isolated and monitored, preempting further spread.
Click to enlarge. (Maps: Centers for Disease Control and Prevention)
In the United States, the Health Insurance Portability and Accountability Act (HIPPA) requires data be aggregated at the zip code or county level, which is useful in defining regional trends, such as the CDC maps above of heart disease (red) and the areas of least physical activity (teal). Comparing the two visualizes the premise that exercise and good health go together. However, at this scale the information is not useful in fighting a dynamic and evolving situation like an infectious outbreak.
Ultimately, the goal is real-time feedback at a high-scale resolution. Smartphones and other mobile devices offer unique opportunities to combat epidemics. South Korea is using location information to help contain the outbreak. People use a special number to text where they have traveled. This is to assist in contact tracing if necessary.
Mobile devices can also report location data along with vital signs to monitor overall health and instantly identify individuals who may be a risk. The mobile device can also alert individuals if they are nearing an infected area and show the infected zones on their phones.
COVID-19 reporting via GIS
Systems can be established to report live events like Waze does for reporting traffic hazards, which have proven to report accidents faster than 911 calls. Also, the use of social media live feeds can help identify evolving situations and monitor existing ones.
Perhaps the government, working with mobile application mapping companies, should create a layer specifically for the epidemic that provides critical information, such as healthcare centers, some of which might be established specifically for the care of the disease outbreak.
Also, included in that public health layer would be high-risk areas, prohibited entry locations, areas under quarantine, and more, in order to provide an integrated interface to communicate with the general public. This is similar to how the departments of transportation, public works, and emergency response units provide information to the public to reroute traffic around congestion, accidents or closed-off areas.
Image: Coronavirus story map by Maria Laturnas, University of Potomac
A former U.S. Navy healthcare executive, Ben Boccuzzi, Ph.D., shared his thoughts on the matter with me. “The actual mortality rate of COVID-19 (in the U.S.) is hard to determine until mass testing can be done,” Boccuzzi said. “As of now, the true denominator (all people that would test positive for the virus) we only know of symptomatically and those that died from the disease. So, with these small numbers, the real mortality rate is not fully known. When testing begins on a grander scale, and more people are known to have the virus and do well, the actual rate of mortality will become much smaller.”
It is now more than two full months since the WHO declared a public health emergency. The number of known cases worldwide stands at 105,941 with 3,569 deaths affecting 100 countries.
Image: Coronavirus story map by Gangesh Khadka, University of Potomac
If you have read this far, thank you. I would like to leave you with the most important information in this article.
When I began covering this story it was early January, the virus was just beginning to make the news. Fear was in the air. I began to worry. As I immersed myself deeper into the topic, I became even more concerned; so much so, I bought two months of supplies preparing for a long-term self-quarantine situation.
If you’ve been watching the news, you may be nearing the same state of mind I found myself in. If so, I’ve got good news for you.
Paradoxically, people are attracted to fear. Fear is a potent biochemical rush. The horror movie industry rakes in $11.7 billion per year. Most media’s primary business is not information. It is using information to increase its readers and viewers, and fear captures people and holds their attention. The media is a profit-driven business. Facts tell. Fear sells.
The following is what is reported by the WHO based on 55,924 laboratory-confirmed cases since the coronavirus began. The study was published on Feb. 28. At that time, there were 86,992 confirmed cases of COVID-19 and 2,979 deaths, equating to a mortality rate of 3.4%, but those numbers were mostly in China, specifically Hubei province. Outside of China, the number of cases were only 7,166 with 109 deaths having a fatality rate of 1.5%.
Image: Coronavirus story map by Zaid Alshaboul & Kush Shah, University of Potomac
These numbers do not reflect the whole story. If you are below age 50 and in good health, recovery is 99.1%, so there is almost no reason to be concerned. For those older than age 50 the mortality rate is 1.3%, and over age 60 it increases to 3.6%. For those over age 70 it doubles to 8.0%. The most vulnerable populations are those over age 80 with a mortality rate of 14.8%.
Additionally, those with pre-existing conditions, such as cardiovascular disease, diabetes, or respiratory disease are also at high risk. If you fall into either of those categories, take great care with your hygiene and personal protection. However, if you are below 60 and in moderately good health, there is less than a 1.3% reason to be concerned and more than 98.7% reason not to be concerned.
Unless something significant changes, the virus is a reason for caution, but should not be a cause for panic. The fearmongering has gotten out of control. We may or may not get COVID-19, but for those of us who do, most of us will only experience muscle aches, fever and a dry cough, about the same as catching a bad cold.
Ironically, be grateful in times like these. They give us reasons to take pause, love our family, appreciate what we have, realize life is worth living, and get our house in order. The truth is not the story we are being sold.
A new night map integration feature is available for all Concept3D maps. The toggle-on map overlay is designed to enhance campus safety and security by making it easy to find the best, well-lit routes and critical resources such as emergency phones.
The Concept3D interactive mapping platform is used by hundreds of major universities, colleges and schools, as well as convention centers, hospitals, resorts, retirement communities, data centers and businesses.
The night map feature offers all of these clients a way to provide their audiences with important safety and security information for visiting and navigating the campus at night.
The University of Denver, Boise State University, and Pacific Lutheran University are the first to integrate this feature into their Concept3D-powered interactive campus maps.
The night map of the campus of Boise State University. (Image: Concept3D)
Boise State University is using the new night map feature to highlight Public Safety Dispatch Centers, Emergency Blue Light and Refugee Phones and locations of automated external defibrillators (AEDs). Each item has a display box that further explain the exact location of the service and additional information.
Pacific Lutheran uses the night map to display campus AEDs, emergency telephones, and its safety building.
Colleges and universities that participate in federal Title IV student financial assistance programs must comply with the Clery Act, which requires annual security reporting, details and geographic information about crimes committed on campus and on public areas immediately adjacent to the campus, and timely warnings and emergency notifications, among other requirements.
Jeremy Kirkendall, senior GIS administrator for the NASA Disasters Program, gives GPS World an overview of the program at the 2019 Esri User Conference in San Diego. Watch this video to find out how satellite imagery produced by the program helps with disaster response efforts.
Changes to the Federal Aviation Administration (FAA) operational drone restriction were recently proposed in order to allow some flights over people. This proposed rulemaking appears to be a major step forward. Mail-order delivery flights, newsgathering, real-estate sales movies and building inspection, to name a few markets, all begin to make more sense, maybe even become viable.
Some night operations could also be possible.
Risk assessment methodology appears to be logical; a number of UAV categories are proposed, and there is a way to assess if operators are in compliance.
The Alliance for System Safety of UAS through Research Excellence (ASSURE) undertook a ground impact study to determine the possible risk of injury to people from drones falling out of the sky. Assessments were made using existing automotive standards and a military standard for debris impact, plus there was testing using automotive crash dummies.
It was a lot of work, but the bottom line appears to be that possible injuries to people are more likely to be minor than major. Bear in mind that UAS fly at relatively low altitude, are made with materials that make them somewhat elastic in nature, and that it may be possible for people in a crowd to see a flailing, falling UAV and move to avoid an impact.
Nevertheless, I do have a picture in my mind of a wayward drone crashing to the pavement after hitting a skyscraper in San Francisco, and I’m really glad I wasn’t down on the sidewalk below.
Urban building inspection using drones. (Photo:AeroSIM RC)
Then I read an article by James Poss, a retired military major, who seems to suggest that although the conclusion of the ASSURE assessment was that 2,000 grams was an OK weight for an sUAV to avoid serious injury to anyone, the FAA appears to have proposed limitations for sUAS which are only 1/10th of this weight. This is more in line with the weights in the mil-spec standard that are based on small, fast, solid-metal blast fragments.
It might help us to also consider how often or badly people are injured by golf balls, baseballs, tennis balls or squash/racket balls — for instance, I’ve survived several golf ball impacts and even an impact with a squash racket during play without major damage. These are things we all take in our stride as part of (almost) normal human activity. I wonder how often recreational enthusiasts have actually been injured during model-aircraft flying gatherings?
FAA restricts flights over government facilities
In cooperation with the Department of Justice (DOJ) and the Department of Defense (DOD), the FAA has just established temporary restrictions on drone flights within 400 feet of the lateral boundaries of a number of sensitive federal facilities. This is in addition to previous restrictions over prisons, NGA facilities, DoD ships and other facilities.
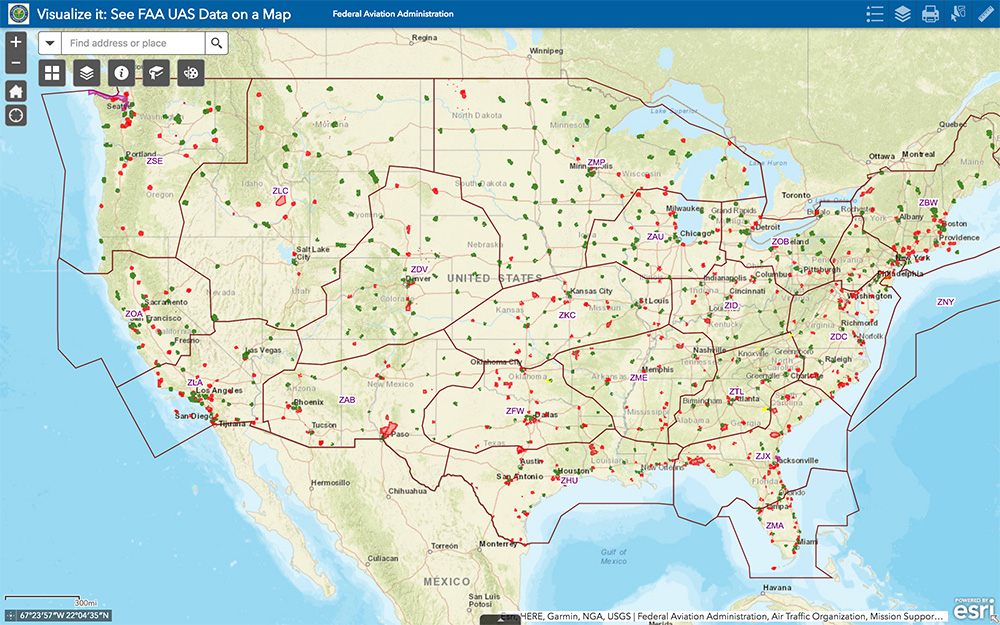
The most recent proposed Notice to Airmen (NOTAM) lists federal correctional facilities in almost half of the states in the U.S., several medical centers, U.S. Army facilities, ammunition plants and Pearl Harbor in Hawaii. It’s hard to understand why there aren’t already permanent UAV prohibitions over all such sensitive facilities across the whole U.S. I tried to check status, but the FAA UAS Data Display System didn’t list this proposed NOTAM which apparently goes into force on Feb. 26.
Think it’s probably a question of preventing bad guys from planning or doing harm rather than being shy to be caught on video — but, for sure, these places should be as secure as possible.
The FAA UAS data map shows all drone-restricted areas, once updated. (Screenshot: FAA)
Security at the Super Bowl
Well the game wasn’t the most exciting, with New England doing all that was needed to win in the fourth quarter, but the security for the event in Atlanta was humongous.
The area around the stadium was cleared of threats even before the game, attendees were screened for prohibited items and the airspace within 30 miles was restricted for general aviation and drone access. There were even Defense Department F-16 airspace patrols, and the Customs and Border Patrol had a Black Hawk helicopter available to intercept any aircraft penetrating the exclusion zone.
Nevertheless, the FAA still approved the operation of two tethered drones. One was flown close to the stadium by security personnel to provide live images of crowd movements in and around the stadium. The second system was operated at 45 meters above the rooftop of the CNN building facing the Mercedes Benz Stadium. CNN used it to provide aerial imagery of the scene before and after the game.
Elistair base station and DJI M200 at Super Bowl. (Photo: Elistair)
The tethered drone setup included two DJI M200 drones and two Elistair Ligh-T base stations, with monitoring, control and power provided to each drone by lightweight tethers. The security system was continuously operationed for 10 hours of captive flight during the Super Bowl, and for 14 hours total over two days — all while tethered to the Ligh-T control station. Security officials expressed their interest in using this solution more often because of the ability to follow a subject continuously without having to switch from one fixed camera to another, which risks losing the subject.
To sum up, new pending FAA regulations that support operations over people may have a few flaws. Other new FAA rules are aimed at protecting DOD and DOJ facilities from drone overflights, and tethered drones were used at the Super Bowl for crowd security and by CNN for color coverage.
New applications, new opportunities and preventive controls to maintain security at sensitive facilities — all moving in the right direction.
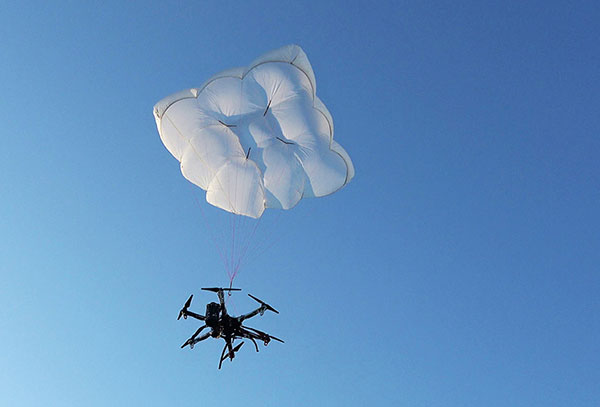
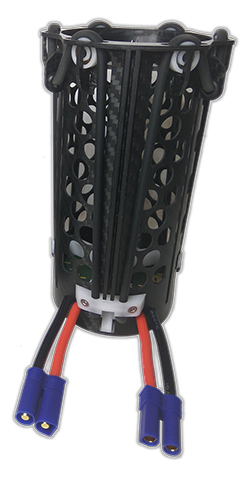
Drone Rescue will present its parachute systems DRS-5 and DRS-10 to the professional public for the first time at Intergeo, at stand 12.0B.112 in Hall 12, Oct. 16-18.
Parachute rescue system DRS-5 is designed for multicopters with a total weight of up to 8 kg. The system consists of a carbon cage in which the parachute is stored, as well as the associated electronics.
The electronics, including the sensors, monitor the flight status of a drone independent of the flight controller. A sophisticated algorithm merges this sensor data, through which an automatic crash detection can be realized, the company said. In an emergency, the pilot no longer needs to react and press an eject button. (Often, this is technically no longer possible anyway, such as with a failure of the radio link.)
Furthermore, the algorithm reacts faster than the pilot: the system ejects the parachute itself. All flight data and movements are recorded in a black box. In an emergency, these can be read out at the request of the customer and made available to insurance companies or authorities.
“Our goal is to ensure that even in an emergency beyond visual line of sight the drone can be safely intercepted. With our parachute system, that is always possible, due to the electronics that are completely separate and independent of the flight controller,” said Andreas Ploier, CEO and co-founder of Drone Rescue. “In addition, our system has the advantage that it manages completely without explosive, pyrotechnical solutions. Consequently we have a system that is considerably lighter, and functions even in a worst-case scenario.”
DRS10 system. (Photo: Drone Rescue)
The reliability of the system has been verified in extensive tests by Joanneum Aeronautics in Graz, Austria. In the framework of the tests, 100 flights were conducted during which the parachute system was ejected.
Half of the flights were conducted with a DJI F550 weighing 1.6 kg. The rest of the tests were performed with the 3.8 kg Vulture, which was developed by the FH Joanneum.
In both cases, the DRS-5 was attached to the side of the main body of the drone. In each of the tests the parachute was ejected at a height of 30 meters. Every test was documented.
Furthermore, the data were saved both in the flight controller as well as in the DRS-5 sensor system. After every 10th test, the parachute system was subjected to a visual examination and checked for possible damage or wear.
“After conclusion of the tests, it can be recorded that all 100 flights were successfully completed,” Ploier said. “In every test the multicopter landed safely. Thereby, the kinetic energy was significantly below the limit of 79 J. All requirements specified by the European Aviation Safety Agency (EASA) were observed.”
Besides the DRS-5, the structurally identical parachute system DRS-10, which is designed for multicopters with a total weight between 5 and 20 kg, will also be presented at Intergeo 2018. “The DRS-10 system functions exactly the same as the DRS-5 and falls back on the same components. These are constructed identically, just oriented for a higher payload. The functioning method of both parachute systems is identical,” Ploier said.
With flight tests for the DRS-5 completed in late summer, the first systems will be delivered to end customers in winter 2018.
June’s Geointelligence Insider article on Jack Maple was the human interest article. One of the readers of June’s article had the opportunity to meet Jack Maple. I appreciate the feedback. This month’s article is based upon the recommendation of Geospatial Solutions Managing Editor Tracy Cozzens to cover the technical side of GIS and crime fighting.
Recap
Fighting crime with GIS sounds simple enough — map where the crimes are happening and where the bad guys are and send in the cops. That would be a gross over simplification. As always, there’s more to the case.
The first CompStat was founded in the pre-internet days of 1994 on a Commodore 64, harkening back to the days of 128-MB floppy disks and MS-DOS, a Jurassic period of computer evolution that marked some of the first steps into crime fighting’s digital era. The graph above is the current CompStat 2.0 from the NYPD. It is a GIS-based system, interactive, user-friendly and available to the public. Take note of the highlighted number.
Since CompStat was introduced, crime has fallen precipitously. As of this writing (Aug. 25, 2018) New York City has 183 reported murders year to date. By comparison, in 1990, prior to CompStat, there were 217 murders per month on average. More murders were committed per month in 1990 in New York City than what it will experience in all of 2018. Murders have dropped nearly 90 percent. In other words, nine out of 10 who would otherwise have been killed are alive to return to their families, parents, classmates and colleagues, and friends. The difference is staggering, providing tangible proof geospatial science is a benefit to humanity.
The arsenal of geospatial applications available for the crime fighter is enough to make any superhero envious. The list of these high-tech, integrated intelligence systems push the limits of science fiction.
The underlying strength of these systems is the robust GIS/GPS platform they are built on. Security cameras are geospatially connected to the network with dynamic mapping capabilities. This allows the surveillance video to be overlaid on GIS software in order to interact with more information and create actionable intelligence.
Cameras use a host of software algorithms that are able to recognize aggressive behavior, patterns, anomalies, change detection, biometric features, objects and text. Systems can integrate real-time information like social media feeds as well as live video, including facial recognition software scans for wanted individuals in real time. This information is shared with police officers in the field.
Police cars are becoming mobile command centers outfitted with a suite of sensors, and will eventually include drones. Police officers wear smart glasses augmenting information about who they are looking at in an intelligence and location-based context.
The police officer’s belt is Bluetooth enabled, connecting all these devices, as well as monitoring the officer’s vital signs. The officer’s gun is also Bluetooth enabled, reporting when it is drawn, the direction it is pointed and if it fired. The gun also comes with a chip for tracking purposes and to ensure only the officer it belongs to can fire the weapon.
The vest-worn camera is woven into the seamless geospatial network of sensors and records the officer’s experience from a first-person perspective.
Imagine this scenario. A crowd gathers at an intersection triggering an anomaly detection sensor due to the number of people gathering in that location at that time. Out of the thousands of security cameras being monitored at the Command and Control Center (C3), this video scrolls around and flashes yellow, bringing attention to the possible situation. Other mounted cameras that have that intersection in the field of view automatically align along the edge of the main security video projecting their imagery onto a 3D data model of the area. Police officers in the field nearest to that location are simultaneously alerted. No action is taken at this point except the police begin heading in that direction. Facial recognition software scans the video images for faces of known suspects. Social media and texts scroll next to the video and geospatially link to those in each frame of the video. Colored sentiment indicators showed levels of concern. Boxes outlining people in various colors correspond to threat levels determined by datamining multiple databases. Semi-persistent motion trails lag behind each box showing the speed and direction of people in the video. Pattern identification looks for convergence, divergence and synchronous movements.
Video analytics identify several people converging on a car that just pulled up. The license plate reader linked to the security camera reports the car as stolen with two traffic violations. Based on this preliminary information, the situation is elevated. A police officer is dispatched but before arriving, a drone launches from the police car outfitted with a true color camera and a stereographic infrared camera. The stereographic imagery pair is streamed live to the police officers entering the area of interest through their smart glasses and to a team of imagery specialists at the C3. The video analytics of the police drone are seamlessly integrated with the security camera videos focusing on the car and the individuals as it arrives on scene and surveils the area. Object recognition identifies three possible weapons on the persons of interest. The boxes around those individuals turn red. They are tagged for persistent surveillance by all security cameras in the area. The order is given to apprehend them for probable cause. More police officers are called in and before they arrive they know who they are looking for, where the person is located, and that they may be armed and dangerous. In less than a minute, the police arrive. The suspects flee. The drone follows one of them up the street into an alley. Two of the officers pursue him. The other two suspects jump into the car and drive away. License plate readers and security cameras track the car on a map showing the vehicle’s route and speed with corresponding real-time video as the vehicle passes into view of each camera. As the vehicle travels south a police officer steps out from a cross street and shoots an electromagnetic dart into the speeding vehicle, disabling it. The police officers approaching the car shine a disorienting laser light weapon called a dazzler at the suspects, preventing their eyes from focusing. The occupants are apprehended without incident. They are searched for probable cause and arrested for carrying handguns without a permit.
The other suspect fled on foot. The drone followed him relaying live imagery to the police officers’ smart glasses. Their smart glasses showed a real-time map of their locations and the suspect’s. They cornered him in a fenced area. Guns drawn, the smoky red light of the laser cutting through the air pointed at the suspect. He surrendered. No gun was found on the suspect but the drone video the gun being thrown into a dumpster. One of the officers went back and retrieved the gun.
Gun traces were run on the three confiscated weapons and one was identified as stolen, matching a description of a gun used in a recent homicide. One of the suspect’s fingerprints match those found on shell casings at a nearby location reported by gunshot acoustic sensors. Based on this information, there is probable cause and a tap and trace is approved electronically by a special task force judge. The phone records of the three suspects are searched linking them to the el Diablo gang. Several unknown numbers are also in the call logs. Those numbers are added to the case file to be investigated later.
Only one of the suspects has a known address. The other two have no known location. Activity extracted from phone records show their whereabouts over the preceding days pin pointing their main locus of operation. Search warrants are issued. Within hours of arresting the suspects, the locations are raided and searched. Officers discover a cache of weapons, drugs, laptops and other useful information.
Everything described above is already available — it is only a matter of time and money. And, if Dubai is any indication of things to come, police could soon be arriving on hoverbikes.
The police arriving within minutes is key to the success of preventive policing. Time saves lives. The goal is to intervene before crime happens. But how is it possible? Before answering, let’s look at some numbers.
By the numbers
In 2017 almost 84 percent of the population of the United States was considered urban residing within 106,400 square miles. The Bureau of Justice Statistics reports there are only 758,854 sworn officers in the United States. Maintaining the same 84 percent ratio as the population means only 634,847 officers cover those urban areas. Specifically, it breaks down to six police officers per square mile. It is one police officer for every 431 residents except that police, like all of us, work 40 hours a week, have days off, take vacations, etc., so, only one out of every six police officers is on duty at any given time. That is one police officer for every 2,153 residents; however, police often operate in pairs, so 4,306 residents depend upon two brave souls to protect them from danger.
Victims of violent crime are 2.1 percent of the population. In a sampling of 4,306 residents that equals 90 victims of violent crime every year. In the top 10 cities it is far worse. Police officers have an incredible responsibility placed on them and they rightly deserve our praise, support and respect for the dangers they face every day.
Why not more officers you ask? Police protection comes at a cost of $100 billion annually. Our relative safety is not cheap. Crime is a huge expense. Jails, trials, public defenders, prosecutors, judges and incarceration all cost money. Safety is expensive. Budgets are stretched thin. The answer for increased safety and security isn’t more police. The answer is integrated and intelligent technology systems leading to increased efficiency. Technology has benefitted most other professions. Now, the field of law enforcement and crime prevention are benefitting. Cost is the driving need. These efficiencies are being realized on a grand scale. Making matters more urgent is the worldwide mass migration as populations move towards cities. It is imperative to manage crime now rather than later.
Enter predictive policing — putting the power of open data, cloud computing, machine learning, geoscience and artificial intelligence in support of law enforcement and prevention. Basically, cities are broken up into grid patterns, typically 500×500 feet. Within each grid, crime data is compiled using multiple factors and resources, such as historical data, 9-1-1 calls, recent crime reports, and residences of known offenders and parolees. Even considerations such as the time, day of week, celebrations and cyclical events are taken into account. Information derived from security cameras, license plate readers, social media and financial transactions help the algorithm. The algorithms take into account information collected by authorized wire taps, call logs and other confidential sources. The goal of the algorithms are to include all available resources to develop the most complete and reliable dataset upon which the heatmaps base their probabilities. This helps police departments allocate their resources, know what to prepare for and, most importantly, know where to be to protect the public at large.
University of Montana, Research and Training Center (Data: U.S. Census Bureau)
Police tighten their patrols around the hotspots. Throughout their shifts those hotspots are subject to change depending upon new data. Mobile units simply focus their patrol efforts accordingly. Once a threat is reported, automated navigation routing systems show police the fastest route to the incident and their expected time of arrival. Officers continue to receive intelligence about the incident while en route to anticipate the situation prior to arriving. Knowing where the areas of highest probability are expected to occur focuses non-human assets too, such as geofencing the areas of interest and monitoring more closely for key indicators. This technology is not too different than numerical weather forecasting models predicting what and where weather events will occur in the next hour, three hours, six hours and so on. Numerical models continue to evolve making forecasting more and more reliable. And, although the past does not predict the future, it is a strong indicator. The disclaimer would be similar to the ones most have seen before, “Past performance does not guarantee future returns.” Sometimes preventing a crime is saving a life, sometimes it’s protecting property and almost always it is stopping someone from doing something they will later regret. All crime cannot be prevented but for every crime that is prevented there is a family spared from tragedy.
Preventive policing does more than help keep communities safer. It improves economic viability. Crime has an inverse relationship with a community’s vibrancy. As crime increases, prosperity decreases. Real estate values go down, the tax revenue goes down, employment opportunities go down, and safety, happiness and well-being go down. Crime is a societal disease. Reducing crime reverses those affects. Home values, employment, affluence and the quality of life all go up, which correlates to increased tax revenues. Thus, reduce crime and the city’s revenues increase. That means politicians can divert money into other programs to benefit the citizens. For these reasons there is bi-partisan support for computer based policing.
If you do the research you will see opposition efforts against artificially intelligent systems to fight crime, but those opponents are not well supported. Communities want to feel safer. Politicians want to be able to say they are using the latest technologies to keep the community safe. Companies want to prove their systems work in decreasing crime and capturing criminals. Crime prediction causes the greatest concern because it borders on Minority Report, but it is the echo of Jack Maple and William Bratton putting police where they need to be to support the people they need to protect. It is the essence of community based policing.
This article only touches on the front side of GIS and law enforcement, but there is another world on the back side piecing crime scenes together with forensics in artificially replicated environments. That too is a fascinating topic to explore.
Do yourself and your neighborhood a favor. Thank the police officers in your community for the job they do. They are foundational to the fabric of our society.
According to Esri, ArcGIS Indoors applies the latest location technology to allow users to see and share where assets, rooms, departure gates and offices are located. Click to enlarge. Photo: Esri
Esri has debuted ArcGIS Indoors, which is designed to enable interactive indoor mapping of corporate facilities, retail and commercial locations, airports, hospitals, event venues, universities and more.
According to Esri, the solution applies the latest location technology to allow users to see and share where assets, rooms, departure gates and offices are located.
ArcGIS Indoors uses data streams, real-time processing and location intelligence tools to help businesses and other organizations understand how to better coordinate space and other resources with their facilities and campuses. Insights from sensor networks deliver real-time information to managers and executives through interactive dashboards, while visitors and employees can find useful information about the buildings they occupy, the company said.
The solutions also allows users to quickly access and explore critical business information, such as the location and status of fire extinguishers and their last inspection dates.
“ArcGIS Indoors brings the interior building space into the future by placing data about employees, schedules, meetings, customers and events into a geographic context,” said Nitin Bajaj, product manager at Esri. “Having spatial awareness gives executives, managers and employees better insight so they can operate more efficiently and competitively.”
According to Esri, ArcGIS Indoors will be available for widespread use by the end of 2018. In addition, a beta version of the product will be released at this year’s Esri User Conference, taking place July 9-13 at the San Diego Convention Center in San Diego, California.
A: Satellite-based and local beacon-based positioning technologies offer the best opportunity for reliable and precise location determination of an autonomous vehicle. Alternate solutions like SLAM and lane keeping are decent augmentations, but suffer from the imprecision that comes from sensing in a large dynamic environment. As satellite and local beacon-based positioning technologies become increasingly more pervasive and accurate, this will continue to yield the most reliable and deterministic solution for safe localization of autonomous vehicles.
A: No matter how good it gets, positioning technology can never ensure the safety of autonomous car passengers and pedestrians. Knowing the position of each car is insufficient; you need to know where everything else is, including children, animals and temporary construction barriers. It is simply not practical to fit everyone and everything with a positioning device that transmits to every nearby vehicle. Collision avoidance therefore needs sensors such as radar and lidar.
A: Realization of safe autonomy requires the establishment of layers of protection using safety mechanisms without dependent faults. Absolute position provided by precise GNSS and inertial technology provides an independent reference for truth test of positioning solutions obtained with vision-based technologies. Vision-based solutions may incorporate common cause faults like sight obstruction, processing algorithms or similar. Absolute positioning can also contribute to realize near-real-time updated maps.
Q: How will safety issues raised by increasing autonomous traffic — in the air and on roads — affect the GNSS industry?
Sanchit Agarwal, VP, Field Operations, Nearmap
A: Due to increasing autonomous traffic, the GNSS industry will have to adopt the concepts of collective tracking mechanisms in the shared ecosystem. Inherently, all the cars/drones (rovers) will have the sensors to track the traffic “on-the-fly” and make intelligent navigation decisions, but in case of any system malfunction, the collective tracking of devices can facilitate “social” interactions between the rovers. This will serve as an added layer of security in case an autonomous social member goes rogue!
Zak M. Kassas, Assistant Professor, University of California, Riverside
A: Future autonomous vehicles will demand full situational awareness and extremely reliable, accurate and secure navigation systems. GNSS will not meet the stringent demands of these autonomous vehicles. To address the inevitable situations where GNSS signals become unusable (due to attenuation or interference) or untrustworthy (due to spoofing), receivers should be coupled with sensors such as IMUs, lidar and cameras, and exploit the plenitude of ambient signals of opportunity such as cellular, digital TV and Wi-Fi.
Jonathan Auld, VP of Engineering and Safety Critical Systems, Novatel
A: Safety issues raised by increasing autonomous automotive and airborne traffic will escalate the product development standards and performance requirements of GNSS software, hardware, and correction services used. The GNSS industry is challenged to increase accuracy on lower cost platforms by utilizing multi-frequency, multi-constellation, sensor fusion and precise point positioning. To be able to rely on GNSS in auto-guidance applications, the industry also needs to incorporate GNSS integrity functionalities into our products.
Raytheon Company has launched its GEO 6 satellite payload into orbit for its 12-year mission. It is the latest payload to support the Federal Aviation Administration’s (FAA) Wide Area Augmentation System (WAAS), which enhances the reliability and accuracy of GPS signals for directing air travel.
The Raytheon-developed payload is a key element of WAAS, which offers commercial, business and general aviation pilots more direct flight paths, greater runway capability and precision approaches to airports and remote landing sites without dependence on local ground-based landing systems.
“This latest payload launch is the next step in our journey with the FAA to bolster navigation safety and efficiency for commercial and general aviation,” said Bob Delorge, vice president of transportation and support services for Raytheon Intelligence, Information and Services.
In June 2016, Raytheon launched WAAS GEO 5, which was recently accepted by the FAA for integration into the operational WAAS system. Both WAAS GEO 5 and GEO 6 were launched to replace aging satellites and enhance GPS precision for the FAA. WAAS increases GPS accuracy from 10 meters to approximately two meters and supports nearly all of the national airspace.
The WAAS GEO 6 payload is hosted on a geostationary satellite, SES-15, owned and operated by SES. The satellite was successfully launched May 17 from Arianespace’s Guiana Space Center in French Guiana aboard a Soyuz launch vehicle.