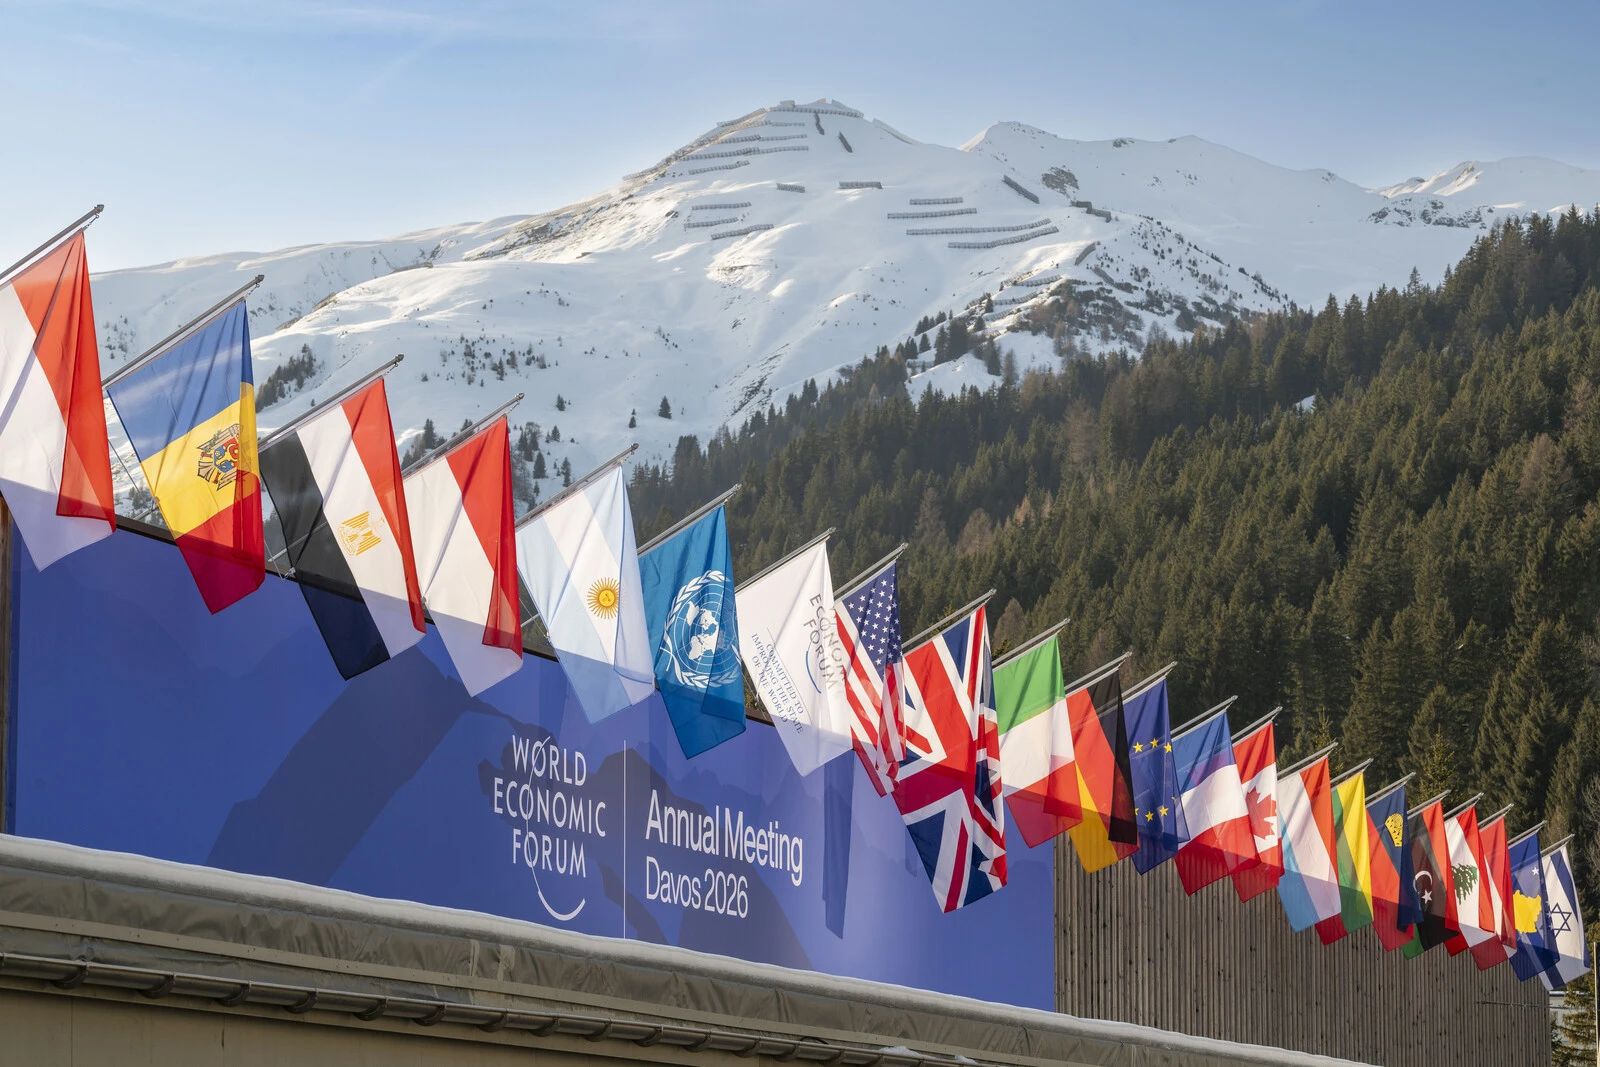
Dimetor is providing its NAVSentry airspace situational awareness system to the World Economic Forum annual meeting, in support of the Austrian Armed Forces. The meeting is taking place this week in Davos, Switzerland, close to the Austrian border.
NAVSentry is an AI-powered platform for detecting GNSS disruptions in real time, combining different technology layers and securing position, navigation and timing (PNT) data across autonomous and crewed systems from multiple data sources.
The system is providing insights into the integrity of GNSS signals to strengthen the Austrian Armed Forces’ ability to monitor, secure and protect the airspace against threats, including including jamming and spoofing attempts targeting the airspace and critical PNT infrastructure.
The enhanced situational awareness strengthens the ability to detect anomalies, assess potential threats, and coordinate protective measures across both the physical and cyber domains.
“It’s a compelling example of how modern defense increasingly also builds on trusted civilian–military technology partnerships to safeguard critical events,” said Brigadier-General Friedrich Teichmann, commander, Space Services, Austrian Armed Forces.
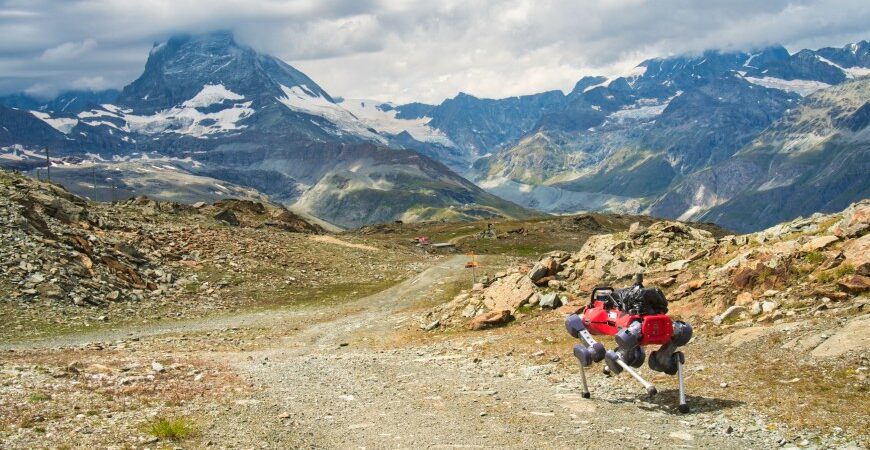
Researchers from Finland, Switzerland, Spain and Romania gathered at Tampere University in Finland for a workshop this month within the Robosat project focusing on localization of autonomous machines.
Workshop participants discussed and demonstrated novel technical solutions to improve localization, particularly of autonomous machines operating in challenging and unconstrained environments, such as forests and mountainous regions.
The Robosat project aims to change how autonomous robots navigate in the wild by integrating multi-sensor and multi-GIS data. During the Tampere workshop, partners from Tampere University (Finland),ETH Zürich (Switzerland), Universitat de València (Spain) and CITST (Romania) discussed strategies for sharing data, identifying relevant GIS and GNSS datasets, and leveraging AI for autonomous labeling of large-scale data.
Key topics included the integration of multi-sensor and multi-GIS data to enhance positioning accuracy, planning piloting tests with ETH’s ANYmal robot and TAU’s new I/Q GNSS grabber device, and discussing methods for AI-driven data labeling for massive datasets collected during field trials.
The Tampere University project team includes Elena Simona Lohan and Jari Nurmi as supervisors and Ph.D. students Yelyzaveta Pervysheva and Muhammad Safi.
The Robosat efforts supports applications in robotics, environmental monitoring, and industrial automation. By combining expertise across Europe, Robosat intends to pave the way for smarter, safer and more efficient autonomous systems.
It also aims to provide new open-access rich datasets to the research community. A first dataset enabling multimodal classification studies has already been published on Zenodo as a collaborative work between Tampere University and CITST teams.
The Robosat project
Autonomous robot navigation in the wild using satellite-based 3D geographical information (ROBOSAT)aims to provide a scalable MultiGIS high-quality data collection platform through the use of a quadrupedal robot that can autonomously perform long-distance missions in challenging environments, such as Alpes mountains or Finnish forests.
Consortium organizations are comprised of three universities and one SME:
Tampere University, Finland. Expertise: GNSS, wireless positioning, sensing, and communications, RF Fingerprinting and interference mitigation. Coordinator: Elena Simona Lohan
ETH, Switzerland. Expertise: automation, mapping, control theory, and legged-robot research. PI:Marco Hutter
The European Union Agency for the Space Programme (EUSPA) has announced the winners of the first myEUspace track “Submission of an Idea.” This track consists of promising theoretical ideas that leverage EU space data and have high market potential. Winners received a cash prize of €10,000 each.
The myEUspace competition is open to teams from all EU Member States plus Switzerland, Norway and Iceland. The competition offers a total prize of nearly €1 million and provides support to entrepreneurs throughout the entire innovation cycle, from early-stage start-ups to scale-ups.
While the evaluation of the prototypes track is ongoing, the competition remains open for the last track, “Submission of Products.” Applications for the final track are due April 25.
Depending on the maturity of the solution at the time of submission, entrepreneurs can compete and win in three different innovation areas: “Space My Life,” “Our Green Planet” and “Dive in Deep Tech.”
See the full list of winners by area of innovation:
“Our Green Planet”
• Spillalert: Intuitive web interface for oil spills and blackwater tank detection
• BugBit: Risk analysis platform for predicting and alerting of bark beetle outbreaks
• Push4CleanAir: SaaS pollution monitoring platform
• Detritus: Online platform and mobile app for waste-crime detection
• Orioos: Autonomous robotic solution for monitoring woody perennial crops
• Vantu: Van-lifers companion app to discover “off the beaten track” sites to camp for the night
“Dive in Deep Tech”
• DeGenS: Decentralized space-to-ground data availability for artificial intelligence (AI) using blockchain
• Climate AI for Web3: Real-world portable climate API for virtual worlds powered by AI and satellite data
• Latitudo Supersar: AI analysis, classification and interpretation of multi-sensor and multi-mission images
• WhisperCash: Person to person payments via satellite for isolated regions
• Kyck: Geospatial metaverse platform for exploring and sharing AR experiences in the physical world
“Space My Life”
• Foremca: Cryptographic methodology providing forensic digital proof
• MicroPURA: Microbial Purity to detect levels of microbial contamination in the air
• Space4CC: Monitoring actions to safeguard cultural heritage in conflict areas
• Oasis City Lab: AI tool to track urban threats
Safran Electronics & Defense is taking a major step forward in its inertial navigation strategy by grouping two subsidiaries, Safran Colibrys (Switzerland) and the recently acquired Sensonor (Norway,) under a single banner, Safran Sensing Technologies.
The similarities in expertise, market position, customers and technologies result in clear synergy between these two companies, which produce accelerometers, gyrometers and inertial measurement units (IMUs). The creation of Safran Sensing Technologies shows Safran’s commitment to developing its micro-sensor business through these two companies.
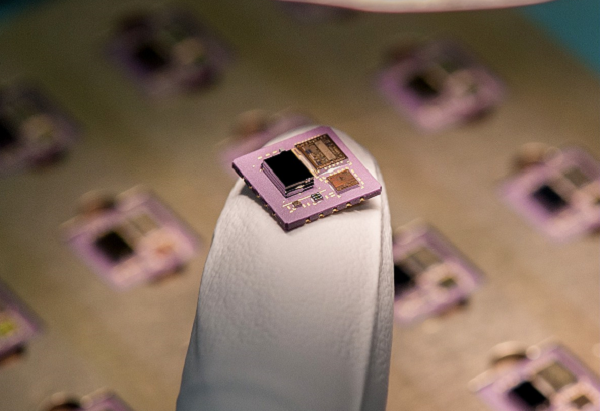
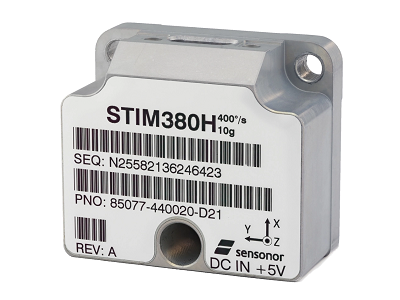
The STIM380H inertial measurement unit. (Photo: Sensonor)
The goal is to jointly offer a wider and comprehensive range of inertial technologies including vibrating sensors, optics and micro-electromechanical system (MEMS) for applications in aeronautics, defense, space and other industries.
The two subsidiaries have already delivered more than 20 million MEMS sensors to the aeronautics, defense, space, transport, mobility and industry sectors. For example, MEMS are used in the control accelerometers of automobile airbags, in high temperature accelerometers for guiding drill heads, and in seismic sensors measuring the structural health of buildings or civil engineering works. They are also used in IMUs for civil, military and space vehicles.
This change is part of a broader Safran Electronics & Defense strategy designed to strengthen the company’s position in the positioning, navigation and timing (PNT) market.
The two entities have been renamed Safran Sensing Technologies Norway AS and Safran Sensing Technologies Switzerland SA, respectively.
The 2018 DACH Country Package for Maptitude includes 4th quarter 2017 map content for Germany, Austria, Switzerland and Liechtenstein. (Photo: Caliper)
Caliper has lunched a 2018 DACH Country Package for its Maptitude mapping software. According to the company, Maptitude country packages bring the power and flexibility of its Maptitude product suite to a global audience and enable its customers to make geolocation-based decisions internationally.
The 2018 DACH Country Package includes fourth quarter 2017 map content for Germany, Austria, Switzerland and Liechtenstein. The updated map includes refreshed streets and landmarks, as well as updated travel times and improved address matching.
According to the company, users can seamlessly switch between the countries purchased, and doing so will refresh the Maptitude interface with country-specific tools, such as those for territory and sales mapping, finding, pin mapping, routing, displaying demographics and Create-a-Map Wizard.
Caliper develops geographic information systems software, and its Maptitude software is designed to be a cost-effective, professional mapping software product. Maptitude also enables organizations to leverage their location-based data to improve decision making and planning, while minimizing expenditure through competitively priced solutions, the company added.
Switzerland has signed a cooperation agreement to participate in the Galileo and EGNOS programs, the pillars of the EU’s Global Navigation Satellite System (GNSS). Switzerland will now fully financially participate in the programs, and will retroactively contribute €80 million for the period 2008-2013.
The agreement, signed in Brussels December 18, 2013, also covers cooperation in areas such as security, export control, standards, certification and industrial cooperation.
The Swiss government is not a member of the European Union, but does hold membership in the European Space Agency (ESA). Norway, another ESA member who is not a member of the EU, signed a similar agreement with the commission in 2010.
Swiss authorities will pay an annual Galileo fee of €27 million to the commission for access to Galileo services, but access to the Public Regulated Service (PRS) signals is still being negotiated. PRS signals will be restricted to authorized users by governments for sensitive applications that require a high level of continuity.
“I welcome Switzerland’s decision to fully step on board the European space programme,” said European Commission Vice-President Antonio Tajani. “This co-operation will not only help to provide better results for the EU’s satellite navigation services, it will also open up a series of business opportunities for small and medium sized enterprises both from Switzerland and the EU.”
Through its membership of the European Space Agency (ESA), Switzerland has contributed to Galileo’s development phase. For example, the state-of-the-art hydrogen-maser clocks used by the Galileo satellites originate from Switzerland. Such extremely accurate clocks are crucial to a number of sectors. Wireless telecommunication networks use Galileo satellites’ timing signal for network management, for time tagging and for synchronization of frequency references. Certified time stamps are also necessary for applications such as electronic banking, e-commerce, stock transactions, quality assurance systems and services.
With the signing of this agreement Switzerland will now participate in the EU satellite navigation programs and in their committees and working groups.
Studies show that Galileo will deliver around €90 billion to the EU economy over the first 20 years of operation, while from now until 2020, the EU will spend €7 billion on satellite navigation. Switzerland’s financial contribution for the period 2014-2020 will be calculated in accordance with the standard formula1 applied for the Swiss participation in the EU research Framework Programme.
By Simon Lutz, Marc Troller, Donat Perler, Alain Geiger, and Hans-Gert Kahle
A team of Swiss researchers is using data from a network of GPS receivers and the technique of tomography to obtain profiles of how moisture is distributed with height, which might lead to better weather forecasts.
INNOVATION INSIGHTS by Richard Langley
WEATHER FORECASTING IS STILL AN IMPERFECT ART. Humankind has been trying to predict the weather for millennia. Early attempts were based on general observations such as “Red sky at night, shepherd’s delight; Red sky in morning, sailor’s warning.” But it was only with advances in scientific thought and the invention of measuring devices, such as the mercury barometer, that more specific predictions could be made.
Towards the end of the 18th century, the father of modern chemistry, Antoine Laurent Lavoisier, said “It is almost possible to predict one or two days in advance, within a rather broad range of probability, what the weather is going to be; it is even thought that it will not be impossible to publish daily forecasts, which would be very useful to society.”
Forecasting ability has improved over the years as measurement technology, communications, and the understanding of atmospheric processes have improved. Meteorologists use measurements from various types of sensors together with mathematical models describing the physics of the atmosphere to predict its future state. The temporal and spatial density of the measurements and the sophistication of the models have a direct impact on the success of the forecasts. Weather stations on the Earth’s surface, radar installations, radiosondes, and satellite sensors all provide data for modern forecasts. Yet better sampling of the current state of the atmosphere, particularly the distribution of water vapor, is required to produce more accurate and more timely forecasts of its future state. GPS can help.
The signals from the GPS satellites must transit the atmosphere on their way to a receiver on the Earth’s surface. The atmosphere’s atoms and molecules slow down the signals so that they arrive slightly later than they would if the Earth was surrounded by a vacuum, and this effect shows up in the GPS receiver measurements. The receiver or measurement processing software needs to remove or model the effect to obtain accurate receiver positions. On the other hand, if all parameters affecting GPS measurements such as satellite and receiver coordinates are well known, then the delay imparted by the atmosphere can be estimated. It is possible to separate the effect of water vapor from that of the dry gases such as nitrogen, oxygen, and carbon dioxide and to provide a measure of the atmosphere’s moisture content. Several national weather agencies are ingesting such estimates from networks of GPS receivers into experimental or operational numerical weather forecast models. But these values represent an integrated measure of moisture above a receiver. Profiles of how moisture is distributed with height would be more useful and might lead to better weather forecasts. In this month’s column, a team of Swiss researchers discuss how they use data from a network of GPS receivers and the technique of tomography to obtain such profiles.
“Innovation” features discussions about advances in GPS technology, its applications, and the fundamentals of GPS positioning. The column is coordinated by Richard Langley, Department of Geodesy and Geomatics Engineering, University of New Brunswick.
Water vapor plays an essential role in the dynamics and thermodynamics of the atmosphere — especially storm systems — on local, regional, and global scales. It is a precursor of precipitation. Furthermore, a significant fraction of the energy released to the atmosphere comes from water vapor via latent heat. And much of the “greenhouse effect” is caused by the presence of water vapor in the atmosphere.
Beginning in 1992, a number of researchers successfully tested the hypothesis that the Global Positioning System (GPS) could be used to detect long- and short-term global and regional air-mass changes by estimating the amount of water vapor in the air above a GPS receiver. The arrival of GPS signals at a receiver is delayed by the presence of the Earth’s atmosphere. The satellite signals slow down when they encounter the atmosphere’s electrons, atoms, and molecules. In particular, the signals are affected by the presence of water vapor. Through a careful analysis of the GPS receiver’s measurements, the amount of water vapor along the signal path can be estimated. This is an integrated value that depends on the density of the water vapor molecules, or alternatively, the associated humidity at each point along the signal path. But from a single integrated value, there is no way to determine the profile of humidity — how the humidity varies with height above the surface. However, if a network of GPS receivers is deployed over a region, it is possible to determine the three-dimensional structure of humidity in the atmosphere above the receivers using tomography in a similar way to that used for medical imaging — albeit with radio waves rather than X-rays.
At the Swiss Federal Institute of Technology in Zurich (familiarly known by its German abbreviation ETH), we have developed the Atmospheric Water Vapor Tomography Software (AWATOS) for estimating humidity profiles. We have tested it with data from various measurement campaigns, including one in Hawaii. We have also used it to determine 40 humidity profiles over Switzerland with data from the Automated GNSS Network for Switzerland (AGNES) of the Swiss Federal Office of Topography, Swisstopo. And recently, we have implemented it in an operational testbed analyzing AGNES data together with observations from the Automated Swiss Weather Station Network (ANETZ) of the Swiss Federal Office of Meteorology and Climatology, MeteoSwiss.
To assess the potential of ground-based GPS water vapor tomography to support meteorological forecasting systems, the tomographic results must be available within near real-time and must be produced with an accuracy comparable to that of existing meteorological measurement techniques and numerical weather prediction models. With those goals in mind, we have carried out a project to determine humidity profiles in a region of the Swiss Alps. In this article, we outline the project, including the background theory, and discuss how we validated the results by comparing them to radiosonde measurements and weather prediction models.
Theoretical Background
Before looking at the project, we will briefly describe the theory behind our tomographic technique.
Radio Wave Refractivity. The propagation of radio waves through the Earth’s ionosphere and the electrically neutral atmosphere (the air) is accompanied by phase and amplitude variations caused by the varying refractive index of the media. Since the effect of the ionosphere on GPS signals can be removed almost completely by processing measurements on both the L1 and L2 frequencies, we are only concerned with the effect of the neutral atmosphere here. In 1951, Essen and Froome published a general formula for the refractive index of air, n, and the corresponding atmospheric refractivity, N, using the three meteorological parameters: total (barometric) air pressure, p, measured in hectopascals; air temperature, T, in kelvins; and the partial pressure of water vapor, e, in hectopascals (see Equation 1). The associated empirically determined constantsk1, k2,andk3 have been continuously improved over the years.
In the weighted mean formula for non-dispersive radio wave refractivity for air with 0.0375 percent carbon dioxide content, k1 is set to 77.6890 kelvins per hectopascal, k2 to 71.2952 kelvins per hectopascal, and k3 to 375463 kelvins-squared per hectopascal. The k1 term of Equation 1 can be associated with dry refractivity (Ndry), the refractivity of the dry constituents of air, and the second and third terms with the wet part (Nwet), which is proportional to the partial water vapor pressure.
Tropospheric Refraction. The speed of propagation of a radio wave is governed by the refractivity or index of refraction along the signal (slant) path. The path itself is determined by Snell’s Law relating angle of incidence to angle of refraction at the boundary of two media with differing refractive indices. As mentioned previously, GPS measurements include the additional or excess delay due to the presence of the neutral atmosphere. Since the bulk of the effect occurs in the lower, denser part of the atmosphere — the troposphere — we commonly refer to it as the tropospheric delay. The tropospheric slant path delay, , between station p and satellite r is defined by the following integral along the signal ray path, s:
By integrating the individual components of N in Equation 2 and applying Equation 1, the tropospheric slant path delay can be written as a function of the meteorological parameters p, T, and e.
Tropospheric delay as a function of the observation zenith angle, , (90° minus the elevation angle) is calculated using appropriate mapping functions. The mapping function, , is defined as the ratio of the electrical path length through the troposphere at a particular geometrical zenith angle to the electrical path length in the zenith direction. Typically, separate mapping functions are used for the dry and wet components. Furthermore, the slant wet delay, , for elevation angles down to 3 degrees can be represented as the sum of the isotropic term, ZWDp (zenith wet delay at station p) with its corresponding mapping function, and a non-isotropic component, :
The Tomographic Voxel Model. Separate slant delays only provide integrated measures of the tropospheric refractivity — a one-dimensional view, if you like. To get the three-dimensional structure of refractivity, we need a different approach. We divide the troposphere into small volume elements or voxels (short for volumetric pixel). With multiple, simultaneous raypaths criss-crossing the model volume, it is possible, in principle, to estimate the refractivity of each voxel and hence get a height profile of refractivity.
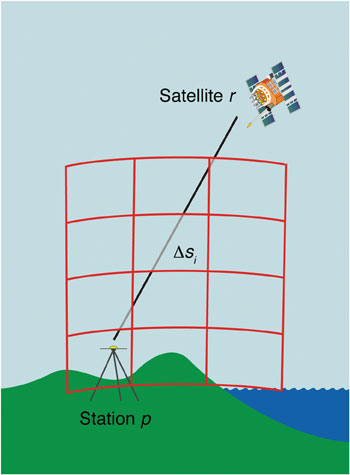
The tomographic voxel model is a three-dimensional geometrical structure with ellipsoidal borders. The grid spacing defines the resulting resolution of the tomographic analysis. In the horizontal plane, the voxel model covers the whole catchment area. For each voxel, an unknown but constant refractivity is introduced. Figure 1 illustrates the principle by means of one single observation.
FIGURE 1 Principle of GPS tomography. The refractivity in the atmosphere along the raypath of a GPS satellite signal to a ground-based receiver is discretized by a three- dimensional voxel model.
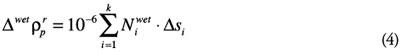
According to Equation 2, the wet part of the slant path delay ( ) for one observation between station p and satellite r can be expressed as a summation over each individual voxel i of the voxel model with a total of k voxels, through which the GPS signal passes:
The refractivity value, Ni, of each voxel is determined by performing a least-squares adjustment. A priori models and inter-voxel constraints can be introduced into the tomographic inversion system. The a priori tomographic model consists of selected voxels, which have externally estimated refractivity values. Inter-voxel constraints provide a spatially smoothing characteristic, as the actual state (or the refractivity) of the atmosphere is smoothly changing from point to point.
Double-Difference GPS Tomography. The software package AWATOS is based on double-difference GPS observations; that is, the difference of measurements made by a pair of receivers between a pair of satellites. Common errors such as those of satellite and receiver clocks difference out. The remaining errors in the observation equation are primarily just those due to atmospheric refraction. The influence of the ionosphere can be corrected to first order by using a linear combination of dual-frequency data as previously mentioned.
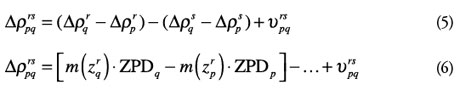
Therefore, in double-difference processing, the tropospheric slant path delay, , can be reconstructed by combining four observations (between two stations p and q and two satellites r and s). Similar to Equation 3, the total double-difference path delay, , can be written as a function of the GPS processing output (the zenith path delay, ZPD, and the double-difference phase residual ):
Usually, the dry and wet path delays are treated individually with appropriate models and mapping functions. This separation is carried out within the software package AWATOS for both the path delays and the phase residuals.
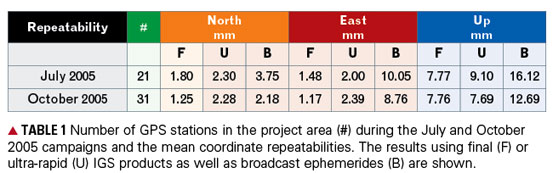
Introducing the double-difference slant path delays, , as well as the estimation of the zenith total delays, ZTD, for each station, a priori refractivity values, N0, and inter-voxel constraints , (with the scalar product condition ), into the tomographic equation system, the final form of the inversion equation for the unknown refractivity, N, according to Equation 4 including the design matrix A of the observations is:
To obtain only the wet part of the resulting refractivity field (values of refractivity and their gradients, , the individual components of the tomographic observation vector (the left-hand side of Equation 7) have to be correspondingly preprocessed. This is done by introducing additional meteorological observations or numerical data as well as tropospheric mapping functions and models.
Data Description
We recently carried out two measurement campaigns to study the feasibility of our method on a non-permanent densification network in the Swiss Alps. We were interested in investigating such a small-scale high-resolution configuration to see how it can help to determine and model water vapor over a local, mountainous catchment area. We also carried out these campaigns with an eye towards the development of a near real-time analysis procedure with a high update rate of less than one hour and the potential to support short- and medium-range weather forecasts and hydrological hazard assessment.
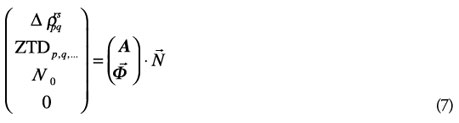
The Project Area. Two field campaigns, each lasting seven days, were carried out in an area of about 50 kilometers by 50 kilometers in the eastern part of the mountainous canton of Valais in the southwest of Switzerland (see Figure 2) in July and October 2005. This region was selected because of its high degree of exposure to hydrological hazards such as flooding of river valleys.
Figure 2. Project area (identified by the rectangle) in the Swiss Alps in the southwest of Switzerland. The elevation of the topography varies from 500 meters to over 4000 meters above mean sea level.
Besides the impact of the fast-changing meteorological situation in the project area, the rough topography is also a challenge for high-precision GPS analysis because of limited fields of view.
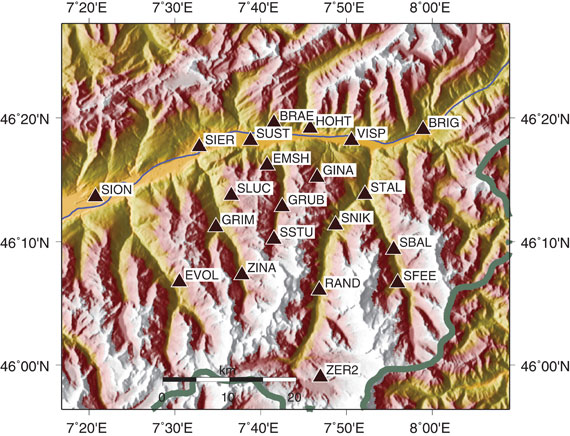
GPS Network and Meteorological Data. Ground-based geodetic GPS stations with dual-frequency receivers were deployed for continuous measurement during the period of the two campaigns. The network was complemented by permanent GPS stations from the national network. The ensemble of all stations used in July 2005 is portrayed in Figure 3.
Figure 3. The 21 GPS stations in the project area in the mountainous canton of Valais (see also Figure 2) used during the measurement campaign in July 2005. The stations’ altitudes vary between 527 meters (SION) and 3119 meters (ZER2).
In October 2005, the non-permanent three-dimensional geodetic Turtmann network was operated with six additional stations in the vicinity of the stations BRAE, SUST, and EMSH (see Figure 3). Furthermore, for this second campaign, data from three stations of the permanent geodynamics/tectonics network in Valais, TECVAL, in the northwestern part of the project area was available.
Several GPS stations were collocated with non-permanent meteorological measurement systems collecting surface temperature, humidity, and air pressure data. Also, rainfall was recorded for validation purposes at five ANETZ stations within the project area. The temperature, humidity, and air pressure observations were processed with the software package Collocation of Meteorological Data for Interpolation and Estimation of Tropospheric Path Delays (COMEDIE) developed at the Geodesy and Geodynamics Lab, ETH Zurich. COMEDIE provides a four-dimensional modeling of meteorological data in space and time. It is based on the method of least-squares collocation and interpolation, meaning that the model is described by a functional and a stochastic part. The interpolated data was used for the separation of the total delay (and refractivity) into a dry and a wet part and to obtain a priori values, N0, for the tomographic analysis (see Equation 7).
To compare the results from GPS processing and tomography, independent measurement techniques were used during the measurement campaigns: solar spectrometry, using the Geodetic Mobile Solar Spectrometer (GEMOSS), for integrated path delays as well as weather balloon soundings up to the tropopause for meteorological profile data.
The Numerical Weather Model COSMO-7. MeteoSwiss uses the COSMO-7 model, developed by the Consortium for Small-scale Modelling, for its operational numerical weather forecasts. The model domain is covered by a grid of 383 × 325 points over western and central Europe with a horizontal resolution of 7 kilometers. The model consists of 45 levels vertically distributed between the filtered orography (or mountain topography) and an altitude of 22.5 kilometers.
For comparison and validation, a subset of the reanalyzed COSMO-7 vertical grid point profile data was processed in order to obtain refractivity profiles as well as integrated and interpolated time series of zenith path delays using another of our software packages, Collocation and Interpolation of Tropospheric Path Delays (COITROPA).
Results
We processed the GPS data from the two measurement campaigns and have compared the results with those from GEMOSS, COMEDIE, radiosonde data, and COSMO-7.
GPS Data Processing. The GPS processing yields high-quality receiver coordinates, tropospheric parameter estimates (ZPD), and ionosphere-free double-difference residuals to reconstruct the slant path delays (see Equation 5). International GNSS Service (IGS) precise products, including satellite orbits, were used to analyze the data, and for ray tracing in AWATOS.
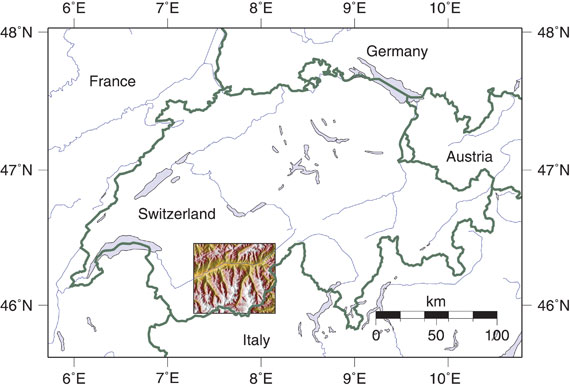
Bernese GPS Software, version 5.0, was chosen for the processing of the GPS data due to its flexibility, modular design, and state-of-the-art modeling characteristics. The network solution was obtained by using minimally constrained coordinates of selected stations of the IGS reference frame with baseline lengths of up to 1,000 kilometers. The mean repeatabilities for the north, east, and up components of the daily coordinate solutions for all stations within the project area are given in Table 1. Final as well as ultra-rapid orbits and broadcast ephemerides were used to compare the best possible results with those that could be expected in real time.
The larger number of stations during the October campaign has a positive influence on the mean coordinate repeatabilities in the horizontal plane, whereas the up component remains at the same order of magnitude. Depending on the antenna and receiver types, there was a slightly positive or negative correlation discovered between the trend of the daily coordinates and the ZTD estimates.
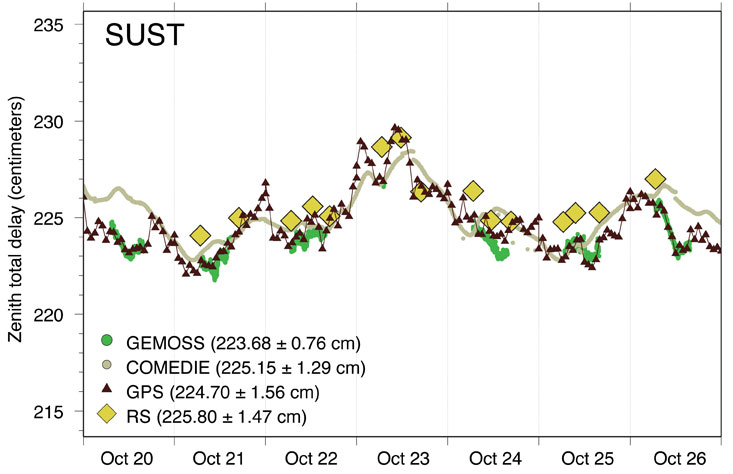
Comparison of ZTD Time Series. The time series of zenith total delays (ZTD) from GPS, GEMOSS, integrated ground meteorological data (COMEDIE), and radiosondes coincide well. In particular, the passage of a cold front with heavy rainfall in the middle of the October 2005 campaign is reflected in the two local delay maximums on October 23 (see Figure 4).
Figure 4. Comparison of zenith total delay (ZTD) at station SUST obtained with COMEDIE, GPS, the local radiosondes (RS) and solar spectrometry (GEMOSS) for the October campaign in 2005. The mean values of the ZTD time series and the standard deviation are given for each technique for comparison purposes in parentheses.
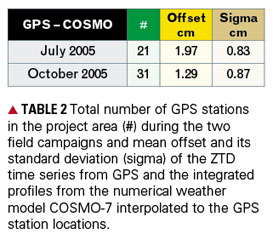
The ZTD from the balloon soundings show an almost systematic overestimation. This may be due to an inaccurate self-calibration of the sensors or a lack of data in the upper atmosphere, and the related mismodeling of the zenith path delay. Differences in the COMEDIE time series are due to meteorological inhomogeneities in the lowest part of the troposphere and the influence of distant radiosondes, which were added to get the vertical information in the upper part. The interpolated ZTD values derived from the numerical weather model COSMO-7 are on average smaller than the GPS estimates (see Table 2).
The ZTD time series of both methods, GPS and the numerical weather model, correlate well with rainfall data. There is a slow increase of the zenith path delay before the precipitation event due to the accumulation of atmospheric water vapor and an abrupt decrease afterwards. Usually, the impact of short periods of localized precipitation is more clearly represented in the GPS data of the dense observation network than in the data of the weather model. The COSMO-7 time series seem to be too smooth.
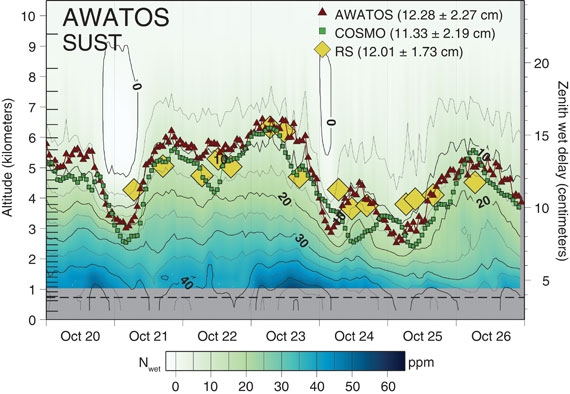
Effect of Voxel Model Resolution. In order to assess the quality of the results obtained by applying the high-resolution GPS tomographic technique, special time series contour plots were created. They consist mainly of the wet refractivity profiles for each voxel model column between mean sea level and an altitude of 10 kilometers. The height of the nearest GPS station is given by a dashed line.
Figure 5 and Figure 6 give two examples from station SUST in the northwest of the project area (see Figure 3) during the October 2005 campaign. Figure 5 shows the wet refractivity variation from a 16-layer voxel model with 5-kilometer horizontal grid spacing, whereas Figure 6 was calculated with 32 layers with the same horizontal resolution.
Figure 5. Vertical wet refractivity distribution (in parts per million) from a 16-layer voxel model (the increasing vertical distances with height of the voxels are given by black tick marks on the left-hand side) in October 2005. The time series of integrated wet delays (ZWD) from 15 radiosondes (RS), the interpolated profiles from the numerical weather model COSMO-7, and the GPS tomographic results (AWATOS) are shown for comparison purposes with a corresponding scale on the right-hand side. Mean values and their standard deviations are shown in parentheses
Figure 6. Vertical wet refractivity distribution (in parts per million) from a 32-layer voxel model over the timespan of the October campaign in 2005 and ZWD time series of integrated AWATOS, COSMO-7, and the corresponding radiosonde (RS) profiles for comparison purposes.
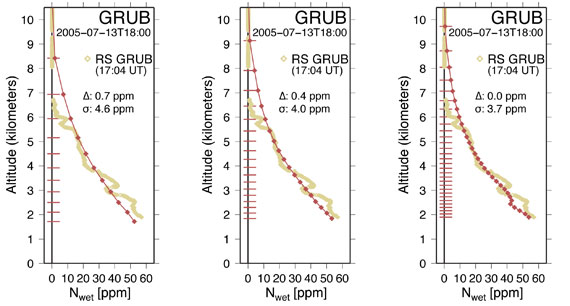
The integrated wet refractivity profiles and the reference radiosonde measurements agree better the more layers that are introduced into the tomographic voxel model. The largest differences between the results with different numbers of layers can be detected in the middle troposphere between 4- and 6-kilometers altitude (see Figure 7). It is also recognizable that in the lower troposphere, voxel models with a large number of layers are even able to resolve refractivity inversions.
Figure 7. Tomographic wet refractivity profiles (in parts per million) from 16-, 26-, and 43-layer voxel models, and that of the corresponding radiosonde (RS) launched at station GRUB at 1844 meters above mean sea level on July 13, 2005, 17:04 UTC.
We analyzed tomographic voxel models with horizontal resolutions of 15, 10, 7.5, 5, 3.75, and 3 kilometers. Increasing the horizontal resolution of the model leads to an increase in the estimated wet refractivity above an altitude of 6 kilometers compared to both the radiosondes and the numerical weather model. Due to the mean distance of about10 kilometers between the ground-based GPS stations in the project area, the best results were obtained with a similar resolution.
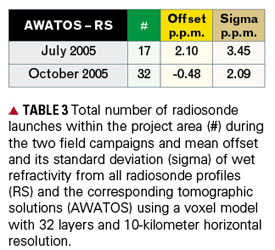
Table 3 gives the results of the comparison between the wet refractivity profiles of the tomographic analysis and the radiosondes launched within the project area.
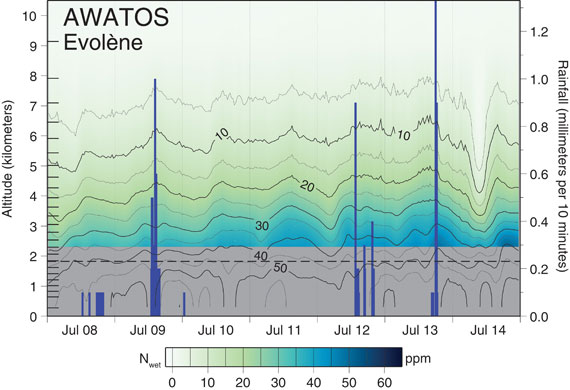
Effect of Temporal Resolution. The tomographic results shown here are based on one-hour time windows for the GPS double-difference data. Higher update rates are also possible without changing the input options of AWATOS. Figure 8 shows the wet refractivity variation based on a 10-minute window together with rainfall data at the ANETZ station Evolène in the western part of the project area.
Figure 8. Wet refractivity distribution at station Evolène (EVOL) in the western part of the project area from a 26-layer tomographic voxel model with an update interval of 10 minutes. Rainfall data in millimeters per 10 minutes is shown as vertical bars with the corresponding scale on the right-hand side.
Even though the wet refractivity profiles are affected by higher-frequency variations in the upper troposphere, precipitation and weather changes are still recognizable in the 10-minute time series.
Although the Bernese GPS Software is not designed for real-time parameter estimation, near real-time conditions can be simulated by introducing specific input files. Thus, the sensitivity of AWATOS to real-time conditions can be assessed. In terms of coordinate repeatability, the results of the horizontal components degrade by about 30 percent when using the predicted part of the ultra-rapid products (see also Table 1). Using broadcast ephemerides, the three-dimensional accuracy suffers even more.
Implications. We collected input data for both the spatially and temporally high-resolution GPS tomographic analysis and the validation of the results. The inhomogeneous distribution of rainfall in the local project area would necessitate even more rain gauges in the meteorological measurement network to perform a hydrological hazard assessment.
The comparison of independent techniques showed that the ZTD time series agree within 2 centimeters on average; that is, to better than 1 percent. The correlation of the GPS data and the data derived from the numerical weather model is greater than 70 percent. However, local rain showers are sometimes more clearly represented by the data of the dense GPS network than by COSMO-7.
It is possible to increase the spatial and temporal resolution in GPS tomography, so it can enhance numerical weather models. The better agreement of the tomographic profiles with radiosonde data, compared to the COSMO-7 estimates, indicates that the numerical weather prediction models will benefit from additional information on the vertical distribution of water vapor provided by high-resolution GPS tomography.
To assess the potential of near real-time GPS tomography, IGS satellite products with short latency and fast update rates were tested in the GPS processing. With ultra-rapid orbits, we obtained satisfactory results for the tropospheric parameters in almost real-time mode. The use of predicted orbits in the tomographic processing degrades the results of the wet refractivity profiles by 20 percent compared to using final (that is, best available) products.
Conclusions
In this brief article, we have shown that high-resolution GPS tomography is well suited for application in mountainous regions, especially in view of its potential to contribute to hydrological hazard assessment. We have been able to estimate the wet refractivity field with a spatial
and temporal resolution comparable with the current and the next generation of numerical weather models (COSMO-2 with 2-kilometer horizontal resolution).
We have been successful in illustrating several beneficial aspects of GPS tomography in supporting high-resolution numerical weather prediction models. We would also point out that tomographically determined wet refractivity fields may also be used in conjunction with directly estimated integrated slant path delays to adjust the GPS observations, especially those obtained at low elevation angles. Implemented in GPS processing software, GPS tomography could provide completely anisotropic tropospheric corrections for very high-accuracy positioning applications.
Acknowledgments
The research discussed in this article was financially supported by the Swiss National Science Foundation and the Swiss Geodetic Commission.
The Swiss Federal Office of Meteorology and Climatology, MeteoSwiss, and the Swiss Federal Office of Topography, Swisstopo, provided necessary data sets for processing, analyzing, and validating the results.
Furthermore, O. Heller and Dr. A. Somieski supported the field work and several residents or public organizations in the canton of Valais offered their premises for temporary mounting of the campaign measurement systems.
SIMON LUTZ is a research fellow at the Astronomical Institute of the University of Bern, Switzerland, and a member of the Center for Orbit Determination in Europe analysis center team. He received M.S. and Ph.D. degrees in geodesy and geodynamics from the Swiss Federal Institute of Technology (ETH), Zurich, Switzerland.
MARC TROLLER is a communications, navigation, and surveillance (CNS) expert at Swiss Air Navigation Services Ltd., Skyguide, Switzerland. He received M.S. and Ph.D. degrees in geodesy and geodynamics from ETH Zurich.
DONAT PERLER is a Ph.D. candidate at ETH Zurich. He received an M.S. degree in computer science from ETH Zurich.
ALAIN GEIGER is a professor in the Geodesy and Geodynamics Lab of the Institute of Geodesy and Photogrammetry at ETH Zurich. He received an M.S. degree in physics and a Ph.D. in geodesy and geodynamics, both from ETH Zurich.
HANS-GERT KAHLE is professor emeritus of geodesy and geodynamics at ETH Zurich and was leader of the Geodesy and Geodynamics Lab from 1979 to 2009. He received a Ph.D. degree from the University of Kiel, Germany, and the habilitation in geophysics from ETH Zurich.
FURTHER READING
• Seminal Paper on Use of GPS for Meteorology
“GPS Meteorology: Remote Sensing of Atmospheric Water Vapor Using the Global Positioning System” by M. Bevis, S. Businger, T.A. Herring, C. Rocken, R.A. Anthese, and R.H. Ware in Journal of Geophysical Research, Vol. 97, No. D14, 1992, pp. 15787–15801, doi:10.1029/92JD01517.
• Other Studies on Using GPS to Monitor the Atmosphere
“Using the Global Positioning System to Study the Atmosphere of the Earth: Overview and Prospects” by J.L. Davis, M.L. Cosmo, and G. Elgered in GPS Trends in Precise Terrestrial, Airborne, and Spaceborne Applications edited by G. Beutler, G.W. Hein, W.G. Melbourne, and G. Seeber, editors, Volume 115 of the International Association of Geodesy Symposia, Springer Verlag, Berlin, 1996, pp. 233–242.
“GPS Meteorology: Direct Estimation of the Absolute Value of Precipitable Water” by J. Duan, M. Bevis, P., Fang, Y. Bock, S. Chiswell, S. Businger, C. Rocken, F. Solheim, T. van Hove, R. Ware, S. McClusky, T.A. Herring, and R.W. King in Journal of Applied Meteorology, Vol. 35, No. 6, 1996, pp. 830–838, doi:10.1175/1520-0450(1996)035<0830:GMDEOT>2.0.CO;2.
• Effect of the Atmosphere on GPS Positioning
“Atmospheric Modelling in GPS Analysis and Its Effect on the Estimated Geodetic Parameters” by T.R. Emardson and P.O.J. Jarlemark in Journal of Geodesy, Vol. 73, No. 6, 1999, pp. 322–331, doi:10.1007/s001900050249.
“Determination of the Spatial and Temporal Variation of Tropospheric Water Vapour Using CGPS Networks” by M. Troller, A. Geiger, E. Brockmann, and H.-G. Kahle in Geophysical Journal International, Vol. 167, No. 24, 2006, pp. 509–520, doi:10.1111/j.1365-246X.2006.03101.x.
“Diagnosis of Three-Dimensional Water Vapor Using a GPS Network” by A.E. MacDonald, Y. Xie, and R.H. Ware in Monthly Weather Review, Vol. 130, No. 2, 2002, pp. 386–397, doi:10.1175/1520-0493(2002)130<0386:DOTDWV>2.0.CO;2.
“3-D Refractivity Field from GPS Double Difference Tomography” by M. Troller, B. Bürki, M. Cocard, A. Geiger, and H.-G. Kahle in Geophysical Research Letters, Vol. 29, No. 24, 2149, 2002, 4 pp. doi:10.1029/2002GL015982.
• Radio Wave Refractivity of Air
“Refractive Index Formulae for Radio Waves” by J.M. Rüeger in Proceedings of the XXII International Federation of Surveyors (FIG) International Congress, Washington, D.C., April 19–26, 2002.
• Previous GPS World Articles on Tropospheric Propagation Delay