GPS World is celebrating its 35th birthday in 2025 by welcoming back longtime editor Tracy Cozzens as Editor-at-Large.
A subsidiary of Cleveland-based North Coast Media, GPS World is a business-to-business media brand covering GPS, GNSS and Complementary positioning, navigation and timing solutions and trends.
“Serving this highly technical market for 20 years, I have been privileged to build wonderful relationships with many technology innovators,” Cozzens said. “I simply couldn’t stay away from what I know — GPS, GNSS and PNT — and whom I know. There’s nothing like our industry when it comes to non-stop technology breakthroughs that broadly advance our world.”
Cozzens returns to bring her deep industry insight and editorial leadership at a time when rapid innovation is reshaping GNSS/PNT landscapes.
“As a 35th birthday gift to our loyal family of GPS World marketing partners, and unmatched audience of readers — qualified/audited GPS/GNSS/PNT buyers and specifiers — we wooed Tracy Cozzens out of retirement,” said GPS World Sales Director Tod McCloskey. “Tracy’s award-winning gumshoe reporting and stellar content-creation skills for decades have helped keep industry leaders informed on GPS, GNSS and PNT technology trends. Now, Tracy also will help shape the content calendars for GPS World’s market-leading magazine, website, e-newsletters and social media.”
Cozzens will report directly to GPS World Editor Diane Sofranec.
Tracy Cozzens has helped to run GPS World for more than 17 years—first as Managing Editor and then, since June 2019, as Senior Editor. She has covered everything under the sun pertaining to GNSS, always providing readers real-time and fascinating news. She has also maintained the website, helped with print magazine production, and performed many other tasks. Now, Tracy is retiring and handing the reigns over to our new Managing Editor, Maddie Saines. Tracy has worked diligently to pass on her knowledge and enthusiasm to ensure the ongoing success of this publication.
Her ideas, angles, journalistic experience and passion will be dearly missed. GPS World’s staff wishes Tracy a wonderful and relaxing retirement!
TRACY’S TOP 17
One of her recent stories with the greatest number of hits for each of her 17 years with GPS World:
When I was a kid in the 1960s, I was entranced by the vision of the future. Decades later, we’re here, with personal jetpacks nowhere in sight. What gives?
Photo: Photo: ridvan_celik/E+/Getty Images
When I was a kid in the 1960s, I was entranced by the vision of the future offered by science fiction books, movies, television shows and comics. Advances in technology would deliver us so many wonders — flying cars, hoverboards, robot servants. Disneyland was in on it, with an entire section of the park named Tomorrowland and its now-quaint “Carousel of Progress” attraction.
But the coolest thing would be that jetpack. You could slap it on your back and take off into the atmosphere, traveling wherever you wished like a bird. Certainly by the distant year 2020, we would all be jetting around the atmosphere from place to place.
(It didn’t occur to me that would mean strapping an actual jet engine to my body, along with highly flammable jet fuel. Where’s the fun in that?)
Decades later, we’ve all arrived in the “future,” with personal jetpacks nowhere in sight. What gives?
Then again, what I didn’t imagine in our future was a system that could pinpoint my exact location anywhere on the globe, estimate my time of arrival, and tell me about the traffic up ahead.
Back in the 1960s, that was seriously science fiction. Nor did we accurately predict the effect that capability would have on our daily lives. GPS along with internet-capable smartphones have thrust us into the Information Age.
The internet is a promise delivered, in its own way. Having a repository for all of the world’s information was another future concept, but usually envisioned with a giant worldwide computer that eventually turned on its makers.
As for flying cars, we are gradually getting there. Drone technology, supported by GNSS technology for its navigation, has led to unmanned craft and is heading toward vehicles capable of transporting people. We just need to be a little more patient.
In the spirit of looking back and ahead, check out our 30th Anniversary Supplement, which arrived with this issue. In it, experts from across the industry share memories and thoughts, and gaze into their crystal balls to predict the future of GNSS.
Not just supporting players, alternative positioning, navigation and timing (PNT) systems strengthen, augment and — when needed — replace GNSS. We explore how companies are using alternative PNT, and talk with John Fischer of Orolia and Alexis Guinamard of SBG Systems about their companies’ latest developments.
Since the 1990s, GPS has provided the United States military with a substantial tactical edge. Civilian GPS applications are now deeply embedded in every aspect of our lives. The U.S. Department of Transportation recently reaffirmed that GPS’ positioning, navigation, and timing (PNT) services are critical to the safe and efficient use of the national transportation system, and a Feb. 12 presidential executive order declared that satellite-based PNT services “have become a largely invisible utility for technology and infrastructure.”
It has long been equally well known, however, that GPS is vulnerable to accidental and intentional interference (the latter known as jamming), spoofing, and degradation or denial of signals. Additionally, GPS satellites are increasingly vulnerable to damage or destruction by space debris or intentional attack. The executive order mentioned above declared it U.S. policy “to ensure that disruption or manipulation of PNT services does not undermine the reliable and efficient functioning of [the country’s] critical infrastructure.”
Protecting PNT requires not just strengthening GPS, but also developing alternative sources of PNT data and ways to integrate them into the myriad systems that currently rely on GPS.
The National Timing Resilience and Security Act of 2018 (passed by the U.S. Senate as part of that year’s Coast Guard authorization act), called for “a complement to and backup for” the GPS timing component “to ensure the availability of uncorrupted and non-degraded timing signals for military and civilian users in the event that GPS timing signals are corrupted, degraded, unreliable or otherwise unavailable.” It mandated the procurement of a wireless, terrestrial system that would provide wide-area coverage and be synchronized with UTC, resilient and extremely difficult to disrupt or degrade, able to penetrate underground and inside buildings, and capable of deployment to remote locations.
A report released on April 8 by the Department of Homeland Security (DHS), however, recommends “that responsibility for mitigating temporary GPS outages be the responsibility of the individual user and not the responsibility of the federal government.” It points out that research by one of DHS’ agencies “shows that users can mitigate short-term GPS disruptions (e.g., inability to read a GPS signal) with various strategies, ranging from using local backup capabilities to delaying operations until GPS is restored.” The report then focuses on “mitigation against long-term or permanent disruption or loss of GPS PNT capabilities.” It determines that the PNT functions in critical infrastructure “are so diverse that no single PNT system, including GPS, can fulfill all user requirements and applications” and notes that maximum resilience is found in diversity of solutions. Therefore, it recommends that the federal government “encourage adoption of multiple PNT sources [to expand] the availability of PNT services based on market drivers.”
In the interviews below, I discussed these challenges with John Fischer, vice president of Advanced R&D at Orolia, and Alexis Guinamard, chief technical officer of SBG Systems.
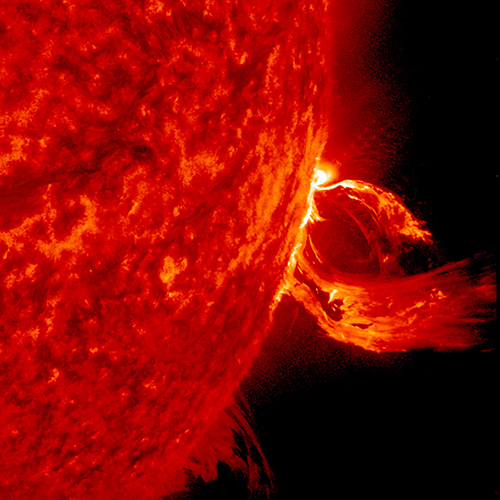
A solar flare in 2015. (Photo: Photo: Solar Dynamics Observatory, NASA)
You wake up and turn on the TV. Your usual shows aren’t airing. You flip on the radio and learn that the Paris and Tokyo stock markets have closed. Back on TV, CNN is trying to use Skype in an attempt to cover what’s happening around the world following a solar superstorm.
In a U.S. bunker, the military has lost contact with armed drones flying over hostile areas in the Middle East. Loss of global communication satellites makes it difficult to send commands and surveillance data to soldiers, ships and aircraft, rendering them vulnerable to attack.
Throughout the day, more challenges arise. First responders don’t have access to their location systems. Delays in ground and air traffic begin to develop. Systems that depend on GPS time stamps — ATMs, power grids, computer-data and cell-phone networks — begin to fail, and the cloud becomes unstable. The internet soon collapses.
These events take place just a few hours into “A Day Without Satellites” as presented by Pål Brekke, solar physicist and senior advisor at the Norwegian Space Agency. Brekke spoke at the plenary session of ION GNSS+ on Sept. 17 in Miami.
Brekke reviewed the Carrington Event of September 1859, the first documented solar superstorm. In that event, a solar coronal mass ejection (CME) hit Earth’s magnetosphere, and its effects were observed and recorded by British astronomers. The storm wrought havoc with telegraph systems.
Today, a solar storm of this magnitude would cause widespread disruptions, blackouts and damage from extended outages of the power grid, communications networks, and of course, GNSS. The solar storm of 2012 was probably as big, but we were lucky — Earth wasn’t in the ejection path.
Without more data, it’s difficult to predict how often such superstorms take place, but it’s a sure bet that the scenario Brekke presented will happen eventually. To prepare, agencies around the world are studying and planning for the phenomenon, including the United Nations Office for Outer Space Affairs (COPUOS), the World Meteorological Organization (WMO) and the International Civil Aviation Organization (ICAO). Space and emergency agencies in the U.S, European countries and other countries are also developing plans.
Good to hear in the face of a threat that would undoubtedly affect us all.
Government agencies are increasingly turning to high-precision aerial imagery to solve city-planning conundrums. Three recent case studies show how emergency 9-1-1 services gather data to provide updated maps to emergency services to get to the right locations as soon as possible; reveal how a city’s public works department streamlines data collection for more efficient infrastructure management; and how to give GIS professionals instant access to the most current information available — all in the cloud.
Photo: Nearmap
It’s said a picture is worth a thousand words. In the case of aerial imagery, where location data is packed into every pixel, a picture could save lives.
Emergency dispatch is just one type of government agency now relying on high-quality aerial imagery. With up-to-date georeferenced imagery of their own towns and counties, agencies are not only improving response to emergency calls, but also streamlining public works and enhancing city planning.
A company providing that imagery is Nearmap, which serves more than 8,200 organizations and businesses globally using small aircraft for image capture. The aerial mapping company provides high-quality imagery as a subscription service delivered through the cloud. Its photo maps are taken at least twice a year, with leaves both on and off the trees, to provide different views of locations in different seasons.
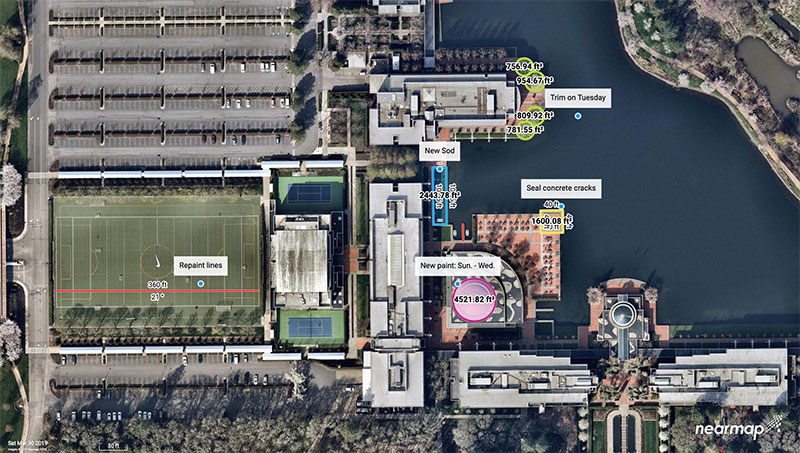
Nearmap’s patented camera system and software pipeline enables it to capture aerial photos, stitch them together into seamless digital maps, and publish the content online within days of capture. Above, Nike’s headquarters in Portland. (Photo: Nearmap)
Aircraft offers a huge advantage over unmanned aerial vehicle (UAV) or satellite imagery. Airplanes can cover much greater distances than UAVs, and pilots pay heed to the weather and fly below cloud layers to deliver the clearest visuals possible. Unlike space-based platforms, airplanes operate at lower altitudes, also increasing the resolution, and can fly on demand, unlike satellites that have set orbits dictating their periodicity for returning to a target area.
Nearmap’s powerful, patented technology allows it to deliver high-resolution aerial imagery as a service: orthographic (straight down) maps, multi-perspective panoramas and oblique aerial views — all at resolutions four times clearer than free satellite imagery.
Once photographed, the images are stitched together in the cloud in a matter of days, where they are available for viewing and analysis on desktop, tablet and mobile devices via a subscription service.
Nearmap’s proactive capture model is based on population — the larger the population, the more captures it takes per year. Nearmap images 88% of Australia’s population, 70% of the U.S. population, and 75% of the New Zealand population.
Nearmap captures many areas multiple times throughout the year; for many locations this gives customers a leaf-off and leaf-on view. Providing spring leaf-off captures allows customers a view of the ground that is typically obstructed by foliage the rest of the year.
The flight plans cover approximately 430 urban areas that are flown, captured and processed, and then served up via the MapBrowser in-browser tool, or supplied via application programming interface (API) for use in various design platforms. When a user subscribes to Nearmap, the capture is immediately available with any and all historical captures, without the need to pay for a dedicated flight.
“To capture imagery for a map, a plane has to crisscross over its own flightpath. Each sweep has to overlap the previous by approximately 70%,” explained William Tewelow, GPS World’s contributing editor for geointelligence. “Vertical (or nadir) is straight overhead. Oblique is everything else, but usually not exceeding 30% to either side because it distorts the structures and vertical features (parallax), makes mosaicking difficult, and shadows structures behind other structures.”
That said, oblique imagery is important for building 3D meshes for imagery point clouds, Tewelow said, as well as seeing various angles of a structure.
Following are examples of the creative — and surprising — ways government agencies are using Nearmap imagery to improve their services today, and prepare for future changes in their communities.
Better 9-1-1 address mapping
Shelby County is the largest county in Tennessee in both population (927,644) and geographic area (785 square miles). Memphis is the county seat, home to the county’s Emergency Communications District, for the operations of the local 9-1-1 emergency system.
The district provides Shelby County residents with an efficient emergency telephone number service using the latest technology, equipment and training for the various emergency service providers and dispatch centers.
For each dispatch center, the district provides county address location mapping. A secure database known as an ALI (Automatic Location Identification) contains the exact 9-1-1 address for any given associated phone numbers.
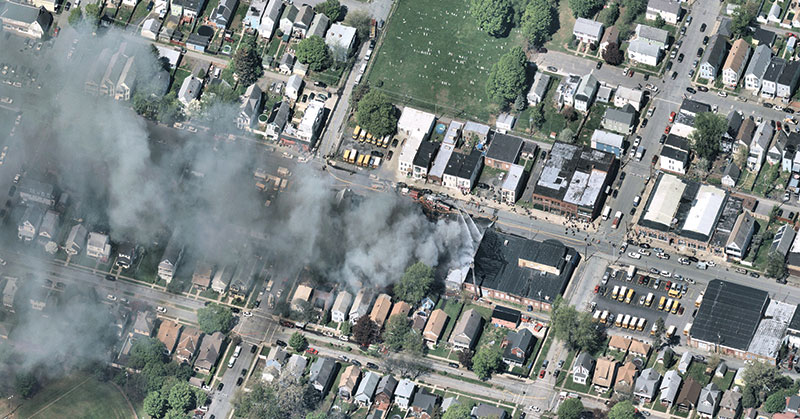
Albany, N.Y.: A house fire in progress. (Photo: Nearmap)
When a 9-1-1 call comes in, the database is queried by the Public Safety Answering Point to obtain the caller’s location. This data is then placed in the computer-aided dispatch software and 9-1-1 mapping software used by the district to help fire and rescue, emergency medical services and law enforcement gain instant access to updated maps containing GIS data needed to get to the right locations as soon as possible.
The 9-1-1 mapping system uses geodetic coordinates to plot wireless calls on the map. The system also reverse geocodes the coordinates to provide the 9-1-1 telecommunicator with a calculated civic address based on proximity of other features in the map, such as address points or streets.
Out-of-Date Imagery. For years, Shelby County’s aerial image process required a contracted flight to photograph the county areas. Because of the high cost of capturing those images, the county purchased images once every two years, after pooling resources from various county entities.
“We had gaps where we wouldn’t have updated imagery,” said Timothy Zimmer, the district’s GIS administrator. “While the images were high resolution, there were issues with mosaicking the separate images together, and since the imagery was taken every two years, many rural and unincorporated areas were out of date.”
With out-of-date images, the county had to develop alternate methods to locate addresses for the 9-1-1 systems.
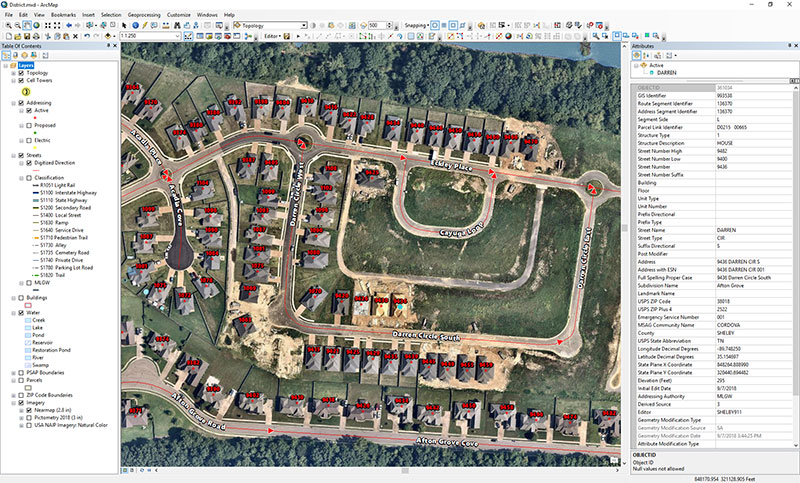
Moving into the Cloud. In the summer of 2018, Zimmer began to work with Nearmap. With Nearmap, Zimmer and his team can access current imagery to geocode new addresses and developments as well as plot new roads into the 9-1-1 mapping systems (Figure 1).
For Zimmer, the biggest advantage is that Nearmap’s imagery integrates directly into Esri’s ArcMap, ArcPro and ArcGIS Online applications, so he can overlay GIS information directly over the high-resolution imagery.
“I really like how Nearmap is integrated into the GIS stack,” Zimmer said. “We’re able to stay on top of new developments, roads, and addresses. Being able to have Nearmap imagery integrated into our GIS systems helps us be much more accurate.”
The combined impact of data services, base maps, Nearmap imagery and third-party data are improving all aspects of public safety, including law enforcement, fire and emergency medical services.
Other Shelby County agencies also are using the district’s imagery and GIS data. “The county clerk and the utility company are using our address mapping data because Nearmap has helped enable us to be much more current,” Zimmer said.
Public works in a fast-growing city
Durham is one of the points in North Carolina’s high-tech Research Triangle and home to Duke University.
An economic and cultural renaissance is happening in the city. With a revitalization of its downtown district, the redevelopment and repurposing of former tobacco districts into tech hubs, and chic loft-style apartment complexes, Durham is rapidly growing beyond its most recently reported 250,000 population numbers.
Impervious Challenge. In early 2018, the city’s growth explosion prompted Edward Cherry, GIS administrator for the City of Durham Public Works Department, and his staff of 14 GIS professionals to seek ways to streamline their data collection.
The department manages all infrastructure data for the city, including mapping the impervious area. As defined by the U.S. Geological Survey, impervious surfaces include highways, streets, pavement, driveways and even house roofs — any surface that won’t absorb rainwater. Rather, the rain runs off into storm sewers and then into local creeks; localized flooding is often the result.
Durham Public Works manages half a billion square feet of impervious area. The city’s $16 million-a-year Stormwater Utility Fee income was a driver for Cherry’s team to explore satellite imagery options. Imagery from satellites, however, were infrequent and too low-resolution to meet their needs. The satellites captured images only once-a-year, and that might be on a cloudy or rainy day. Clouds cast shadows, and rain makes pavement appear newer than it is.
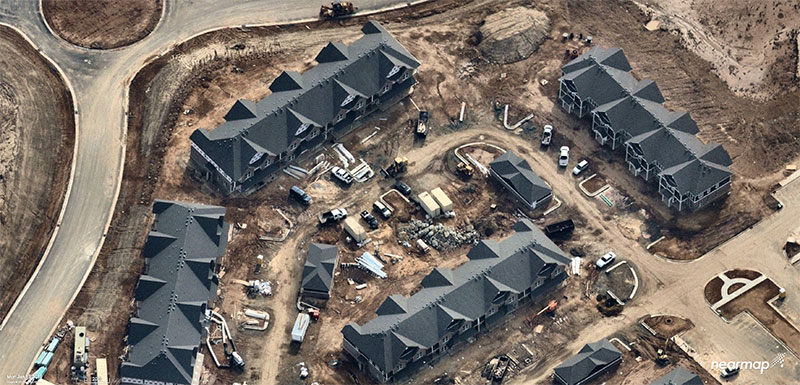
Nearmap’s aerial imagery, captured in Durham three times a year at a 2.8-inch ground sample distance (GSD), solved the problem (the GSD of each individual pixel in the imagery represents 2.8 inches on the ground. See Figure 2).
Figure 2: Rapid growth requires frequent imagery. Above is a new Durham neighborhood under construction. (Photo: Nearmap)
Dozens of projects in the Public Works Department — from road maintenance and pothole patching to water sampling and degradation — are using the improved imagery, which has saved the city money, reduced time spent in the field, and allowed crews to use real-time imagery when they are working in the field.
Monitoring Pavement Conditions. The City of Durham is responsible for maintaining most of its roads, and conducts a road-condition survey that samples different sites, evaluating the level of degradation.
Since 2014, Nearmap has regularly captured Durham streets at the same resolution and accuracy, and both the historical and current data are available to the department. With multiple high-quality image captures at high resolution, surveyors can see sections that have been recently paved. “We don’t need to send crews out to an area where a stretch has already been paved,” Cherry explained.
Road Repair Documentation. As in any city, the patching of potholes is an ongoing project for Durham’s public works department. With imagery, the city has been able to streamline the process.
Traditionally, the streets department sent out inspectors to spray paint and circle areas that required repairs. “Then we would produce maps and hard copies to direct [road repair contractors] ahead of time on a scheduled event,” Cherry said.
Now the city uses an application integrated with Nearmap imagery by which contractors can view the job on their smartphone or tablet while in the field. The surveyors can edit and draw the areas that need patching instead of physically going out and spray-painting them. “Then, in real time, the people doing the patching can see a very high-resolution image of where they need to do the work,” he said.
The pothole image captures are recorded, so the city knows where and how many potholes were patched. “We can see where work has been done when we are billed for it,” Cherry said. “We can visualize the work, which is an added bonus.”
Mapping Riparian Zones. With imagery previously taken only when the leaves had fallen (known as leaf-off), surveys of riparian zones in Durham proved limiting.
With imagery captured during both leaf-off and leaf-on seasons, riparian buffers around streams can be properly monitored for expansion. The buffers can be altered if there are issues with a stream’s path, such as sediment clogging the flow, repeated flooding or people intruding on a buffer.
Change Detection. High-resolution imagery has improved Durham’s billing process by producing web service maps that capture individual storylines. Stormwater billing customers, for instance, can visualize their properties with the impervious areas mapped out and tied to their billing records.
With up-to-date imagery providing data for change detection software, records also show when a customer has added a driveway or an extension to their house.
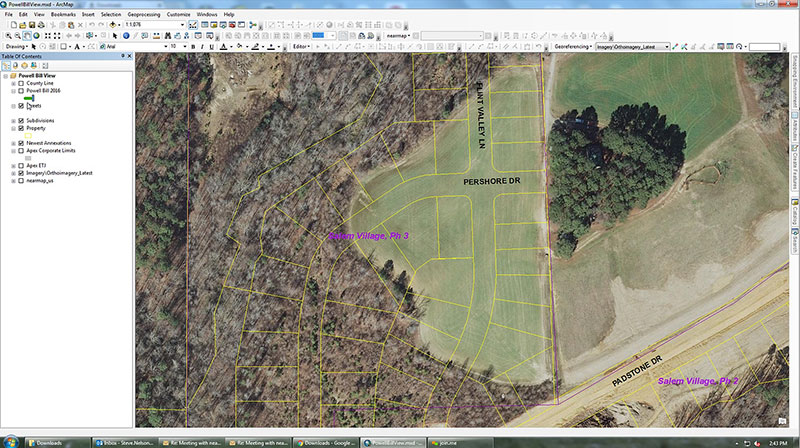
Figure 3: Aerial Imagery of an Apex neighborhood displayed in ArcGIS from Esri. (Image: Nearmap)
“Having access to imagery back to 2014, we’re able to go back in time during the thrust of development and monitor it forward,” Cherry said.
Nearmaps’ library of historical imagery allows for change detection algorithms to run in Esri’s ArcGIS imagery analysis software suite.
More efficient government
GIS data combined with aerial imagery is tailor-made for city planning and managing urban growth.
For instance, the population of Apex, N.C., has more than doubled since 2000. Situated near Raleigh and the state’s Research Triangle Park, Apex was rated number one in Money magazine’s 2015 “Best Places to Live,” which cited Apex’s charming downtown, highly rated schools and high-paying technology jobs.
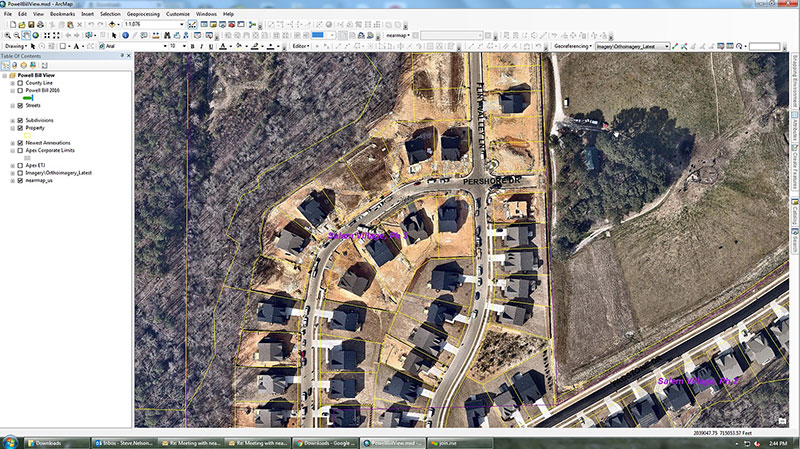
Figure 4: The post-construction image of the same neighborhood is much more accurate. (Image: Nearmap)
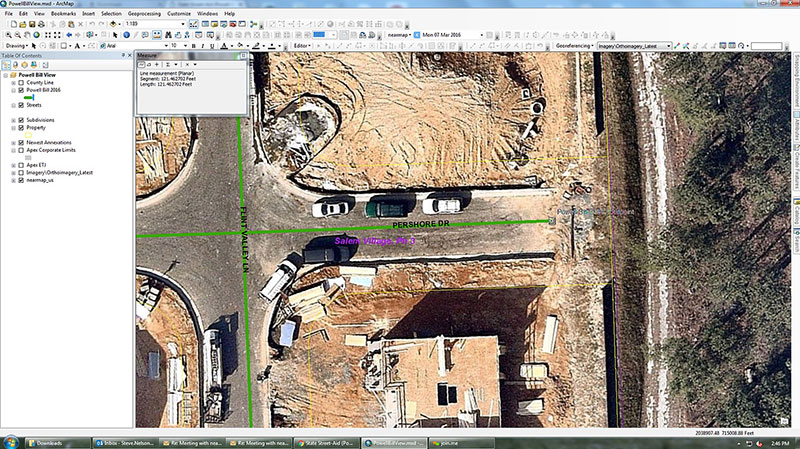
To manage the explosion in development, Apex’s GIS professionals needed instant access to current information. The old-school method required planners to drive the streets, inspect roadways, and roll out the measurement wheel. Now, the combination of Esri ArcGIS for mapping and Nearmap high-resolution aerial imagery allows them to visualize and measure within six inches of accuracy.
“Our ability to leverage our GIS operation improved dramatically with Nearmap. The flexibility of its cloud solution and ability to integrate with ArcGIS has redefined how we rapidly respond to staff and citizen requests,” said Steve Nelson, a GIS professional with Apex.
The use cases for these solutions are diverse. Law enforcement calls on GIS professionals from Apex to quickly provide current, clear, aerial photography for active or ongoing investigations. Planners focused on development are charged with meeting state regulatory reporting guidelines when it comes to building and maintaining roads. Environmentalists want to know if anyone is digging on protected land.
Figure 5: Measuring for reimbursement in Apex. (Image: Nearmap)
For the State Street-Aid Program, financial allocations are made to incorporated municipalities eligible under North Carolina law. State routes that pass through incorporated cities are maintained by the cities. Cities are responsible for paving new roads, but the state has the power and economic means to reimburse them.
To qualify for reimbursement for new roads developed and maintained, Apex needs to submit a report to state engineers for review. The report documents the distance for all newly paved roads.
Before the new system was in place, GIS professionals had access to imagery from 2013, but the actual development took place after this. In (Figure 3), the 2013 imagery simply outlines the parcels and rights of way. It has no detail with respect to where the roads start and end, so a lot of field work was needed to take measurements, drive roads scattered across the county, and collect data.
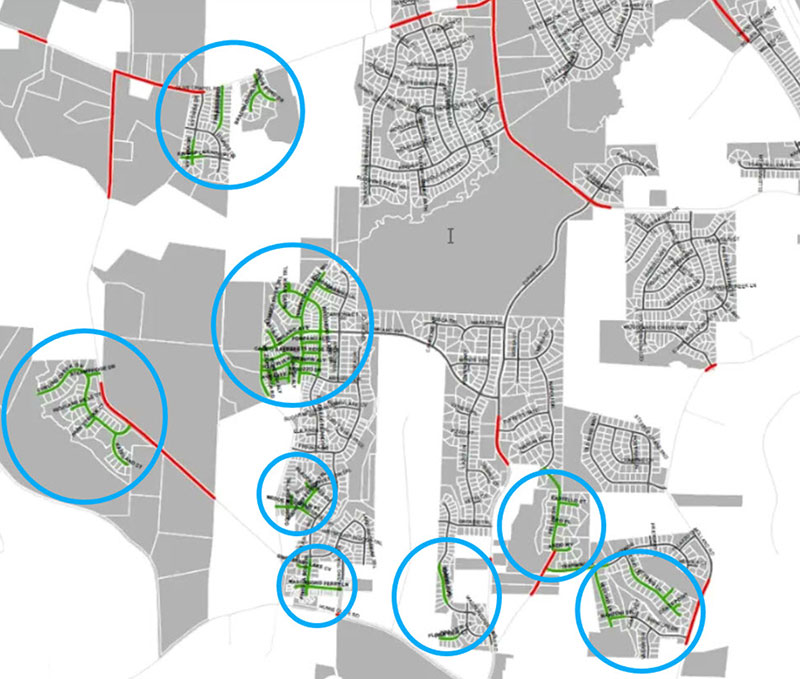
Figure 6: Green lines indicate new streets in Apex in a single year (2013). (Image: Nearmap)
With the new system, workers have instant access from their desktop to the same location as it currently is. They can see exactly where the edge of the road starts and stops (Figures 4 and 5), which is different from the yellow-lined “right of way” depicted in Figure 3. While in the office, GIS professionals can measure distances precisely, creating an accurate representation of ground truth.
Figure 6 highlights a small portion of new roads built in Apex in one year. The green lines highlighted are scattered across the city. As Apex continues to grow and annex adjacent territory, the dynamic nature of the growth will be captured and uploaded to the cloud.
Unlocking Potential
As cities grow in complexity, mapping becomes integral to planning. With the advances aerial imagery provides, cities are starting to unlock the full potential of location data and visualizing a better future.
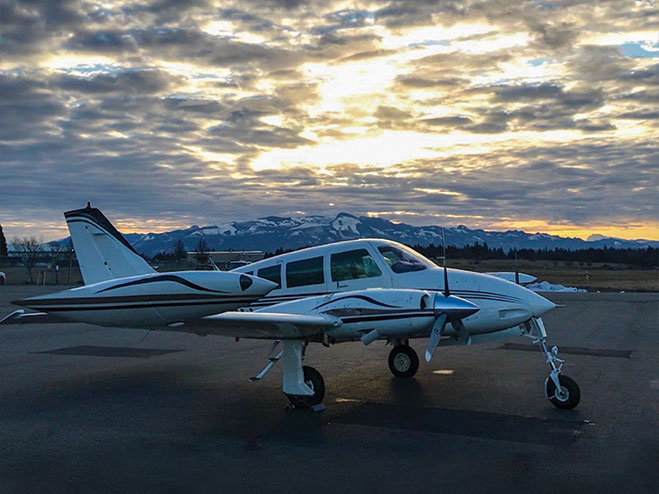
Our cover story this issue is all about autonomous vehicles. Retirees — not usually considered early adopters of technology — are trusting autonomous vehicles to ferry them from point to point using the technology our industry can offer.
We have also used a lot of magazine space to discuss unmanned aerial vehicles, or drones, and shown how they are taking on a lot of tasks formerly done by manned pilots or workers, such as aerial mapping or factory inspections.
So is the idea of an autonomous plane such a stretch?
At June’s Paris Air Show, Christian Scherer, chief commercial officer for Airbus, told the Associated Press that his company already has the technology to fly passenger planes without pilots.
Scherer also said in the AP interview that Airbus hopes to be selling hybrid or electric passenger jets by around 2035.
Airbus already has “the technology for autonomous flying.”
But having the tech is one thing. Winning over regulators and potential travelers is quite another.
“When can we introduce it in large commercial aircraft? That is a matter we are discussing with regulators and customers, but technology-wise, we don’t see a hurdle,” Scherer said.
In fact, in a new study, seven out of 10 people say they would be willing to travel in an unpiloted plane at some point in their lifetime. The survey was conducted by U.S. software firm Ansys, which is working to provide digital replicas of how planes and cars react in different situations.
Passengers would be more willing to embrace automation if firms could show that a computer would react in the best and quickest way if anything unexpected happens.
But are we there yet? Michael Wiggins, the chairman of the aeronautical science department at Embry-Riddle Aeronautical University in Florida, addressed the autonomous-flight adoption question for the New York Times.
“From what I see, could it happen in the distant future? I think it probably could. Will it happen in the near future? I don’t think so,” Wiggins said. “Right now, any progress toward that area should be done very slowly, very measured and only after a bunch of research with results that suggest we should do that.”
GPS data serves as the basis for a geodetic model of the Alps. Here, a horizontal strain field is derived from the data. Red areas indicate compression; blue indicates lateral spreading. (Image: DGFI-TUM)
Our Earth is constantly on the move, as the current Kilauea eruption dramatically illustrates. But capturing data on small shifts over time isn’t so easy.
A new computer model based on more than a decade of GPS data shows the dynamic movements of the Alps as the mountain range drifts and rises.
In general, the range drifts an average of one-half millimeter and rises 1.8 millimeters every year.
However, there are strong regional variances. In South and East Tyrol, a rotation towards the east is superimposed on the overall movement, while at the same time the mountain range is being compressed. And the rise in height is not identical everywhere, either. While very small in the southern part of the western Alps, it reaches its maximum with a speed of more than 2 millimeters per year in the central Alps at the boundaries of Austria, Switzerland and Italy.
To create the model, researchers at the Technical University of Munich (TUM) German Geodetic Research Institute evaluated measurements made by more than 300 GPS antennas over a period of 12 years, in the German, Austrian, Slovenian, Italian, French and Swiss Alps. Over that time, each of the stations has been making positioning measurements every 15 seconds.
The team’s model makes the movements visible on a comprehensive basis for the first time.
The scientists identified the positions of the measurement stations, accurate down to fractions of a millimeter; many of the stations were set up in the EU project ALPS-GPSQUAKENET and are in part operated by TUM.
Once corrected for snow weight and atmospheric interference, the data show horizontal and vertical shifts as well as lateral spreading and compression at a resolution of 25 kilometers.
Explains Florian Seitz, chair of Geodetic Geodynamics, “The data are a goldmine for geodesy, with its objective of accurately measuring the surface of the Earth and identifying any changes occurring.”
Rolls Royce is investing in autonomous shipping systems.
We no longer live in the Nuclear Age. Did you notice? Use of the term faded away. We no longer define our lives by the existence of nuclear technology, though of course it’s still part our world.
While the naming of “ages” is arbitrary, most people would say we’re currently in the Information Age. The last Great Age before the Information Age was the Industrial Age. We also experienced smaller “ages” such as the Space Age and the Atomic or Nuclear Age, but these didn’t impact our daily lives like the Industrial Age and Information Age have.
Which led me to wonder, what’s next? There’s a good chance we will find ourselves in the Autonomous Age, a daily experience of interacting with machines, robots and drones accomplishing tasks formerly done by people — including ourselves. We already use industrial robots; this trend will continue into new, more personal areas.
Inside our Smart Cities, we’ll wake up in a talking house built by autonomous construction machines, eat breakfast food that arrived via autonomous shipping and then delivered by drones, and travel to work via autonomous vehicles.
Artificial intelligence, augmented reality and autonomous vehicles will be woven into the tapestry of our daily lives. Overarching infrastructures and architectures will coordinate all the diverse autonomous and intelligent devices that we use.
“Artificial intelligence is sweeping across industries, and its next frontier is autonomous intelligent machines,” NVIDIA founder and CEO Jensen Huang said, speaking at GTC Japan in December. “Future machines will perceive their surroundings and be continuously alert, helping operators work more efficiently and safely.”
With George Antheil, Hedy Lamarr invented spread-sprectrum communications in 1942.
What do a 1930’s Hollywood star and the inventor of spread-spectrum communications have in common? They are one and the same.
The new documentary Bombshell highlights not just the acting career of Hedy Lamarr, but her contributions as an inventor. With George Antheil, Lamarr invented spread-sprectrum communications in 1942 and, specifically, the frequency-hopping version.
Explains Innovation editor Richard Langley, “When a signal’s frequency is quickly shifted in a seemingly random way among a large number of frequencies, the signal can become buried in the background noise and difficult to detect.
“However, when received, the signal can be recovered by changing the tuned frequency in exactly the same manner as was used for the transmission, thereby lifting the signal out of the noise, allowing it to be heard. Enemy eavesdroppers might not even know a signal was present and wouldn’t be able to decode it anyway unless they knew the frequency-shift sequence.
“Another way to create a spread-spectrum signal is to spread it using a direct pseudorandom code sequence, and this is what GPS and the other GNSS do.”
Lamarr and Antheil’s radio system answered a different need — to guide torpedoes to their targets during World War II. The team was granted U.S. Patent No. 2,292,387 for a “Secret Communication System.”
Their system “employs a pair of synchronous records…which change the tuning of the transmitting and receiving apparatus from time to time, so that without knowledge of the records an enemy would be unable to determine at what frequency a controlling impulse would be sent.”
Bombshell, a Zeitgeist Films release, opened in theaters Nov. 24.
Where are all the windmills on Earth? Or oil derricks? How about baseball stadiums?
You could scan through the millions of satellite images snapped by hundreds of satellites now circling the planet. Or you could try Descartes Labs’ demo search engine.
Satellites are snapping images of the Earth every day. Alongside Planet Inc. and DigitalGlobe satellites, imaging constellations are planned from companies such as Urthecast and Astro Digital (the latter launched its first pair of satellites in July). But how do we make use of all of that data in an organized, searchable way?
New Mexico startup Descartes Labs has created a cloud-based supercomputing platform to apply machine intelligence to massive data sets, using satellite imagery to model complex systems on the planet.
While Descartes started by focusing on forestry and agriculture, its new Geovisual Search tool allows users to find similar-looking objects of any kind all over the globe. Just click anywhere on the map and a red tile appears, enabling users to search for similar objects. Descartes was inspired by a team at Carnegie Mellon University, who applied the principles of visual search to seven cities around the world in a demo called Terrapattern. Descartes has built three demo maps on three different scales: The continental United States, China and the entire world.
Here in the U.S., this past summer saw an unprecedented number of emergency situations. Hurricanes blasted Texas, Florida, the U.S. Virgin Islands and Puerto Rico, leaving people stranded and without power, while wildfires ravaged the west.
So far this year, 15 separate weather and climate disasters have each caused at least $1 billion in damages in the U.S., according to the National Oceanic and Atmospheric Administration (NOAA), meaning, 2017 could tie 2011 for the most billion-dollar disasters. The USA Today chart shows those events.
In Oregon where I live, we experienced unprecendented smoky skies from wildfires — the hazardous air quality affected the health of many.
The silver lining? Growing expertise in the fields of disaster response, mapping, location awareness, UAVs and imagery. We continue to improve our ability to respond to disasters, such as with Waze traffic alerts for wildfire evacuations and UAVs that bring a virtual doctor to a crisis scene along with medicine. We use state-of-the-art technology to learn more about how, why and when disasters happen with tools such as UAVs that penetrate the mysteries of active hurricanes.