Hi-Target Surveying Instrument Co., Ltd.’s Stefan Wei discusses the company’s latest receiver at Intergeo 2017, which took place Sept. 26-28 in Berlin, Germany.
Author: Allison Kral
-
Septentrio debuts smart antenna at Intergeo 2017
Septentrio’s debuted its Altus NR3 at Intergeo 2017, which took place Sept. 26-28 in Berlin, Germany. According to the company, the Altus NR3 combines easy-to-use, multi-frequency, quad-constellation RTK with an unrivalled communications toolset.
Key features of the antenna include a light and portable GNSS receiver; quad-constellation, multi-frequency RTK positioning; and an anti-jamming and monitoring system. The Altus NR3 also features all-in-one base and rover operation.
“This is a true RTK system that makes the use of all the signals to have the best performance that Septentrio is recognized for,” said Gustavo Lopez, product manager at Septentrio. “We also bring something that is quite unique in terms of technology, which is interference mitigation.”
According to the company, the Altus NR3 can suppress the widest variety of interferers from simple continuous narrow-band signals to the more complex wide band and pulsed transmitters, as well as lnmarsat and Iridium satellite transmissions.
The Altus NR3 also features an open interface, so it can be used for a variety of use cases and applications, Lopez added.
Watch the video to learn more about the Altus NR3’s features.
-

DigitalGlobe releases satellite imagery of Houston
DigitalGlobe released satellite imagery of Houston after Hurricane Harvey hit.
Hurricane Harvey slammed into the Gulf Coast of Texas — just southwest of Houston — on Aug. 25. According to DigitalGlobe, the hurricane packed sustained winds at more than 130 miles per hour and has been identified as the largest single rainmaking event in continental U.S. history.
The images show downtown Houston, George Bush Intercontinental Airport and the interstate highways, which are relatively dry. Significant flooding remains in towns east and north of Houston, including Kingwood, Highlands and Channelview, the company says.

Images courtesy of © 2017 DigitalGlobe 
Images courtesy of © 2017 DigitalGlobe 
Images courtesy of © 2017 DigitalGlobe 
Images courtesy of © 2017 DigitalGlobe
Images courtesy of © 2017 DigitalGlobe -
TerraGo partners with Western Data Systems for data collection
 TerraGo partnered with Western Data Systems (WDS), a provider of field data collection solutions to the surveying, construction and other infrastructure industries.
In alignment with the partnership, WDS will launch P.L.A.N.I.T. (Points, Lines, Areas, Navigation, Information, Tasks), a mobile data collection platform built entirely using TerraGo Magic.
“WDS has the experience and expertise to give customers the smartest, most cost-effective solution to meet their needs,” said John Timar, vice president of worldwide sales for TerraGo. “The combination of the best positioning technology and a fully customizable app will help their customers get field work done faster, better and cheaper than ever before.”
Earlier this year, TerraGo released a new version of Magic. In addition, TerraGo will be hosting a webinar on Aug. 30, where the company will provide a live demonstration of the WDS P.L.A.N.I.T. mobile data collection platform.
-
Research Online: Robust tightly coupled GNSS/INS estimation for navigation
By Omar Garcia Crespillo, Daniel Medina, Anja Grosch, Jan Skaloud and Michael Meurer / Presented at the European Navigation Conference, Lausanne, Switzerland, May 2017

Simulation Comparison: Classical GNSS/INS EKF and robust Huber EKF. Click to enlarge. We designed a tightly-coupled integration between GNSS and inertial navigation systems (INS) where we modify the update step of a classical Extended Kalman Filter (EKF) to consider different robust estimators (such as M-estimators). We consider different faulty scenarios where the pseudoranges contain one or several non-modeled biases. The tightly-coupled GNSS/INS robust Kalman filter performance in the presence of biases is compared with the classical EKF and with a loosely-coupled Robust-GNSS/INS approach. The robust tightly-coupled version is able to minimize more efficiently the biases effect thanks to the direct redundancy of the inertial sensor within the robust estimator.
We set a simulated scenario based on a realistic trajectory and generate both GNSS and inertial measurements following state-of-the-art error models. We analyze the filter behavior under the presence of pseudorange measurement faults. For that purpose, we have run 100 Monte Carlo simulations over the given trajectory, and we have generated synthetic pseudorange biases of 40 meters in satellites PRN 18 and PRN 24 every 20 seconds. The filter error performance in the position domain is shown for the classical EKF and for a robust EKF based on Huber estimation criteria, the mean simulation error as well as the 95 error confidence interval. The classical EKF is highly affected by the sudden biases, and their effect influences for some seconds the estimation, while the robust Huber EKF is less sensitive to the presence of these biases because it is able to better adjust the estimation to minimize their effect in the final position estimation error.
-

What to expect from ION GNSS+ and Intergeo 2017

Intergeo 2016 It’s almost September. For the GPS World staff, this means scramble time. We have two important industry events to attend: The venerable ION GNSS+ conference and the huge Intergeo trade show.
ION GNSS+ is the Institute of Navigation’s largest technical meeting and showcase of GNSS technology, products and services. Hundreds of papers are shared by experts in the field, in presentations and panels.
The show has changed over the years to broaden its focus to applications, and added a “+” to its name to incorporate all the positioning, navigation and timing (PNT) technology that aids GNSS in location, much as we have also done in providing a new subtitle to our magazine.
New this year are Short Courses, aimed at bringing your non-technical staff up to speed on the technology behind the industry, no matter their background. For instance, one course is “GNSS 101: An Introduction.”
Intergeo, which is held each year in different city in Germany, comes to Berlin. The huge show, attended by about 17,000 people, is a conference and trade fair (emphasis on trade fair) for the fields of geodesy, spatial data, surveying, UAVs and land management.
A hot topic at Intergeo continues to be Geospatial 4.0, the massive transformation where big data, mobility and cloud solutions are driving a new global digital economy.
Other buzzed-about topics include photogrammetry, building information modeling (BIM) and smart cities.
One important and timely topic is the need for infrastructure that ensures data security and protection. Once again, the Interaerial Solutions show for UAVs will take place as part of Intergeo.
-
PNT Roundup: Resilient PNT for the maritime sector
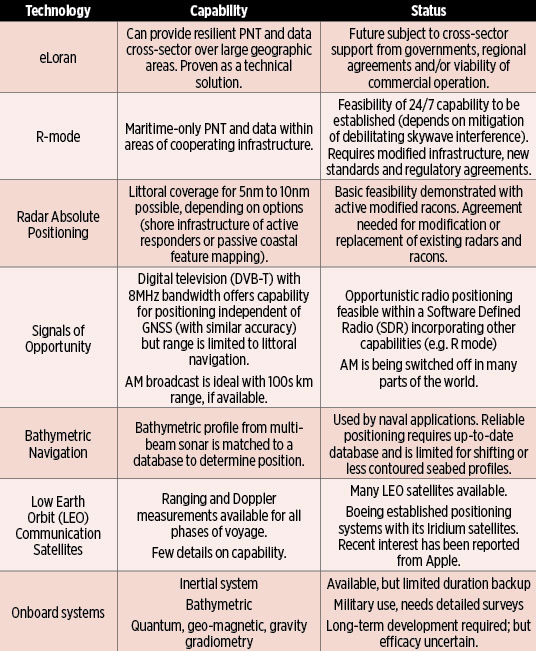
Table 1. Capability and status of complementary positioning technologies. (Chart: GLA) The General Lighthouse Authorities of the U.K. and Ireland (GLA) reached Initial Operational Capability for eLoran on the East coast of the U.K. Although it was shown to work well technically, it has not been possible to implement the system in Europe on a regional basis.
The GLA have also been involved in the potential development of other, non-satellite based, alternative systems. These may now form the basis of positioning resiliency either individually, or as a tapestry of systems serving the maritime navigator in Europe, unless current plans for commercial operation of eLoran come to fruition.
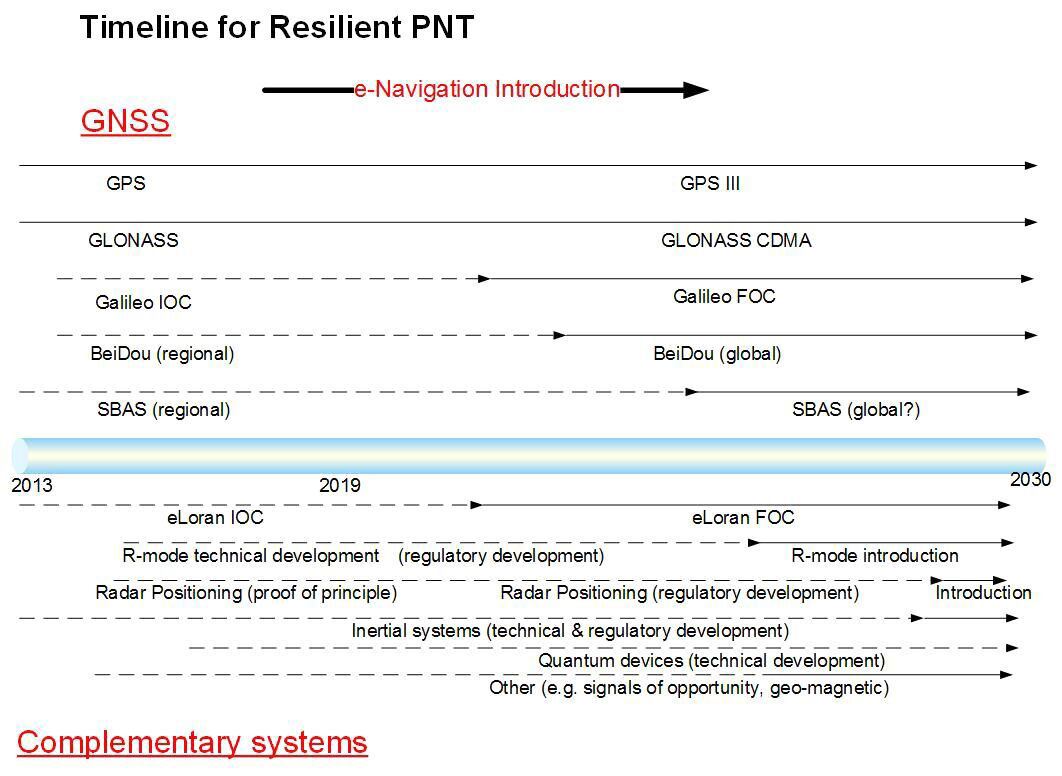
Here we consider the technical and regulatory status of eLoran in comparison with the other options, and explore necessary steps to protect the maritime navigator in the face of increasing GNSS outages. Several alternative backup technologies could be considered complementary to GNSS for future introduction into ships’ Integrated Navigation Systems. They have varying capabilities, and different limitations and levels of maturity, summarized in Table 1. Figure 1 shows estimated timescales for development and implementation.
Figure 1. Timeline for resilient PNT. (Image: GLA) Conclusions
■ eLoran is the only complementary backup system that can be implemented within the timescale envisaged for the introduction of e-navigation; however, there are political obstacles to implementation, at least in Europe.
■ R-mode and possibly radar positioning could be introduced by about 2030; however, both have inherent coverage limitations. Feasibility studies are needed to assess their economic viability.
■ Other options, such as inertial systems and signals of opportunity, might emerge as viable alternatives by 2030, but there are large uncertainties about technical and regulatory matters.
■ Quantum devices and options such as bathymetric and geomagnetic positioning can only be considered as longer term and uncertain possibilities.
■ A multi-system solution may offer the best approach. The IMO concept of the Integrated Navigation System aboard vessels, incorporating a multi-system receiver, provides flexibility for the inclusion of the above positioning technologies, if and when they become available, at an affordable cost.
-

Discussing the new North American-Pacific Geopotential Datum of 2022 — Part 2
My last column highlighted some of the feedback provided by guest presenters at the NGS’ 2017 Geospatial Summit held on April 24-25 in Silver Spring, Maryland. That column also provided a discussion on the approximate differences between NAPGD2022 and NAVD 88 (and NGVD 29) at a national and local level. It was mentioned that to prepare for the new datums and develop implementation plans, users should obtain an understanding of the differences between NAPGD2022 and NAVD 88. The last column provided figures that depicted the approximate absolute and relative differences between the new vertical reference frame, North American-Pacific Geopotential Datum of 2022 (NAPGD2022) and NAVD 88. This column is the second in a new series of columns addressing topics associated with transitioning to the new North American-Pacific Geopotential Datum of 2022 (NAPGD2022).
The name of the National Geodetic Survey’s new vertical reference frame is the North American-Pacific Geopotential Datum of 2022 (NAPGD2022). So, what is a geopotential model? The following is the definition of a geopotential model from Wikipedia: “In geophysics, a geopotential model is the theoretical analysis of measuring and calculating the effects of Earth’s gravitational field.” [See the box titled “Definition of geopotential and geopotential model from Wikipedia.”]
Definition of geopotential and geopotential model from Wikipedia


In order for a height to a have physical meaning, the height system must have some relation to the Earth’s gravity field. Basically, for geodesists, a geopotential model is a way of measuring the effects of Earth’s gravitational field and the means to deriving a geoid model. So, what does the Earth’s gravity field look like? The box titled “Static Gravity Field – Anomalies” is a good image of the Earth’s gravity field created by the GRACE program.
Static Gravity Field – Anomalies
(Figure obtained from https://grace.jpl.nasa.gov/resources/28/)
It was mentioned in the last column that stakeholders across the federal, public and private sectors provided feedback and impacts of NGS New 2022 Datums on their products and services. All of these presentations are now available on NGS’ website. [See box titled “Website that contains the NGS 2017 Geospatial Summit Presentations.“] NGS did an excellent job of recording these presentations. The website allows the user to download the video and/or slides, as well as watch the presentations on their computer.
Website that contains the NGS 2017 Geospatial Summit Presentations
(https://www.ngs.noaa.gov/geospatial-summit/presentations.shtml)
Many surveyors and mappers will be providing services to Federal, state, and local agencies to assist them in their transitioning activities. I would encourage all users to watch the presentations by the partners to obtain an understanding of how these agencies’ products and services are going to be effected by a datum change. For example, the presentation by the Federal Emergency Management Agency (FEMA) can be found here.
This column will focus on two of the presentations by NGS employees – “Modernizing the Geopotential or Vertical Datum” and Monitoring Changes in the Geoid.” These two presentations are very important to obtaining an understanding of NAPGD2022. [See box title “NGS Presentation at the 2017 Geospatial Summit – “Modernizing the Geopotential or Vertical Datum.”]
NGS Presentation at the 2017 Geospatial Summit – “Modernizing the Geopotential or Vertical Datum”
(https://www.ngs.noaa.gov/geospatial-summit/presentations/modernizing-geopotential-vertical-datum.shtml)
Why is the Earth’s gravity field important to estimating GNSS-derived orthometric heights? Guidelines and procedures for estimating GNSS-derived heights were discussed in great detail in previous columns, such as Establishing Orthometric Heights Using GNSS — Part 1, Establishing Orthometric Heights Using GNSS — Part 2, Establishing Orthometric Heights Using GNSS — Part 3 and Establishing orthometric heights using GNSS — Part 4.
Slide 33 from the presentation titled “Modernizing the Geopotential or Vertical Datum” depicts the relationship between the ellipsoid, geoid, and orthometric heights. (See box titled “Slide 33 From “Modernizing the Geopotential or Vertical Datum.”)
Slide 33 From “Modernizing the Geopotential or Vertical Datum”
(https://www.ngs.noaa.gov/geospatial-summit/presentations/modernizing-geopotential-vertical-datum.shtml)
A previous column discussed how NGS developed their scientific and hybrid geoid models. The NAPGD2022 will begin with the best 3-dimension geopotential model available and derive the most accurate geoid model, e.g., GEOID2022, for establishing NAPGD2022 GNSS-derived orthometric heights. Just like NAVD 88 leveling derived heights need accurate gravity values to compute accurate orthometric heights and height differences, the geopotential model needs accurate, current gravity data to estimate local variations in the global model. The bottom line is that an accurate geopotential model is necessary for deriving an accurate geoid model that is necessary for establishing accurate GNSS-derived orthometric heights and height differences.
In the presentation “Modernizing the Geopotential or Vertical Datum,” Monica Youngman discussed the NGS project called “Gravity for the Redefinition of the American Vertical Datum (GRAV-D).” The goal of GRAV-D is to create a gravimetric geoid accurate to 1 cm where possible using airborne gravity data. The overall target is to enable users to obtain 2-cm accuracy orthometric heights from GNSS and a geoid model. View this website for more information on GRAV-D.
Once a geoid model is computed, e.g., GEOID2022, it will need to be validated to estimate the accuracy of the derived product. What does this mean to surveyors and mappers? In my opinion, the NAPGD2022 will help the surveying community maintain a vertical reference frame that’s reliable and traceable. Saying that, it is extremely important to know the relative accuracy of the geoid model used to establish GNSS-derived orthometric heights in NAPGD2022. As mentioned in my April column, NGS is performing geoid slope validation surveys (GSVS) to evaluate the current experimental geoid models being developed using GRAV-D data. In the presentation “Modernizing the Geopotential or Vertical Datum,” Derek Van Westrum discussed the GSVS projects. Evaluation of the experimental gravimetric geoid model is critical to the implementation of NAPGD2022 and should be part of a transition plan to the NAPGD2022. Performing a geoid slope validation project similar to NGS may be too expensive to be performed by most agencies. However, some agencies may be able to perform low budget geoid slope evaluation surveys. These surveys could include performing combined GNSS and leveling surveys to evaluate the relative accuracy of the gravimetric geoid model in areas that require accurate orthometric heights. Performing several of the gravimetric geoid evaluation surveys in major cities and/or areas that require accurate heights would help to facilitate the implementation of NAPGD2022.
These types of geoid evaluation surveys should be performed in areas of the country that are influenced by crustal movement. For example, in southern Louisiana and other parts of the Gulf Coast of the United States that are being influenced by subsidence (https://www.ngs.noaa.gov/heightmod/NOAANOSNGSTR50.pdf, https://www.ngs.noaa.gov/PUBS_LIB/Subsidence_at_Houston_Texas_TR_NOS131_NGS44.pdf). There is no doubt that NAPGD2022 will provide a more efficient and cost-effective way to maintain consistent and accurate orthometric heights; however, evaluating the relative accuracy of the geoid model is critical to a successful implementation of NAPGD2022.
The first phase of the GRAV-D project is the airborne gravity survey of entire country and its holdings; the second phase is the long-term monitoring of the change in the geoid. Not only is the NAVD 88 being replaced with a new datum but the geoid model, the underlying foundation of establishing GNSS-derived orthometric heights in NAPGD2022, will be constantly changing. The geoid will change but it will change very slowly. Saying that, it is still important for NGS to monitor changes in the geoid if users are going to establish and maintain GNSS-derived orthometric heights at the centimeter level. As part of the modernization of the vertical reference frame, NGS has outlined four components of a long-term monitoring plan. [See box titled “Components of a Long-Term Monitoring Plan.”]
Components of a Long-Term Monitoring Plan
(From presentation titled “Monitoring Changes in the Geoid” given by Dr. Theresa Damiani at the NGS 2017 Geospatial Summit)- What and Where to Monitor
- How to Monitor in the Near-Term (next 1 to 3 decades)
- Which Products Need to be Available
- Long-Term Program Adaptation
The two most important components of the plan, in my opinion, are “What and Where to Monitor” and “How to Monitor in the Near-Term.” There are small changes in the geoid that occur over long periods of time. [See box titled “Slide 5 from presentation titled “Monitoring Changes in the Geoid.”]
Slide 5 from presentation titled “Monitoring Changes in the Geoid”
(From presentation titled “Monitoring Changes in the Geoid” given by Dr. Theresa Damiani at the NGS 2017 Geospatial Summit)
Dr. Damiani presented a slide that outlined NGS’ vision for vertical datum products as they are related to the geoid model. [See the box titled “NGS’ Vision for Vertical Datum Products, 2022 +.”] NGS will be publishing both static geoid models (S) and dynamic geoid models (D). The “S” static model will be a typical geoid model, aimed to capture the 1 cm-accurate model at a specific epoch, and the “D” dynamic model will capture the rate of change of the geoid at all places. Dr. Damiani mentioned in her presentation that NGS has initiated a program called “The Geoid Monitoring Service.” This service is a new project, initiated in January 2017, that is planned to be operational and produce NGS’ first “D” dynamic geoid by 2022.
NGS’ Vision for Vertical Datum Products, 2022 +
(From presentation titled “Monitoring Changes in the Geoid” given by Dr. Theresa Damiani at the NGS 2017 Geospatial Summit)➢ In 2022, NGS will release “S” and “D” geoid models: static (S) and dynamic (D).
➢ The “S” static will be a typical geoid model, aimed to capture the 1 cm-accurate model at a TBD epoch.
➢ The “D” dynamic will capture the rate of change of the geoid at all places. In 2022, it will capture at least the continuous, permanent change signals such as Glacial Isostatic Adjustment (GIA).
➢ Both models will be integrated into OPUS, mostly invisible to users. Orthometric heights provided by OPUS will be time-sensitive, so that they are the combination of the static geoid model plus the geoid rate of change indicated by the dynamic model.

➢ NGS will provide separate tools to directly access both the “S” and “D” models.
This column discussed the basic foundation parameters of the North American-Pacific Geopotential Datum of 2022 (NAPGD2022); that is, a global geopotential model, the GRAV-D project, and the GEOID2022 geoid model. It emphasized that NAPGD2022 will provide a more efficient and cost-effective way to maintain consistent orthometric heights, but evaluating the relative accuracy of the geoid model is critical to a successful implementation of NAPGD2022. Performing GNSS/Leveling evaluation surveys will help in evaluating the relative accuracy of GEOID2022. NGS is developing geodetic routines and tools to assist users in transforming heights from NAVD 88 to NAPGD2022, and enabling the incorporation of geodetic leveling data into NAPGD2022 to establish NAPGD2022 orthometric heights. Future columns will address some of these tools and routines.
-
Discussing the new North American-Pacific Geopotential Datum of 2022 — Part 1
On April 24-25, 2017, the National Geodetic Survey (NGS) hosted the 2017 Geospatial Summit in Silver Spring, Maryland, to discuss its plans for replacing the North American Datum of 1983 (NAD 83) and the North American Vertical Datum of 1988 (NAVD 88) in 2022.
The summit was a day and a half long and provided an opportunity for NGS to share updates and discuss the progress of projects related to National Spatial Reference System (NSRS) Modernization. Stakeholders across the federal, public and private sectors also provided feedback and impacts of New Datums on their products and services.
The absolute differences between the new vertical reference frame, North American-Pacific Geopotential Datum of 2022 (NAPGD2022), and NAVD 88 are going to be large but, in most regions of the country, the relative differences over small areal extents will be small.
NGS is developing geodetic routines and tools to transform heights from NAVD 88 to NAPGD2022, and to facilitate the incorporation of geodetic leveling data into NAPGD2022 to establish NAPGD2022 heights. To prepare for the new datums and develop implementation plans, stakeholders should obtain an understanding of the differences between NAPGD2022 and NAVD 88.
My previous columns provided figures that demonstrated the approximate differences between NAPGD2022 and NAVD 88 heights at a national level. (See figure 1.) This column will provide feedback from stakeholders that participated in the Geospatial Summit and, using NGS’ GPS on BMs dataset, a discussion on the differences between NAPGD2022 and NAVD 88 (and NGVD 29) at a local level.
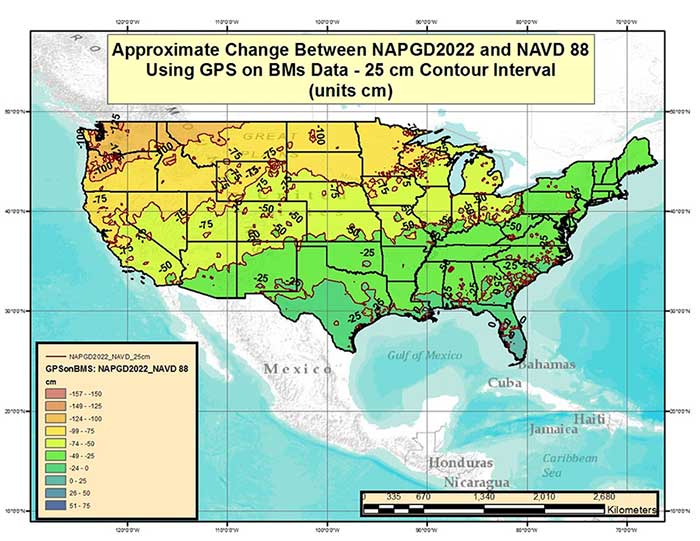
Figure 1 – Approximate Change Between NAPGD2022 and NAVD 88 Using GPS on BMs Data (units = cm). (Image: National Geodetic Survey) Information about the summit and Summit Documents can be downloaded here.
Read an excerpt from website here.

If you check on the tab titled “Summit Documents” you can download the agenda and documents provided to participates. Read excerpts from the summit here.

The first day consisted of presentations by NGS leadership and personnel providing updates and discussing the progress of projects related to the NSRS modernization. The presentations by NGS employees can be downloaded from NGS’ presentations library at this web link. View an excerpt from NGS’ presentations library here.

The afternoon of day 2 were presentations by partners and stakeholders. (See box titled “Excerpt from NGS 2017 Geospatial Summit Agenda – Afternoon of Day 2.”)
Excerpt from NGS 2017 Geospatial Summit Agenda – Afternoon of Day 2
Day 2 Afternoon Agenda from NGS’ 2017 Geospatial Summit
Day 2: Tuesday, April 25, 20171:30 – 3:05 Impacts of New Datums on Programs and Partners (Part 1)
Coastal Mapping Program and VDatum: Mike Aslaksen and Stephen White, NOAA/NGS
Federal Emergency Management Agency (FEMA): Kimberly Pettit, FEMA
U.S. Geological Survey (USGS): Kari Craun, USGS
U.S. Army Corps of Engineers (USACE): Jim Garster, USACE
National Geospatial-Intelligence Agency (NGA): Stephen Malys, NGA
3:05 – 3:25 Break
3:25 – 4:55 Impacts of New Datums on Programs and Partners (Part 2)
Geospatial and Remote Sensing Customers: Amar Nayegandhi, Dewberry
Geographic Information System (GIS) Customers: Kevin Kelly, Esri
Global Navigation Satellite System (GNSS) Equipment Customers: Hamid Mahmoudabadi, Trimble Kyle Snow, Topcon
State Government Partners: Gary Thompson, N.C. Department of Public Safety
Local Government Partners: Vickie Anglin, Fairfax County Government, Virginia; Patrick Simon, Baltimore County Land Survey, Maryland
4:55 – 5:00 Wrap-up and closingIn order for consistency, NGS provided guidance and a set of template slides for guest presenters to use. Guest presenters were allotted 10 minutes to present and limited to four slides. The presentation by the guest presenters are not on NGS’ Presentations Library but I’ve been told that they will be available on the Summit website later this year. Gary Thompson, Chief of the North Carolina Geodetic Survey (NCGS), provided me a copy of his slides and gave me permission to include them in this column. (See box titled “Power point Slides Presented by Gary Thompson, Chief of NCGS, at the NGS 2017 Geospatial Summit.”) North Carolina has been very proactive in addressing the impacts of the new datums on NC products and services. North Carolina Geodetic Survey has established a North Carolina Geodetic Survey Advisory Committee that reviews NCGS products and services, and they have established the North Carolina 2022 Reference Frame Working Group to prepare for the new datums.


Slide: National Geodetic Survey Powerpoint slides presented by Gary Thompson, chief of NCGS, at the NGS 2017 Geospatial Summit
All of the presentations by the invited guest speakers were interesting, and everyone followed NGS’ guidance which helped to focus the Summit on the main issues associated with a datum change. As expected, each stakeholder had their own set of issues and concerns about transitioning to a datum. The following are some common themes that I heard from the participants:
(1) There are a lot of products and services that will be effected by a datum change,
(2) An official transformation model between the old and new datum(s) published by NGS is critical for a successful transition to a new datum,
(3) Guidance documents that are “easily” understood by “non-geodesists” is required for a smooth implementation of a new datum, and
(4) More frequent geospatial summits and webinars are needed to provide updates on the status of the projects associated with NSRS modernization and to ensure user involvement in the process.I contacted a couple of the guest presenters to discuss their feedback on the New Datums. As NAVD 88 Program Manager, I collaborated with many of them during the development and implementation of the NAVD 88. As in the transition from NGVD 29 to NAVD 88, it’s not the conversion of coordinates that’s a problem; a good transformation tool should meet that requirement. Saying that, it was stated that many users rely on commercial and open source software to convert their data, so they would like NGS to collaborate with others to ensure that these software suppliers are using the appropriate algorithms/information in their products. The integration with legacy data referenced to older datums may be complicated for some products and services; therefore, the process of transforming each product and service will need to be addressed individually. If all data are in digital form with the appropriate metadata, then the transformation should be relatively easy to accomplish and maps with new contour lines or new base flood elevations referenced to the new datum could be generated. However, how these new maps are integrated with old maps is a different issue. I will address some of these potential issues in future columns.
To prepare implementation plans, users must obtain a working knowledge of the differences between the old and new datums. As previous mentioned, the absolute differences between the new vertical reference frame, NAPGD2022, and NAVD 88 are going to be large but, in most regions of the country, the relative differences over small areal extents will be small. To evaluate the relative differences at the local level, the differences between NAPGD2022 and NAVD 88 (and NGVD 29) were computed for bench marks in the NGS’ GPS on BMs dataset. The NAD 83 (2011) latitude, longitude, and ellipsoid height of each station was transformed to the IGS08 reference frame using NGS’ HTDP web tool, and then the GNSS-derived orthometric height was computed using the following formula:
Approximate NAPGD2022 GNSS-Derived Orthometric Height
Equals
IGS08 Ellipsoid Height minus xGeoid16b Geoid Height (referenced to IGS08).Figure 1 is a plot of the difference between the approximate NAPGD2022 height and the published NAVD 88 height for bench marks that are part of the GPS on BMs dataset and have the published attribute of “Adjusted.” It should be noted that these are only estimated changes because the final NAPGD2022 reference frame will not be exactly the same as the current IGS08 reference frame, but these estimates should serve the purpose of providing approximate changes for users to develop transition plans.
Since some users are still converting NGVD 29 heights to NAVD 88 heights, the approximate change between NAPGD2022 and NGVD 29 is provided in figure 2. VERTCON values were used to convert the NAVD 88 published heights to NGVD 29 heights, and then the difference between the approximate NAPGD2022 orthometric height and the NGVD 29 orthometric height was computed.
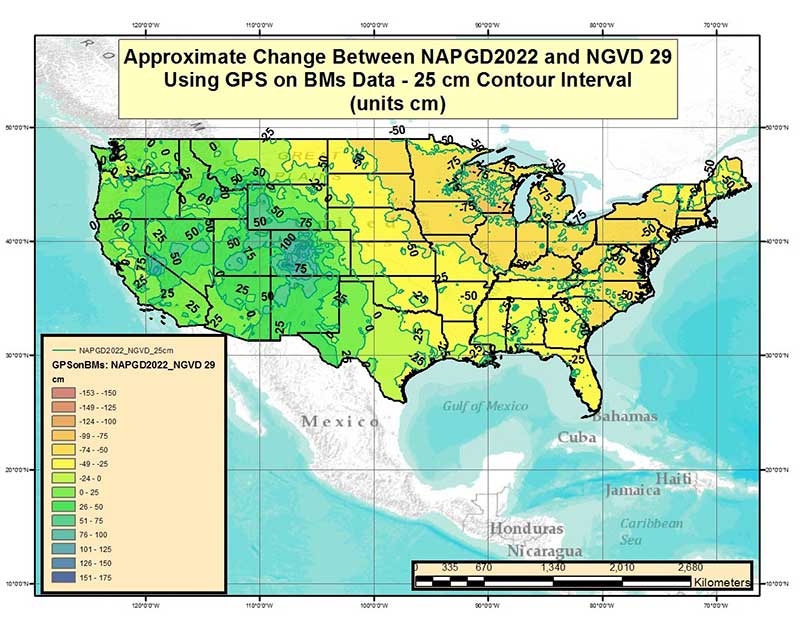
Figure 2 – Approximate Change Between NAPGD2022 and NGVD 29 Using GPS on BMs Data (units = cm). (Image: National Geodetic Survey) As shown in figure 2, the absolute differences between the new vertical reference frame, NAPGD2022, and NGVD 29 are also going to be large but, once again, in most regions of the country, the relative differences over small areal extents will be small.
What does this look like in a local area? Figure 3 is a plot of the approximate change between NAPGD2022 and NAVD 88 in North Carolina and surrounding states, and figure 4 is plot of the approximate change between NAPGD2022 and NGVD 29 in North Carolina and surrounding states.
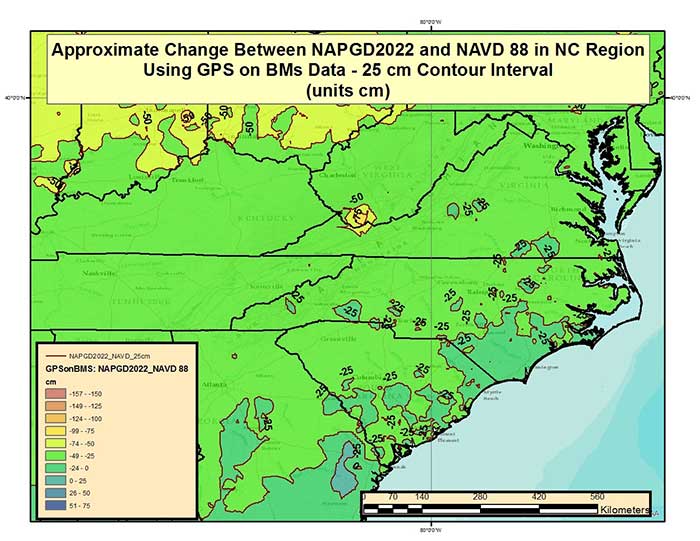
Figure 3 – Approximate Change Between NAPGD2022 and NAVD 88 in North Carolina and Surrounding States Using GPS on BMs Data (units = cm). (Image: National Geodetic Survey) 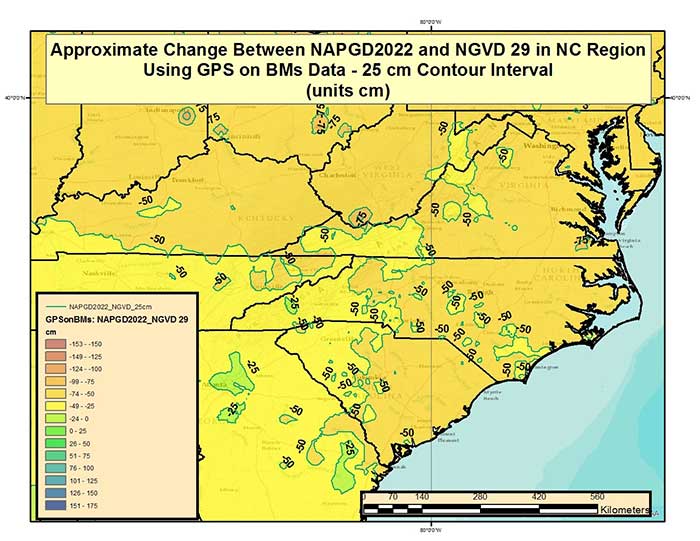
Figure 4 – Approximate Change Between NAPGD2022 and NGVD 29 in North Carolina and Surrounding States Using GPS on BMs Data (units = cm). (Image: National Geodetic Survey) Figure 5 provides a more detailed depiction of the change between NAPGD2022 and NAVD 88 along the North Carolina Atlantic Coast. The differences appear to vary by several centimeters but some of these differences are due to errors in published heights (both ellipsoid and orthometric). These differences can be used to develop a transformation model but the user will need to know the accuracy of the model, globally and locally.
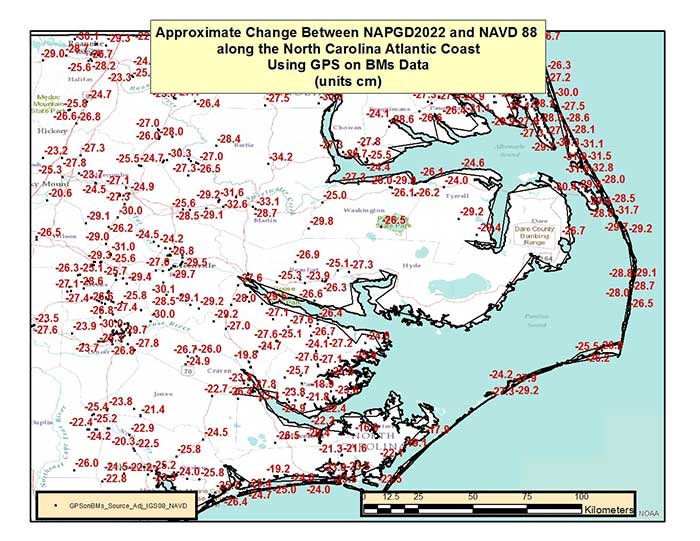
Figure 5 – Approximate Change Between NAPGD2022 and NAVD 88 along North Carolina Atlantic Coast Using GPS on BMs Data (units = cm). (Image: National Geodetic Survey) Figure 6 is a detailed depiction of the change between NAPGD2022 and NGVD 29 in the same area as shown in figure 5. Comparing figures 5 and 6, the reader should notice that the differences between NAPGD2022 and NGVD 29 are about 30 cm larger (more negative) than the differences between NAPGD2022 and NAVD 88.
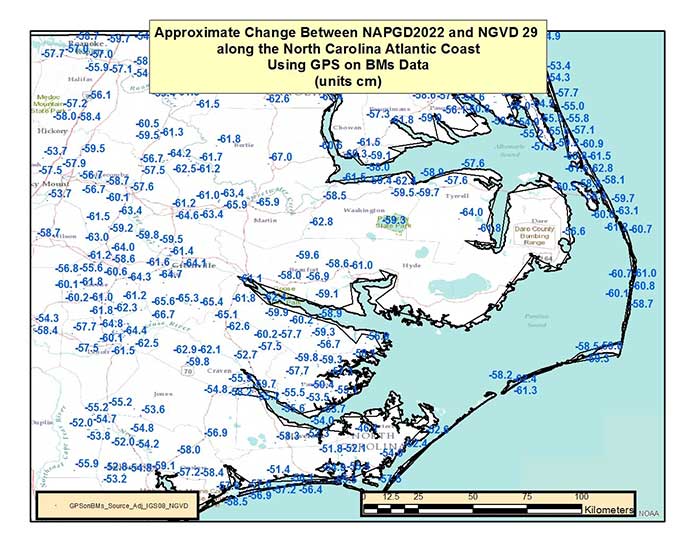
Figure 6 – Approximate Change Between NAPGD2022 and NAVD 29 along North Carolina Atlantic Coast Using GPS on BMs Data (units = cm). (Image: National Geodetic Survey) Figure 7 is the difference between NAPGD2022 and NAVD 88 in western North Carolina. The local difference in the NC mountains is around -35 cm which is about 10 cm different from the NC Atlantic Coast. Questions that users need to address include: What is the accuracy of the transformation model? And What is the accuracy of the product or service being transformed? The transformation model will not replace the original survey results but may be useful for transforming some products and services.
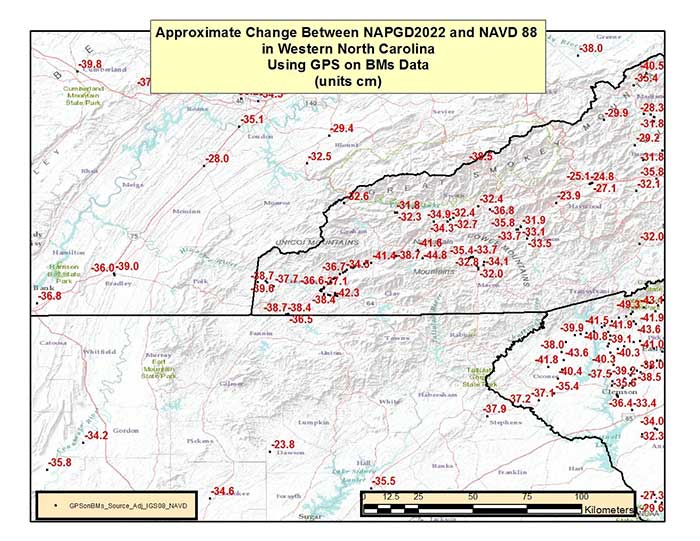
Figure 7 – Approximate Change Between NAPGD2022 and NAVD 88 in the Western North Carolina Using GPS on BMs Data (units = cm). (Image: National Geodetic Survey) Table 1 provides the average difference between NAPGD2022 and NAVD 88 (and NGVD 29) by State using the GPS on BMs dataset. This table shows that there are large differences between NAPGD2022 and both NGVD 29 and NAVD 88. No matter which datum the product or service is referenced to, it will probably need to be transformed to NAPGD2022.
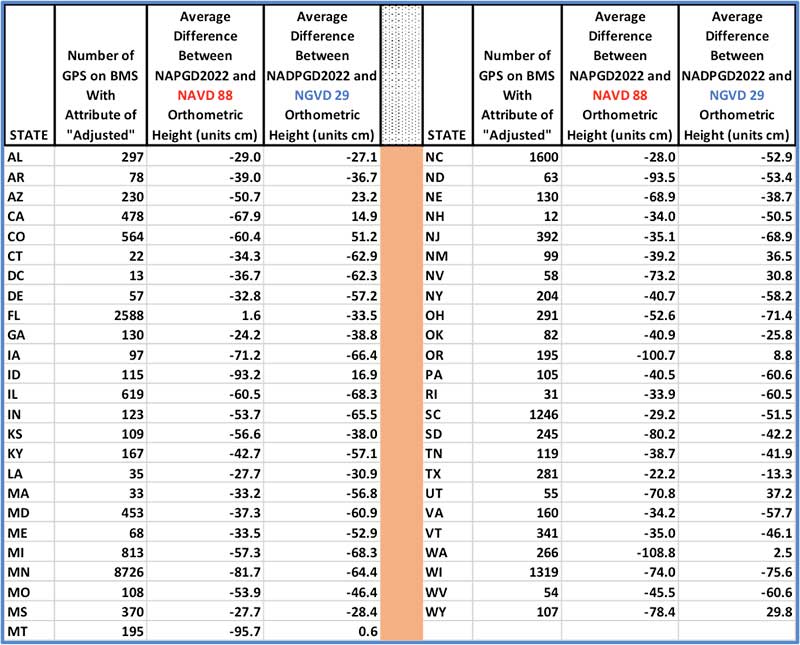
Table 1 – Average Difference Between NAPGD2022 and NAVD 88 (and NGVD 29) by State Using GPS on BMs Dataset (units = cm). Click to enlarge. (Date: National Geodetic Survey) 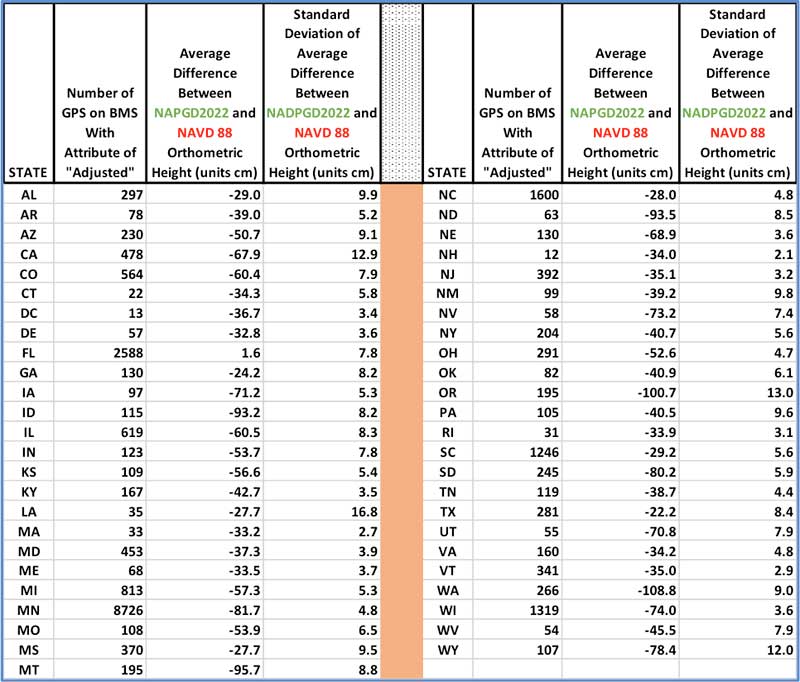
Average Difference Between NAPGD2022 and NAVD 88 by State Using GPS on BMs Dataset (units = cm). Click to enlarge. (Date: National Geodetic Survey) Table 2 provides the standard deviation of the average difference between NAPGD2022 and NAVD 88 by State. For example, North Carolina has a sample size of 1600 stations and its average difference is -28 cm with a standard deviation of 4.8 cm. Looking at figures 5 and 7, there appears to be a difference of 10 cm across the State. The States in the northwestern region of the United States have a larger difference between NAPGD2022 and NAVD 88 as well as a larger standard deviation. Oregon has a sample size of 195 stations and its average difference is -100.7 cm with a standard deviation of 13.0 cm, and Washington has a sample size of 266 stations and its average difference is -108.8 cm with a standard deviation of 9.0 cm. Figure 8 is a plot of the approximate change between NAPGD2022 and NAVD 88 in the northwest region of the United States.
As mentioned previously, these differences will vary from station to station because of a bias and trend between the two datums and due to remaining errors in published heights (both ellipsoid and orthometric). As I have noted in previous columns, many of the large relative differences between stations in a local area could be due to an invalid NAVD 88 published height because the bench mark moved since the last time the height of the bench mark was adjusted and published, and/or an undetected error in an ellipsoid height due to a weak GNSS project design. Either way, in my opinion, most of these stations with large relative differences don’t accurately represent the current NAVD 88. NGS’ modernization of the NSRS will provide a more accurate and consistent reference frame, and improve the user’s ability to obtain a current and accurate orthometric height.
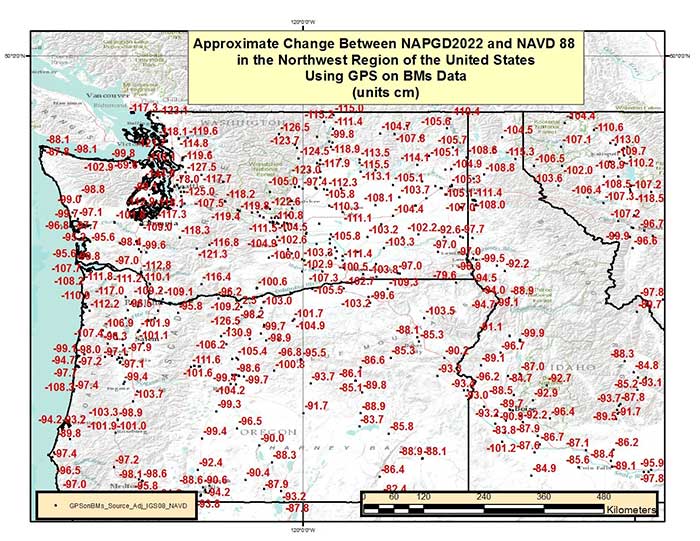
Figure 8 – Approximate Change Between NAPGD2022 and NAVD 88 in the Northwest Region of the United States Using GPS on BMs Data (units = cm). (Image: National Geodetic Survey) This column highlighted some of the feedback provided by guest presenters at the NGS’ 2017 Geospatial Summit held on April 24-25, 2017, in Silver Spring, Maryland. The column also provided a discussion on the approximate differences between NAPGD2022 and NAVD 88 (and NGVD 29) at a national and local level. To prepare for the new datums and develop implementation plans, users should obtain an understanding of the differences between NAPGD2022 and NAVD 88. This column is the first in a new series of columns addressing topics associated with transitioning to the new North American -Pacific Geopotential Datum of 2022 (NAPGD2022).
-
OxTS showcases xNAV, tight coupling technology at Xponential 2017
OxTS’ Iain Clarke discusses the company’s xNAV miniature INS and latest tight coupling technology at AUVSI’s Xponential 2017 in Dallas.
-
Spectracom showcases latest PNT products at Xponential 2017
Spectracom’s Jon Sinden discusses the company’s latest PNT products, including the SecureSync and VersaSync lines, at AUVSI’s Xponential 2017.
-
Harris displays RangeVue UAS detect-and-avoid system at Xponential 2017
Harris Corporation’s James Cieplak discusses the company’s RangeVue UAS detect-and-avoid system and how it works at AUVSI’s Xponential 2017 in Dallas.
