Andy Yin, international sales director at ComNav Technology Ltd., talks about the company’s M300 Pro and new OEM boards at INTERGEO 2015, which was held Sept. 15-17 in Stuttgart, Germany.
The M300 Pro GNSS reference station receiver integrates ComNav’s new-generation OEM board and includes web service and remote control features.
The first OEM board, which can support all GNSS constellations (GPS, GLONASS, BeiDou and Galileo), will be released at the end of September, according to ComNav.
Martin Newman, director at Innovelec Solutions Ltd. (an official UK distributor of NVS Technologies AG) discusses NVS’ OEM receivers at INTERGEO 2015, which was held Sept. 15-17 in Stuttgart, Germany.
The NV08C-RTK and NV08C-RTKA are multi-constellation receivers with embedded RTK functionality. They are fully compatible with GPS, GLONASS, Gaileo and BeiDou constellations and are specifically designed for use in high accuracy applications.
Javad Ashjaee of JAVAD GNSS introduces at INTERGEO 2015 a video by Shawn Billings of Billings Surveying & Mapping who discusses the features and advantages of the JAVAD TRIUMPH-LS. INTERGEO was held Sept. 15–17 in Stuttgart, Germany.
Javad Ashjaee of JAVAD GNSS introduces at INTERGEO 2015 a video by Shawn Billings of Billings Surveying & Mapping who explores the JAVAD TRIUMPH-LS camera offset survey function in depth. INTERGEO was held Sept. 15–17 in Stuttgart, Germany.
Trimble debuted its new R2 GNSS receiver at Intergeo 2015, held this week in Stuttgart, Germany.
The R2 GNSS receiver is a receiver that works with Trimble handheld devices and iOS, Android or Window mobile handhelds, smartphones and tablets using Bluetooth or USB connectivity. When paired with a mobile device, the receiver adds professional-grade GNSS capabilities for better accuracy. The rugged Trimble R2 provides GIS and survey professionals the flexibility to choose the mobile device, workflows and accuracy they need based on applications.
Trimble R2 GNSS Receiver for Mobile Devices
The Trimble R2 GNSS receiver is compact and portable, weighing 2.4 pounds. With one-button operation and a field swappable battery, the receiver can be pole or vehicle mounted or carried on a backpack. The R2 is a multi-constellation receiver that supports GPS, GLONASS, Galileo, BeiDou and QZSS satellite signals, as well as SBAS.
With a variety of standard and optional correction capabilities, the Trimble R2 can achieve sub-meter to centimeter positioning for a broad range of accuracy requirements. The receiver is an option for the Bring Your Own Device (BYOD) strategy.
“Today’s geospatial professionals require flexible solutions which allow for configuration to meet their specific job requirements,” said Ron Bisio, general manager of Trimble’s Surveying and Geospatial Division. “The Trimble R2’s versatility to support GIS and survey workflows as well as BYOD deployment enables geospatial professionals to collect data using the mobile device, workflow and accuracy they choose.”
Workflows – GIS and Survey Field Software
Designed for both GIS field data collection and survey workflows, the Trimble R2 receiver integrates with Trimble TerraFlex mapping and GIS field software and Trimble Access survey field software.
TerraFlex software is a scalable cloud-based solution for geospatial data collection. By pairing the R2 with a smart device or Trimble handheld running TerraFlex, the solution addresses a wide variety of field requirements, including attribute-rich GIS data collection on consumer and professional devices.
Trimble Access software supports the workflows of everyday surveying tasks such as topographic and control surveys and specialized surveying tasks such as roads, monitoring, tunnels and mines. By pairing the receiver with a Trimble handheld running Trimble Access or TerraFlex field software, the Trimble R2 is a versatile solution that supports the full range of geospatial data collection workflows for both GIS and survey applications.
Flexible Accuracy
The receiver is capable of receiving a broad range of corrections from traditional RTK, VRS networks and SBAS to Trimble RTX correction services via cellular/IP connections or satellite (L-band), the Trimble R2 provides high-accuracy data worldwide.
The R2 GNSS receiver can leverage the entire portfolio of subscription-based Trimble RTX correction services to accommodate a wide range of applications and accuracy requirements. This includes CenterPoint RTX (less than 4 centimeters), RangePoint RTX (less than 50 centimeters), and ViewPoint RTX (less than 1 meter) correction services.
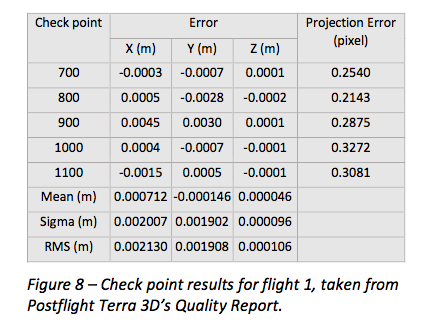
senseFly has published a white paper named “Generating highly accurate 3D data using a senseFly eXom drone” which presents the results of two photogrammetric land surveys of a construction site. The project was completed earlier in September using two senseFly eXom close mapping and inspection drones, and the announcement was made during INTERGEO, held Sept. 15–17 in Stuttgart, Germany.
The results demonstrate that 3D point clouds produced with an eXom quadcopter can reach a global precision comparable to that of a total station survey and meet the typical accuracy requirements of construction projects, according to a news release from senseFly.
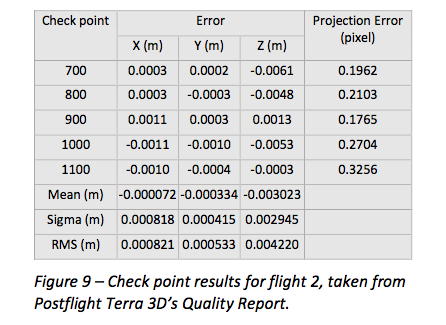
The first eXom survey (figure 8) achieved 2.1 millimeter accuracy in X, 1.9 millimeter in Y and 0.1 millimeter in Z (RMSE). The second eXom survey (figure 9) achieved 0.8 millimeter (X), 0.5 millimeter (Y) and 4.2 millimeter (Z).
“This degree of absolute accuracy from a drone is unparalleled and positions the eXom as a surveying instrument that is comparable in performance to standard total stations,” said Andrea Halter, senseFly’s co-founder. “These results were due, in part, to the high 38 MP resolution and sharpness of the flight’s images, captured by the main camera inside eXom’s TripleView head. Add to this image quality the ability to operate close to the terrain and the introduction of highly precise ground controls and you have a recipe for exceptionally accurate 3D data.”
Two eXom drones flew separate survey missions at an altitude of 14 meters above the site, achieving an average ground sampling distance (GSD) of 2.2 millimeters, senseFly says. All the flights were completed using the drone’s Interactive ScreenFly flight mode, whereby the UAV (unmanned aerial vehicle) is controlled using a handheld ScreenFly controller connected to senseFly’s eMotion X flight planning and control software.
This flight mode’s “cruise control” feature, combined with its auto-trigger function, enabled each of the eXom drones to survey the 1,100-square-meter site in a single flight. Meanwhile, the live on-screen feedback from the drone’s five different navcams and ultrasonic proximity sensors helped the operator ensure that no contact was made with either the on-site crane or any the trees surrounding the complex site, senseFly says.
“This project’s flights took place at 14 meters above the ground, but with the eXom’s Distance Lock feature we are able to safely fly just 4 meters away, so it isn’t unrealistic to think that the accuracy we achieved could be improved still further.”
To download the eXom accuracy white paper click here.
NavCom’s Luke Wilson talks about the company’s StarFire network and GNSS receivers at INTERGEO 2015, held Sept. 15–17 in Stuttgart, Germany. To learn more about the StarFire network visit http://bit.ly/1iNejWy.
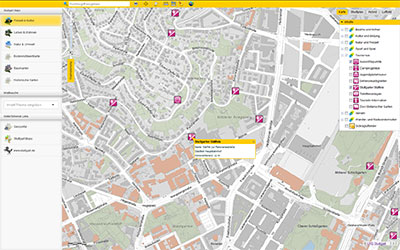
This year’s Intergeo host city, Stuttgart, offers interactive city maps packed with geoinformation in an effort to become a “smart city.” Founded in 2001, Working Group Geoinformation Systems of Stuttgart (GIS AG) has evaluated environmental and traffic issues, sustainable urban development and solutions for a climate-friendly energy supply. Intergeo 2015 is being held Sept. 15–17.
Stuttgart is growing, according to a news release from Intergeo, and will continue to do so for the foreseeable future as newcomers flock to the region’s urban capital city. The number of inhabitants in the region has increased from 2.4 million in 1990 to 2.7 million today, Intergeo officials said.
Stuttgart authorities have forged action plans addressing mobility, energy and a sustainable living environment, “and we lay the foundation for each of these spheres,” said Markus Müller, head of the geoinformation and cartography department at the City Surveyor’s Office.
Müller wants to see Stuttgart’s immense GIS data put to the widest possible use, according to the news release. He believes that the move towards the “intelligent city,” also known as a “smart city” or “city of tomorrow,” is only a matter of time.
Intelligently Networked
Stuttgart’s geoinformation and cartography department is frequently called upon — whether it’s for a simulation of the different planning options for a new city headquarters in the heart of the city, long-term monitoring of the building works related to the Stuttgart 21 infrastructure project, implementing traffic concepts in the congested regional capital or planning affordable living.
Stuttgart Aims for Dynamic, Interactive Maps
Müller and his team are on a mission to bring geoinformation into wider circulation and further optimize the local authorities’ workflows. They plan for a perfectly tailored geographic information system (GIS) for professional administrators, as a public information tool and as an increasingly important preparatory aid for political decision-making.
GIS-AG was founded in Stuttgart in 2001 to accomplish that task, and it now encompasses 15 specialist departments and municipal enterprises, according to Intergeo. Visit Stuttgart’s city website [click here for English] to find geoinformation — the city map alone covers about 70 subject areas, such as nature and the environment, leisure and culture, mobility and traffic, and planning and construction.
“The city map scores a lot of hits, probably also due to its accessibility on all platforms,” Müller said. The city map is just one piece of the puzzle in the ‘Stuttgart Maps’ project, which is aimed at making geographical information increasingly accessible to the public. The idea is to offer more and more data and to construct dynamic, interactive maps from the city plans in order to make the city truly intelligent.
Photo courtesy: Alen Ajan / Fotolia.com
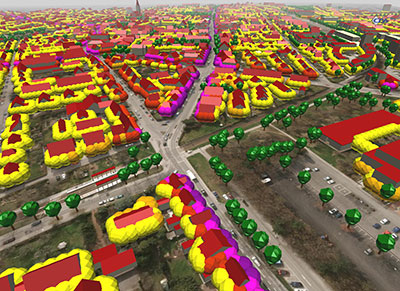
Sensor and Real-Time Data
“The automatic capture of sensor data and the visualization of real-time data will continue to increase as intelligent cities develop,” Müller said.
In relation to energy, this could mean interactive evaluation and visualization of the potential uses for waste-water heating, or dynamic representations of the city’s energy consumption or heating requirements. Traffic flow could be visualized and the spread of emissions depicted.
“Once the foundation has been laid, ways can be found to optimize these systems and manage their success,” Müller said.
Photo courtesy: Alen Ajan / Fotolia.com
Smart City Hamburg?
Intergeo’s host city for 2016, Hamburg, is already seeking intelligent concepts for the cities of tomorrow — just like those already in use in Berlin, the host city for Intergeo 2017.
GIS AG will be at Intergeo, stand C8.025 in Hall 8, with 10 departments and municipal enterprises from Stuttgart’s public authorities showcasing innovative applications and solutions using GIS.
INTERGEO 2015, to be held Sept. 15-17 in Stuttgart, Germany, is the world’s leading conference trade fair for geodesy, geoinformation and land management.
Geospatial Solutions and GPS World‘s Art Kalinski reports from eMerge Americas, held May 4-5 in Miami. eMerge Americas is a global idea exchange focusing on how technology and innovation are disrupting industries. The conference serves as a platform connecting startups, cutting-edge ideas and global industry leaders and investors across North America, Europe and Latin America.
This Landsat 8 image, Caltech acquired on Sept. 6, 2014, is a false-color view of the Holuhraun lava field north of Vatnajökull glacier in Iceland. The Bárðarbunga caldera is visible in the lower left of the image under the ice cap. Photo: U.S. Geological Survey / Caltech
Access to satellite images and GPS data has allowed scientists to document the collapse of the Bárðarbunga caldera, a volcano beneath the Vatnajökull ice cap in Reykjavik, Iceland.
Mark Simons, a professor of geophysics at the California Institute of Technology (Caltech), traveled to Reykjavik with 15 students and two faculty members on Aug. 16, 2014, to lead a tour of the volcanic, tectonic, and glaciological highlights of Iceland. That day, earthquakes occurred — the seismicity was related to the Bárðarbunga caldera.
Simons is one of the leaders of a Caltech and Jet Propulsion Laboratory (JPL) project known as the Advanced Rapid Imaging and Analysis (ARIA) program, which aims to use a growing constellation of international imaging radar satellites that will improve situational awareness and response following natural disasters, according to Caltech. Under the ARIA umbrella, Caltech and JPOL, managed for NASA by Caltech, had formed a collaboration with the Italian Space Agency (ASI) to use its COSMO-SkyMed (CSK) constellation — consisting of four orbiting X-Band radar satellites — following such events.
CSK used an interferometric synthetic aperture radar (InSAR) technique to gather images of the surface of the glacier above the caldera. By the evening of Aug. 28, Caltech says the first interferogram showed that the ice above the caldera was subsiding at a rate of 19.685 inches a day.
Simons took the data to researchers at the University of Iceland who were tracking Bárðarbunga’s activity on Aug. 29.
“At that point, there had been no recognition that the caldera was collapsing. Naturally, they were focused on the dyke and all the earthquakes to the north,” Simons said. “Our goal was just to let them know about the activity at the caldera because we were really worried about the possibility of triggering a subglacial melt event that would generate a catastrophic flood.”
The flood never occurred, but Caltech says the researchers at the University of Iceland increased their observations of the caldera with radar altimetry flights and installed a continuous GPS station on the ice overlying the center of the caldera.
The Icelandic researchers published a paper in December 2014 in Nature about the Bárðarbunga event, largely focusing on the dyke and eruption. Simons and his colleagues have developed a model to describe the collapsing caldera and the earthquakes produced by that action. The new findings appear in the Geophysical Journal International.
Bryan Riel, a graduate student in Simons’s group and lead author on the paper, used the interferogram of the Bárðarbunga area, along with four others collected by CSK in September and October, to show that the earthquakes were not the primary cause of the surface deformation inferred from the satellite radar data.
“What we know for sure is that the magma chamber was deflating as the magma was feeding the dyke going northward,” Riel said in the article. “We have come up with two different models to explain what was actually generating the earthquakes.”
“Because we had access to these satellite images as well as GPS data, we have been able to produce two potential interpretations for the collapse of a caldera — a rare event that occurs maybe once every 50 to 100 years,” Simons said. “To be able to see this documented as it’s happening is truly phenomenal.”
Geospatial Solutions’ and GPS World‘s Art Kalinski reports from eMerge Americas, held May 4-5 in Miami. eMerge Americas is a global idea exchange focusing on how technology and innovation are disrupting industries. The conference serves as a platform connecting startups, cutting-edge ideas and global industry leaders and investors across North America, Europe and Latin America.