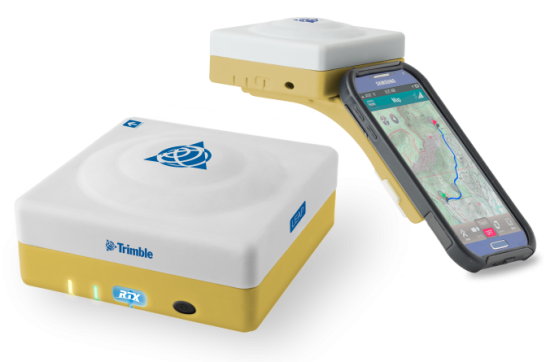
The Trimble Leap, also shown with a smartphone. Photo: Trimble
Trimble is making available the Trimble Leap, a Trimble RTX compatible GNSS Bluetooth device. When enabled with the ViewPoint RTX correction service, Leap delivers submeter accuracy directly to the Terrain Navigator Pro (TNP) Mobile app for iOS and Android devices. The TNP Mobile app allows users to collect markers, tracks and geo-stamped photos in the field, and then sync all the GNSS data into the Terrain Navigator Pro office software.
The TNP Mobile app enables users to:
Display and navigate routes created in TNP desktop.
Collect field data such as markers, tracks, photos, videos and audio clips.
Near real-time sync between phone and TNP map software via WiFi or cellular data connection.
View data on topo, aerial, and street maps downloaded to phone for offline use. Terrain Navigator Pro offers 1-meter aerial photos for the 48 contiguous United States. The seamless USGS topo graphic maps are based off 1:24K, 1:100K, 1:250K map scales. Alaska is 1:63K and 1:250K.
Access a compass and other geo-information such as lat/long, elevation, and direction on phone.
Collect data offline. The TNP mobile app uses the GPS built into the smartphones, so users can collect field data in areas without a cellular or data signal.
Trimble Leap is compact and portable, weighing 9.5 ounces. It snaps to a smartphone or tablet to use as a handheld, can be mounted on a monopole or tripod, or can be magnet mounted to a vehicle. Leap has 16 hours of battery life and uses Bluetooth communication to connect to smart devices for ease of use and flexibility. An onboard micro SD card stores the GNSS observables data for use in the field or the office.
A micro USB port can provide power to Trimble Leap for continuous fixed-mount applications, or it can be used with battery-booster products to extend field work. Trimble Leap is charged by a standard cell phone vehicle accessory charger, a USB connection to a PC, or from a USB AC adapter.
Based on Trimble RTX (Real Time eXtended) technology, ViewPoint RTX delivers better than 1 meter horizontal accuracy 95 percent of the time without the use of a traditional RTK base station or virtual reference station network. ViewPoint RTX is delivered into the TNP Mobile app via cellular data network and is available nearly anywhere in the world.
“Trimble Leap enhances the Terrain Navigator Pro solution by adding a simple way to collect submeter accurate geolocation data with standard Android or iOS devices. Adding accuracy to TNP’s robust field-to-office data collection solution provides a value-add where low-resolution collection is not sufficient. Trimble Leap with TNP Mobile is configured and operational in minutes with little training,” said Larry Fox, business area manager for Terrain Navigator Pro.
Terrain Navigator Pro integrates powerful desktop mapping software, a cloud connected mobile data collection platform (compatible with GPS-enabled iOS and Android devices) and a robust Web portal. TNP users can plan projects in the office, collect data in the field and access projects from the Web—simultaneously. Geo-referenced data such as tracks, waypoints, photographs and video can be shared, updated in near real-time and displayed on the included topographic, aerial/satellite or street base maps.
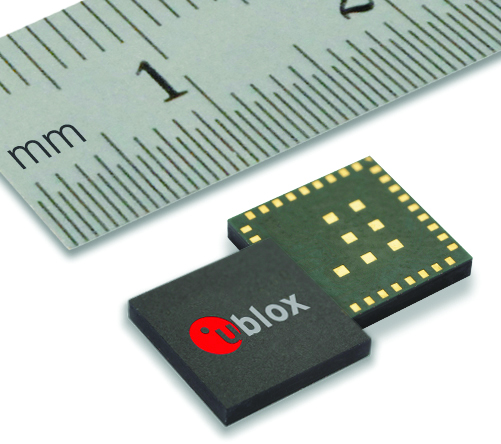
Swiss-based u‑blox has introduced the EVA‑M8M stand-alone positioning module. The EVA-M8M GNSS module brings concurrent multi-GNSS performance into the ultra-compact EVA footprint.
Designed for cost- and space-sensitive applications, the highly integrated 7 x 7 x 1.1 mm LGA module comprises all necessary components, including crystal and passives. EVA-M8M only requires an external antenna to provide an accurate position without the need for host integration. Components have been selected for reliable operation in the field over the full operating temperature range. The module is also compatible with the EVA-7M GPS module, allowing for easy upgrading of existing designs at minimal cost, u-blox said.
The module supports GPS, GLONASS, BeiDou, QZSS, and SBAS augmentation systems. Based on u‑blox M8 performance, the module achieves -164 dBm tracking sensitivity, fast acquisition time and low power consumption. EVA-M8M can track any two GNSS systems simultaneously and output a GNSS position up to 18 Hz.
“The EVA-M8M sets a new industry benchmark for compact, stand-alone global positioning performance. The module has been designed for the absolute lowest eBOM costs and ease-of-manufacturing. It is a perfect solution for cost-sensitive industrial and wearable devices,” said Thomas Nigg, vice president of product strategy at u-blox.
A UART, USB, SPI and I2C interface provide flexible connections to a host processor. EVA-M8M can also communicate directly with u‑blox’ SARA 2G, LISA 3G and TOBY 4G cellular modules to support advanced tracking and location-aware products.
Detailed information about the EVA-M8M can be found on the u-blox website. Samples are available now. For existing designs using a NEO module, the C88-M8M adaptor board can be used for easy evaluation of the EVA-M8M in existing NEO-xM designs.
The second GLONASS-K1 satellite on its way to the Plesetsk Cosmodrome. Photo: CANSPACE Listserv
News courtesy of CANSPACE Listserv.
According to ISS Reshetnev, the manufacturer of GLONASS satellites, the second GLONASS-K1 satellite (serial number 12L) has just been delivered to the Plesetsk Cosmodrome. It is now being prepared for launch November 30. The launch date had previously been set as November 20.
Reshetnev made a number of production design changes to this GLONASS satellite, allowing an expansion of the functionality of the satellite and an improvement its performance. The satellite will transmit five navigation signals in three frequency bands: L1, L2, and L3. The satellite is built on the unpressurized Express-1000K platform. The designed lifetime of the satellite is 10 years.
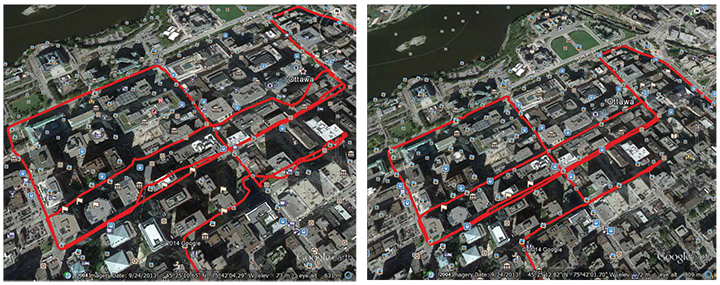
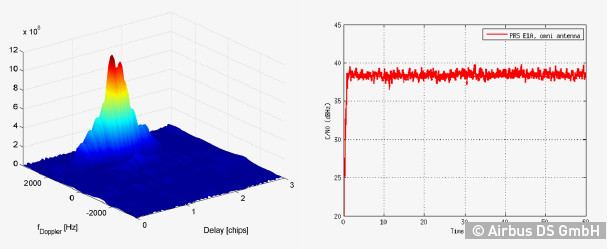
A single-feed smart antenna (left) compared to the multipath rejection results of the new TW5340 smart antenna with Accutenna technology. Photo: Tallysman
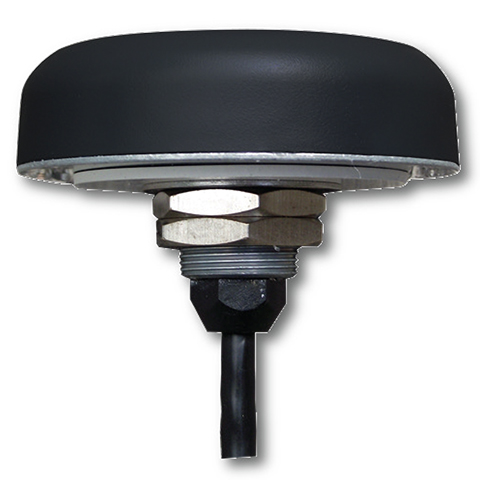
Tallysman’s new TW5340 smart antenna is designed to pair Tallysman‘s Accutenna technology antenna with STMicroelectronics’ Teseo II receiver. The combination makes the smart antenna accurate for use in all environments, including urban canyons, according to the company.
The TW5340 is a multi-constellation GNSS Smart Antenna that provides simultaneous GPS/GLONASS/SBAS reception. It is designed for use in professional-grade applications such as precision timing, network synchronization, low current applications, and tracking/positioning applications.
To illustrate the advantages of this technology coupling, simultaneous recordings of vehicle position were conducted using two smart antennas — one with and one without Tallysman’s Accutenna technology — in an area of downtown Ottawa, Canada, notorious for high levels of multipath signals. Results show how the high multipath signal rejection capabilities of Tallysman’s Accutenna technology greatly improves accuracy, the company said.
The Tallysman TW5340 smart antenna.
The TW5340 supports STMicroelectronics Autonomous A-GPS, which accelerates GPS positioning by predicting satellite ephemeris data based on previous observations. This results in extremely fast time-to-first-fix. The TW5340 can be configured to output up to three NMEA 0183 message lists with navigation update rates up to 10 Hz. RS232, CMOS, and USB interfaces are available with input voltage options of 3,3V, 5.0V, and 12V. A standby-mode feature provides for very low current consumption (<100uA) and is particularly useful in battery-operated applications.
A standard one pulse-per-second 1PPS synchronized to UTC time is available as a single ended output or as a differential output at RS422 levels.
Tallysman’s Windows-based Configurator enables simple configuration of parameters such a baud rates, output message rates, constellation, tracking parameters, 1 PPS configuration and standby-mode parameters.
The TW5340 is housed in an IP67 housing and is REACH and ROHS compliant. A non-magnetic version is also available as Part Number TW5341.
Photo: Mark L. Psiaki, Brady W. O’Hanlon, Steven P. Powell, Jahshan A. Bhatti, Todd E. Humphreys, and Andrew Schofield
Spoofing Detection with Two-Antenna Differential Carrier Phase
By Mark L. Psiaki, Brady W. O’Hanlon, Steven P. Powell, Jahshan A. Bhatti, Todd E. Humphreys, and Andrew Schofield
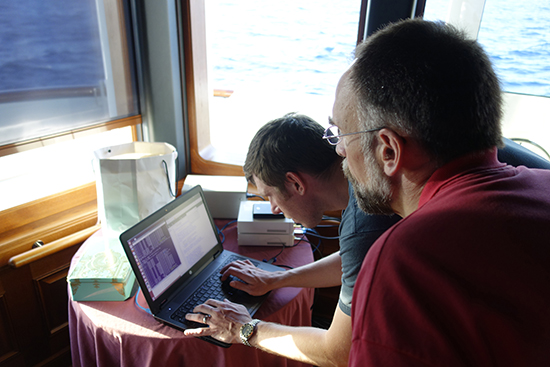
A new method detects spoofing attacks that are resistant to standard RAIM technique and can sense an attack in a fraction of a second without external aiding. The signal-in-space properties used to detect spoofing are the relationships of the signal arrival directions to the vector that points from one antenna to the other. A real-time implementation succeeded against live-signal spoofing attacks aboard a superyacht, the White Rose of Drachs shown above, cruising in international waters.
Concerns about spoofing of open-service GNSS signals inspired early work on simple receiver-autonomous integrity monitoring (RAIM) methods based on the consistency of the navigation solution. Work on new classes of defense techniques began in earnest after the demonstration of a powerful spoofer that is undetectfable by simple pseudorange-based RAIM methods. There has been a sense of urgency to solve the spoofing problem since the Iranians captured a classified U.S. drone in 2011 and made unsubstantiated claims to have spoofed its GPS. Two dramatic field demonstrations of the spoofer developed by author Humphreys and colleagues at the University of Texas, Austin, heightened interest in spoofing detection: one involved deception of a small airborne unmanned autonomous vehicle (UAV), causing it to dive towards the ground; another sent a superyacht off course without raising any alarms on its bridge.
One class of spoofing detection methods uses encrypted signals, their known relationships to the open-service signals, and after-the-fact availability of encryption information. Such techniques require a high-bandwidth communication link between the potential victim of a spoofing attack and a trusted source of after-the-fact encryption information, and may involve significant latency between attack and detection.
Another class of methods uses advanced RAIM-type techniques. Instead of considering only pseudorange consistency, these RAIM techniques examine additional signal characteristics such as absolute power levels, distortion of the PRN code correlation function along the early/late axis, the possible existence of multiple distinct correlation peaks in signal-acquisition-type calculations, and other signal or receiver characteristics. Such methods are relatively simple to implement because they do not require much additional hardware, if any, but some of these strategies can have trouble distinguishing between multipath and spoofing or between jamming and spoofing.
A third class proposes the addition of Navigation Message Authentication bits. These are encrypted parts of the low-rate navigation data message. Such techniques require modification of the navigation data message and can allow long latencies between the onset of a spoofing attack and its detection.
A fourth class exploits the differing signal-in-space geometry of spoofed signals in comparison to true GNSS signals. All spoofed signals typically arrive from the same direction, but true signals arrive from a multiplicity of directions. Some of these methods use receiver antenna motion to achieve direction-of-arrival sensitivity. Others use an array of two or more receiver antennas.
The most powerful of these detection strategies exploit models of the effects on carrier-phase data of antenna motion or antenna-array geometry. This knowledge may be partial because an unknown antenna-array attitude may need to be determined as part of the detection calculation. Their power derives from the high degree of accuracy with which a typical GNSS receiver can measure beat carrier phase.
Goals. This research follows on moving-antenna/carrier-phase-based spoofing detection work. One of our goals has been to remove the necessity for moving parts by using two antennas and processing their carrier-phase data.
A second goal has been to achieve real-time operation. An earlier prototype moving-antenna system (see “GNSS Spoofing Detection,” GPS World, June 2013) used post-processing and completed its spoofing detection calculations days or weeks after the recording of wide-band RF data during live-signal attacks.
A third goal has been to test this system against actual live-signal spoofing attacks to prove its real-time capabilities and evaluate its performance during the two phases of an attack: the initial signal capture and the post-capture drag-off to erroneous position and timing fixes.
Two-Antenna System Architecture
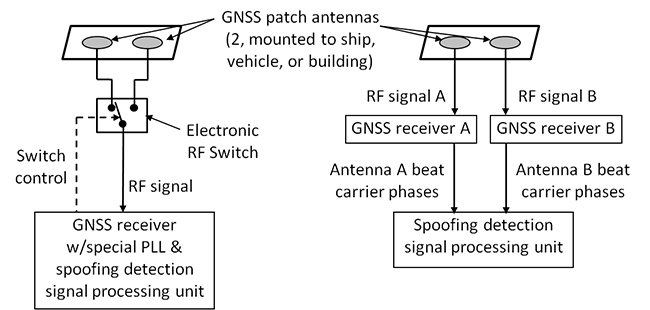
The system consists of two GNSS patch antennas, GPS receiver hardware and software, and spoofing detection signal-processing hardware and software. Figure 1 shows two versions. The left-hand version connects its two patch antennas to an RF switch. The single analog RF output of the switch is input to a GNSS receiver that is standard in all respects, except for two features. First, it controls the RF switch or, at least, has access to the switching times. Second, it employs a specialized phase-locked loop (PLL) that can track the beat carrier phase of a given signal through the phase jumps that occur at the switching times. The right-hand version connects each antenna to an independent GPS receiver, likely connected to a common reference oscillator.
Figure 1. Two configurations:, the RF-switched-signal/single-receiver configuration (left) and the two-receiver configuration (right).
The last element of each system is a spoofing detection signal-processing unit. Its inputs are the single-differenced beat carrier phases of all tracked signals, with differences taken between the two antennas. In the switched antenna system, each difference is deduced by the specialized PLL. In the two-receiver system, the single-differences are calculated explicitly from each receiver’s beat carrier-phase observables.
Except for the final spoofing detection unit, the two-receiver system on the right-hand side of Figure 1 is already available commercially. Typical applications are CDGPS-based attitude/heading determination. Thus, this is the easiest version to implement.
This system could include more than two antennas. A multi-antenna system could have a dedicated RF front-end and a dedicated set of receiver channels for each antenna, as on the right of Figure 1. Alternatively, a multi-antenna system could include an RF switch between any one of the multiple antennas at the command of the receiver. The latter design would entail a slight modification to the specialized PLL to track multiple independent phase jumps for the independent antenna switches.
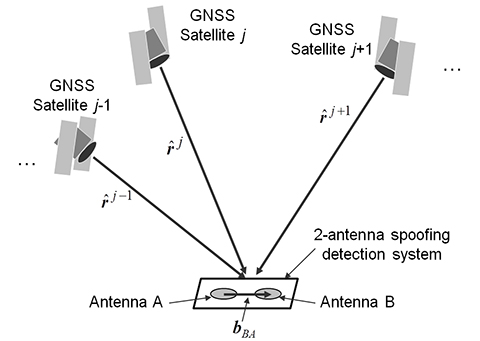
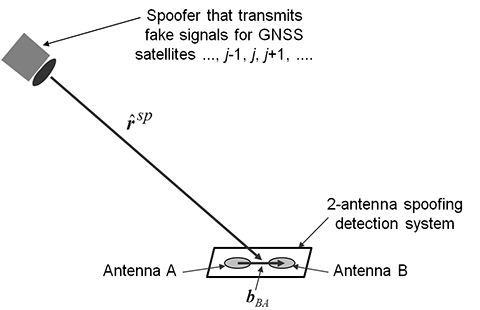
Principles. The principles used to detect spoofing can be understood by considering and comparing the signal-in-space and antenna geometries shown in Figure 2, the two-antenna system and three GNSS satellites for a typical non-spoofed case, and Figure 3, a spoofed case. The salient difference is that the different GNSS signals arrive from different directions for the non-spoofed case, namely and . They all arrive from the same direction, the direction of the spoofer , for the spoofed case. For detection purposes, the important geometric feature is the projection of each direction of arrival onto the known separation vector between the two antennas, bBA. This projection has a direct effect on the beat carrier-phase difference between the two antennas. In the non-spoofed case, this effect will vary between the different received signals in ways consistent with the attitude of the vector. In the spoofed case, all of these carrier-phase differences will be identical. The spoofing detection algorithm decides between two hypotheses about the carrier-phase differences, one conjecturing a diversity consistent with authentic signals and the other conjecturing the sameness that is characteristic of spoofed signals.
Figure 2. Geometry of two-antenna spoofing detection system and GNSS satellites for non-spoofed case.Figure 3. Spoofed-case geometry of two-antenna spoofing detection system and GNSS spoofer.
Hypothesis Test
The PDF paper on which this article is based presents the non-spoofed and spoofed signal models that form the basis of a hypothesis test, develops optimal estimation algorithms that fit the observed differential beat carrier phases to the two models, and shows how these estimates and their associated fit error costs can be used to develop a sensible spoofing detection hypothesis test. Download the PDF here.
Offline and Live-Signal Testing
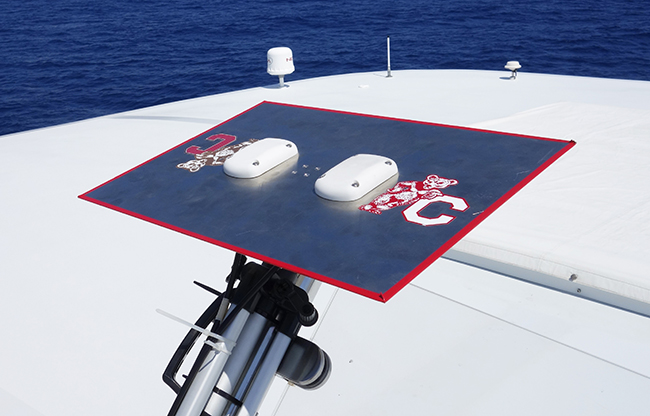
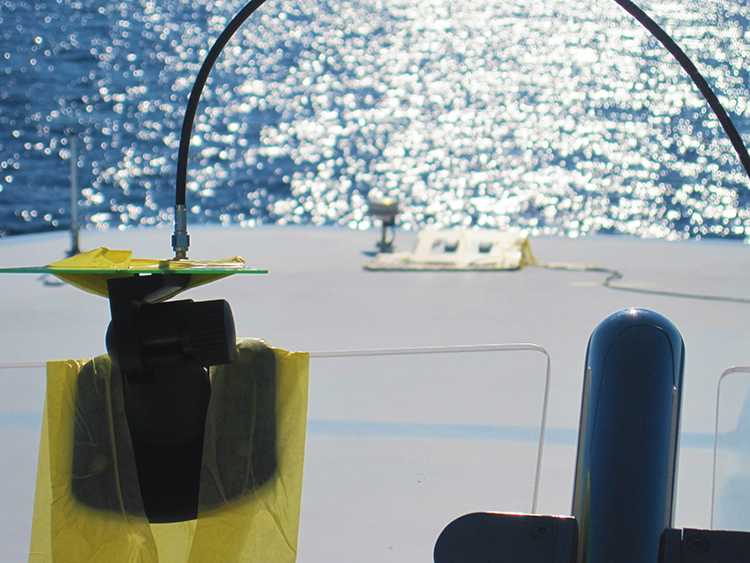
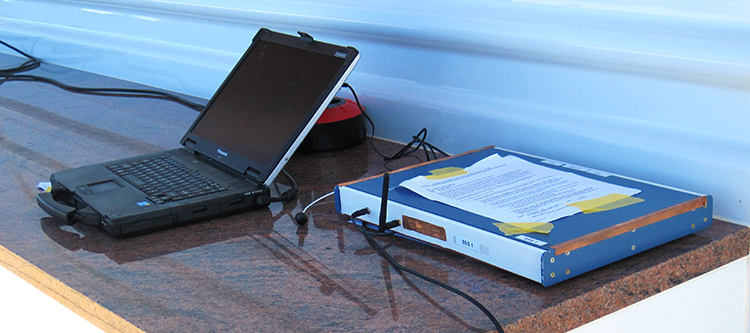
We tested a prototype version of the two-antenna system as depicted on the righthand side of Figure 1. The antennas connect to two independent RF front-ends that run off of the same reference oscillator. These RF front-ends provide input to two independent receivers that track each signal using a delay-lock loop (DLL) and a PLL. Figures 4 and 5 show system elements: two GPS patch antennas mounted on a single ground plane with a spacing of 0.14 meters, two RF front-ends — universal software radio peripherals (USRPs) — with a common ovenized crystal oscillator. Digital signal-processing functions are implemented in real-time software radio receivers (SWRX) running in parallel on a Linux laptop, written in C++. Spoofing detection calculations are performed on the same laptop using algorithms encoded in Matlab.
Figure 4. The two antennas of the prototype spoofing detection system mounted on a common ground plane.Figure 5. Signal processing hardware of the prototype spoofing detection system.
A key feature of this architecture is the ability of its real-time software radios’ C++ code to call the spoofing detector’s Matlab tic function and to pass carrier-phase and other relevant data to the tic function. This feature served to shorten the implementation and test cycle for the prototype system by eliminating the need to translate the original Matlab versions of the spoofing detection algorithms into C++. This enabled rapid re-tuning and redesign of the spoofing detection calculations, exploited during the course of live-signal testing.
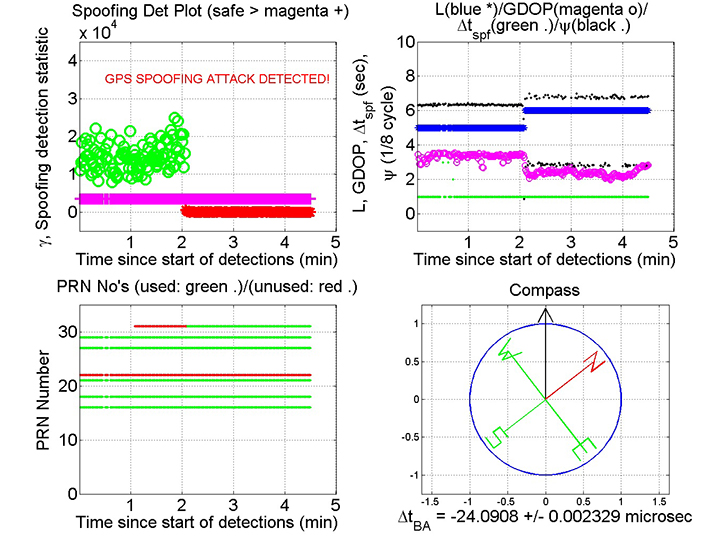
The Matlab package displays real-time signal authentication information. Figure 6 shows the version of the display used for this study’s culminating live-signal tests. All displays are updated in real time. The upper left, upper right, and lower left plots scroll along their horizontal time axes to keep the most recent 4.5 minutes of data available. The lower right compass updates each time a new spoofing detection calculation is performed. The green dots in the upper left plot indicate that the time between spoofing detections, Δtspf , is nominally 1 second, though sometimes the gap is longer due to lack of a sufficient number of validated single-differenced carrier phases to carry out the calculation. Thus, the nominal update time for all of the plots in this display is 1 second. Faster updates are possible with the Matlab software, but Δtspf was deemed sufficiently fast for this study’s experiments.
The most important panel in Figure 6 is the upper left spoofing detection statistic time history. The magenta plus signs on the plot show the spoofing detection threshold chosen for this case, γth. The computed γ values are plotted as green o’s if they lie above γth and as red asterisks if they lie below. If γ is above γth, the message “GPS Signals Authenticated” is displayed on the plot; if below, the message switches to the spoofing alert: “GPS SPOOFING ATTACK DETECTED!”
Figure 6. Spoofing detector real-time display. Clockwise from top left: the spoofing detection statistic time history γ(t); four diagnostic time histories that include time histories of the number of satellites used for spoofing detection L(t) (blue asterisks), their corresponding GDOP(t) values (magenta o’s), the time increment between spoofing detection tests Δtspf(t) (green dots), and the compass heading ψ(t) as determined from the two-antenna non-spoofed-case solution (black dots); Compass display; and time history of GPS PRN number availability.
The other three panels proved helpful in diagnosing system performance. A low L value (near 4) or a high GDOP value in the upper right panel indicated poorer reliability of the spoofing detection calculations. A correct compass heading in the absence of spoofing provided a check on the system. During spoofing attacks, the compass heading became jumpy, thereby providing another possible indicator of inauthentic signals.
The vertical scale of the lower left panel lists the possible GPS PRN numbers. The presence of a green or red dot at the level corresponding to a given PRN number indicates that one or both receivers is seeing something from that satellite at the corresponding time. If the dot is red, then the returned data are incomplete or are deemed to be insufficiently validated for use in the spoofing detection calculation. If the dot is green, then the data from that PRN have been used in the detection that has been carried out at that time.
Another feature of the prototype spoofing detection system is its ability to record the wide-band RF data from its two antennas. For each spoofing scenario, the raw samples from both USRPs were recorded while the real-time software receiver was performing its signal-processing operations and while the real-time spoofing detector was doing its calculations. These recorded data streams will allow off-line analysis and testing of a re-tuned or completely redesigned spoofing detection system.
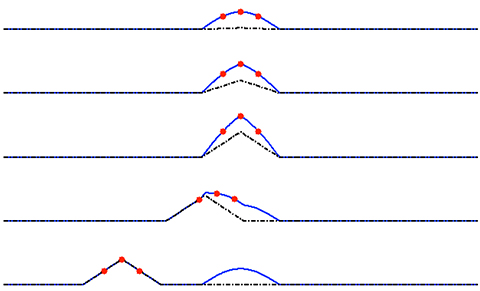
Red Team Receiver/Spoofer. The UT Austin spoofer’s attack strategy overlays the spoofed signal on top of the true signals, ramps up the power to capture the receiver tracking loops, and finally drags the pseudorange, beat carrier phase, and carrier Doppler shift off from their true values to spoofed values. Figure 7 shows the pseudorange part of a spoofing attack: cross-correlation of the receiver’s PRN code replica with the total received signal (blue solid curve); the receiver’s early, prompt, and late correlations (red dots); and the spoofer signal (black dash-dotted curve). In the top plot, the spoofer has zero power, and the receiver sees only the true signal. The second and third plots show the spoofer ramping up its power while maintaining its false signal in alignment with the true signal. The spoofer power in the middle/third plot is sufficient to capture control of the three red dots of the receiver’s DLL. In the fourth and fifth plots, the spoofer initiates and continues a pseudorange drag-off, an intentional falsification of the pseudorange as measured by the victim receiver’s DLL.
Figure 7. Receiver/spoofer attack sequence as viewed from a channel’s code offset cross-correlation function. Spoofer signal: black dash-dotted curve; sum of spoofer and true signals: blue solid curve; receiver early, prompt, and late correlation points: red dots.
The spoofer performs drag-off simultaneously on all spoofed channels in a vector spoofing attack that maintains consistency of all spoofed pseudoranges. After the initiation of drag-off, the victim receiver computes a wrong position, a wrong true time, or both, but the residual pseudorange errors in its navigation solution remain small. Therefore, this type of attack is not detectable by traditional pseudorange-based RAIM calculations.
The receiver spoofer hardware consists of a GNSS reception antenna, the receiver spoofer signal-processing unit, and the spoofer transmission antenna (Figure 8).
Figure 8a. Receiver/spoofer hardware: GPS reception antenna on ship’s rear upper deck.Figure 8b. Receiver/spoofer hardware: directional transmission antenna pointed at the ship’s GPS antenna and the detector antenna pair near the defended ship’s antenna. The orientation of the spoofing transmission antenna, combined with its remote location from the receiver/spoofer’s reception antenna, ensured that the spoofer did not self-spoof.Figure 8c. Receiver/spoofer hardware: spoofer electronics, located amidships.
The receiver/spoofer requires tuning of its transmission power levels. If the power is too high, its spoofing attacks will be too obvious. A very high transmitted power could also saturate the front-end electronics of the intended victim, causing it to jam the system rather than spoof it. If transmitted power is too low, it will not capture the victim’s tracking loops, and its spoofing attack will fail. The proper power level depends on the gain patterns of the spoofer transmission antenna and the victim receiver antenna and on their relative geometry.
Attack Test Scenarios. Three sets of tests were conducted to develop and evaluate the spoofing detection system. The first tests started by recording wideband RF GPS L1 data using USRPs. These data were post-processed in two software receivers that recorded the outputs of their signal tracking loops. Afterwards, the Matlab spoofing detection calculations were run using the recorded tracking loop data as inputs. These preliminary tests at Cornell and Austin proved the efficacy of the spoofing detection algorithms. They did not, however, test system performance during the transition from non-spoofed to spoofed signals that takes place at the initiation of a spoofing attack.
The second set of tests was carried out using the first real-time version of the system, after the Matlab spoofing detection calculations were repackaged into a tic function and linked to the C++ real-time software receivers. This set of tests also was unable to probe the system’s performance at the onset of a spoofing attack, before the signal drag-off.
The final set of tests was conducted aboard the White Rose of Drachs in the Mediterranean’s international waters.
The power adjustment tests on June 27 needed a means to decide whether a given attack had captured the tracking loops of the ship’s GPS receiver. The strategy for confirming capture was to perform a noticeable drag-off after the initial attack. We settled on a vertical drag-off as providing the most obvious indication of a successful capture. Successful attacks dragged the receiver’s reported altitude as high as 5,000 meters.
The tests that evaluated spoofer and spoofing detector antenna placements relative to the ship’s GPS antenna were also important to achieving sensible results. Various placements were tried. The most successful relative geometry is depicted in Figure 8.
The placement of the detector antennas relative to the defended antenna is atypical of likely real-world detection scenarios. It is expected that a real-world spoofing detector will be integral with the defended GNSS receiver.
The culminating live-signal attack involved a 50-minute spoofing scenario in which the attacker took the ship — apparently — from the Adriatic to the coast off of Libya. The scenario’s long distance and short duration required a mid-course speed in excess of 900 knots. This spoofing scenario was designed in the simplest possible way, by taking a straight-line course in WGS-84 Cartesian coordinates from the true location to the spoofed location off of Libya. This course took the spoofed yacht position across the Italian and Sicilian land masses and below the Earth’s surface to a maximum depth of more than 23 kilometers.
Obviously, the White Rose was physically unable to execute this maneuver. Its crew would not have needed spoofing detection to realize that its GPS receiver was returning false readings. The main points of this last test were to dramatize the potential errors that can be caused by a spoofer and to check whether the spoofing detector could continue to function under these drastic conditions.
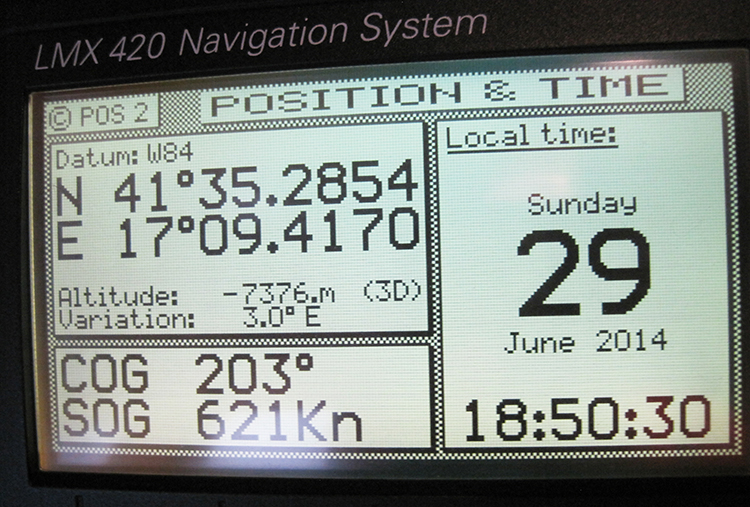
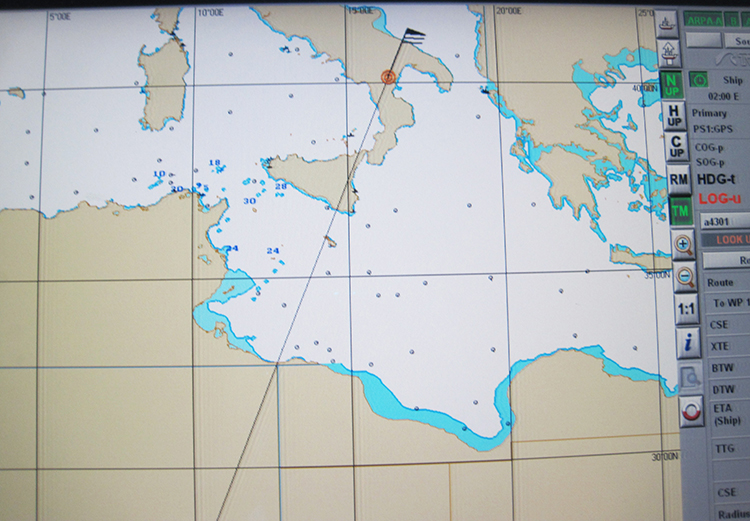
Figure 9 highlights this unusual scenario with two displays from the ship’s bridge, photographed during the attack. The GPS display shows the speed, 621 kn (knots), and the altitude, 7376 m. The chart display shows the yacht on (or rather, below) dry land and halfway across the “insole” of Italy’s boot. It also shows a tremendously long velocity vector, extending beyond the chart.
Figure 9a. The ship’s bridge GPS receiver display during the Libya spoofing scenario.Figure 9b. The GPS-driven chart during the Libya spoofing scenario.
Spoofing Detection Test Results
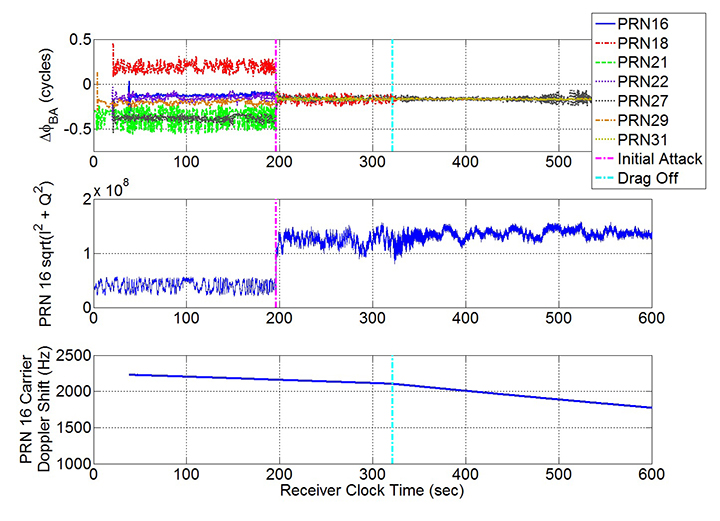
Various signal output time histories (Figure 10) illustrate the attack sequence and suggest means to evaluate the spoofing detection system. The upper panel plots the fractional portions of the two-antenna spoofing detector’s single-differenced beat carrier-phase time histories, Δϕ1BA, …, ΔϕLBA for the L = 7 tracked PRN numbers 16, 18, 21, 22, 27, 29, and 31. The middle panel plots the amplitude time history of the 100 Hz prompt [I;Q] accumulation vector for PRN 16, as received at Antenna A of the detection system. The bottom panel plots the PRN 16 carrier Doppler shift time history.
Figure 10. Indicators of initial capture and drag-off during Libya spoofing attack, as measured by the spoofing detection receiver.
This was a strong attack in which the spoofer power was 10.7 dB higher than the power of the real signal for PRN 16. The other spoofed signals had power advantages over their corresponding true signals that ranged from 3.3 dB to 13.6 dB, and the spoofer’s mean power advantage was 10.4 dB. Therefore, the onset of the spoofing attack at 196.1 sec is clearly indicated by the sudden jump in (I2+Q2)0.5 on the middle panel. The upper panel shows a corresponding sudden coalescing of the single-differenced beat carrier phases, which implies that the spoofing detection algorithm should have been able to detect this attack.
The spoofer drag-off started at 321.5 sec, as evidenced by the sudden change in the slope of the carrier Doppler shift time history on the lower panel. The period after the initial attack and before the drag-off is delimited by the vertical magenta and cyan dash-dotted lines. During this interval the spoofer waited to capture the receiver’s tracking loops.
The single-differenced phase time histories in the upper plot appear somewhat noisier during the interim pre-drag-off period of the attack than after the start of the drag-off at 321.5 sec. The grey dotted curve for PRN 27 is an exception because it becomes noisy again starting at about 450 sec due to decreased signal power. The increased noisiness of the differential phase time histories during the interim period is probably the result of interference between the true and spoofed signals, which are likely beating slowly against each other. The response of the spoofing detection algorithm during this phase is uncertain because this multipath-like beating between the two signals is not modeled.
Figure 11 demonstrates performance of the spoofing detection algorithm for the Libya attack scenario. The upper panel of the figures is a repeat of the upper panel of the single-differenced beat carrier-phase time histories from Figure 10, except that they are plotted for a longer duration. The lower panel shows the γ(t) spoofing detection statistic time history. It plots the same information that appeared in the upper left panel of Figure 6 during the corresponding real-time detection tests. At 196 sec γ(t) is clearly above the blue dash-dotted spoofing detection threshold γth. At 196.4 sec it is clearly below γth , which indicates a spoofing detection. It remains below γth for the duration of the attack. In this reprocessed version of the detection calculations, γ(t) has been updated at 5 Hz. Therefore, the earliest possible detection point would have been 196.2 sec, which is 0.1 sec after the onset of the attack. This point corresponds to the green dot in the lower panel of Figure 11 that lies slightly above the blue dash-dotted γth line. Theoretically, the system might have detected the attack at this time, but the finite bandwidth of the two receivers’ PLLs caused lags in the transitions of the single-differenced phases in the top plot, which led to the 0.3 sec lag in the detection of the attack. It is encouraging, however, that the spoofing detector worked well during the initial pre-drag-off phase of the attack, from 196.1 to 321.5 sec, despite the added noisiness of the single-differenced carrier phases in the top plot, likely caused by beating between the true and spoofed signals.
Figure 11. Single-differenced carrier-phase time histories (top plot) and corresponding spoofing detection statistic time history (bottom plot) for Libya spoofing attack scenario.
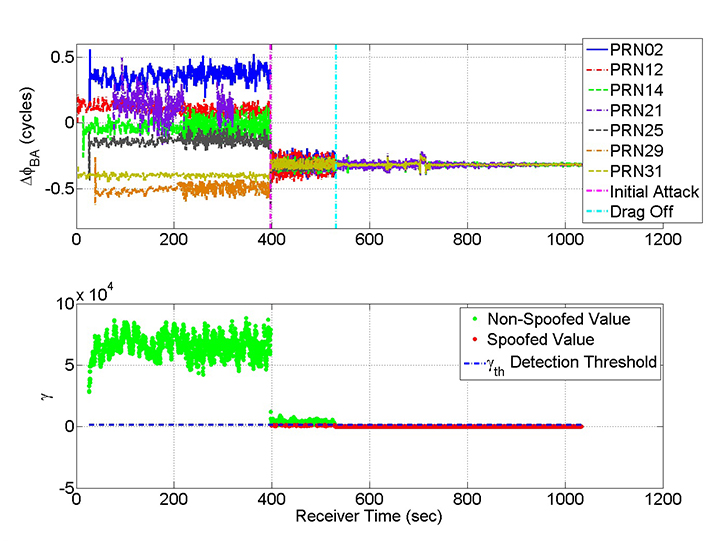
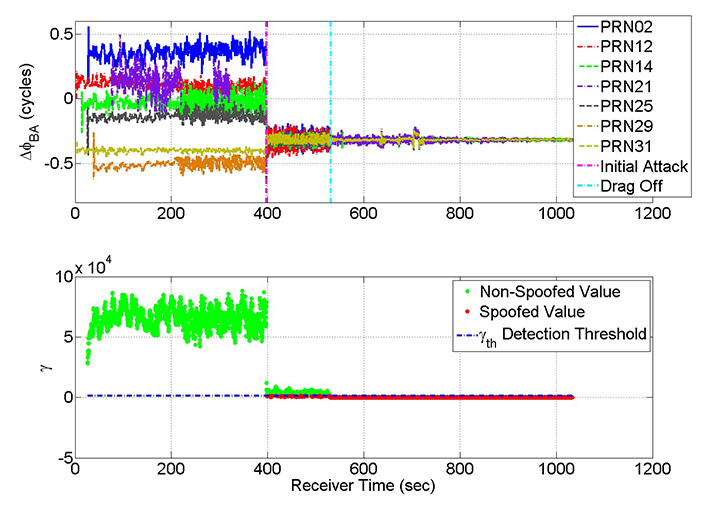
Figure 12 plots the same quantities as in Figure 11, but for a different spoofing attack, a little less overt than the Libya attack. The power advantage of the spoofer ranged from 3.0 to 14.0 dB for the different channels with a mean power advantage = 9.2 dB. It was detected by the system, as evidenced by the convergence of the single-differenced carrier phases at the onset of the attack at 397.5 sec. The spoofing detection statistic in the bottom panel dives near to the γth detection threshold at the onset of the attack and sometimes passes below it, but it does not stay permanently below the threshold until after the time of drag-off, after 531 sec.
Figure 12. Single-differenced carrier phase time histories (top plot) and spoofing detection statistic time history (bottom plot) for a spoofing attack with a slightly lower power advantage than the Libya attack.
The large oscillations of the single-differenced carrier phases during the pre-drag-off initial capture interval from 397.5 to 531 seconds is likely due to beating between the true and spoofed signals. The largest variations occur for PRNs 12 and 31, which are the ones with the lowest spoofer power advantages, 3.2 and 3.0 dB, respectively. Apparently these oscillations cause γ(t) sometimes to take on values slightly above γth during the interval 397.5 sec < t < 531 sec. Thus, the spoofing detector can experience problems in the initial phases of an attack.
Note that the spoofer failed to capture the tracking loops of the ship’s GPS receiver. This is surprising, given the average spoofer power advantage of 9.2 dB above the true signals. We conjecture that the ship’s GPS antenna had lower gain in the low-elevation direction toward the spoofer transmission antenna than did the detector’s antennas. A lower gain would reduce the spoofer power advantage in the ship’s receiver and could explain why the spoofer failed to deceive it.
Many additional spoofing attacks were carried out aboard the ship. The spoofing detector proved finicky. It took quite some time to get the spoofing detection two-antenna system positioned in a sensible place relative to the ship’s GPS antenna so as to be sensitive to nearly the same spoofing signals. In addition, the spoofing detector’s GPS receiver tended to lose lock at the initiation of an attack, prior to signal drag-off. This was likely caused by the large power swings of the received signals due to beating of the true signals against the spoofed signals. This problem went away at higher spoofer power levels. When lock was lost, the software receiver would attempt to re-acquire the signal. Often a reacquisition would succeed only after signal drag-off by the spoofer. Typically, the spoofing detector immediately detected the attack once it had reacquired the spoofed signals that were no longer beating against the true signals due to having been dragged sufficiently far away from them, as in Figure 7. Re-analysis of the recorded data indicated that poor PLL tuning may have caused the losses of lock during the initial attacks. Spoofing detection calculations carried out on the reprocessed data have proved more reliable when implemented with a better PLL tuning.
Two attacks were carried out with only a subset of the visible GPS satellites being spoofed. The first involved spoofing 7 of 9 visible satellites, and the second test spoofed only 4 of 9. The spoofing detection system had trouble maintaining signal lock during the initial part of the first attack. It subsequently reacquired signals and was able to detect the attack successfully after reacquisition. The first attack also succeeded in capturing the ship receiver’s tracking loops as evidenced by spoofing of the yacht to climb off the sea surface. The second attack, with only four spoofed satellites, was not detected by the prototype system, but it succeeded in deceiving the ship’s GPS receiver about its altitude. This latter result indicates a need to modify the detection calculations to allow for the possibility of partial spoofing. In their current form, they assume that all signals are either spoofed or authentic. Of course, in the partial spoofing case it may also be possible to use traditional pseudorange-based RAIM techniques to detect an attack.
Improved detection during pre-drag-off initial phase of attack;
Detection when only a subset of signals are spoofed;
Advanced RAIM techniques;
A real-time prototype of the switched-antenna version;
Detection of a spoofer that uses multiple transmission antennas;
Reacquisition of true signals to recover from a spoofing attack.
Conclusions
A new prototype GNSS spoofing detection system has been developed and tested using live-signal spoofing attacks. The system detects spoofing by using differences in signal direction-of-arrival characteristics between the spoofed and non-spoofed cases as sensed by a pair of GNSS antennas. A spoofing detection statistic has been developed that equals the difference between the optimized values of the negative-log-likelihood cost functions for two data-fitting problems. One problem fits the single-differenced beat carrier phases of multiple received signals to a spoofed model in which the fractional parts of these differences are identical -— in the absence of receiver noise — because the spoofed signals all arrive from the same direction. The other problem fits the single-differenced carrier phases to a non-spoofed model. This second optimal data-fitting problem is closely related to CDGPS attitude determination. The simple difference of the two optimized cost functions equals a large positive number if there is no spoofing, but it equals a negative number if the signals are being spoofed. Monte Carlo analysis of the probability distributions of this difference under the spoofed and non-spoofed assumptions indicates that it provides a powerful spoofing detection test with a low probability of false alarm.
A real-time version of this system has been implemented using USRPs and real-time software radio receivers, and it has been tested against live-signal spoofing attacks aboard a yacht that was cruising around Italy. Successful detections have been achieved in many spoofing attack scenarios, and detections can occur in as little as 0.4 seconds or less. One scenario spoofed the yacht’s GPS receiver into believing that it had veered off of a northwesterly course towards Venice in the Adriatic to a southwesterly course towards the coast of Libya, and at the incredible speed of 900 knots. The spoofing detector, however, warned the crew on the bridge about the attack before the yacht’s spoofed position was 50 meters away from its true position.
The live-signal tests revealed some challenges for this spoofing detection strategy. They occur primarily during the initial attack phase, before the spoofer has dragged the victim receiver to a wrong position or timing fix. If the spoofer power is not much larger than that of the true signals, then beating occurs between the spoofed and true signals during this initial period. This beating can cause difficulties for the receiver tracking loops, making single-differenced carrier phase unavailable. Even when single-differenced phase is available, both the spoofed and non-spoofed models of this quantity can be inadequate for purposes of designing a reliable spoofing detection test.
This article’s new two-antenna spoofing detection system has generated promising real-time results against live-signal spoofing attacks, but further developments are needed to produce a sufficiently reliable detection system for all anticipated attack scenarios. The best defense will likely employ a multi-layered approach that uses the techniques described in this paper along with advanced RAIM techniques that detect additional signal anomalies that are characteristic of spoofing.
Acknowledgments
The authors (brief bios given in online version) thank the owner of the White Rose of Drachs for the loan of his vessel to conduct the live-signal GNSS spoofing detection tests reported here. The crew of the White Rose aided and supported this project in many ways.
Red Team, White Team, Blue Team
Background
Before March 2013, members of the UT Radionavigation Lab and the Cornell GPS Lab didn’t know about gold-plated sinks and spiral staircases at sea. They did know something about spoofing navigation systems and detecting spoofer attacks. The UT group had hacked a helicopter drone at White Sands Missile Range in June 2012, coaxing it to dive towards the ground. The Cornell group had developed a prototype system that could reliably detect all UT Austin attacks, but it was clumsy, having an oscillating antenna and requiring hours of post-processing.
Andrew Schofield, master of the White Rose of Drachs, attended Todd Humphreys’ 2013 South-by-Southwest conference talk on the drone hack and challenged him to go big — bigger than a 1.3-meter drone helicopter. How about a 65-meter superyacht? The result: a summer 2013 Mediterranean cruise that produced intriguing, provocative results.
The UT team had implemented a feedback controller for their spoofer, but they were unable to control the spoofed drone in a smooth, reliable manner. The White Rose cruise offered a chance to test a next level of sophistication: a controlled sequence of lies leading the victim on a precise course selected by the spoofer, different from the one intended by the captain.
The UT team was able to induce inadvertent turns while the ship’s bridge thought it was steering a straight course. They could nudge the yacht onto a wrong course paralleling the desired course. The crew remained unaware of the yacht’s true course because its GPS receiver and GPS-driven charts indicated that she was on her intended route.
The Push for Protection
Andrew Schofield quickly began advocating for a follow-up experiment: a UT Red Team attack against the White Rose GPS and a simultaneous Cornell Blue Team demonstration of real-time spoofing detection.
The Cornell Team, however, faced challenges in transitioning from its initial prototype to a more sophisticated system, one that eliminated the moving parts and that operated in real time. Team members thought they could produce the next system, but had never been quite sure they could make good on their boast.
Development of a second prototype system began with implementation of a new Cornell detection algorithm in Matlab. The first tests of this algorithm involved UT recording and pre-processing of transmissions in an RF chamber that housed the two antennas of Cornell’s second prototype. Cornell applied its new Matlab algorithm to these data and demonstrated off-line spoofing detection.
The remaining hurdle was real-time operation. The original development plan called for translation of the Matlab algorithm to C++ followed by integration with a UT Austin/Cornell real-time software radio. It would be understatement to say that this was an ambitious task for the two-month window that remained until the White Rose cruise.
UT Ph.D. student Jahshan Bhatti steered the team around this hurdle by proposing the direct use of Cornell’s Matlab code in the real-time system. Prior to this, no one had realized that it could be practical to call Matlab from C++ in real time. Mark Psiaki packaged the Matlab spoofing detection software into a single tic function, Jahshan coded the calling C++/Matlab interface, and the team was on track to test spoofing detection in late June 2014.
Spoofer, Detector Clash at Sea
The White Rose would sail from southern France on June 26, setting a course around Italy to Venice. The Cornell Blue Team would have three full days in international waters to demonstrate and evaluate their real-time spoofng detection system. A Ph.D. graduate from UT’s Radionavigation Laboratory would operate the Red Team spoofer, aka the Texas Lying Machine.
In preparation for the voyage, the two teams converged in the White Roses’s home port of Cap-d’Ail. They performed initial shake-down tests of their systems in port. They could not do full live-signal tests in Cap d’Ail because they were still in French territorial waters. Transmission of live spoofing signals in the GPS L1 band is permitted only in international waters, and only if conducted for scientific purposes.
The spoofing and detection tests started in earnest on the morning of June 27 off the southern coast of Italy. The White Rose had passed through the Strait of Messina between Italy and Sicily earlier that day. The initial tests were concerned with antenna geometries and spoofer power levels. Later tests concentrated on serious deception of the White Rose regarding its true course and location.
During the tests, the UT Red team and its spoofer were situated on the White Rose Sun Deck, above and behind the bridge. The Cornell Blue team and its electronics were on the bridge with its two antennas on the roof. A walkie-talkie link between the teams provided coordination of detector operation with spoofing attacks along with feedback about spoofer and detector performance.
Hijacked to Libya!
For the final day of tests, Andrew Schofield suggested sending the spoofed White Rose to Libya as she cruised the Adriatic from Montenegro to Venice — a difference of 600 nautical miles. The target trip time of 50 minutes necessitated a peak speed over 900 knots (1,667 kilometers/hour) after factoring the need to limit initial acceleration and final deceleration; if too large, they might cause the victim receiver’s tracking loops to lose lock and, therefore, the spoofed signals.
The Cornell and UT Austin teams programmed the spoofer for a trip to Libya, and they initiated the attack. The White Rose bridge soon became a scene of excitement. The ship started veering sharply to port, and its velocity vector lengthened until it literally went off the charts. The GPS receiver showed the ship hurrying towards Libya on a collision course with the back of Italy’s boot. The bridge’s GPS receiver displayed speeds that increased through 100 knots, 200 knots, 300 knots — for a yacht with a speed capability of about 15 knots.
The Cornell detector issued a spoofing alert at the onset of the attack, long before the White Rose veered off course. After a few minutes, the detector’s continued successful operation became boring. Of course, boring success is better than exciting failure.
The Cornell system had not been as successful during some of the preceding attacks, and the results from the June voyage suggested avenues for improvement. If new live-signal tests become necessary to evaluate planned improvements, the Red and Blue teams stand ready for a future superyacht cruise.
Mark L. Psiaki is a Professor of Mechanical and Aerospace Engineering. He received a B.A. in Physics and M.A. and Ph.D. degrees in Mechanical and Aerospace Engineering from Princeton University. His research interests are in the areas of GNSS technology and applications, spacecraft attitude and orbit determination, and general estimation, filtering, and detection.
Brady W. O’Hanlon is a graduate student in the School of Electrical and Computer Engineering. He received a B.S. in Electrical and Computer Engineering from Cornell University. His interests are in the areas of GNSS technology and applications, GNSS security, and space weather.
Steven P. Powell is a Senior Engineer with the GPS and Ionospheric Studies Research Group in the Department of Electrical and Computer Engineering at Cornell University. He has M.S. and B.S. degrees in Electrical Engineering from Cornell University. He has been involved with the design, fabrication, testing, and launch activities of many scientific experiments that have flown on high altitude balloons, sounding rockets, and small satellites. He has designed ground-based and space-based custom GPS receiving systems primarily for scientific applications.
Jahshan A. Bhatti is pursuing a Ph.D. in the Department of Aerospace Engineering and Engineering Mechanics at the University of Texas at Austin, where he also received his M.S. and B.S. He is a member of the UT Radionavigation Laboratory. His research interests are in the development of small satellites, software-defined radio applications, space weather, and GNSS security and integrity.
Todd E. Humphreys is an assistant professor in the department of Aerospace Engineering and Engineering Mechanics at the University of Texas at Austin, and Director of the UT Radionavigation Laboratory. He received a B.S. and M.S. in Electrical and Computer Engineering from Utah State University and a Ph.D. in Aerospace Engineering from Cornell University. He specializes in applying optimal estimation and signal processing techniques to problems in radionavigation. His recent focus is on radionavigation robustness and security.
Andrew Schofield is a career Yacht Captain. After completing his degree in Applied Biology and working in the bio-science industry for a year, he left all that behind in 1991 and found a deck hand’s job on a sailing yacht in the Caribbean. Since then he has worked on various yachts in various locations. He has been Captain of the White Rose of Drachs since launch in June 2004. He is President of the Professional Yachting Association, the large yacht professional body, and focuses on the training and certification of crew. In his time at sea GPS has transformed navigation. He feels that the relevance of the work done to detect GPS spoofing cannot be overstated with regard to the safety of life at sea, and he is delighted to have facilitated the voyage during which spoofing detection was proven.
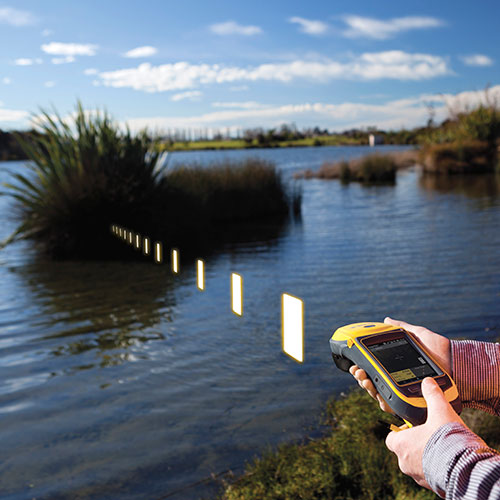
Trimble has introduced the latest version of its smart water infrastructure mapping and work management cloud software — Trimble Connect for Water version 1.9.
The latest release of the geographic information system (GIS) centric software-as-a-service (SaaS) adds real-time, high-accuracy centimeter-level horizontal and vertical GNSS accuracy for capturing 3D asset positions. The new release includes a suite of applications that allow water, wastewater and stormwater utilities to accurately locate, inventory and visualize their infrastructure assets and increase operations and maintenance efficiency.
Trimble Connect for Water cloud software leverages Trimble’s GNSS rugged mobile devices and Esri’s GIS technologies to accurately map, locate and assess the condition of critical infrastructure assets, allowing utilities to keep their field infrastructure data up-to-date and accurate.
The new release now supports Trimble’s Geo 7 Centimeter Edition rugged handheld, integrating 3D mapping into utility field workflows and enabling mobile workers to precisely locate and map the horizontal position and elevation of buried infrastructure.
Trimble Connect for Water version 1.9 can be configured and deployed quickly on a variety of Trimble and non-Trimble mobile devices, laptops, tablets and smartphones, including Apple iPads, iPhones, Android, Windows and Windows Mobile devices to automate fieldwork and eliminate paper-based maps.
Trimble Connect uses the latest Esri ArcGIS for Server, Mobile and ArcGIS Online basemap services. The software is designed to automate a variety of specific water, wastewater and stormwater industry workflows through individual pre-configured “apps” offered within the product and as part of a subscription.
The new version provides standard core apps including Map Book, Manhole Inspector, Leak Repair, Hydrant Inspector, Valve Inspector, Meter Changeout, Incident Repair, Water Mapper, Wastewater Mapper and Stormwater Mapper. In addition, an optional partner app developed for American Flow Control (AFC) hydrant and valve data collection, “AFC Mapper,” can be purchased from AFC and their distributors for use with Trimble rugged handhelds.
Trimble Connect for Water version 1.9:
Offers centimeter-level real-time GNSS accuracy to improve the quality and accuracy of the utility’s GIS data to precisely locate hard to find assets.
Allows capturing accurate vertical elevations in real-time. Combined with horizontal precision, the solution provides high-accuracy GIS data that can be used to measure pipeline slopes, perform flow analysis and generate 3D and hydraulic models.
Supports the Trimble Geo 7 Centimeter edition with an integrated laser rangefinder.
Offers pre-configured Water, Wastewater and Stormwater mapping apps, allowing utilities to quickly start mapping network infrastructure and updating their asset data.
Provides the capability to export data in a variety of formats including Esri File Geodatabase, Shapefiles and MS Excel, which allows users to update the utility’s enterprise GIS or visualize and analyze the collected data using third-party systems.
Trimble Connect for Water version 1.9 is expected to be available in December 2014 from Trimble’s Water Division and its authorized distribution partners.
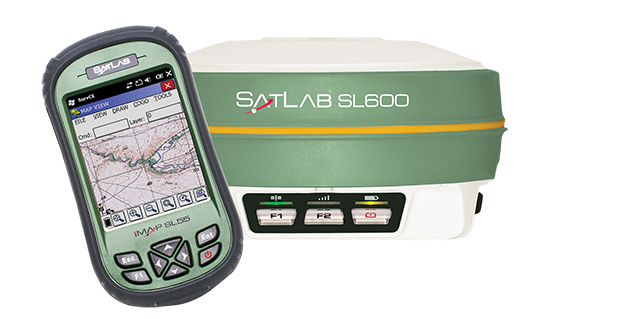
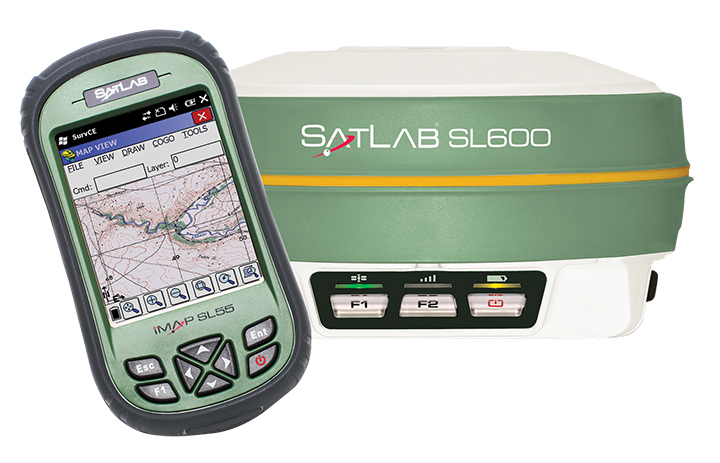
SatLab announced the unit earlier this year as the replacement of its SL500 on-the-pole surveying receiver. After a summer of testing and a premiere showing at InterGeo 2014, held in Berlin in October, SatLab is ready to ship the SL600 to its dealer network and customers.
The new receiver is designed to meet the evolving needs of the surveying market, and is designed for general land, marine and construction applications. At the heart of the rugged unit is a 6G GNSS receiver capable of using all six GNSS satellite networks (GPS, GLONASS, BeiDou, Galileo, QZSS and SBAS), providing reliable operation in demanding conditions, SatLab said.
The SL600 is lightweight at 1.2 kg. Its Xenoy housing holds up well to real-world use, according to test results by SatLab, resistant to 3-meter drops and 2 meters of water submersion. The dual hot swappable batteries provide 18-24 hours of continuous field use, depending on the mode of operation.
The SL600 receiver has a new onboard computer running the LINUX operating system, which ensures easy implementation of new functionalities, often a result of customer-specific requirements. Over time, over-the-air firmware updates will be automatically available, adding new features at no additional charge. Users will be notified by the unit to accept the new firmware updates, or refuse them if they wish to keep their units as is.
The SL600 system is available with various communication capabilities. Cellular 3G and Bluetooth as well USB and RS232 connectivity are standard, and an optional internal 2W Pacific Crest XDL radio is also available. Voice notifications notify the user of issues without the need to watch the status LEDs.
The SL600 system kit includes a compact hard carrying case with the SL55 field controller, which can handle large data files with its high-speed processor and expandable memory. Furthermore, the SL55 has an onboard GPS/GLONASS L1 receiver as well as a GSM modem, which makes the unit a good and rugged companion to use in GIS data collection applications.
As part of the close cooperation between Carlson Software and SatLab Geosolutions AB, the SL600 comes with Carlson SurvCE pre-installed and activated. This ensures an “out of the box” experience for the end customer, SatLab said.
An educational video by the Perimeter Institute of Theoretical Physics shows how GPS, a navigational tool that can pinpoint your location to within a few meters, incorporates a number of effects from Einstein’s theory of relativity.
Thorsten Rudolph, Application Center GmbH Oberpfaffenhofen (left), and Rolf Densing, DLR (right), award the Airbus team of Jan Wendel and Wolfgang Kogler the EUR 20,000 grand prize. Photo: ESNC
The winner of the European Satellite Navigation Competition (ESNC) 2014 is Airbus Defence & Space, which won over the jury of experts from around the world with its ground-breaking and cost-effective receiver for the Galileo Public Regulated Service (PRS).
The award winners were announced October 23 at an awards ceremony held at the Berlin headquarters of Deutsche Telekom. The awards recognize innovations in the commercial use of satellite navigation technology.
“Award winners Wolfgang Kogler and Jan Wendel from Airbus Defence & Space have taken a cutting-edge approach to designing a low-cost receiver that enables police departments, fire brigades, emergency medical services, and other public entities to make use of the Galileo PRS system,” The ESNC said. “Its core innovation involves the development of a special network architecture that combines the receiver with an assistance server. The concept accounts for all the required security aspects and significantly reduces costs and the complexity of user receivers, thus facilitating broader use of PRS in the realm of public security.”
In addition to the EUR 20,000 grand prize, the design took home Bavaria’s regional prize and the ESNC’s special PRS prize, which was awarded by Germany’s Federal Ministry of Transport and Digital Infrastructure (BMVI) and Federal Ministry for Economic Affairs and Energy (BMWi).
“This special prize reflects our effort to further examine possibilities for the use of PRS applications,” said Tobias Miethaner, Head of the BMVI’s Digital Society, in his opening address at the awards ceremony. “I am delighted to see that the ESNC is already providing an important impetus to the promotion and development of innovative applications of the future Galileo PRS in its first year.”
Over the past decade, the ESNC has brought forth numerous new applications in the field of satellite navigation. The 2014 edition was shaped in particular by the imminent launch of the first Galileo services, with more than 40% of the 434 submissions received from more than 40 countries seeking to employ Galileo/EGNOS in their own products and services.
“Thanks to our international network, we’re in an excellent position to take advantage of Galileo’s operational launch,” said Thorsten Rudolph, managing director of Anwendungszentrum GmbH Oberpfaffenhofen, which initiated and continues to organize the ESNC. “We believe that the ESNC’s function as a leading innovation framework in its field will grant it an equally important role in Europe’s new satellite navigation system.”
Along with the overall winner, 240 experts in the ESNC’s renowned network selected more than 30 other winners in the competition’s regional and special-prize challenges. Under the patronage of Germany’s Federal Minister of Transport, prizes worth a total of EUR 1 million were presented at the awards ceremony. The winners illustrated the fundamental importance of robust, reliable, and secure time and positioning signals for Europe’s digital society through innovations in areas such as transport, health, and the environment.
2014 Special Prize Winners
In addition to selecting its overall winner, the 11th European Satellite Navigation Competition (ESNC) has awarded prizes in six different special categories and to 25 regional winners.
GSA: The most promising application idea for European GNSS
The Galileo for ARA module will use a key feature of Galileo – its E5 broadband signal – to create new possibilities in the development of smartphone applications that require high accuracy. The team thus plans to integrate E5 Galileo receiver modules for enhanced accuracy and develop an antenna interface module to provide better performance. This will offer improved positioning precision with centimetre-level accuracy and a multipath-resistant solution designed for pedestrians and urban environments.
ESA Innovation Prize & Flanders/Belgium — Overall Ranking: 3rd Place
stickNtrack is a disruptive innovation that opens up an abundance of new business opportunities in tracking trailers, containers, machinery, tools, bikes, and more. It functions for up to 10 years without the hassle of charging batteries, managing SIM cards, or any intrusive installations while consuming up to 40 times less power. StickNtrack also lowers life-cycle costs by 50% compared to current compact GPRS/GPS products.
This artificial ground-based solution will significantly boost the coverage of satellite-based augmentation systems (SBAS, such as EGNOS) to ensure safe landings on all airport runways. SBAS assistance can be limited due to a lack of signal coverage in the far north, in the mountains, or in highly urbanised areas. By receiving and retransmitting GPS corrections, the proposed system will enable the use of systems like EGNOS in such difficult environments. Thanks to its competitive cost and reliability, this system will be a strong alternative to conventional instrument landing systems (ILS).
Hail Navigator is a novel system designed to reduce damage caused by hail. The formation of hail can be suppressed by injecting silver iodide into clouds. Hail Navigator combines navigation with a precipitation reporting system that can guide pilots to the optimal locations for their hail suppression missions. The system is complemented by weather observations (including precise times and locations) reported by the local population via a smartphone app as a means of validating weather prediction models. These models constitute an important factor in deciding whether a hail suppression flight is necessary.
trakkies has built the world’s first REAL platform for the Internet of Things (IOT). It enables users to keep better track of belongings, events, tasks, appointments, and more. The start-up has developed IOT nodes with ambient intelligence, a smartphone app, and a back-end cloud system for providing helpful, intuitive services and interacting with people, places, and things. Furthermore, trakkies has designed a novel small-data mechanism that identifies individual people, places, and objects and uses EGNOS signals to create smart location references.
Users now have full access to Fleet Director’s management features via mobile device, in addition to desktop functionality. Also, the latest update offers robust fleet management tools, such as the ability to monitor fuel consumption, increase driver safety, and meet compliance mandates.
“In the current climate, businesses have the ability to achieve high levels of profitability and growth with the help of an advanced fleet management platform,” said Tony Eales, president, Teletrac. “The latest version of Fleet Director churns millions of data transactions daily, providing vital information to help meet company goals across multiple industries and workforce sizes. Businesses are equipped with the actionable data necessary to cultivate and develop their company on multiple levels and gain a competitive advantage in their market.”
Teletrac has modernized Fleet Director in four key fleet management areas: anywhere, anytime mobile access; deeper driver and vehicle behavioral data; enhanced mapping functionality; and advanced safety analytics.
“Fleet management has historically been an at-a-desk job, limiting companies in their productivity and communication. The added flexibility of using modern devices — such as smartphones, laptops and tablets — to do business has increased productivity while also adding expectations from customers,” said Sid Nair, director of Product Management, Teletrac. “As the industry has evolved, so have we.”
Enhancements include:
Mobility: Fleet Director allows users to manage their vehicles from any mobile device or browser through new HTML 5 functionality. The software’s clear and user-friendly interface lets users navigate easily to a targeted location regardless of whether the manager is in the office or on a mobile phone in the field.
Actionable Data: The updated software allows managers to move beyond basic track-and-trace functionality, offering an in-depth look at the overall health of a business. The new Fleet Director is built with more robust driver and vehicle behavioral data, providing businesses with insight into performance areas such as fuel management, power take-off time, engine performance and job-site delivery tracking.
Cutting-Edge Mapping Technology: Mapping has moved beyond location tracking with Fleet Director’s enhanced interactive features. Vehicle and asset mapping is now accessible on easy-to-use Google Maps that toggle between single and multiple views. Managers can consult Fleet Director to pinpoint the exact road their drivers are on while using Google Street View to zoom into the terrain and makeup of the road. These added map enhancements provide fleet managers with tools to have better control of their business.
Advanced Safety Behavior Data: Fleet Director Safety Analytics helps managers get closer to their fleet through insight into key driver safety events, such as speeding, harsh braking, accelerating, stop sign violations and fast cornering. New data-rich dashboards display relevant information that shows the time and date of each event and the number of infractions per vehicle and driver, including the best and worst performance rankings. Safety infractions can be replayed on the map interface to show how an unsafe driving incident occurred in real-time, providing useful data that can prevent the risk of a crash.
The Trimble Geo 7 series of rugged, high-accuracy GNSS handhelds will have RTX correction. Photo: Trimble
Trimble’s RTX technology-based correction services — Trimble CenterPoint RTX, Trimble RangePoint RTX, and the new Trimble ViewPoint RTX — will be available for Trimble Geo 7X handhelds. Trimble made the announcement at Trimble Dimensions.
Trimble RTX technology provides compatible GNSS receivers with correction services that significantly improve accuracy and reliability in obtaining positions worldwide. Geospatial professionals now have more flexibility to achieve the accuracy required by their highly mobile workflows in real-time, without being tied to a base station or local VRS network, Trimble said.
Available worldwide through an IP connection where cellular communication is available, Trimble RTX offers geospatial professionals flexibility in where and when they are able to work. Operational efficiency and productivity in the field is improved by delivering real-time DGNSS corrections directly to the Trimble Geo 7X handheld. Field challenges, such as obstructed satellites and inaccessible locations, are also minimized with Trimble Floodlight and Trimble Flightwave technology options for the Trimble Geo 7X.
The handheld solution is designed for a variety of industries — such as utility companies, municipalities, and environmental management agencies — in which workers are highly mobile and require a reliable, flexible data-collection and asset management solution.
“We have eliminated the complexities of managing multiple correction sources across a large geographically dispersed project or organization,” said Alain Samaha, business area director of GIS and Software for Trimble’s Geospatial Division. “By offering RTX-based correction services, we simplify their work and deliver the accuracy that our customers require.”
A choice of RTX correction services ranging from 4 centimeters to submeter-level horizontal accuracies is available. Customers can choose the appropriate Geo 7X handheld configuration with the RTX-based correction service that meets the accuracy level and capability required for their job.
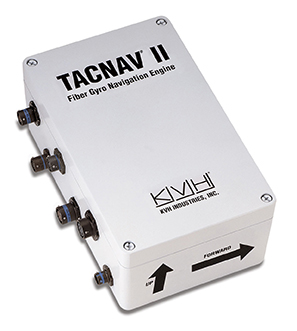
KVH Industries, Inc., has received a $4.3 million order for its TACNAV tactical navigation systems from a new customer who is a major defense contractor providing armored vehicles for an international military client. With a short delivery requirement, shipments for this order are expected to be substantially completed in the fourth quarter of 2014.
“KVH is extremely pleased to be selected by another major defense contractor to provide the tactical navigation solution for their new armored vehicles. Providing precise navigation as well as coordination of vehicles in critical situations is an important tool that helps keep soldiers oriented wherever they operate,” said Dan Conway, executive vice president of KVH’s Guidance and Stabilization group.
KVH’s TACNAV military vehicle navigation systems provide unjammable precision navigation, heading, and pointing data for vehicle drivers, crews, and commanders. TACNAV can also serve as a heading and position source for situational awareness.
In October, KVH received a $19 million contract for the delivery of a new fiber optic gyro-based tactical navigation system for use by an international military customer in an armored vehicle application.
TACNAV systems are in use by the U.S. Army and Marine Corps, as well as many allied customers including Canada, Sweden, Great Britain, France, Germany, Spain, Egypt, Botswana, Australia, New Zealand, Saudi Arabia, Taiwan, Romania, Poland, Turkey, Malaysia, Switzerland, South Korea, Singapore, Brazil, and Italy.