Phase One Industrial, a manufacturer and provider of medium-format aerial digital photography equipment and software solutions, is offering the iXU-R camera series. Available in 80 MP, 60 MP and 60 MP achromatic versions, the cameras feature dedicated interchangeable 40 mm, 50 mm and 70 mm Phase One Rodenstock lenses equipped with central leaf shutters that can be quickly changed in the field, offering flexibility in aerial applications.
The Phase One iXU-R systems have been designed to address the aerial data acquisition market’s needs for a small, lightweight camera with the high resolution of a medium format system, plus high-performance optics, flexibility to fit into small places and Phase One’s fastest 80 MP platform. For example, the iXU-R 180 is built around a large 80-megapixel sensor, with 10,328 pixels cross-track coverage yet it is compact enough to be easily integrated into a small gimbal or pod space or an oblique/nadir array. Or it can be used as a standalone photogrammetric camera with optional Forward Motion Compensation.
Cameras are easily integrated into new or existing setups with USB 3.0 connectivity for control and storage via the Phase One iX Capture application. All Phase One aerial cameras offer direct communication with GPS/IMU systems and the ability to directly write data to the image files.
“As the use of UAVs and small aircraft increases dramatically around the world, and every gram in a payload counts, Phase One Industrial is committed to offering small and lightweight cameras without sacrificing data accuracy, image quality and resolution,” said Dov Kalinski, general manager of Phase One Industrial.
Emirates Palace, courtesy of DigitalGlobe, taken on November 14, 2014, by WorldView-3 satellite at a resolution of 30 cm.
Proteus, a provider of satellite derived mapping and geospatial services, announces the official launch of its new professional satellite image procurement service. The service provides an approach to satellite imagery sales that is sensor agnostic, calling upon partnerships and agreements with the majority of satellite operators. Because of this, Proteus has the capability to support all imagery purchasing requirements.
The service was developed from customer feedback when conducting imagery purchases, which indicated that the experience and knowledgeable advice provided by Proteus removed the stress and complexity they had previously experienced when attempting to complete a purchase and navigate the end-user licenses themselves.
“These days there are many satellite imagery providers, all with a range of products, resolutions, licensing conditions and costings,” David Critchley, CEO of Proteus explained. “This can be overwhelming and time consuming for the end users. Our aim is to break down all the technical barriers and find the best coverage for your area of interest. We strive to determine the most suitable imagery at the most competitive pricing.”
Proteus has now developed relationships with all the main satellite imagery suppliers and provide their customers with a comprehensive, sensor agnostic and personable service.
CoreLogic reports that the national foreclosure inventory fell 28.9 percent year over year in June 2015 to approximately 472,000 homes, or 1.2 percent of all homes with a mortgage. This marks 44 consecutive months of year-over-year declines (see Figure 1).
Also in June 2015, the 12-month sum of completed foreclosures decreased 17.9 percent, to 526,000, since June 2014. The seriously delinquent inventory fell to 1.3 million loans, a 23.3 percent year-over-year decline.
There were 48 states that posted year-over-year declines in the foreclosure inventory, and 32 of those states had decreases of more than 20 percent. The five states with the largest year-over-year drop in the foreclosure inventory were Florida (-47.7 percent), Connecticut (-36.9 percent), Michigan (-36.5 percent), Idaho (-35.4 percent) and Maryland (-34.4 percent). Only the District of Columbia (+18.1 percent), Massachusetts (+17.8 percent) and Wyoming (+4.1 percent) experienced year-over-year increases in the foreclosure inventory.
Figure 2 shows that judicial foreclosure states1 continued to have higher foreclosure rates in June 2015 than non-judicial states, averaging 2.1 percent and 0.6 percent, respectively. The foreclosure rate for judicial states peaked in February 2012 at 5.4 percent, while non-judicial states peaked at 2.5 percent in January 2011. As of June 2015, 42 percent of outstanding mortgages were in judicial states, but 71 percent of total loans in foreclosure were in those states.
MAPPS, the association of private sector geospatial firms, is accepting entries for the 9th Annual MAPPS Geospatial Products and Services Excellence Awards. The Excellence Awards exemplify the professionalism, value, integrity and achievement of MAPPS member firms as demonstrated over the previous year.
A panel of five judges will evaluate the submitted projects from eight categories.
airborne and satellite data acquisition;
photogrammetry/elevation data generation;
remote sensing;
GIS/IT;
surveying/field data collection;
small projects;
technology innovation;
licensed data products.
The panel will review each submission and select a winner for each category. A Grand Award will be presented from the category award winners to represent the MAPPS Project of the Year. Winners will be announced at the 2016 MAPPS Winter Conference in Las Vegas, Nev. The deadline for entries is October 31, 2015.
Click here to learn more about the submission process.
Global Tracking Project Demystifies the Ocean’s Top Predators
Chris Fischer helps tag Katharine, a 14-foot 2-inch, 2,300-pound great white, on Sept. 17, 2012. Katherine cruises the East Coast of the United States. (Photo: OCEARCH)
By Tracy Cozzens Photos courtesy of OCEARCH / R. Snow
Where are sharks? What are their migratory patterns? And how close do they come to shore? Until recently, the life cycle of sharks has been a mystery. The nonprofit OCEARCH is tagging and tracking a variety of sharks, and sharing the data with scientists around the world.
OCEARCH’s Global Shark Tracker app.
Since 2007, OCEARCH has tagged a total of 200 sharks, including 80 great whites, 80 tiger sharks and a few smaller species. About 50 tags are actively sending data to a publicly available shark tracker, also accessible with an iOS and Android app. OCEARCH also has popular Twitter feeds and Facebook pages for its most famous sharks, and Mary Lee (@MaryLeeShark, 86,100 followers) and Katherine (@Shark_Katharine, 32,300 followers). The access has changed the conversation from fear of a shark interaction to curiosity about their movements and life cycles, explained OCEARCH Founder Chris Fischer.
Before the shark tracking project, “We lacked the critical data on our large apex predators’ life history. We didn’t understand where they were mating, where they were giving birth, and these large complicated migrations that they make,” Fischer said.
Pulling a great white shark from the water long enough to tag it was a daunting hurdle that OCEARCH overcame by bringing together professional mariners, ocean experts and the academic community to solve the problem. The answer is a hydraulic lift system designed for shark tagging installed on the M/V OCEARCH research vessel. Once a shark is on the line, it’s maneuvered into a custom hydrauic lift. The 75,000-pound-capacity platform is designed to safely lift mature sharks for access by a multi-disciplined research team, who rush to conduct about 12 studies within 15 minutes before setting the shark free. The shark is guided by hand in the water on and off the lift.
This hydraulic lift allows scientists to pull in and tag a live mature shark, in this case Mary Lee.
Once OCEARCH figured out how to capture and tag the sharks, the organization invited multiple institutions to share the data. “We decided to open source the data and give the tracking data away so that the world could track the sharks and be involved in the project at the same time as the Ph.D.s. And that’s where the Global Shark Tracker really came about: it was including the world in solving this puzzle in real time in this journey.”
The M/V OCEARCH now travels around the globe “to help the scientists who study our ocean’s giants explode their knowledge forward as fast as we can,” Fischer said. “So we have the critical data we need to keep these balance-keepers, these lions of the ocean, our large sharks with a bright future.”
Research expeditions are conducted worldwide aboard the M/V OCEARCH, which serves as both a mothership and at-sea laboratory.
The long-term goal is gaining a clear picture of the sharks’ needs, so that the oceans can be properly managed. “They’re the fundamental building block of the future of the ocean. If we don’t understand our apex predators, the top of the food chain, if we don’t understand how to manage them toward abundance, then we can’t manage the whole system toward abundance,” Fischer said.
More than 50 of the world’s leading institutions and more than 80 ocean scientists are involved collaborating and sharing data, a different paradigm from the classic way researchers work. “We realized quickly the old institutional way of researchers holding their data close to the vest and not sharing it with the world, trying to get ahead of one another to get papers published, wasn’t really effective for creating a movement and awareness around the future of the ocean at scale,” Fischer said.
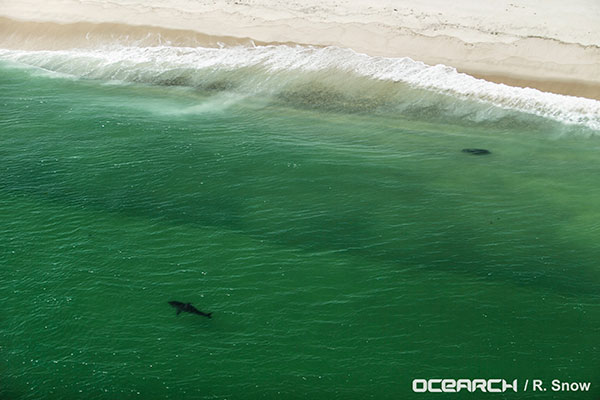
Great White shark Katherine spotted by plane before being captured and tagged.
Information on where and when sharks swim and migrate can be leveraged for public safety, Fischer said. “Once we solve the puzzle of the migrations, the sharks then repeat the migrations to the same areas at the same times of the year. It allows people to get the rhythm of their lives and understand when they’re passing through their areas, and when they’re there and when they’re not.”
The sharks are tagged accelerometers, and with SPOT trackers from Wildlife Computers (short for Smart Position and Temperature Tag). Data from the accelerometers show that the animals regularly recover and start swimming strongly within 2–4 hours after release. Data from the Global Shark Tracker provides strong evidence that the animals tagged show long-term survival and long-distance migrations indicative of normal function and reproductive cycles, according to OCEARCH.
A SPOT tracker (top) and an accelerometer are attached to Mary Lee’s dorsal fin.
SPOT tags are designed to function in salt water. The tag is mounted on a shark’s dorsal fin and provides location data when a shark’s fin breaks the surface for at least 90 seconds. The five-year battery life of the trackers has helped scientists decipher the sharks’ three-year migratory loops. After that time, the sharks tend to shed the trackers. “We just borrow that access for five years, to solve the puzzle and collect the data,” Fischer said.
The data from OCEARCH has revealed that sharks come right to shore, into the breakwater, more often than most people thought. Also, their range is much bigger than expected, with some juvenile sharks discovered migrating all the way from Cape Cod to New Orleans.
Mansfield Correctional Institute (photo by U.S. Corrections-Special Operations Group)
A drone flew over an Ohio prison and dropped a payload containing heroin, marijuana and tobacco last week, causing a fight to break out. Prison officers rushed into the north yard of Mansfield Correctional Institution in Mansfield after noticing 75 inmates gathering and fighting, according to an incident report from the Ohio Department of Rehabilitation and Correction as reported by CNN.
Authorities later viewed a survelliance video that showed a drone delivery had caused the fighting. Inmates were able to get their hands on the delivery containing 144.5 grams of tobacco, 65.4 grams of marijuana and 6.6 grams of heroin before the fight ensued and the package was thrown into the prison’s south yard, the incident report said.
Two corrections officers called for assistance and ordered the inmates to stop fighting, according to the department. They used pepper spray to control the fight, reports U.S. News and World Report. About 75 inmates in the north recreation yard and 130 on the south recreation yard were taken to the gyms, where they were strip-searched, run through a cell sensor and checked by a clinic. The nine people involved in the fight were placed in solitary confinement. No staff members or inmates were injured, the department said.
This is not the first time an Ohio prison has had an incident with unmanned aerial vehicles, according to Ohio Department of Rehabilitation and Corrections spokeswoman JoEllen Smith. She declined to elaborate further because of a potential security risk.
Ohio authorities are now on the lookout for more attempts to use drones to smuggle drugs over prison walls and into inmates hands, and the owner of the drone is being sought. “It’s something we’re certainly aware of,” Smith told CNN. “We’re taking a broad approach to increasing staff awareness and detection.”
Esri has published an interactive Wildfire Public Information Map and a 2015 California Wildfire Activity Map.
Wildfire Public Information Map
The Wildfire Public Information Map provides continuously updated information about wildfires and their perimeters from the U.S. Geological Survey and other agencies. It provides live weather warnings and wind information from the National Oceanic and Atmospheric Administration, as well as live weather radar from AccuWeather. A local perspective on events is available by turning on geotagged social media from Twitter, YouTube and Flickr on the Layers tab.
2015 California Wildfire Activity
This story map provides a detailed look at 15 active fires throughout California. As you scroll through the map, you can view fire perimeters and hot spots for each active fire, and get up-to-date statistics about each blaze, including total acreage, percent containment and damage caused.
A research team at Florida Atlantic University’s (FAU) College of Engineering and Computer Science has received a $187,000 grant from the Florida Department of Transportation (FDOT) to develop autonomous waterborne vehicles that can assist in bridge inspections.
Although the technology is still in the early stages of development, the long-term aim is that the unmanned surface vehicles (USVs) could be used by the agency to make bridge inspectors’ work safer and more efficient, according to GovTech.com. FDOT currently uses a variety of methods and equipment to inspect and test the sections of the state’s 11,451 bridges that are above water level. However, the only method that can be used to check the sub-surface areas is divers, who search for cracks, erosion, damage and defects that might impact on a bridge’s safety. A high percentage of Florida’s bridges are in corrosive salt water, and divers frequently experience problems with low visibility from silt, sediment, debris and algae, weed or other plant matter.
The team from FAU’s Department of Ocean and Mechanical Engineering have experience in USV research, and won second place at the eighth annual International RoboBoat Competition in Virginia Beach, Va., according to GovTech.com.
Two months into a 12-month project, the team has upgraded a watercraft used for past research projects with a new propulsion system that allows the craft to maintain its position and heading during a bridge scan. The next phase of research will be to equip the craft with an acoustic scanning system that functions in a similar manner to a LiDAR (Light Detection and Ranging) system. By installing the scanner on a mount that can tilt and pan, researchers expect to obtain 3D models of the parts of the bridge that are below the water.
The current vessel is equipped with an automatic control system that uses GPS and a compass to direct the craft toward programmed waypoints, and can keep it steady in a variable current, allowing scanning to take place. Once the acoustic scanner is equipped in September, the team will begin testing the craft’s scanning capabilities on three bridges that have been recommended by FDOT for their diverse representation of the state’s bridge environments.
“These sorts of technologies aren’t really meant to replace wholesale divers and so forth,” the FAU project’s principal investigator, Karl von Ellenrieder, told GovTech.com. “It’s to make their jobs easier, and it’s another tool that can help them do their jobs better. The way I view it is, you would take a vehicle like this and it would allow you to more rapidly scan bridges, and then when you detect a problem, send out a diver to verify the problem through testing. If you’re going to send divers out into strong currents with nasty snakes and stuff, it’s better to have a good sense there’s a problem before you do that.”
Satellites, aircraft and unmanned aerial systems (UAS) collect imagery that can be displayed and analyzed within a geographic information system (GIS) to extract important information.
To familiarize GIS professionals and students with the advanced earth imaging technologies available today, Esri has publishedEssential Earth Imaging for GIS. The book is a field guide to Earth imaging, providing guidance to efficiently and effectively display, manipulate, enhance, and interpret features from an image.Essential Earth Imaging for GISprovides a basic education in remote-sensing technology, promoting the effective use of sophisticated multispectral and 3D imagery.
Chapters introduce readers to remote-sensing methods and types of imagery as well as how to display and enhance multispectral images, process images in a GIS to improve quality, generate three-dimensional data, and visually interpret images in a GIS to extract information from them.
The book provides hands-on experience working with imagery in Esri’sArcGIS for DesktopandArcGIS Online. Exercises include assigning colors in multiband images and extracting information from multispectral images by digitalizing features. Companion exercises and a free 180-day trial of ArcGIS are available by accessing theEsri Press Book Resources website.
Essential Earth Imaging for GISwas written by Lawrence Fox III, emeritus professor of forest remote sensing and GIS at Humboldt State University in California. The book serves as a starting point for GIS professionals who want to learn the basics of imaging technology so they can incorporate it more effectively into their work, while students can use this book as a reference for introductory GIS courses that make use of image display and analysis.
Essential Earth Imaging for GISis available in print (ISBN: 9781589483453, 128 pages, US$59.99) or as an e-book (ISBN: 9781589484313, 128 pages, US$59.99). The book is available at online retailers worldwide, atesri.com/esripress, or by calling 1-800-447-9778. Outside the United States, visitesri.com/esripressordersfor complete ordering options, or visitesri.com/distributorsto contact your local Esri distributor. Interested retailers can contact Esri Press book distributor Ingram Publisher Services.
Esri Press publishes books on GIS, cartography, and related topics. The complete selection of GIS titles from Esri Press can be found on the web atesri.com/esripress.
SAP SE is offering new capabilities to turbocharge spatial intelligence by simplifying, accelerating and geo-enabling access to enterprise data.
In the era of the Internet of Things (IoT), proliferation of low-cost location-aware devices is augmenting enterprise data with the “where” component. The SAP HANA platform can help break the silos between enterprise and GIS systems, enabling companies to get more value from corporate data and uncover trends and patterns in a visually intuitive manner, the company said in a statement.
The announcement was made at the Esri User Conference (Esri UC) being held July 21–23 in San Diego.
Accelerating Spatial Processing for Real-Time Insights. The latest release of SAP HANA further enhances in-memory spatial processing capabilities to deliver faster responses for millions of data points, the company said. SAP HANA SPS10 brings new spatial features and enhancements, such as support for multidimensional geometries and on-the-fly spatial coordinate transformations, driven by customer innovation projects such as flight operations for Lufthansa Systems.
Case Study: Lufthansa
Lufthansa Systems is using the spatial capabilities in SAP HANA for tracking global flight operations. Changes in airport, meteorological and fleet data are monitored in real time and used to reroute flight trajectories in split seconds while optimizing fuel and crew costs. Lufthansa Systems believes that this innovative technology for dispatching, monitoring and visualizing air traffic by providing instant insights and real-time decision support will help change the face of its business.
“Together with SAP, we built a prototype of a future operational database for commercial flight support,” said Christoph Krüger, lead architect, Lufthansa Systems. “The spatial engine in SAP HANA has given us the ability to track thousands of flights per day on a rich 3D mapping interface that includes both spatial and temporal coordinates. At the same time, we were able to uncover breakthrough application scenarios that would not have been possible without the SAP HANA platform.”
Deeper Integration of SAP HANA and Esri
In addition to the existing read-only query layer integration to SAP HANA released by Esri in 2014, ArcGIS for Desktop now supports feature services providing a method for users to create, read, update or delete spatial data directly in SAP HANA. This simplifies the access and use of spatial data in SAP HANA and provides powerful, transactional spatial data creation and editing capabilities to support real-time operational and analytic applications, opening a broad new range of use cases and workflows for both Esri and SAP users.
The State of Indiana uses SAP HANA, SAP Lumira software and SAP Predictive Analytics software in combination with Esri for geo-spatial analytics to help ensure safer roads and traffic conditions and improve the lives of its citizens.
“Our long-standing technical co-innovation with SAP has taken a major step forward with the introduction of the SAP HANA platform and its spatial capabilities,” said Jack Dangermond, founder and president of Esri. “We now have a single platform from SAP that simplifies both integration and the deployment of mapping and spatial analysis across the entire SAP application landscape.”
Analytics Solutions from SAP Enhanced by Partner Extensions
The native integration between Esri ArcGIS and data visualization software from SAP, SAP Lumira, provides new capabilities for customers. It includes a rich library of charts and visualizations, overlay charts with geo-spatial data for location-based insight, support to visualize multiple layers of business data on top of Esri base maps and support to embed and create custom extensions with software development kits (SDKs). SAP partners such as Galigeo use these SDKs to extend the value of analytics solutions from SAP with new options for visualizing and analyzing information in SAP Lumira and SAP BusinessObjects Design Studio using Esri cloud and on-premise resources. A free version of SAP Lumira is currently available for download.
Geo-Enablement of SAP Business Suite powered by SAP HANA
SAP is delivering geospatial enablement of SAP Business Suite powered by SAP HANA software with a geo-enabling services offering. Geo-enabling allows SAP Business Suite powered by SAP HANA to store spatial data directly on SAP HANA instead of on a third-party database, resulting in faster response times and a simpler architecture.
Spatial Enhancements in SAP Work Manager
The SAP Work Manager mobile app has added Esri feature layer integration and offline mapping capabilities. These improve user interaction on mobile devices and enable mobile technicians servicing clients in the field to access their maps and associated information without Internet connectivity.
For more information, visit the SAP News Center. Follow SAP on Twitter at @sapnews, or view the video below for a demonstration from the 2015 Esri UC.
Esri has awarded Irish Water a special Enterprise Award for its achievements in GIS. The honor was given at the 2015 Esri User Conference, held July 20–24 at the San Diego Convention Center.
Irish Water is the new national water utility responsible for providing and developing water services throughout Ireland. Incorporated in July 2013, as a semi-state company under the Water Services Act 2013, Irish Water will bring the water and wastewater services of its 31 Local Authorities together under one national service provider. To do so, the utility consolidated its operations onto a single GIS platform, Esri’s ArcGIS. The consolidation took 12 months. In the first month and a half, Irish Water was able to meter more than 1.3 million homes.
“We have all water assets for the whole country in a single geodatabase,” Irish Water programme manager Paul Ahern said. “To trade and analyze information off this single source is a huge benefit.”
More than 2,000 users currently access the national geodatabase across departments in asset management, operations, workflows, capital investments, strategic planning, and customer services.
This means Irish Water will be better able to deliver water services, including increasing access to potable water.
The purpose of Irish Water is to safeguard water as a precious natural resource and to deliver water services in a way that protects the environment and meets the needs of all citizens and industry now and in the future.
Learn more about GIS for Water Utilities at esri.com/water.
The National Audubon Society, the century-old conservation group devoted to protecting bird populations and habitats throughout the Americas, accepted the Esri President’s Award for revolutionizing its data collection and management approach with GIS technology. Esri presented the award Monday, July 20, at the 2015 Esri User Conference in San Diego, Calif.
Esri equipped Audubon with $11.2 million worth of GIS software, which has helped, among other initiatives, to preserve one of the world’s most important bird breeding grounds — 11 million acres in Alaska that attract birds from all seven continents.
“Esri’s technology improves our conservation results and provides a common enterprise solution that helps glue together our distributed network of state offices, local chapters and international partners,” said Audubon president and CEO David Yarnold. “Esri is a very special company in the technology world, and it has built a truly unique global community of users. We’re humbled and honored to receive Esri’s highest honor.”
In 2010, Audubon overhauled its organizational alignment based on four North American flyways, the north-south paths traveled by migratory birds each spring and fall. Under this new approach, the society adopted an enterprise GIS using Esri’s ArcGIS platform to build a comprehensive new picture of large-scale conservation projects.
The organization’s transformation shifted Audubon to an intelligence-centric culture with more than 1,000 network members using the ArcGIS platform on a widespread basis to gain ownership of authoritative data. Adopting an enterprise GIS strategy made it easier for the Audubon network to access and use spatial data about species populations, habitat locations, migration patterns, and more.
“At Esri, we are extremely passionate about making a difference in the world with geography and helping our customers and partners do amazing things, such as the National Audubon Society,” said Esri president Jack Dangermond. “It has been a fantastic experience supporting Audubon to help people visualize and understand why we need to preserve Earth’s species and ecosystems.”
Recent projects reflect the opportunity for the nonprofit to tell compelling stories grounded in geography. One example is Audubon’s application of GIS to tell the story of how climate change poses an incredible challenge to the preservation of bird species. Utilizing the ArcGIS platform, the organization created maps that show how up to half of bird species in North America will be disrupted over the next century due to climate change.
The National Audubon Society’s network includes 22 state offices, 41 nature centers, 23 sanctuaries, and 464 local chapters throughout the United States and numerous partners throughout the Western Hemisphere. The organization awarded Esri’s founders, Jack and Laura Dangermond, with the 2015 Audubon Medal for their accomplishments in technology and conservation innovation, as well as their support for research institutes, schools, and nonprofits.