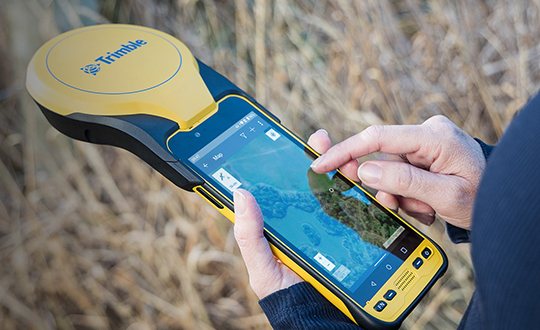
Trimble has announced a new high-performance data collector for its Mapping and Geographic Information Systems (GIS) portfolio — the Trimble TDC650 handheld. Built for GIS data collection, inspection and asset management activities, the TDC650 provides users a rugged solution with scalable high-accuracy GNSS positioning for professional field workflows.
The TDC650 is fully integrated with today’s demanding GIS data environment, powered by the Trimble Software Development Kit (SDK) that enables precision GNSS positioning for apps such as Esri ArcGIS Field Maps and Trimble TerraFlex software. The TDC650 is also a scalable solution that allows customers to choose their desired accuracy down to the centimeter-level to meet needs and budget requirements.
“This is an ideal tool for customers tasked with modernizing critical utilities including electric, gas and telecommunications networks,” said Gareth Gibson, marketing director, Trimble Mapping and GIS. “The precision, quality and data integration workflows needed to map the physical world to a digital one in these projects requires a modern data-collection platform like the TDC650.”
City, state and local governments and utilities will benefit from this solution, which is part of the larger Trimble Public Sector ecosystem that includes Cityworks software for stormwater inspections and Trimble Unity for monitoring municipal water pressure and hazards. As GIS data continues to grow more complex, Trimble helps simplify, visualize and make sense of the data so customers can make better decisions in managing their communities’ assets.
Initiative aims to increase the global coverage, quality and accessibility of seabed mapping data through collaboration and the creation of a more integrated marine geospatial sector
Durdle Door on the beach in Dorset County, United Kingdom. (Photo: Fonrimso/iStock/Getty Images Plus)
The UK Hydrographic Office (UKHO) is inviting UK government organizations involved in seabed mapping who share common interests in optimizing the UK’s national maritime assets to become members of the newly unveiled UK Centre for Seabed Mapping (UK CSM).
UK CSM is administered by the UKHO, and was submitted as a UK Government Voluntary Commitment to the United Nations at the UN Ocean Conference in Lisbon, Portugal, on June 27.
The UK CSM has a remit to increase the coverage, quality and access of seabed mapping data collected using public funds, as well as to better promote it as a critical component of national infrastructure.
Working groups established
Created to spearhead a coordinated approach to the collection, management and access of seabed mapping data – and to champion a more integrated marine geospatial sector in the UK – the UK CSM has established three working groups: National Data Collaboration, International Data Collaboration, and Data Collection Standards.
These working groups will further the discussion and coordination of data accessibility, collection and collaboration, as well as progress work on data standards, by creating the conditions and developing infrastructure to enable the diverse community of marine geospatial stakeholders to come together to deliver significant, sustained and strategic benefits to the UK – particularly in the context of the integrated review and the UK’s Global Britain vision.
So far, 22 government agencies are involved in the inaugural management group meeting of the UK CSM and volunteered to participate on the working groups.
The UK CSM will develop specifications that support UK and international standards for the collection of marine geospatial data.
Work supports climate change research, the 2020 Juneau landslide, and effects of the Exxon-Valdez oil spill
NV5 Geospatial marks its 65th year helping Alaska solve environmental and geospatial challenges, with new hydrospatial projects with the National Oceanic and Atmospheric Administration (NOAA), U.S. Geological Survey (USGS), Alaska Railroad Corporation, Alaska Department of Natural Resources, U.S. Fish and Wildlife Service and the U.S. Department of Agriculture.
“As climate change intensifies, so do the challenges that Alaska and its citizens face,” said Adam McCullough, NV5 Geospatial’s Alaska program manager. “From mapping the coastlines, to collecting lidar and imagery data to better understand geohazards and landslide risks, to mapping rivers, lakes and other surface water features, we are involved in critical projects across the state. We are proud to work side by side with national, state and local governments and agencies, as well as private corporations to facilitate climate-change informed decision making over the state’s valuable, unique resources.”
The following six projects provide a sampling of the work in which NV5 Geospatial has participated across the state:
Revillagigedo Topobathymetric Lidar and Imagery Mapping – NV5 Geospatial is working alongside state and federal partners on a multi-year program to map Alaska’s 66,000 miles of complex coastline. This work is part of a larger national shoreline mapping project being undertaken by NOAA to gather baseline data to update nautical charts, manage coastal resources, and define U.S. territorial limits.
The data collected also can support maritime trade and transportation, as well as wave and wind energy site selection. The data supports coastal resiliency efforts that include modeling sea-level change, storm surge, coastal flooding and pollution trajectories, as well as analysis and monitoring of critical habitats, developing land and marine GIS base layers.
The Alaska Railroad Corporation (AARC) Lidar Acquisition for Geohazards – AARC engaged Michael Baker and NV5 Geospatial to collect high-resolution topographic lidar and imagery data for analysis of geohazards, hydrology, engineering and landscape ecology across portions of its vast rail network in Alaska. NV5 leveraged its advanced combined low-altitude sensor solution (CLASS) mounted to a helicopter to simultaneously collect lidar, ortho-imagery and oblique images along the rail line that enables researchers to evaluate landslide and hydrological risks in areas of concern.
USGS 3DEP Juneau Landslide Lidar Study – In the aftermath of unprecedented rain events in Southeast Alaska in December 2020, the City and Borough of Juneau, along with Alaska Electrical Light & Power, partnered with the USGS to acquire and process 3DEP-compliant airborne topographic lidar data covering the Juneau landslide impact area. The USGS contracted NV5 Geospatial to perform the lidar survey that included acquiring extremely accurate lidar to USGS’s highest quality level specification.
The lidar data will support planning and landslide assessment to enable the reinforcement of critical infrastructure resources in the area. Project stakeholders are able to use this data along with existing lidar collected by NV5 Geospatial in 2013 to study how the landscape is changing in precise detail.
Alaska 3D Hydrography Program (3DHP) – The USGS, in partnership with state, local, and tribal governments and others, has embarked on a multi-year effort to enhance the mapping of rivers, lakes and other surface water features for the entire state of Alaska. Supporting that initiative, NV5 Geospatial has been repeatedly contracted by USGS to develop improved hydrography, covering 62,934 square miles to date.
NV5 Geospatial is leveraging the recently completed statewide interferometric synthetic aperture radar (IfSAR) coverage as the elevation data source to define drainages, impoundments and other hydrographic features in greater detail and accuracy. Once completed, the enhanced map data will be used to inform navigable waterways; conduct flood analysis; and delineate wetlands, fish habitat, recreational opportunities, coastal resiliency and more.
Exxon-Valdez Oil Spill, National Wetlands Inventory and National Hydrography Dataset – The U.S. Fish and Wildlife Service is leveraging grant funds to map wetlands and hydrography for areas affected by the 1989 Exxon Valdez oil spill. These areas include Kodiak Island, Afognak Island and the shorelines of Shelikof Strait in Alaska. Wetlands data are used by natural resource managers to promote the understanding, conservation and restoration of wetlands, while the hydrographic data supports scientific studies, cartography and natural-resource management associated with inland surface water features.
U.S. Department of Agriculture Aerial Orthoimagery Term Contract – NV5 Geospatial was awarded a large multi-year term contract to support aerial orthoimagery in Alaska. The contract has been used to acquire tens of thousands of square miles of high-resolution orthoimagery covering some of the nation’s largest national forests including Tongass and Chugach, as well as agricultural lands significant to the Natural Resource Conservation Service. These areas are in areas with some of the most challenging weather and terrain anywhere in North America and require aircraft on persistent standby to take advantage of the brief windows of opportunity to collect high-quality imagery.
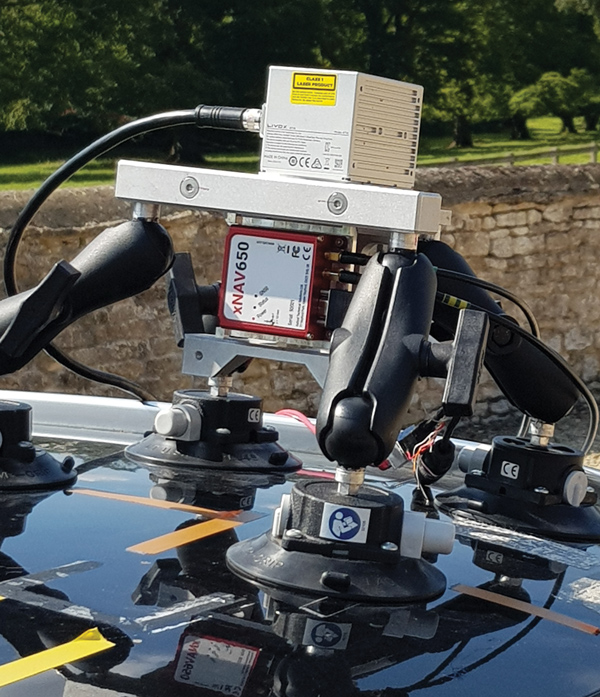
Mobile mapping using an OxTS xNAV650 INS and lidar sensor. Photo: OxTS
We discussed mobile mapping with Jacob Amacker, application engineer, OxTS.
How do you define “mobile mapping” as opposed to “surveying”?
We use the two terms interchangeably. Each one has a different connotation depending on where you are in the world and both can be useful. We use them to cover a broad range of use cases, but “mobile mapping” is used more specifically for land-based mapping of the environment. A typical application might be a van equipped with an INS [inertial navigation system] and lidar sensors.
“Surveying” can be used a bit more generally, applying to aerial or pedestrian-based mapping, but it does have the connotation of static mapping, which we do not typically handle.
What are your main markets for mobile mapping?
It is very hard to say. The world of mobile mapping is so diverse. However, lidar mapping could be seen as both the largest and the fastest-growing market in the surveying world as lidar has become widely affordable. Although our technology can be used with any surveying devices, at OxTS we particularly like to use lidar and are focusing on getting the best results from lidar data. This has included making our own point-cloud georeferencing software to maximize the potential of our navigation data in making point clouds.
What are the main differences between your devices for aerial mapping and for ground-based mapping?
We use the same INS device for both ground and aerial mapping. For use on manned aircraft, we would always recommend our highest accuracy system with the best IMU, the Survey+. The main source of inaccuracy in survey data will come from the IMU error over the range to the objects. Because most of this range is the aircraft’s altitude, this error is quite significant. For land-based mapping work, the measurements provided by the lighter and smaller xNAV650 are still suitable for many high-precision applications.
GNSS-INS integration has been done for decades. What is new and what are the remaining challenges?
It is now much more affordable to have very high-grade IMUs and GNSS receivers. Nevertheless, there will always be further improvements to be made to how the data streams are combined. On a similar note, other navigation aiding sources are increasingly being considered to supplement the IMU and the GNSS receiver — such as wheel speed sensors, lidar, camera odometry and others that can also be integrated to stabilize and improve the navigation data. Overall, it is very exciting what is yet to come out of INS technology. In recent years, it has become so good that people expect more and more from it, and this demand must be met. What happens when GNSS drops out? We are seeing increasing development to make the navigation data robust against challenges of any environment.
Given the IMU’s drift, for how long can your system function at an acceptable level in case of a GNSS outage?
It is difficult to put a number on what kind of drift is acceptable, as it depends on the application and the end-user requirements. Typically, half a meter of drift in one minute of GNSS-outage might be the goal for some of the higher-grade surveyors. Still others might only be satisfied with negligible drift.
What keeps the INS and the lidar unit synchronized during a GNSS outage?
The INS has an internal clock to keep the timing during a GNSS outage. Of course, this will not be as accurate as the atomic clocks on the satellites, but it is quite adequate to maintain survey-grade accuracy during GNSS outages. GNSS is still necessary to get the timing information in the first place, and this is a reliance that INS devices will want to remove in the future.
What are the key remaining technical challenges in UAV lidar mapping?
With continuing improvements in UAVs, lidars, GNSS receivers and other sensors, the key to unlocking more efficiency and profitability in this market will be improving and simplifying workflows and processing. The next frontier is integrating AI and machine learning with digital twin models to create forecasting tools.
UAVs are much cheaper to operate than manned aircraft per hour, but not necessarily per square mile. UAVs can cover ground that cannot be mapped from a land vehicle; however, the latter have a much greater range.
You are correct. Each type of vehicle has its area of best utilization. Once we know what the customer wants from the data being collected, we can determine the size, weight and power (SWAP) of the payload needed, and then it’s a matter of analyzing cost versus capability and working with the customer to pick the right payload for the right vehicle at the right price.
What positional accuracy do you achieve for your point clouds?
With our GNSS-receiver-based navigation unit, which also includes an IMU and key IP [intellectual property] from our company, and the right combination of tools, we achieve an accuracy of 2 cm to 3 cm.
What are your key markets for UAV lidar mapping?
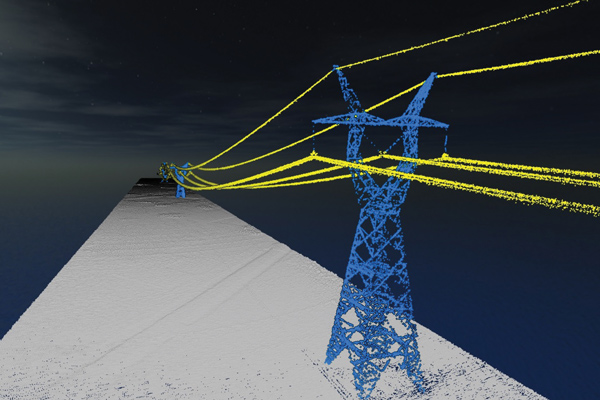
I believe it is still the Wild West in this market space. Really smart people are figuring out new ways to use these systems every day. We sell systems to teams doing high-end inspections of infrastructure, such as roads, bridges, corridors and power lines, as well as for land surveying and mining.
What was a recent application of one of your mapping systems?
One of our most recent success stories has been the launch of our Geo-ECTO-1 system. It features dual lidar sensors combined with a 360-degree FOV [field of view] camera and high-end GNSS receiver. It is ruggedized from the ground up and is meant for high-end survey and infrastructure inspection work. The payload is designed to quickly transition to a UAV-based system. Our two launch customers/partners are California-based survey companies Guida Survey and LACO Survey. It has been a great experience getting these systems up and running with our partners.
Our next adventure will be to work with UC San Diego’s Scripps Oceanographic Institute. We are proposing and demonstrating one of these systems to be used for analyzing cliff erosion on the beaches here in California, where several collapses have led to the loss of life. We want to support figuring out how to use the analyses to create a system that would give early warning of trouble spots. With these tools we can make our beaches much safer.
The Boston Dynamics Spot robot equipped with Velodyne lidar. (Photo: Velodyne)
Velodyne Lidar Inc. has signed a multi-year agreement for its lidar sensors with Boston Dynamics, a mobile robotics company best known for its “Spot” dog-like robot.
Boston Dynamics selected Velodyne’s sensors to provide perception and navigation capabilities for its highly mobile robots. The sensors enable mobile robots to operate autonomously and safely, without human intervention. They provide real-time 3D perception data for localization, mapping, object classification and object tracking.
Velodyne’s power-efficient sensors support autonomous mobile robots in a wide range of challenging indoor and outdoor environmental conditions, including varying temperature, lighting and precipitation, the company said.
Velodyne’s lidar sensors will enable the robots to autonomously navigate complex environments, safely avoiding obstacles and finding the fastest route to perform tasks in environments from manufacturing plants and construction sites to distribution centers and warehouses.
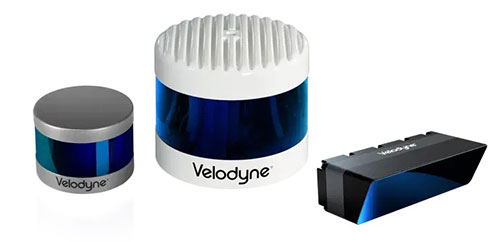
The Alpha Puck, Alpha Prime and Velarray M1600 lidar sensors. (Photo: Velodyne)
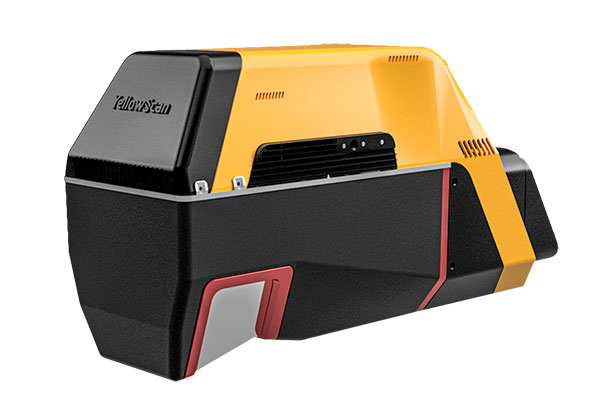
YellowScan has released a new long-range lidar scanner. Voyager is a powerful solution for both manned and unmanned aircraft.
With Voyager’s wide field of view, all of the points collected are oriented toward the ground, meaning there is no loss of points. This also means 1.5 million points per second will be usable, which would not be the case with a 360° scanner.
Voyager combines a Riegl VUX-120 laser scanner with a Trimble Applanix AP+ 50 AIR or Applanix AP+ 30 AIR GNSS-inertial board, providing precision of 0.5 cm and accuracy of 1 cm.
Voyager’s detection and processing of up to 15 target echoes per laser pulse allows for excellent vegetation penetration. Its has an extremely fast data-acquisition rate of up to 1800 kHz, suitable for projects requiring the highest point density.
The laser scanner’s specifications can be customized to fit the needs of various projects and platforms, and can be combined with YellowScan’s full suite of software solutions to easily extract, process, merge and colorize point-cloud data.
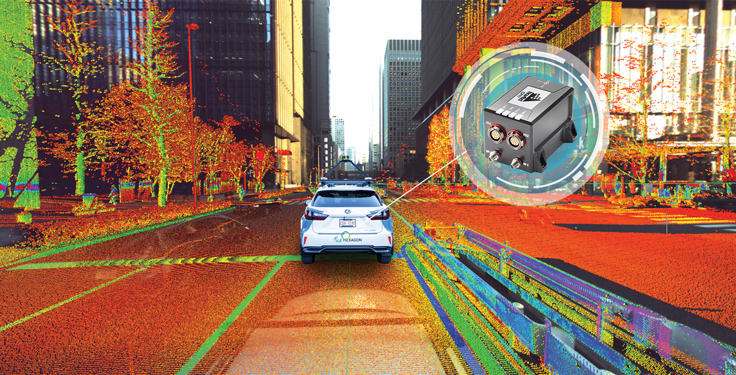
Hexagon | NovAtel’s CPT7 integrates a GNSS receiver and an INS to deliver up to centimeter-level accuracy. (Photo: Hexagon | NovAtel)
We discussed mobile mapping with Bryan Leedham, product manager of enclosures and post-processing software, NovAtel, Autonomy & Positioning division, Hexagon.
How do you define mobile mapping?
It is getting broader in scope, as more folks find reasons to map the world. The key goal is to capture reality from mobile platforms to build a digital representation of reality for some large area, such as a city, a road or a factory. Most of the time, that means from a ground vehicle on public roads.
It’s also safer and faster than traditional surveying because you don’t have to stop traffic or dodge it.
Right! In an ideal world, rather than spending days setting up traditional survey equipment, you could strap some sensors on a mobile platform and gather accurate map data in minutes.
What are the key remaining technical challenges?
Picture one of Google’s or Waymo’s mapping vehicles. The first sensors that come to mind are GNSS, inertial, lidar and radar. Each of those has its own unique strengths and weaknesses. The first technical challenge that remains is to mature each of those technologies for a lower enough cost that it’s affordable.
Right now, mobile-mapping vehicles are quite expensive, especially in areas where some of these sensors will struggle more than others. To map very dense urban spaces — with underground areas, overpasses and tall buildings where GPS is challenged — you need a very strong localization system that can survive those conditions for however long it takes to drive through them. If I’m building a car to map rural Alberta, I could choose much cheaper sensors than if I were trying to map downtown Chicago every week.
On the flip side, you must deal with the massive amounts of data collected.
Yes, that is a very large challenge. Lidar data, in particular, is guilty of generating very large point clouds. It’s a balancing act. More accurate and higher resolution maps require lidar sensors with even denser point clouds. So, you need data management and sufficient processing power to get accurate results quickly.
What are the key technical challenges in sensor fusion?
Sensor fusion is how we approach the goal of mapping as accurately as possible in increasingly difficult environments. On their own, GNSS receivers struggle in obstructed areas but, when you pair them with other sensors, they become very complementary.
Lidar and cameras, for example, are quite good at measuring the distance to nearby objects and at classifying them, but they have no idea where they are relative to one another. Likewise, if you let an IMU [inertial measurement unit] sit in your car, it will no longer know its location. However, once you give it a position update, it is very good at maintaining a trajectory over a short period of time. When you combine absolute and relative localization, all the sensors play to their own strengths.
What is NovAtel’s SPAN software?
It stands for synchronous position, attitude and navigation. It is the sensor-fusion software that combines the GNSS, inertial and whatever other sensors. It is based on core NovAtel GNSS receiver software. We can use NovAtel receivers in combination with IMUs from a wide range of manufacturers and, in the future, hopefully, other sensors from a variety of manufacturers as well.
SPAN started with blending just GNSS and inertial but we’re now researching how to bring in such things as lidar and cameras. Autonomous Stuff, another Hexagon company, works on the greater sensor fusion using SPAN as well.
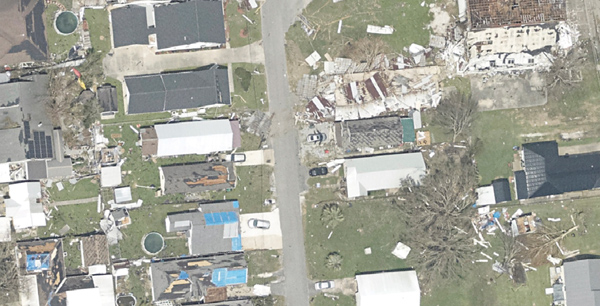
High-resolution imagery geolocated by the sixth-generation Digital Sensor System (DSS) after Hurricane Ida. (Photo: NOAA)
Applanix, a division of Trimble, has been working with the National Oceanographic and Atmospheric Administration (NOAA) since the early 2000s to develop their response for emergency and coastal mapping activities. We discussed this collaboration with Joe Hutton, the company’s director of inertial technology, land and airborne products.
How has Applanix collaborated with NOAA regarding emergency response and coastal mapping?
Early on, we worked with them to develop a solution that allowed them to get out in the field and produce high accuracy map products with minimal touching of the data. In mid-2021, we delivered the next generation of this solution, or the DSS version six, which represents the culmination of everything learned over the years about how to produce imagery for emergency response, in terms of the types of collection, the types of imagery, and how to get it into first responders’ hands as quickly as possible.
At the heart of the system is our direct georeferencing technology. It’s a solution that allows us to assign the geographic location of every pixel of the digital imagery collected in the air. As soon as you land, you have the coordinates of every pixel, which means that you have a map that NOAA then pushes to the cloud for first responders to use in their emergency response efforts.
The collaboration consisted of Applanix working with Lead’Air to manufacture the next generation system that meets NOAA’s latest requirements. That’s what we delivered in 2021. Weeks after delivery, NOAA was called to respond to the hurricanes. They flew the new system with great success and were able to use it for their response.
What is your perspective on ground control points (GCPs) vs. direct georeferencing?
It is impossible to place GCPs in an emergency response when you cannot get on the ground. People who say they need GCPs do not really understand direct georeferencing. We’re having this debate even after 20 years of proving this technology. The NOAA system does not use GCPs and the map products are at centimeter level accuracy.
We use Trimble’s RTX technology, which enables centimeter-level GNSS positioning without base stations, which is important when the CORS or local RTN is unreliable due to a disaster. We have high accuracy inertial systems that get us the high accuracy orientation, so that we can go directly to ortho photos and ortho mosaics without running any triangulation or using GCPs in that process. That is a standard process these days. GCPs are only there for quality control if you want to deliver a final map product.
Did NOAA fly the mission with its own aircraft?
Yes, these are NOAA’s King Air or Twin Otter aircraft. The King Air aircraft is specifically outfitted for these types of emergency response and coastal mapping activities. The DSS system gets installed into the airplane and gets calibrated in terms of checking the system out for accuracy. Then it’s ready to fly the response. In the air, they collect the imagery over a flight path of interest to them. Then, it’s developed from raw imagery into JPEGs in the aircraft, and all the georeferencing data is logged with that imagery so that as soon as they land they can push a button and start to reference the JPEG imagery and push it to the cloud.
What are the components of your system?
What makes this system so unique is that it encompasses all the lessons learned over the years in terms of what NOAA needs to optimize for both their coastal mapping and their emergency response. It incorporates two pairs of color and near-infrared Phase One cameras that are configured in an oblique format with some overlap, forming a bowtie footprint on the ground.
You have 100% overlap of the color with the near-infrared and it’s on a high-performance stabilized mount that keeps everything perfectly level. The mount also has a special feature that enables the operators to rotate the cameras to go into nadir mode, mostly for traditional coastal mapping that requires stereo imagery. We were able to incorporate into a single system the requirements for both emergency response—where you want large coverage and obliqueness to look for damage—and nadir for coastal mapping.
Lead’Air built the sensor for you, on your specs, correct?
Yes, that’s correct. We’ve worked with Lead’Air for probably 20 years on flight management system (FMS) technology. They also have an amazing capability to build stabilized mounts and hardware systems. So, we decided to work together. We contracted them to implement some of their innovative hardware in this new design for us to deliver to NOAA. We contracted them to do all the manufacturing of the design and delivery to NOAA.
One of the quite innovative things that they did was to develop a new flight management capability that allows NOAA to fly ad hoc along highways or rivers, looking for damage. Traditionally, for aerial imagery you have to pre-flight plan trajectories. They designed an FMS that enables a pilot to fly a road or a river looking for damage without worrying about traditional block collections as with a more traditional FMS. So that feature further increases productivity. If you look at the most recent imagery at www.storms.ngs.noaa.gov you will see that it looks like spaghetti, not like blocks. That’s because they are following the roads and the rivers looking for specific damage.
Does the post-processing use your software?
Yes, it uses the POSPac MMS post processing software with POSPac Trimble Post-processed CenterPoint RTX correction service, allowing us to get that centimeter-level position accuracy, anywhere in the world with just an internet connection. You don’t have to worry about having a local base station—which, of course, if you’re in an emergency response situation, might not be there anyway. So, this is a very powerful way of getting global centimeter-level accuracy in real time, without having to worry about the ground-based GNSS infrastructure, that is, the local real-time network, that’s on the ground.
If you don’t have internet access, you can ship that data to the nearest place that does, right?
You could, however NOAA simply flies to wherever there is access. What takes the longest is to develop the imagery from the raw format to the JPEG format, because these are such large images. Doing that in the air saves an enormous amount of time. You have these JPEG-ready images that are compressed and can go right into the georeferencing process and make it really, really fast.
That’s a matter of computing power and smart software. What else did Lead’Air contribute?
This very efficient, fast image development process in the aircraft.
It sounds like it was a very integrated process between Applanix and Lead’Air. So, NOAA had the instrument mounted on their aircraft, their pilots did the flying, and then you processed the data?
No, NOAA’s team processes all the data. We just deliver the hardware and the software. They created the workflow software to push the data to their cloud environment.
NOAA uses this data to produce maps of the damage and highlight different situations and hazards?
Yeah. When these hurricanes go through, the first questions people have are “Where’s the damage? Are these roads passable? Did my house survive?” If you are doing response, you need to get teams in there. First, however, you need to know whether the roads are passable, so that you will not waste time going down a road that is not. So, the first thing they do is go up in the air and survey the main roads to push the imagery back, so that people can assess whether the roads are passable. Then they start to look for specific areas of damaged infrastructure, to triage where to put their resources. Then they ask “How do we manage disaster recovery?”
What lessons did you learn?
We are still learning about the power of the system, because these are Phase One 150 megapixel color cameras. It is such a powerful combination of sensors that they’re starting to look at different information they can get out of these things. They’re still learning new lessons in terms of what information can be useful for both the emergency response and the coastal mapping.
Ultimately, we’ll go to full ortho maps in the aircraft. That’s just going to be a matter of computational power. The holy grail would be to produce an orthophoto in the aircraft and radio it down to the ground in real time. Nothing prevents you from doing that now other than computational power and bandwidth. It’s not practical yet, but it will probably get there.
Do you have collaborations like the one with NOAA with any other major U.S. agencies?
We’ve worked extensively with NASA over the years. For example, we have worked with them on the ice bridge project. That is where they survey ice at both poles to measure its thickness and how global warming is affecting it. They use our system on that to do the georeferencing. We also work extensively with other branches of NOAA for their shoreline mapping from their ships. We have worked with them over the years to provide the georeferencing solution for the multibeam echo sounders to produce their nautical charts.
Tall buildings block GNSS signals, making satellite navigation in urban canyons very challenging. (Photo: RoschetzkyIstockPhoto/iStock/Getty Images Plus/Getty Images)
GPS positioning for navigation and mapping is challenging in urban environments, where GPS signals often are blocked by tall buildings. The following three papers — to be presented at the Institute of Navigation (ION) GNSS+ conference Sept. 19–23, 2022 — explore ways to solve that problem. The full papers will be available at www.ion.org/publications/browse.cfm following the conference.
ALGORITHMS FOR URBAN MAPPING
In this work, the authors use an urban environment model incorporating visibility predictions and remote-sensing techniques, which they tested in a sensor-equipped vehicle in Denver. They use an interacting multiple model (IMM) filter that uses extended Kalman filters to build and verify a map of the signal environment in an urban-canyon setting. The techniques will give ground-vehicle operations the ability to plan for blocked and delayed signals for global path planning.
Zeller, Emma; Strandjord, Kirsten, University of Minnesota; and Wang, Pai, Shanghai Jiao Tong University; “Algorithms for Mapping the Urban Signal Environment for Navigation of Ground Vehicle Operations.”
ADDING VISUAL TO GNSS/INS
GNSS real-time kinematic (GNSS-RTK) positioning is a key technology for surveying and mapping applications. To extend the capability of GNSS in difficult environments, a tight coupling between GNSS-RTK and an inertial navigation system (INS) can greatly improve the results. If the time spent in a GNSS outage is too long or if the kinematic of the survey is too weak, the GNSS/INS solution can be compromised with high navigation errors, ultimately making it impossible to align the heading angle at initialization.
This paper presents an innovative solution to overcome GNSS/INS limitations, minimizing system complexity by using a tightly coupled GNSS/INS solution with a monocular visual inertial SLAM system. This solution is capable of initialization in a few seconds and is very reliable in the long term. This vision/INS/GNSS coupling increases the overall RTK fix rate and broadens the availability of high-precision navigation solutions under challenging conditions.
Bénet, Pierre; Saussay, Brice; Saidani, Mourad; and Guinamard, Alexis; SBG Systems; “Tightly Coupled Inertial Visual GNSS Solution: Application to LIDAR Mapping in Harsh and Denied GNSS Conditions.”
USING 3D BUILDING MODELS
To solve the urban-navigation challenge, the authors propose using a 3D building model to assist GNSS positioning. This type of algorithm is named the 3D building model aided GNSS (3DMA GNSS). It can predict measurement errors and the visibility of the satellites, as line-of-sight or non-line-of-sight. The solution is then derived from the likelihood of the observed and predicted measurements over candidate locations.
The authors propose an innovative method for evaluating the reliability of building models based on the awareness of sky visibility in a specific geographic context. Sky visibility estimation is improved with use of a support vector machine regression and considering low-Earth-orbit (LEO) constellations. The real-time sky visibility could present the update of the surrounding buildings, whereas the predicted sky visibility based on the existing building models remains unchanged. Making use of this inconsistency, the authors could identify areas with the updated building. Additionally, the impacts of the building update monitoring on the 3DMA GNSS are evaluated in an urban canyon.
Xu, Hao-Sheng and Hsu, Li-Ta; Department of Aeronautical and Aviation Engineering, The Hong Kong Polytechnic University; “Urban Buildings Update Monitoring Based on Sky Visibility Estimation using GNSS and LEO.”
A roundup of recent products in the GNSS and inertial positioning industry from the June 2022 issue of GPS World magazine.
SURVEYING & MAPPING
Base/Rover
For survey-grade GNSS accuracy anywhere
Photo: Bad Elf
A base/rover feature built upon the Flex GNSS receiver brings affordable centimeter-level accuracy to surveyors and geospatial professionals working anywhere in the world. The solution consists of two Flex GNSS receivers and two UHF radios, allowing customers to perform high-accuracy field data collection in areas where traditional real-time kinematic (RTK) corrections or cellular coverage is not available. Existing Flex customers can upgrade by adding Flex radio kits (pictured). The Bad Elf Flex enables data collection either as a standalone receiver or paired with apps on iOS or Android phones and tablets.
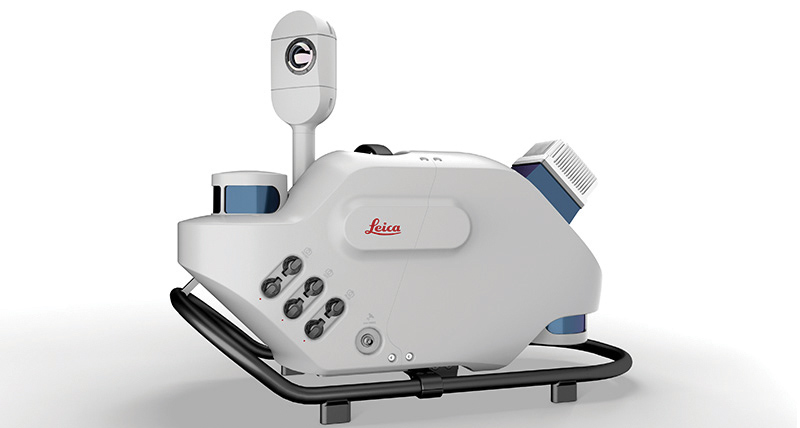
The Leica Pegasus TRK reality-capture mobile-mapping system features artificial intelligence (AI), autonomous workflows and intuitive interfaces. To comply with privacy regulations, its AI can identify and blur identifiers, such as people and vehicles, in real time. Features include advanced dynamic laser scanning and an expandable imagery system for recording, measuring and visualizing. It enables long-range mobile mapping for asset management, road construction, rail, critical infrastructure, utilities and more. The system also can create high-definition basemaps for autonomous vehicles.
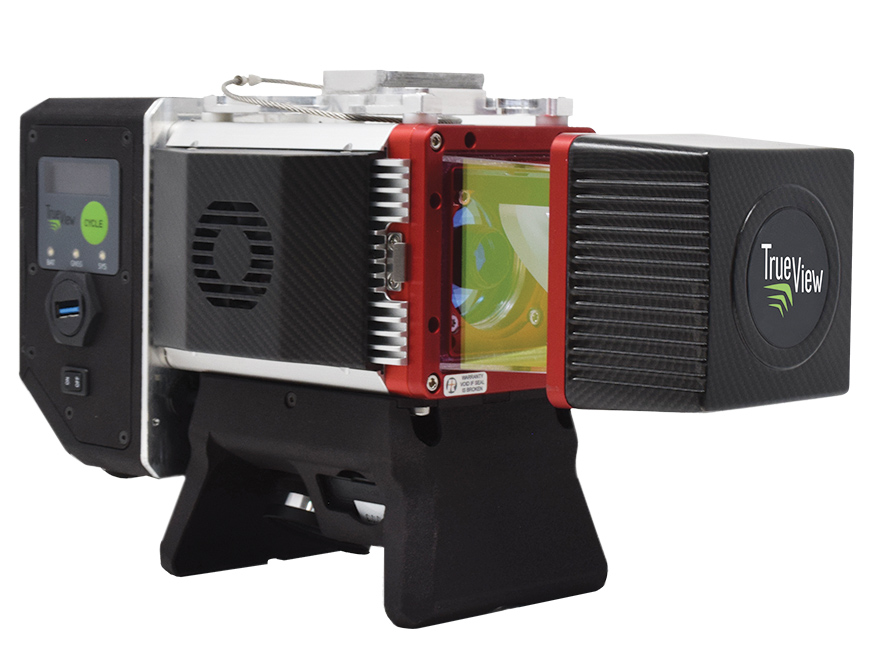
The True View 645/650 is the latest 3D Imaging System (3DIS) from GeoCue. Combined with the True View EVO data-processing software suite, it includes the full post-processing software workflow and directly integrates with Applanix POSPac. EVO supports the creation of project deliverables including ground classified point clouds, surface models, contours, digital elevation models (DEMs), volumetric analysis and wire extraction. The system delivers colorized lidar deliverables with accuracy better than 3 cm root-mean-square-error (RMSE) for the True View 645, and better than 2 cm for the True View 650.
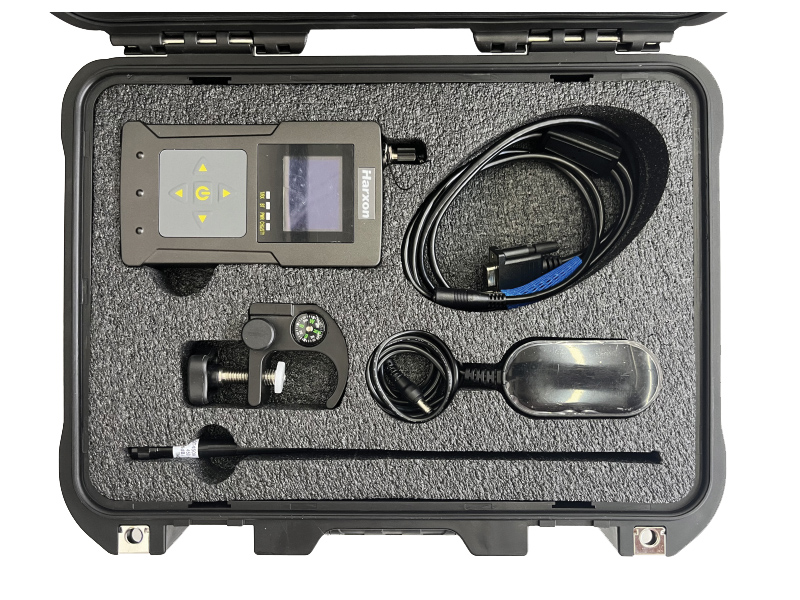
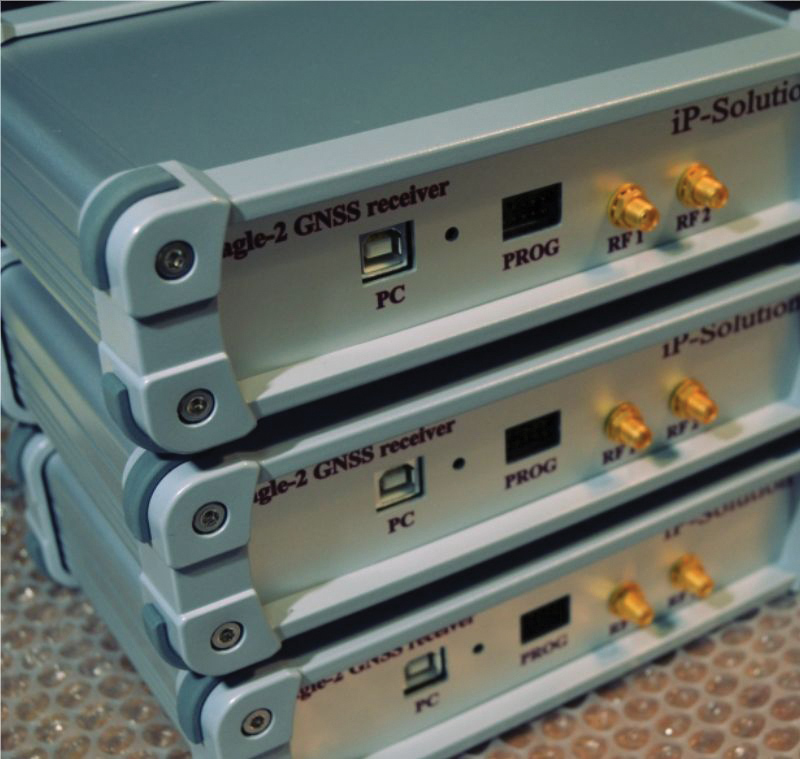
The Eagle-2 works with software-defined receivers in real time or records GNSS signals for post-processing. For post-processing, Eagle-2 supports most third-party receivers, such as MATLAB and C/C++ receivers. The front end allows a user to work with two perfectly synchronized channels connected to two antennas. The Eagle-2 supports GPS, Galileo, GLONASS , BeiDou, QZSS and SBAS.
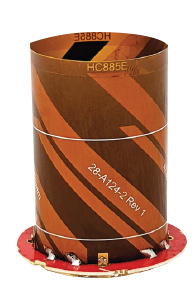
The housed HC885XF and embedded HC885EXF dual-band eXtended Filtering (XF) antennas receive GPS/QZSS L1/L5, GLONASS G1/G3, Galileo E1/ E5a/b, BeiDou B1/B2/B2a and L-band corrections services. They have been tuned to provide optimal support for the entire L1/G1/E1/B1/L-band correction and L5/G3/E5/B2 bands. The housed version, HC885XF, weighs ~42 g and is enclosed in a robust, military-grade IP67 plastic enclosure. The embedded version, HC885EXF, weighs ~8 g and is easily mounted with an embedded helical mounting ring.
Sets performance benchmarks for harsh environments
Photo: Analog Devices
The AD9213S-CSH is a highly integrated RF analog-to-digital converter that handles 12-bit, 10.25-giga-samples per second. It is the company’s fastest ADC available for the space environment. The AD9213-CSH enables the next generation of software-defined systems for satellite communications, radar and remote sensing. The high sample rate and integrated post-processing enable further performance gains for narrow-band applications.
Skyward has published a free ebook, Adding Drones to the Enterprise, to provide guidance on establishing a corporate drone program. According to Skyward, the most efficient and effective drone programs are the lowest risk and most compliant. Topics covered include how to present the business value of a drone operation to corporate executives; how risk managers can optimize the workflow to ensure maximum safety; best practices for risk mitigation and regulatory compliance; tips for collaborating with legal and compliance teams on a general operating manual; and how to provide full transparency to corporate stakeholders.
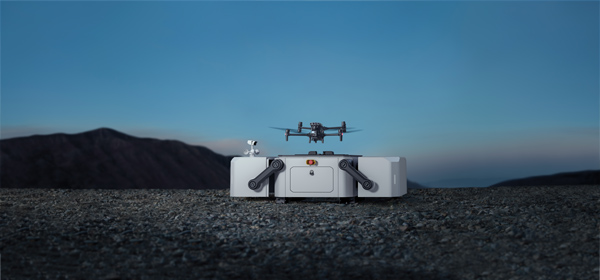
DJI’s all-in-one solution for professional drone operators includes the DJI Matrice 30 (M30) drone integrated with DJI FlightHub 2 fleet-management cloud software and DJI Dock for autonomous docking and recharging. The integrated solution is suitable for Enterprise drone users such as public safety agencies, infrastructure inspectors and energy operators. The M30 model is designed for rugged professional uses, while the fact that it fits in a backpack makes transportation and setup fast. The DJI Dock is an autonomous takeoff, landing and charging station allowing fully automatic, programmed flights with the DJI M30 Series (Dock Version). After setup, the fully charged M30 drone can take off from the dock through FlightHub 2 programmed automatic missions anywhere within a seven-kilometer radius.
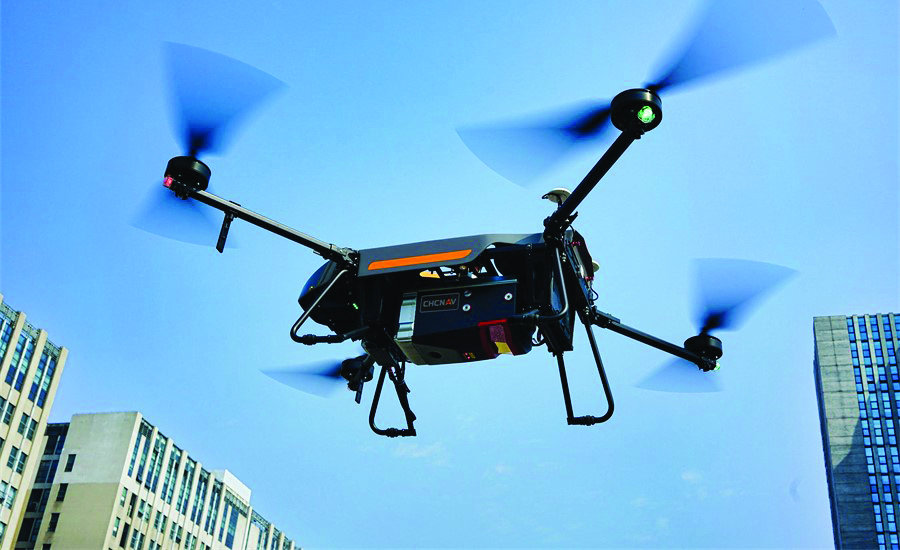
The AlphaAir 1400 (AA1400) and AlphaAir 2400 (AA2400) lidar systems are lightweight, compact airborne scanners easily installed on various UAV platforms or small survey aircraft and helicopters. They are adapted to high-density point-corridor mapping applications, day or night, under leaf-on and leaf-off conditions or with dense vegetation to provide reliable results. Combined with industrial-grade GNSS receivers and high-precision inertial measurement units (IMUs), the AA1400 and AA2400 provide 2 cm to 5 cm survey-grade accuracy. They also integrate Riegl VUX lidars with waveform-lidar technology, allowing echo digitization and online waveform processing.
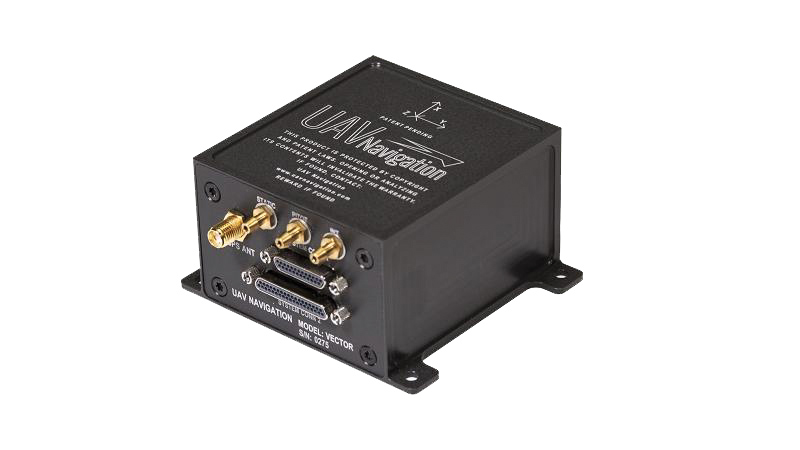
The VECTOR-600 is a robust, dependable autopilot with built-in physical and logical redundancy, allowing it to survive all individual sensor failures while maintaining accurate estimates of attitude and position. It works for fixed-wing, rotary-wing and vertical-take-off-and-landing UAVs. It provides exceptional performance in GNSS-denied environments and when there is a jamming threat. The VECTOR-600 features high quality components and an electromagnetic-resistant design tested to MIL-STD 461.
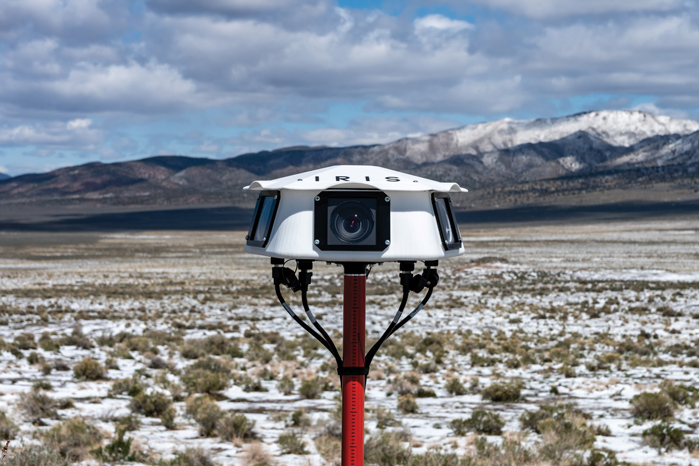
Casia G is a ground-based detect-and-avoid surveillance solution that provides 360° optical detection with alerts. It enables operators to avoid both cooperative and non-cooperative aircraft for safe beyond-visual-line-of-sight (BVLOS) flight. Casia G creates a perimeter of monitored airspace for UAVs to perform work safely, without additional payload. It is suitable for operations in fixed or temporary locations, supporting drone-in-the-box operations and augmenting or replacing human visual observers. Casia G sees the entire sky, with uniform probability and resolution, 10 times per second, covering a majority of small UAS use cases.
Colorization and immersive walkthroughs among major updates to geoSLAM solutions
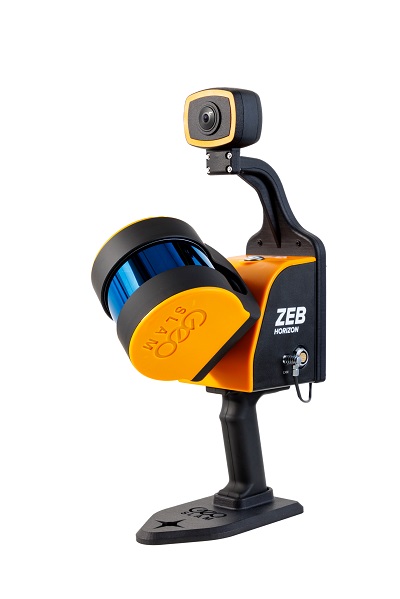
The ZEB Vision 4K panoramic camera. (Photo: GeoSLAM)
GeoSLAM has launch the ZEB Vision 4K panoramic camera, which allows users to capture and process colorized data faster than previous company products.
The company also updated its Connect software platform. Both are designed to accompany GeoSLAM’s ZEB Horizon scanner.
With easy deployment via handheld or backpack, the ZEB Vision’s 4K resolution, 360° panoramic image capture and colorization capabilities add a new perspective to visualizing a point cloud. Images are captured simultaneously during a scan, without the need to stop and take photos.
With Connect software, data captured with the ZEB Vision can be easily colorized, without the need for third-party software.
Users can achieve greater understanding and visibility of the data capture environment with an immersive walkthrough, so they don’t have to be the person capturing the data to see it clearly.
“Being able to add context to data, through colorization and image capture, is invaluable, particularly for those working in the surveying, architecture and infrastructure sectors, where the extra details can make all the difference,” said Neil Slatcher, chief product officer, GeoSLAM.
“Our customers completely own the data and images they collect at no extra cost. We are working hard to make capturing geospatial data as easy as possible, from our walk and scan method of data collection to automated workflows. Teaming the ZEB Vision with our updated Connect software will simplify this process even further.”
Besides RGB colorization, new automation options for ZEB users include:
Automatic Data Cleaning. A range of new data filters and classifiers within Connect 2.1 provides greater point-cloud clarity by removing outliers and other unwanted points such as people and vehicles.
Measuring Tool. Distances between points within any dataset can be measured for quick and accurate analysis.
Existing GeoSLAM customers with a Care subscription can freely update to Connect 2.1; any new products shipped will come with the software, providing users will full ownership of their data.
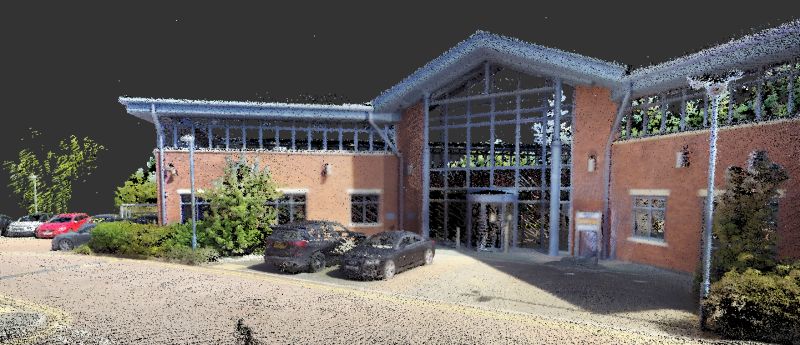
A colorization dataset of GeoSLAM’s headquarters in Nottingham, UK, captured with a ZEB Vision camera. (Image: GeoSLAM)