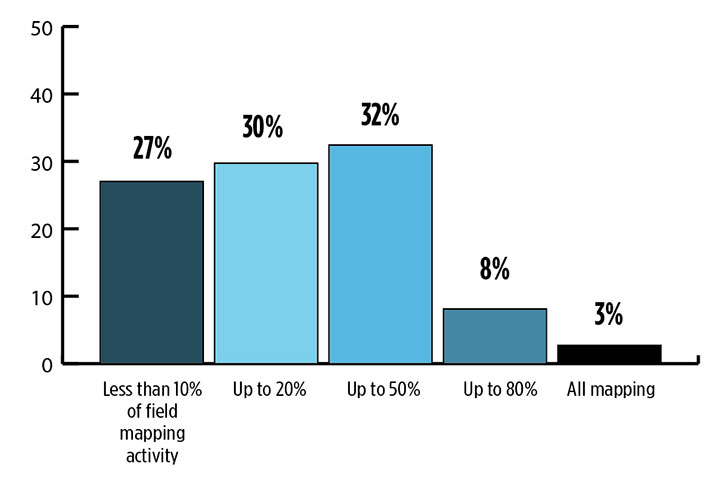
While UAVs are an exciting new technology for mapping, most respondents to our survey recognize the continued value of hands-on, in-the-field data collection.
Most respondents think UAVs could be used for as much as half of data collection, but very few expect UAVs to be used for more than that. UAVs are just one mobile collection method, of course. Others include autos such as SUVs, boats and all-terrain vehicles.
What role will UAVs play in the mapping industry over the next three years? (Source: GPS World 2018 State of the GNSS Industry survey)
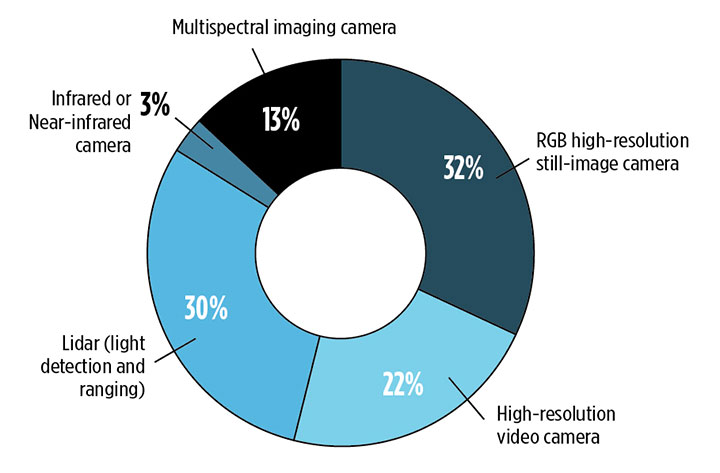
We also asked respondents how they use UAVs for data collection. RGB high-resolution still-image cameras and lidar are the most frequently used, with video cameras not far behind. Other specialty cameras collect infrared or thermal imagery, while specialty sensors collect everything from temperature to pressure and methane levels.
Whether mounted on a UAV, a vehicle, or on the ground, these technologies are used in fields as diverse as forest management, disaster response and infrastructure planning.
For instance, urban planners rely on mapping data for land value, topography and water and electricity resources. Meanwhile, forestry experts use infrared to detect areas of disease or die-off in the early stages.
Software in the Cloud. Turning to software, developments in cloud storage and open-source and subscription platforms are constantly improving geographic information systems (GIS). A wealth of GIS and GPS data is available from Google Maps, Apple Maps, OpenStreetMap and other applications. Specialty applications include Esri ArcGIS, Maptitude, Surfer and more. In the coming years, expect an increase in 3D modeling, digital elevation models (DEMs) and augmented reality.
What is the most valuable sensor to use in conjunction with GPS/GNSS aboard a UAV for mapping and data-collection purposes? What role will UAVs play in the mapping industry over the next three years? (Source: GPS World 2018 State of the GNSS Industry survey)
The automotive sector has been adopting digital mapping applications for use in self-driving cars, as well as fleet management, logistics control systems, and advanced driver assistance systems (ADAS).
Every year, more satellites are launched for mapping and GIS data collection, and they don’t all provide photo imagery. For instance, NASA’s Aqua satellite detected and mapped huge concentrations of carbon monoxide drifting east across the U.S. from western wildfires — important information for public health planning.
For more results from the 2018 State of the GNSS Industry, see this page.
Conducted online in July 2018, the GPS World State of the GNSS Industry survey compiled detailed answers to 30 key questions from 273 respondents, spread across six continents.
Prominent insights gained, and outlined in these pages: the PNT sector is booming, as opportunities outnumber obstacles; well-trained engineers are at a premium; and the Internet of Things is the newest market driver, perhaps the most powerful yet.
Laser Technology Inc. (LTI), manufacturer of professional-grade laser rangefinders, has released its improved TruPulse 360 laser, which features LTI’s TruVector 360° Compass Technology.
The rangefinder has numerous measurement capabilities. According to the company, it can measure slope distance, inclination and azimuth; instantly calculate horizontal and vertical distances; and calculate 3D missing line values.
The enhanced device offers 33 percent increased distance accuracy, 25 percent better target acquisition and a higher azimuth accuracy of 0.5° root mean squared (RMS).
“Given its limitless angle and tilt capabilities, the TruPulse 360 is extremely popular for GPS/GNSS offset mapping processes,” said Eric Miller, president of Laser Technology Inc. “The laser’s flexibility enables users to record offsets and attribute data of multiple features from a single location, making data collection quicker, easier and even safer in potentially hazardous situations.”
The new TruPulse 360 continues LTI’s mission of providing cutting-edge laser measurement solutions in an easy-to-use way, and this model represents an accumulation of more than a decade of work.
In 2007, the TruPulse 360 integrated LTI’s exclusive TruVector 360° Compass Technology, which was developed from the company’s stand-alone MapStar compass module. The combination of an integrated compass, inclinometer and distance laser gave measurement professionals the best possible azimuth accuracy — and mapping-grade precision — no matter the angle it was shot in, the company said.
Features
Photo: LTI
This latest version of the TruPulse 360, with an even more accurate electronic compass integrated into the laser, continues to deliver added value for the modern measurement professional. Uses include forestry, utilities, construction and GIS mapping.
In addition to its increased range and azimuth accuracy and Bluetooth-enabled communication, the TruPulse 360 features:
Reflectorless technology that enables data capture to any surface type;
advanced targeting modes to achieve accurate, repeatable results of the intended target;
seven-power superior optics technology that displays all measured and calculated solutions; and
Smart technology that recognizes adverse measurement conditions and prompts recalibration.
“By integrating our great compass technology into this already groundbreaking device, no other laser on the market can match the performance of the TruPulse 360,” Miller said. “And with our continuous commitment to making user-driven enhancements, the TruPulse 360 stands on its own as the best measurement and mapping laser rangefinder out there.”
A number of geospatial companies played a key role in the government’s response to the Kilauea Volcano eruption. The volcano on the Big Island of Hawaii began erupting May 3, and while quiet for more than a week, it could resume erupting at any time.
Mapping the flow. As a resident of Hawaii, Brennan O’Neill, Hawaiian branch manager of Frontier Precision, was in a unique position to offer support. Frontier Precision provided free access to technology and expertise to assist in mapping the lava flow.
“I had to help out,” O’Neill said. “It was tearing at my soul. For a geologist, it’s even more powerful than that. The lava flow is like a living mass that has a mind of its own, creeping, glowing — an upside-down conveyor belt surging forward and burning everything in its path.”
Through Frontier Precision, O’Neill offered high-tech mapping equipment, his own expertise, and the help of Nathan Stephenson, an applied geospatial engineer working in the company’s Denver office.
“We used a combination of Trimble R10s and Trimble R8s to gather accurate data points on the ground,” Stephenson said.
This thermal map shows the fissure system and lava flows as of 6 a.m. on Saturday, Aug. 11. The thermal map was constructed by stitching many overlapping oblique thermal images collected by a handheld thermal camera during a helicopter overflight of the flow field. The base is a copyrighted color satellite image (used with permission) provided by Digital Globe. (Map: USGS)
The mapping team flew UAS drones over the flow to gather visual imagery data, matched it to the ground reference points, stitched the photos together and draped it over county maps. The process was repeated as often as needed — daily, and sometimes even hourly — to show the speed and direction of the flow.
Stephenson isn’t new to mapping lava flows. As a graduate student at the University of Hawaii – Hilo, he worked on collecting data on the Pahoa eruption in 2014, and he’s seen advances in technology in just a few years.
“One thing we have now that we didn’t have in 2014 was a thermal radiometric camera that helps us map more accurately at night and enables us to capture large heat signatures.”
The collected data helps Hawaii Civil Defense and other agencies keep the public informed and safe, and in the long term it also contributes to the store of scientific knowledge about eruptions and lava flow behavior.
Lidar image of the Hawaii dataset showing the Kilauea Calderand the Halena’uma’u Crater and within it. (Image: Quantum Spatial)
Airborne lidar insights. Another technology that aids in volcano response is lidar. High-resolution lidar surveys help first responders, scientists and government agencies monitor Kilauea conditions and predict future lava flows.
Independent geospatial data firm Quantum Spatial Inc. (QSI) has conducted high-resolution lidar surveys of areas surrounding the Kilauea volcano eruption in Hawaii.
The emergency response effort was part of the U.S. Geological Survey’s (USGS) Rapid Response Imagery Products (RRIP) in support of the Kilauea’s 2018 East Rift Zone – Remote Sensing Acquisition Requirement.
The USGS Hawaiian Volcano Observatory (HVO), along with emergency responders, government agencies and academics, will use the data to better understand the conditions and characteristics of the volcano, and help planners model potential lava flows, which may better predict and respond to future flows and enhance safety of residents.
The QSI team, which included GEO1 and Windward Aviation, deployed within days to acquire high-resolution lidar at point densities averaging from 40 to 80 ppsm, with up to 150 ppsm in select areas and 100-mp digital imagery using a Riegl dual VUX-1 LR sensor pod equipped with ABGPS/IMU mounted on a Hughes 500D helicopter.
The project required 11 missions over the course of six days, operating at times as low as 500 feet above the ground and above active flows and nearby erupting calderas. With a need for a quick turn around, QSI deployed an analyst with the flight crew to post process each mission within hours of collection.
The data was uploaded to the Geospatial Repository and Data Management System (GRiD) interface, developed by the U.S. Army Corps of Engineers (USACE), where additional data products have been developed and provided to the response team that includes FEMA, Hawaii’s Emergency Operations Center (EOC) and the Hawaii County Civil Defense.
After data collection, QSI measured topographic shifts during the processing by comparing new data with a 2011 lidar collection from the same area. Survey specialists and USGS experts confirmed within hours of processing QSI’s lidar data that areas within the site had shifted up to 1.5 meters east, 2 meters to the north and 1 meter in elevation.
USGS scientists will continue to examine the new topographic data to better understand the nature of these shifts, and integrate it into lava flow models for more accurate predictive modeling.
The eruption in action. Using small unmanned aerial systems (sUAS) together with air-quality sensors, advanced imaging tools and Esri’s spatial analytics and mapping, a team from the Center for Robot-Assisted Search and Rescue (CRASAR) provided real-time aerial views of the eruption.
The five volunteers armed with drones, advanced sensor systems and GIS technologies joined the response effort May 14-19 at Kilauea Volcano Lower East Rift Zone to assist in tracking and predicting the ongoing volcanic eruption. The team supplemented the University of Hawaii Hilo’s (UHH) sUAS capabilities, allowing UHH sUAS operators to focus on geographical and volcanology.
The CRASAR team identified a new fissure not visible from the ground, projected the lava flow rate during the night when manned helicopters were not allowed to fly, and provided ongoing data collection from new thermal sensors technology.
During the six-day Leilani deployment, the CRASAR team flew 44 sUAS flights, including 16 at night, using DJI 200, 210, Inspire, and Mavic Pro drones. Esri’s Drone2Map for ArcGIS together with Hangar’s Enterprise Platform for 360-degree imaging enabled rapid 360-imaging for situational awareness.
DJI’s new XT2 thermal sensor provided unprecedented drone-based air-quality monitoring. Video and data were shared with local first responders using FirstNet, the first high-speed, nationwide wireless broadband network dedicated to public safety.
The CRASAR response marks the first known use of sUAS for emergency response to a volcanic eruption and first known use of sUAS for sampling air quality.
The GIS mapping and imaging technologies responders used on the scene at Kilauea Volcano Lower East Rift Zone are available here.
NovAtel Inc. has launched its TerraStar-C PRO correction service with multi-constellation support, including the GPS, GLONASS, Galileo and BeiDou constellations.
Combined with NovAtel’s OEM7 positioning technology, TerraStar-C PRO cuts initial convergence times by nearly 60 percent and offers 40 percent better horizontal accuracy than the current TerraStar-C service, the company said.
NovAtel’s TerraStar-C PRO offers a robust multi-constellation solution that provides greater positioning accuracy, availability and reliability than before, the company added. With the growing number of operational GNSS satellites, TerraStar-C PRO offers benefits in challenging signal conditions such as multipath, shading, interference and scintillation. High-rate TerraStar-C PRO corrections provide reconvergence in less than 60 seconds following brief GNSS signal interruptions.
According to NovAtel, TerraStar-C PRO corrections are generated using TerraStar’s proprietary global network of more than 100 strategically located GNSS reference stations. The correction data is delivered worldwide through overlapping geostationary satellites directly to a NovAtel receiver or via cellular IP network.
With OEM7 triple L-band support, TerraStar-C PRO correction signals from up to three satellites can be tracked and used simultaneously, providing continuous correction data reception when the primary satellite signal is blocked.
“TerraStar-C PRO enables higher operational efficiency by allowing users to start operations sooner and continue to work through challenging conditions without interruptions,” said Sara Masterson, NovAtel’s positioning services segment manager. “We continue to build our TerraStar portfolio of services and with the addition of TerraStar-C PRO customers can trust that they have not only a highly-reliable precise positioning solution, but also services that immediately translate to increased productivity.”
TerraStar-C PRO is available immediately as a termed subscription service for agriculture, unmanned, airborne and land applications, such as survey, mapping and GIS and supported on compatible OEM7 products with firmware version 7.05 and later.
EOMAP has released a commercial online store for global shallow-water bathymetry derived from satellite data. The store, EOStore Bathymetry, provides access to search for and request high-quality data.
According to EOMAP, satellite-derived bathymetry (SDB) is now established as a valuable tool for the surveying, planning and management of coastal and offshore sites. SDB can provide shallow-water bathymetric data worldwide without the need for a physical presence in the area of interest.
“The EOStore Bathymetry allows every coastal engineer, modeller or surveyor to rapidly access up-to-date shallow water bathymetric data,” said Knut Hartmann, COO of EOMAP. “It enables you to get the bathymetry data you need — even data you could otherwise not get — so you can plan and execute projects accurately, effectively lowering the project risk level.”
EOMAP developed the bathymetry store in response to industry feedback, the company said.
“The demand for bathymetry data in shallow waters is increasing significantly,” Hartmann said. “What industry told us at our first conference on satellite-derived bathymetry, in June 2018, was that they needed to understand the global feasibility of SDB methods and ways to search for and request the data. Thus, we’ve created the EOStore Bathymetry, which allows users to get worldwide shallow-water bathymetry data quickly and easily at a fraction of the price of traditional surveys.”
According to EOMAP, EOStore Bathymetry offers different horizontal spatial resolutions of the bathymetric grid of 2 to 15 meters. This makes it flexible and fit for purpose for surveying, as well as for but also for planning and modeling purposes, the company added.
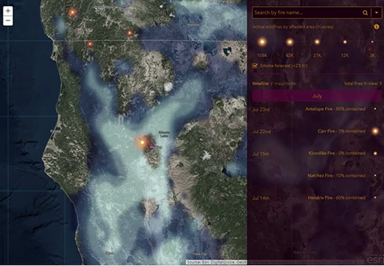
An Esri Storymap provides a quick snapshot of the raging fires across the United States and provides context to the severity of the California fires.
The interactive map can be explored by panning and zooming. Click on a fire and information about that particular fire is displayed including the start date, containment and links to the latest news and social information.
Esri Story Maps let users combine authoritative maps with text, images and multimedia content. It harnesses the power of maps and geography to tell a story in an easy and understandable format, the company said.
The Story Map uses the ArcGIS Javascript API and is linked to interactive timelines and magnitude displays. The cartography uses AGOL Firefly symbology — radial gradients — and a dark basemap.
The fires and perimeters are a service of the GeoMAC community that uses the Geospatial Multi-Agency Coordination, an internet-based mapping application that is designed for fire managers to access online maps of current fire locations and perimeters in the United States.
Members of GeoMAC include:
U.S. Geological Survey
National Interagency Fire Center
National Weather Service
Bureau of Land Management
Remote Sensing Application Center
National Geophysical Data Center.
The data is updated manually based on information from a host of sources including those on the ground. Typically, the data is fresh to about 24 hours, but there is variability because it is a carefully curated process.
Diving deeper for information
Esri has updated the app based on feedback from many different groups including firefighting professionals, those directly affected by fires, and those concerned about loved ones affected by fires. Some of the updates include the addition of the National Weather Service (NWS) animated smoke risk forecast, visualized to more directly represent smoke (see below).
The NWS animated smoke risk forecast is now integrated into Esri’s Story Map app. (Screenshot: Esri)
Another is the addition at finer scales of satellite-detected hot spots to indicate fire direction — sensors. Many Earth-observing satellites contain sensors capable of detecting the infrared energy released by fires. Not only can the hotspots be located, but areas of burned land can also be identified based both on their thermal characteristics and visible appearance. In Esri’s ArcGIS Living Atlas of the World, the MODIS Thermal Activity layer provides daily updated global hotspot locations.
In the U.S., the USA Wildfire Activity layer in the Living Atlas provides a more quality controlled version of the data. It shows only wildfires submitted to the USGS by fire agencies, as opposed to all of the other events that can cause an automated satellite-based hotspot detection. However, since this layer relies on human analysis, sometimes it doesn’t update as frequently as the MODIS hotspots. The layer also contains the perimeter of the fire area. Both current (active) and older (inactive) fires are included.
While the weather-focused satellites from NOAA and NASA provide high temporal resolution fire data, really detailed analysis of the fire impact is often left to moderate resolution multispectral imaging satellites such as Landsat 8 and Sentinel-2, or commercial high-resolution satellites. That is the benefit of the multispectral capabilities of the Sentinel-2 satellite, now available in the Living Atlas. Sentinel-2’s infrared sensitivity (Channel 12; 2.19 micron band) provides the ability to identify areas of active fires, much like NOAA-20 or Aqua/Terra, but at 20m resolution.
In addition to visualizing active fire areas, multispectral imagery is also effective at assessing burn scars. Besides the ecosystem impact, denuded vegetation along sloped areas can lead to landslides, especially when combined with heavy rains.
A roundup of recent products in the GNSS and inertial positioning industry from the August 2018 issue of GPS World magazine.
OEM
IP Solution
With multi-constellation GNSS for internet of things (IOT) devices
The Dragonfly NB2 is a highly integrated and modular IP (internet protocol) solution optimized for Cat-NB2 (3GPP Release 14 eNB-IoT) that can seamlessly be incorporated into chips and modules by the multitude of companies looking to address the large and fast-growing cellular IoT space. GNSS hardware package. For customers developing NB-IoT products that also require GNSS capabilities, Ceva-Dragonfly NB2 includes a new power-optimized GNSS hardware package, with GNSS RF receiver and multi-constellation digital front-end. The GNSS package speeds up both acquisition and tracking tasks by up to 8 times compared to Ceva-Dragonfly NB1, enabling a host of popular NB-IoT use cases, including people, livestock and asset tracking and geofencing.
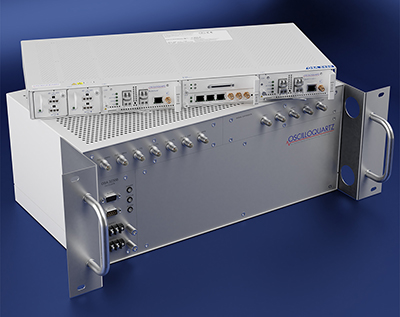
Provides timing accuracy and stability when GNSS signal is lost
Photo: Oscilloquartz
Oscilloquartz has launched its enhanced primary reference time clock (ePRTC) system to enable a high level of timing accuracy and stability, even when the GNSS signal is lost. The system provides a timing source for mission-critical transport systems, such as utility networks, government infrastructure and radio access networks, and provides the strict synchronization needed for LTE-A and 5G applications. Featuring the OSA 3230B ePRC atomic cesium clock connected to an Oscilloquartz clock combiner and grandmaster, the new solution offers the extremely stable frequency of a cesium clock with the UTC-traceable signal provided by GNSS. When combined with the OSA 5430, the OSA ePRTC system provides full hardware redundancy and multiple fan-out options including PTP over 10 Gbit/s.
The SE878Kx-A series of GPS and GNSS integrated antenna receiver modules offer high performance, maximum reliability and low power consumption for consumer and business applications. The SE878K3-A and SE878K7-A are compatible with GPS, GLONASS, Beidou and Galileo and also enable device vendors to develop quickly and cost-effectively location-based IoT solutions for use in virtually any country worldwide. The SE878Kx-A series supports dual internal-external antennas to ensure connectivity when one is broken or compromised, along with a SAW filter to maximize jamming immunity. The modules are designed for mission-critical applications and other use cases where reliability is key, such as alarms, stolen cars or high-end asset tracking. The series also provides seamless integration with Telit’s cellular modules, including eCall/ERA-GLONASS compliant solutions.
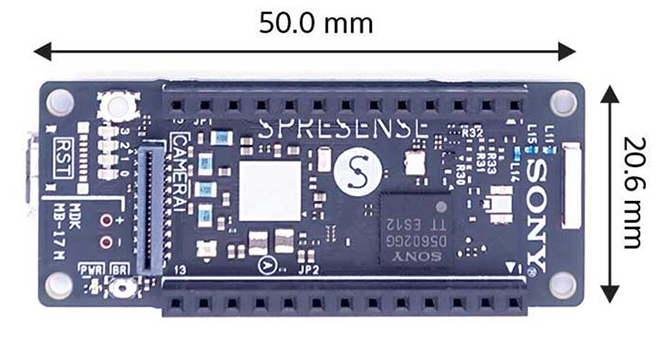
The Spresence main and extension boards are designed for internet of things (IoT) applications. The main board uses a multi-CPU structure equipped with Sony’s GNSS receiver (GPS+GLONASS) and high-resolution audio codec. A variety of systems for applications such as drones and other IoT devices can be built by combining the boards and developing the relevant applications. The boards’ software and hardware is available via open platform, allowing for a wide range of developmental possibilities. The main board can be used to control a drone using GPS positioning and a high-performance processor, voice-controlled smart speakers and low-power consumption sensing cameras. It also can be combined with sensors for use in systems that detect errors in production lines on the factory floor.
Designed for geopositioning, construction and mapping
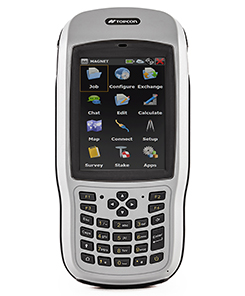
Photo: Topcon
The T-18 handheld controller has a 3.7-inch sunlight-readable display, a 1-GHz processor and 1 GB of internal storage. For field data collection using Topcon’s MAGNET software, the T-18 offers a durable ergonomic solution with fast processing, excellent connectivity and a long (10-hour) battery life. It has a 3.5G cellular modem for connectivity with Topcon MAGNET solutions for sending and receiving data to the cloud company account. The modem also can be used for real-time kinematic (RTK) correction services. Other features include Bluetooth and an IP65 rating for dust and water protection in demanding job-site conditions.
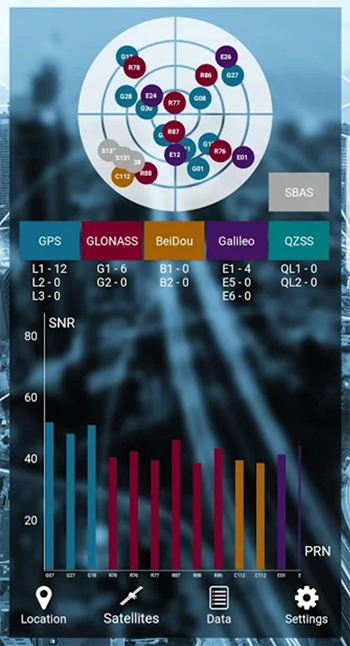
The SXblue ToolBox is an Android application for SXblue GNSS receivers, enabling users to view and analyze the position data and metadata related to its location. The user can send commands that enable or disable some features, including systems in use, mask angle or differential angle, and constellation in use, including GPS, GLONASS, Galileo, BeiDou and SBAS. The SXblue ToolBox is also an NTRIP client capable of connecting to a NTRIP server for real-time kinematic (RTK) corrections, allowing the receiver to issue very accurate location information. The application can record, save and transfer raw data from the GNSS receiver, allowing post-processing on computers for surveying and geomatics professionals.The toolbox has been developed with special consideration for modern mobile devices and attention to user and dealer feedback. It includes a series of configurable audible and visual alarms for determining the thresholds of the information provided by the SXblue GNSS receiver.
The Leica RTC360 laser scanner is equipped with edge computing technology to enable fast and accurate creation of 3D models in the field. It combines high-performance laser scanning, edge computing and mobile app technologies to preregister captured scans quickly and accurately. With the push of a button, two million points per second of high dynamic range imagery can be captured to create a full-dome scan in under two minutes. It features a visual inertial system that automatically tracks movements between setup positions. The scans captured can be combined and preregistered on a mobile device, where they can be viewed and augmented with information tags.
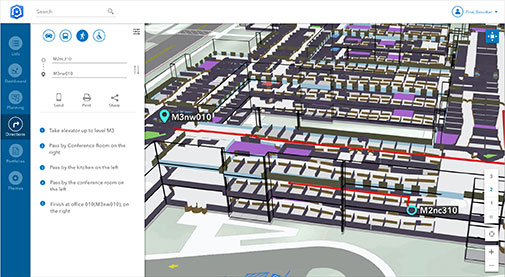
Location technology allows users to see rooms, gates and offices
Screenshot: Esri
ArcGIS Indoors is designed to enable interactive indoor mapping of corporate facilities, retail and commercial locations, airports, hospitals, event venues, universities and more. The solution applies the latest location technology to allow users to see and share where assets, rooms, departure gates and offices are located. It uses data streams, real-time processing and location intelligence tools to help businesses and other organizations understand how to better coordinate space and other resources with their facilities and campuses. Insights from sensor networks deliver real-time information to managers and executives through interactive dashboards, while visitors and employees can find useful information about the buildings they occupy. The solution also allows users to quickly access and explore critical business information, such as the location and status of fire extinguishers and their last inspection dates.
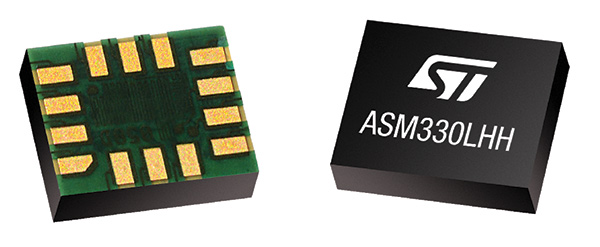
Meets demands for continuous, accurate vehicle location
The ASM330LHH module. (Photo: STMicroelectronics)
The automotive-grade ASM330LHH six-axis inertial sensor is designed for super-high-resolution motion tracking in advanced vehicle navigation and telematics applications. It lets advanced dead-reckoning algorithms calculate precise position from sensor data if satellite signals are blocked, such as in urban canyons, tunnels, covered roadways, parking garages or dense forests. Its advanced, low-noise, temperature-stable design enables dependable telematics services such as e-tolling, tele-diagnostics and e-Call assistance. Precision inertial data in six axes also meets the needs of advanced automated-driving systems. Automotive component manufacturer Magneti Marelli has selected the ASM330LHH for advanced telematics systems, to be fitted as original equipment by global automotive groups in upcoming vehicle ranges.
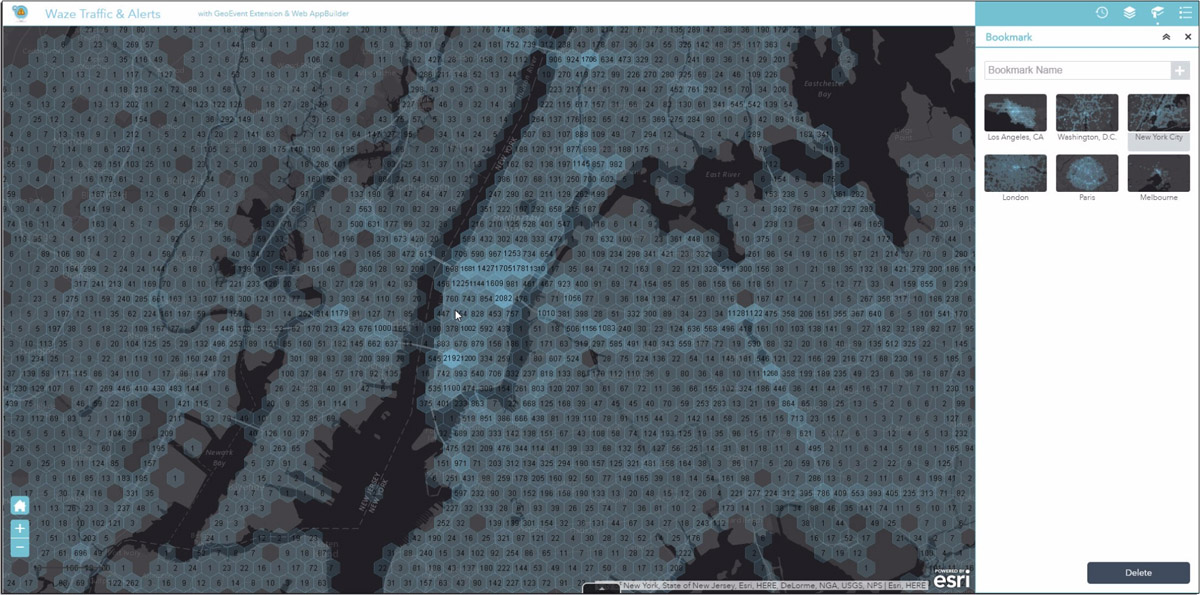
Esri and Waze smart cities partnership grows. (Image: Esri)
The free crowdsourced traffic and navigation app Waze is now fully supported by ArcGIS Online, where its live feed of mapped traffic alerts and other information, such as accidents, congestion and street damage, can be used in applications in minutes. Waze Live Alerts, available in ArcGIS Marketplace, is free to members of the Waze Connected Citizens Program. The program, a two-way sharing of publicly available traffic and road condition information, offers governments a stream of data, constantly updated in real time. This enables personnel to make data-driven infrastructure decisions and improves the efficiency of incident response.
Traffic engineers can use the data to analyze problems on the road and create targeted solutions.
Open-source platform for autonomous delivery and other iot
The AGL platform provides Mercedes-Benz Vans with the ability to create autonomous delivery robots. (Image: Daimler)
Automotive Grade Linux (AGL) is a collaborative cross-industry effort to develop an open platform for the connected car. Mercedes-Benz vans are using AGL as a foundation for a new onboard operating system for its commercial vehicles. The Mercedes-Benz “adVANce” initiative focuses on connectivity and internet of things (IoT) applications, innovative hardware solutions, new on-demand mobility and rental concepts, and fleet management solutions. The AGL platform provides Mercedes-Benz Vans with the flexibility to rapidly create tailored solutions for customers, including adding and connecting any kind of IoT component to the vehicle, such as sensors, automation controls and actuators. The new AGL-based operating system will debut on various Mercedes-Benz Vans prototype projects later this year.
eCyber is an integrated hardware-software product that protects vehicles against ransomware and other cyber-attacks. It can be installed in a vehicle by authorized parties, such as vehicle importers and fleet managers, in the aftermarket stage after the vehicle has left the factory, as well as by the OEM itself during manufacture. eCyber, a combined hardware and software solution in a compact box, is installed between the vehicle’s external communications device and the vehicle’s CAN (Controller Area Network) bus. It provides a secure gateway for outside communications to the CAN bus, allowing only communications with predefined parameters and values to go through. It blocks any unrecognized communications to and from the CAN bus, so no malicious digital communications can disrupt vehicle function.
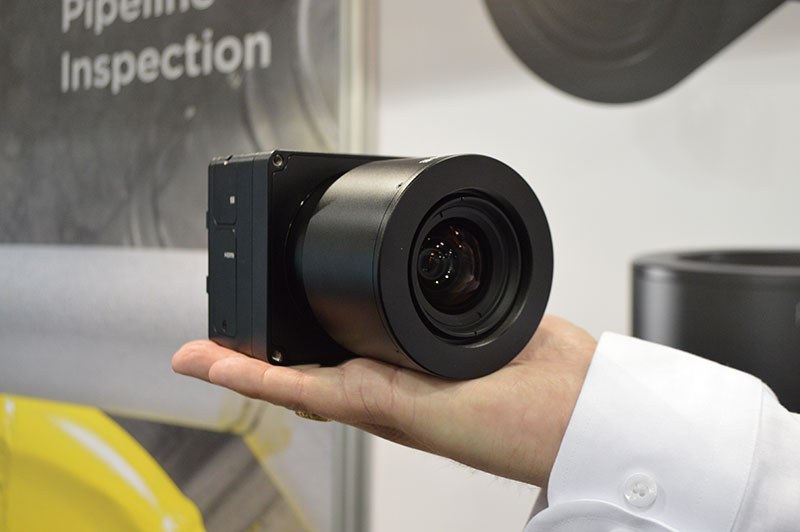
Engineered for UAV-imaging missions, the iXM 100MP is a high-productivity metric camera with a range of high-resolution lenses. It is ready for integration with various UAV platforms, including Phase One’s DJI Matrice 600 Pro. The camera incorporates a medium-format sensor with backside-illumination technology, enabling high light sensitivity and extended dynamic range. Phase One also offers four new RSM lenses — with focal lengths ranging from 35mm to 150mm — to fit the new sensor’s 3.76 μm pixel size and 33 x 44 mm frame size. The lenses are available with either fixed-focus or motorized-focus functionality. The fixed-focus 35mm and 80mm lenses are especially suitable for surveying applications.
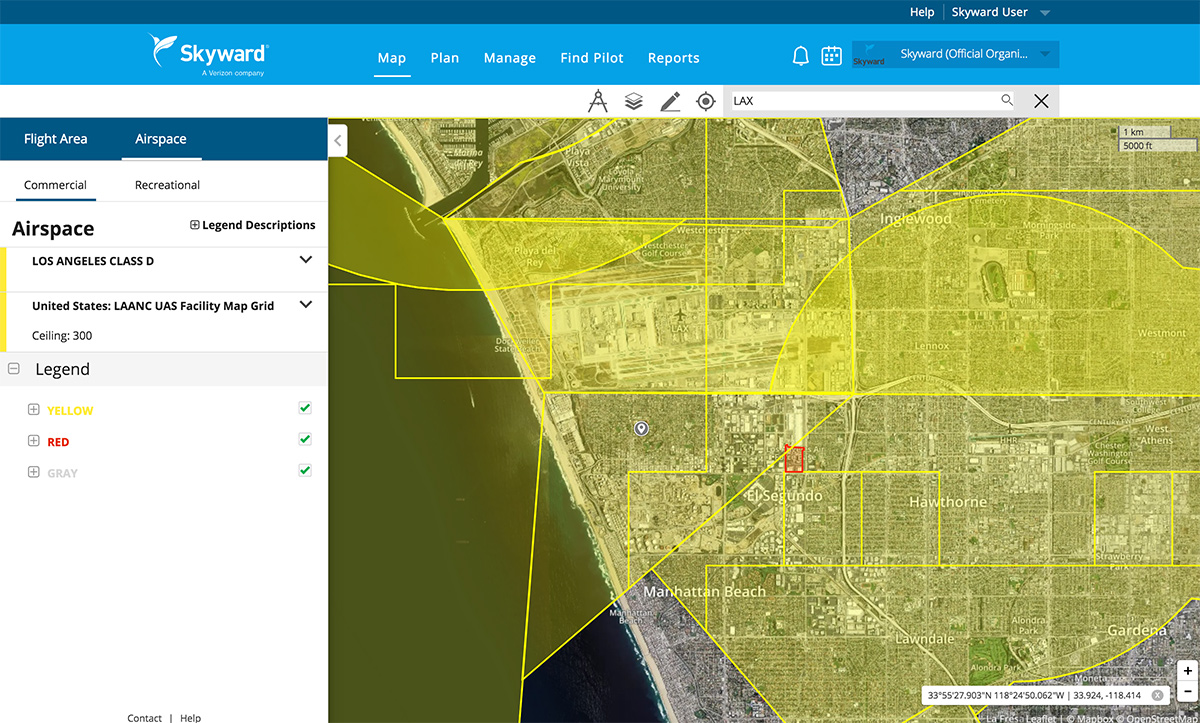
For quick approval of flights over controlled airspace
Screenshot: Skyward
Commercial drone operators in California and Hawaii — as well as a few areas in Nevada, Utah and Arizona — can get quickly authorized to fly in controlled airspace using the LAANC (Low Altitude Airspace Notification Capability) platform. Skyward is an FAA-approved airspace vendor. With Skyward, pilots with a Part 107 license can get permission to fly in regulated airspace in seconds compared to manual authorizations that can take months. This makes it significantly easier for businesses of all sizes, particularly in the construction and warehousing industries, to manage a fleet of drones to access valuable, cost-saving data. Skyward’s LAANC expansion includes airspace in the busy metro areas of Los Angeles, the Bay Area, San Diego, Las Vegas and more than 50 smaller air markets.
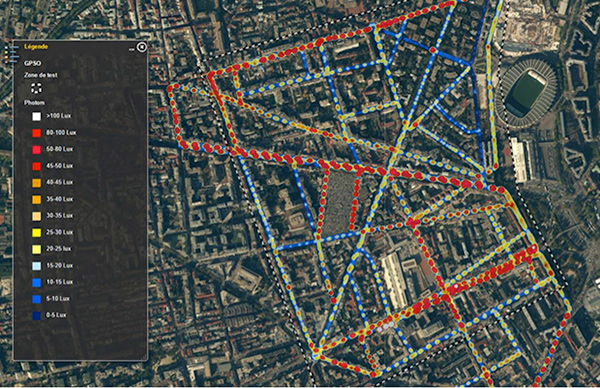
The BYes “GetYourSpace” service collects and analyzes lighting in urban environments using a GIS-based approach and the Trimble MB-TWO GNSS module.
One of the most visible services provided by cities and municipalities is the illumination of streets and public spaces. To optimize the use of public funds, cities need timely, comprehensive information on how their lighting systems are working. Operators use the data to monitor system performance and plan maintenance, repairs and upgrades.
Gathering data on street lighting is often performed manually. Technicians carrying photometers and clipboards visit individual light poles to collect information on the lighting output. The work, which must be performed at night, is slow and labor-intensive and can pose safety issues for the field technicians.
GetYourSpace debuts
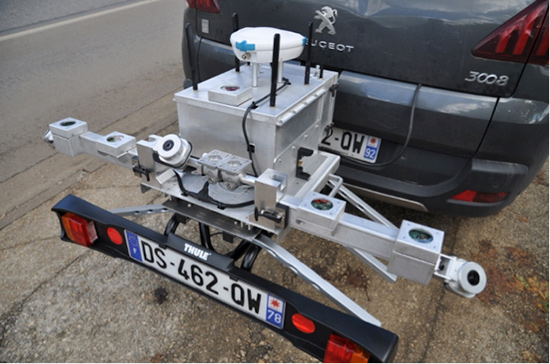
GetYourSpace platform: The white G-Nav smart antenna contains the Trimble MB-TWO GNSS module. (Photo: Trimble)
The French company Bouygues Energies & Services (BYes) provides solutions that help cities operate efficiently. The company recognized the need for a mobile, automated system to collect lighting data and produce results accessible by a variety of users.
The opportunity evolved into the BYes “GetYourSpace” service, which collects and analyzes lighting and other facets of urban environments. It uses a GIS-based approach to provide mapping and visualization functions.
BYes set out to develop a compact platform that could detect and measure sources and characteristics of light. To present information using GIS, the GetYourSpace platform needed to include reliable geolocation. BYes called on Cadden, a French developer of location systems for marine and industrial applications, to provide the positioning component for the GetYourSpace platform.
Reliable geolocation
MB-Two module by Trimble.
For the GetYourSpace collaboration, Cadden proposed a version of its G-Nav smart antenna, a product from Cadden’s GEOD brand. The G-Nav is built around a Trimble MB-TWO compact OEM GNSS module, an advanced GNSS receiver in a compact form designed for easy integration. The MB-TWO provides a range of GNSS configuration options, which allowed Cadden to produce a positioning system tailored to the BYes requirements.
The communications ability of the MB-TWO enabled Cadden to streamline the development process. The module provides multiple input/output options and can be configured and controlled using a web interface as well as a simple ASCII command set. Cadden leveraged the module’s small size and low power requirements to embed it into a compact, robust GNSS unit that combines power and data into a single connection.
High-speed data collection
Heat map of lighting data collected by GetYourSpace. Accurate geolocation is essential to producing easy-to-use results. (Image: BYes, Trimble)
Cadden’s implementation of Trimble GNSS provided key enabling technology for GetYourSpace. With an area of 1 square meter, the mobile platform includes the GNSS, light and environmental sensors, system controller and data logging.
The MB-TWO rapid update rate (up to 50 Hz) enables the GetYourSpace platform to capture accurate information even while moving at high speed. The low-power, lightweight platform can be mounted on a small car or towed behind a bicycle and requires minimal interaction with the operator or driver.
A voter enters a polling place. (Image: iStock.com/YinYang)
With the mid-term elections coming ever nearer, states are turning to geographic information systems (GIS) to help manage them.
Digital geographic representation of precinct boundaries within a GIS allow for transparency and ease of use for voters, candidates and electoral management, according to the National States Geographic Information Council (NSGIC).
GIS also enables the optimal siting of polling places for both voter access and the cost efficiency of operating polls.
Finally, GIS provides a platform for automated quality-control processes that ensure accurate voter precinct assignments.
“An electoral system with integrity — enhanced by accurate, authoritative geographic data and presented clearly and transparently — has never been more important,” said NSGIC President Andy Rowan.
Why GIS is an improvement over address files
NSGIC’s Geo-Enabled Elections project brings together geographic information systems (GIS) leaders in state government, local elections officials and state elections offices, national GIS and elections organizations, and federal partners to identify opportunities to integrate GIS into elections systems across the country.
The overall goal is to strengthen elections management and citizen engagement. The project aims to provide the impetus for replacing non-spatial “address file” tables with the visual and analytical advantages of election precinct and voter data in a natively GIS format.
Geo-enabled elections overcome the four fundamental challenges with the existing address list approach to precinct management, according to Rowan.
In the address list approach, Rowan said,
No actual boundaries are stored explicitly in the systems,
Quality control is difficult without a method to visualize precinct assignment using aerial photography and boundary information that can change frequently,
There is no efficient method for applying large-scale precinct boundary updates, and
The process is usually not aligned efficiently with other state and local address or boundary-management processes.
To this end, the project conducted a nationwide survey on elections data in the first half of this year. More than two-thirds of states responded.
Here are key takeaways from the baseline survey.
Addresses
The survey found that 55 percent of responding states confirm voter registration addresses against a database of known addresses such as a driver’s license or state ID database, a statewide point address set, a master address database used for 911 call routing, or a commercially available address database.
“The results indicate a need to advocate for coordination between state agencies (such as the state elections department and the department of motor vehicles) and encourage integration of the voting system and other systems,” said Jamie Chesser, the Geo-Enabled Elections project manager.
Election Precincts
More than half of responding states indicated they maintain statewide mapping of precincts. Within this group, 40 percent also maintain a layer of sub-precincts in digital mapping systems.
“There remains a need to develop local precinct data content and procedural standards to examine the relationship between precincts, local and state boundaries, and residential structures,” Chesser said.
Other Data
In all, 82 percent of states keep up-to-date spatial data of city and county boundaries, which is essential for computer-based mapping of precincts.
“Statewide spatial data — especially city, county, school, and special district boundaries – are essential to mapping precinct boundaries across the state,” Chesser said. “The survey reflected, however, that accuracy of current city and county boundary mapping varies
considerably.”
A substantial majority, 79 percent of respondents, confirm their mapping of state-level district-based elected offices are accessible online in a digital mapping format.
Survey responses were coordinated by state government representatives who focus on the development and deployment of mapping data and systems across state agencies and local governments.
Later this year, NSGIC will release the results of a study probing the spatial approach to elections management from the perspective of state elections officials.
The two-year Geo-Enabled Elections project, underwritten by the bipartisan Democracy Fund Voice, convenes a wide variety of stakeholders to explore ways geographic information systems and related processes can enhance elections management and citizen engagement across the U.S.
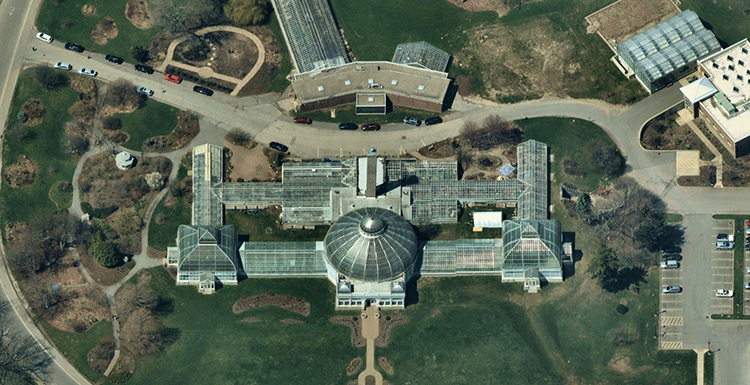
A capture of the Buffalo and Erie County Botanical Gardens in Buffalo, New York, taken in May 2018. (Image: Nearmap)
Fresh off an eye-grabbing appearance showcasing its new 3D products at last week’s Esri User Conference, Nearmap will deliver a free “Cooking with GIS” webinar Thursday, July 26.
The hour-long session will highlight ways that the company’s vertical, oblique and 3D aerial imagery can bring competitive advantage to surveyors, construction managers, telecomm engineers, city planners, realtors and investors, building contractors, property and natural resource managers, and many others. Using their geographic information systems (GIS) skills, these professionals can perform deep analysis and make decisions with confidence using detailed and up-to-date visual insights.
Nearmap won 2017 Esri’s Best New Content Partner Award in 2017, and the free webinar, subtitled “Esri + Nearmap,” focuses on the key advantages of seamlessly integration the company’s high-resolution aerial imagery into Esri mapping and software products.
Esri is an international supplier of geospatial information systems with more than one million users in 200 countries around the world. Nearmap’s ArcGIS Image Service Online provides users an easy and efficient way to incorporate high-resolution PhotoMaps within Esri ArcGIS Online. ArcGIS users can instantly access current 2.8” imagery within days of capture while also showing change over time using Nearmap’s historical archive.
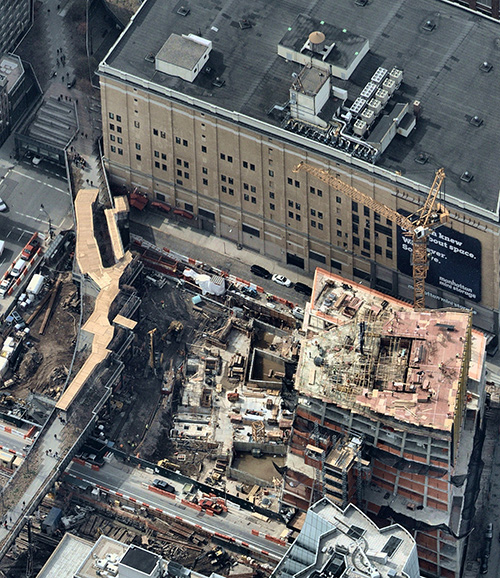
A New York City building site with temporary covered pedestrian walkway. (Photo: Nearmap)
As an integral partner in the ArcGIS ecosystem, Nearmap helped integrate their imagery with a wide range of Esri software solutions—both off the shelf and bespoke. Coupled with Portal for ArcGIS, the Nearmap ImageServer can be used in any application that is able to talk to ArcGIS Server, delivering power to the platform.
3D. Nearmap recently brought dramatic change to the aerial imagery market, announcing a national survey program providing high-resolution oblique imagery and derivative 3D products from its patented HyperCamera2 technology. The new camera system provides a high degree of overlap from different angles, so Nearmap can reconstruct the real world in detail, producing not only high-resolution orthomosaic and oblique imagery, but also surface and terrain models, natural color point clouds and textured 3-D meshes.
Users can immerse themselves in 3D textured mesh models, improving analysis and design activities. They can see different elevations and line of sight using the 3-D information. These features become important in many use cases, including airport or utility planning, or to determine the best location for a crane before a construction project.
Other applications include wireless telecommunications network modeling, solar panel design, tactical resource deployment, real estate development promotion, property valuation, insurance underwriting and smart cities.
Delivery. Nearmap is delivered through a user-friendly interface called MapBrowser or accessed via Esri, Autodesk and other third-party solutions.
Nearmap captures urban U.S. imagery multiple times per year, processes massive amounts of visual data, and uploads up-to-date aerial maps to the cloud within days. Patented imaging and processing technology delivery at speed of high-resolution aerial imagery as a service: orthographic (vertical) maps, multi-perspective panoramas and oblique aerial views.
The fully cloud-based PhotoMaps are accessible instantly via desktop and mobile, with 70% of the U.S. covered in major metros.
Clarity, color and 2.8″ GSD detail help users identify and accurately measure ground features with ease, detect change over time or monitor progress through the company’s library of precisely georeferenced historical imagery.
Nearmap imagery is refreshed up to three times per year principal coverage areas, with three orthomosaic captures incorporating one oblique capture. Nearmap’s orthomosaic imagery already covers nearly 70 percent of the U.S. population dating back to 2014.
Speakers on the July 26 webinar include Kevin Kwok, Nearmap technical product manager; Chuck Dostal, Nearmap geospatial technical engineer; and customer Mike Otillio, director of research for Colliers International, servicing the commercial real estate industry.
From left: Esri Program Manager Doug Morgenthaler, Laser Technology Sr. Product Manger Derrick Reish and Eos CTO Jean-Yves Lauture. (Photo: Eos Positioning)
The three-way partnership will enable field crews to collect centimeter-accurate 3D data in GNSS-impaired environments.
When combined with Laser Technology Inc.’s (LTI’s) laser rangefinders, the solution will allow field crews to capture centimeter-accurate 3D locations of hard-to-reach assets and in GNSS-impaired environments.
“By combining the high-accuracy of the Eos Arrow Series GNSS receivers and the laser capabilities of LTI, we can empower field crews to capture highly accurate XYZ coordinates from a safe distance,” LTI Senior Product Manager Derrick Reish said. “This eliminates the need for physically occupying every point. It also provides more accurate location data, with a more affordable mobile asset-management workflows.”
The Arrow Gold. (Photo: Eos Positioning)
The solution has been in the works for months, as demand has grown for hard-to-reach, high-accuracy mapping within the Collector workflow.
“Eos is extremely grateful to be a part of this initial release in high-accuracy asset location data with LTI’s laser rangefinders and Esri’s Collector mobile app,” Eos CTO Jean-Yves Lauture said. “Enabling this kind of accuracy means even the most budget-conscious field crews will be able to access the location of their hard-to-reach assets.”
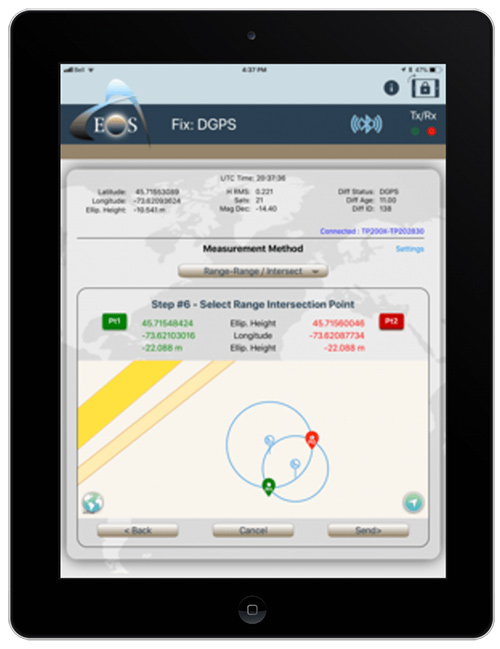
All three teams have been working closely to ensure a seamless integration with Collector and ArcGIS Online. When using an LTI laser rangefinder and an Eos Arrow Series receiver with Collector, a field worker can easily shoot, capture and share high-accuracy 3D location data that is streamed into ArcGIS Online in real-time.
Image: Eos Positioning
The solution is expected to be particularly useful in urban corridors, highway settings, forested (or wetlands) areas, and other areas where assets are hard or dangerous to occupy. This will both increase accuracy and efficiency, as well as decrease safety liabilities in dangerous situations, the companies said.
“Esri is extremely pleased that Collector can now support the capture of high-accuracy asset locations from afar, leveraging our unique partnership with both Eos and LTI,” Esri Product Manager Jeff Shaner said. “This is a game changer for asset management.”
Prior to this release, field crews challenged with capturing high-accuracy 3D locations for hard-to-reach assets would need to use a total station with a different software workflow and then mesh the data back in the office, a clumsy and inefficient workflow requiring lots of additional training and expertise. With the new workflow, field crews can operate in GNSS-impaired environments at a high-accuracy level without leaving the Collector/AGOL environment, creating a highly efficient workflow.
The solution has been designed to provide several offset-mapping methods.
“The implementation of several measurement methods gives users the freedom of choice, so they can pick the right laser option which meets their accuracy needs,” Reish said.
Eos will unveil its offset measurement solution for Collector at the upcoming Esri User Conference in San Diego. For a field demonstration of how the solution works, attendees can visit Eos at booth #1019 during the conference, and attend the session “LaserGIS for Everyone: How to Combat Costly and Tedious Data Collection Workflows” at 10 a.m. on Wednesday.
 Most respondents think UAVs could be used for as much as half of data collection, but very few expect UAVs to be used for more than that. UAVs are just one mobile collection method, of course. Others include autos such as SUVs, boats and all-terrain vehicles.