Using live data from USGS and Waze, a new Esri interactive map visualizes active wildfire locations and traffic alerts for Northern California.
The map incorporates a new mapping technique to group traffic alerts at locations where there is a high density of alerts. This method enables faster and more effective visual analysis in areas where there are many alerts that would normally overlap. Zoom in on the map to reveal the latest individual traffic alerts.
Active fire data displays the locations of large fire incidents in Northern California. Data is provided by the U.S. Department of Agriculture Forest Service and The Geospatial Multi-Agency Coordination Group, and is intended to give near real-time understanding of the situation on the ground.
Location and status of active fires is updated throughout the day as new information is gathered by first responders.
Data from Waze is reported by users of Waze and updated every 2 minutes. This data, provided by Waze through the Connected Citizens Program, contains filtered data for affected area including system-generated traffic jams and user-reported traffic incidents (including jams, accidents, hazards, construction, potholes, roadkill, stopped vehicles, objects on road, and missing signs).
Old Faithful is Yellowstone National Park’s most famous landmark. Millions of visitors come to the park every year to see the geyser erupt every 44 to 125 minutes. But despite Old Faithful’s fame, relatively little was known about the geologic anatomy of the structure and the fluid pathways that fuel the geyser below the surface. Until now.
University of Utah scientists have mapped the near-surface geology around Old Faithful, revealing the reservoir of heated water that feeds the geyser’s surface vent and how the ground shaking behaves in between eruptions. The map was made possible by a dense network of portable seismographs and by new seismic analysis techniques. The results are published in Geophysical Research Letters. Doctoral student Sin-Mei Wu is the first author.
For Robert Smith, a long-time Yellowstone researcher and distinguished research professor of geology and geophysics, the study is the culmination of more than a decade of planning and comes as he celebrates his 60th year working in America’s first national park.
“Here’s the iconic geyser of Yellowstone,” Smith says. “It’s known around the world, but the complete geologic plumbing of Yellowstone’s Upper Geyser Basin has not been mapped nor have we studied how the timing of eruptions is related to precursor ground tremors before eruptions.”
A portable seismometer used to map the geology beneath Old Faithful. (Photo: Paul Gabrielsen)
Small seismometers
Old Faithful is an iconic example of a hydrothermal feature, and particularly of the features in Yellowstone National Park, which is underlain by two active magma reservoirs at depths of 5 to 40 km depth that provide heat to the overlying near-surface groundwater. In some places within Yellowstone, the hot water manifests itself in pools and springs. In others, it takes the form of explosive geysers.
Dozens of structures surround Old Faithful, including hotels, a gift shop and a visitor’s center. Some of these buildings, the Park Service has found, are built over thermal features that result in excessive heat beneath the built environment. As part of their plan to manage the Old Faithful area, the Park Service asked University of Utah scientists to conduct a geologic survey of the area around the geyser.
For years, study co-authors Jamie Farrell and Fan-Chi Lin, along with Smith, have worked to characterize the magma reservoirs deep beneath Yellowstone. Although geologists can use seismic data from large earthquakes to see features deep in the earth, the shallow subsurface geology of the park has remained a mystery, because mapping it out would require capturing everyday miniature ground movement and seismic energy on a much smaller scale. “We try to use continuous ground shaking produced by humans, cars, wind, water and Yellowstone’s hydrothermal boilings and convert it into our signal,” Lin says. “We can extract a useful signal from the ambient background ground vibration.”
To date, the University of Utah has placed 30 permanent seismometers around the park to record ground shaking and monitor for earthquakes and volcanic events. The cost of these seismometers, however, can easily exceed $10,000. Small seismometers, developed by FairfieldNodal for the oil and gas industry, reduce the cost to less than $2,000 per unit. They’re small white canisters about six inches high and are totally autonomous and self-contained. “You just take it out and stick it in the ground,” Smith says.
In 2015, with the new instruments, the Utah team deployed 133 seismometers in the Old Faithful and Geyser Hill areas for a two-week campaign.
The sensors picked up bursts of intense seismic tremors around Old Faithful, about 60 minutes long, separated by about 30 minutes of quiet. When Farrell presents these patterns, he often asks audiences at what point they think the eruption of Old Faithful takes place. Surprisingly, it’s not at the peak of shaking. It’s at the end, just before everything goes quiet again.
After an eruption, the geyser’s reservoir fills again with hot water, Farrell explains. “As that cavity fills up, you have a lot of hot pressurized bubbles,” he says. “When they come up, they cool off really rapidly and they collapse and implode.” The energy released by those implosions causes the tremors leading up to an eruption.
One scientist’s noise is another scientist’s signal
Typically, researchers create a seismic signal using an active source, such as swinging a hammer onto a metal plate on the ground or setting off an explosion. Lin and Wu developed the data analysis method that would help find useful signals among the seismic noise without disturbing the sensitive environment in the Upper Geyser Basin. Wu says she was able to use the hydrothermal features themselves as a seismic source, to study how seismic energy propagates by correlating signals recorded at the sensor close to a persistent source to other sensors. “It’s amazing that you can use the hydrothermal source to image the structure here,” she says.
The model of Old Faithful’s hydrogeological system suggested by the study’s results. (Image: Sin-Mei Wu)
When analyzing data from the seismic sensors, the researchers noticed that tremor signals from Old Faithful were not reaching the western boardwalk. Seismic waves extracted from another hydrothermal feature in the north slowed down and scattered significantly in nearly the same area suggesting somewhere west of Old Faithful was an underground feature that affects the seismic waves in an anomalous way. With a dense network of seismometers, the team could determine the shape, size, and location of the feature, which they believe is Old Faithful’s hydrothermal reservoir.
Wu estimates that the reservoir, a network of cracks and fractures through which water flows, has a diameter of around 200 meters, a little larger than the University of Utah’s Rice-Eccles Stadium, and can hold approximately 300,000 cubic meters of water, or more than 79 million gallons. By comparison, each eruption of Old Faithful releases around 30 m3 of water, or nearly 8,000 gallons. “Although it’s a rough estimation, we were surprised that it was so large,” Wu says.
Further work
The team is far from done answering questions about Yellowstone. They returned for another seismic survey in November 2016 and are planning their 2017 deployment, to begin after the park roads close for the winter. Wu is looking at how subsurface structure and hence the propagation of seismic waves can change with time. Farrell is using the team’s seismic data to produce even higher resolution subsurface images and predict how earthquake waves might reverberate through the region.
Smith is looking forward to conducting similar analysis in Norris Geyser Basin, the hottest geothermal area of the park. Lin says that the University of Utah’s research program in Yellowstone owes much to Smith’s decades-long relationship with the park, enabling new discoveries. “You need new techniques,” Lin says, “but also those long-term relationships.”
The full study can be found here. The research was funded by the National Science Foundation and by King Abdullah University of Science and Technology, the Brinson Foundation and the Carrico Fund. Fan-Chi Lin is the Principal Investigator.
Paul Gabrielsen is a science writer at University of Utah Communications.
Members of the public often turn to GPS World and Geospatial Solutions for help when their personal device gives them incorrect mapping information.
GPS.gov has set up a page that points users to the correct place to report problems, by walking them through a series of steps.
As our readers know, the problem isn’t with the satellites, but in the mapping software used by the devices and apps. Links are provided to mapping companies Google, Waze, TomTom, HERE, OpenStreetMap, Garmin and Apple.
Drones are quickly becoming a staple of the maritime industry. In January, the European Maritime Safety Agency (EMSA) issued the largest ever civilian maritime drone contact, valued at €67 million.
Under the contract, drones will be used to assist with border control, search-and-rescue operations and monitoring of pollution, as well as the detection of illegal fishing and drug and people trafficking.
External Vessel Inspections. Big names in the maritime industry such as DNV-GL, Lloyds Register and Maersk have all shown strategic intent to revolutionize their operations by embracing drone technology, and many maritime operators are now following suit.
All ship owners know that traditional methods of external vessel inspection can be a costly affair. Now that high-definition, camera-equipped drones are widely available and affordable, it is becoming more common to use them for external vessel inspections to assess structural conditions. Identifying substantial corrosion, significant deformation, fractures, damage or other structural deterioration can be done quickly, easily and cost-effectively using drones.
Tank Inspections. The visual inspection of cargo tanks was traditionally performed by workers suspended on ropes to inspect the tank structure. The sheer size of modern-day vessels means that access methods including staging, rafting and climbing are often used by surveyors to access tanks.
In contrast, drone surveys require no human access to the tank and, since no access equipment is required, there are no setup costs, and inspections can be completed within a quicker timeframe.
Martek Marine’s V-200 UAS. (Photo: Martek Marine)
Bathymetric Surveys. Accurate and reliable information on the features of water bodies and their shorelines is vital to navigational safety. Bathymetric surveys gather the information, which is then published for use on nautical charts. Rather than using a fixed-wing airplane or helicopter, bathymetric sensors developed for drones allow this type of survey to be carried out flexibly and at a fraction of the cost.
To operate effectively in the harsh maritime environment, the technology has been developed to withstand storm force wind and heavy rain, snow and salt spray.
As technology advances, so does the flight time available on drones, meaning more area can be covered in a quicker timeframe.
Floating Flare-Tip Inspections. Drone surveys typically exist to provide close visual and thermal inspections of high, live or difficult to access structures offshore, and there’s nothing more challenging to access than a flare tip, 70 meters above water, on a floating production facility.
Drone survey inspections for flare tips remove the need for a shutdown to inspect the flare and offer reduced costs compared to aerial surveys carried out by helicopter or plane.
Offshore Wind Energy. The wind energy sector is growing fast. Storm force winds, erosion, lightning strikes and even build-up of insects can have an impact on turbines, and blades need to be inspected for deterioration. Inspectors have traditionally had to scale the turbines with the help of ropes and cables.
The maritime surveying company Martek Marine uses a drone fleet designed for turbine-blade inspections onshore or offshore. Qualified and trained pilots quickly and accurately identify and assess faults.
Traditional surveying requires turbines to be offline for two hours up to a day, but Martek’s inspection process reduces this time to 45 minutes.
Following the inspection, the client can access the data through Martek’s secure, cloud-based asset management portal where they can download a detailed PDF report and access raw survey data.
Fully Autonomous Drones? Fully autonomous drones could be the next big thing for maritime surveying. The drones can be pre-loaded with a 3D model of the ship. This allows the drone to autonomously work its way around the vessel, stopping at points of interest to obtain detailed video or image data.
Advancing this further, a drone could be designed to create its own 3D map of the vessel before carrying out the survey independently.
This article is excerpted from a blog by Martek Marine, a UK-based maritime surveying company. Read the full blog, with more details and examples.
After two decades of providing the U.S. government with Geiger-mode lidar data, Harris Corporation offers high-resolution lidar data and its derived products to commercial organizations.
The data can be used for land-use planning and management, transmission-line monitoring, pipeline design and maintenance, transportation engineering and planning, urban modeling, asset management and forestry analytics.
Geiger-mode lidar offers the most accurate elevation data available, according to Harris Corporation, the only provider of Geiger-mode lidar data.
According to the company, the sensor allows for collections on a large scale, while also collecting data up to 10 times faster and at 10 times the resolution of existing linear lidar sensors.
Geiger-mode lidar provides multi-angle illumination that penetrates foliage, removes shadows and and eliminates voids.
We’ve heard a lot in the news recently about GPS spoofing, mostly centred on the story of ship spoofing in the Black Sea. Between June 22-24, a number of ships in the Black Sea reported anomalies with their GPS-derived position, and found themselves apparently located at an airport.
What happened is open to educated conjecture. In this column, I’ll briefly cover the history of spoofing, its basic techniques, some spoofing tests that we conducted, and then return to the infamous Black Sea incident.
As part of my day-to-day work in navigation warfare, I do a fair amount of work in defensive anti-spoofing. Naturally, in order to test anti-spoof technology, it is necessary to also perform spoofing. It’s a delicate subject and, as with any topic involving defense or national security or critical infrastructure, there’s a balance to strike between responsible disclosure, how much information is released into the public domain, and so on.
In this article, I will stick firmly to information available in the public domain, lest I be accused of proliferating the threat, but this still gives us enough material to tiptoe around the subject for the benefit of our readers. I could have included more details about the spoofing attacks, but was advised to hold some back — it makes governments nervous. You can read some of the background in an excellent article by Norwegian broadcaster NRK and a Resilient Navigation and Timing Foundation press release. Similar GPS anomalies still continue to occur at various locations.
Let’s start with basic spoofing background, and we’ll return to the Black Sea incident at the end of the article.
A brief history of spoofing
Spoofing isn’t a new threat — it’s been around for decades. But only in recent years has it received so much public attention. As with jamming and anti-jamming technology, and most other topics in the GPS domain, spoofing finds its roots back in the days of Cold War radar. In those times, it was often known as “deception jamming,” where you would transmit fake radar returns to paint an incorrect picture on your adversary’s radar screen.
When GPS came along, it was understood at the time that the C/A code would be vulnerable to spoofing. It’s an open code, so anyone is free to reproduce it. That is, after all, what a GPS simulator is: a GPS spoofer. We legitimately test our GPS receivers by fooling them with fake signals from a GPS simulator.
Of course, this is precisely why legacy GPS satellites also transmit the military P(Y)-code, and continue to do so. The P-code offers improved accuracy, and some other benefits, but more importantly, it is modulated with the W encryption sequence to give us the encrypted P(Y)-code. Ever since the anti-spoofing module was set to the “on” state, unless you have the key, you are unable to directly spoof the P(Y)-code. (You can still perform a meaconing attack, though, where you simply record the transmitted satellite signals and retransmit them again. Although this kind of attack can’t be used to impose a particular scenario on a GPS receiver, it might still cause havoc in unwary receivers).
So. in the early days it can be argued that the spoofing threat was solved. It wasn’t until GPS became ubiquitous in the commercial and civilian domain that spoofing really raised its head again. The fact that the vast majority of GPS receivers in the world relied solely on the unencrypted C/A code became a cause for concern — especially where those GPS receivers were essential to critical infrastructure.
The threat of GPS spoofing was discussed at many conferences and behind many closed doors and, although most people agreed that spoofing was a theoretical threat, some people argued that in reality it was “simply too hard” to conduct a realistic spoofing attack. And therefore we should not worry ourselves about it.
It wasn’t until a couple of high-profile demonstrations were carried out by the University of Texas Radionavigation Laboratory that spoofing became front-page news once again. In 2012, the lab staff carried out an exercise at White Sands Missile Range where a GPS-guided drone was spoofed from a distance. The drone was fooled into thinking its altitude was increasing, causing it to compensate by dropping straight down. Then in 2013, the same team demonstrated how an $80 million yacht could be steered off course by means of a spoofing attack.
These exercises publicly demonstrated that spoofing was indeed a real threat, and could be done. But many people still believed that it was very hard to build the complex equipment necessary to perform the attack, and thus spoofing was out of reach for most potential criminals or terrorists.
Fast forward another two or three years, to when a new mobile phone game appeared. Pokemon GO became the game craze of the moment, where players would travel around the country with their phones, getting points by collecting creatures in an augmented reality world. It didn’t take long for people to dream up new ways of earning points in the game, without having to go to the effort of traveling around the world.
What if you could make your phone think it was somewhere else, without ever having to leave your bedroom? And thus, bizarrely, it was a mobile phone game that brought GPS spoofing into the mainstream.
The rise of the low-cost software-defined radio (SDR) has enabled “spoofing for everyone.” Today, the tool of choice for the casual user is often the HackRF or bladeRF. Couple small SDRs that cost around $200 with open-source GPS simulation software, and you have a basic spoofer. Plenty of websites detail how to perform basic spoofing, and at hacker gatherings, people can present how they spoofed a drone. These may not be the most sophisticated setups, but it’s good enough to do the job in many cases. With a better setup, which I won’t describe here, it’s possible to achieve a much more realistic attack, which will fool even the most shrewd and wary GPS receivers.
Spoofing basics
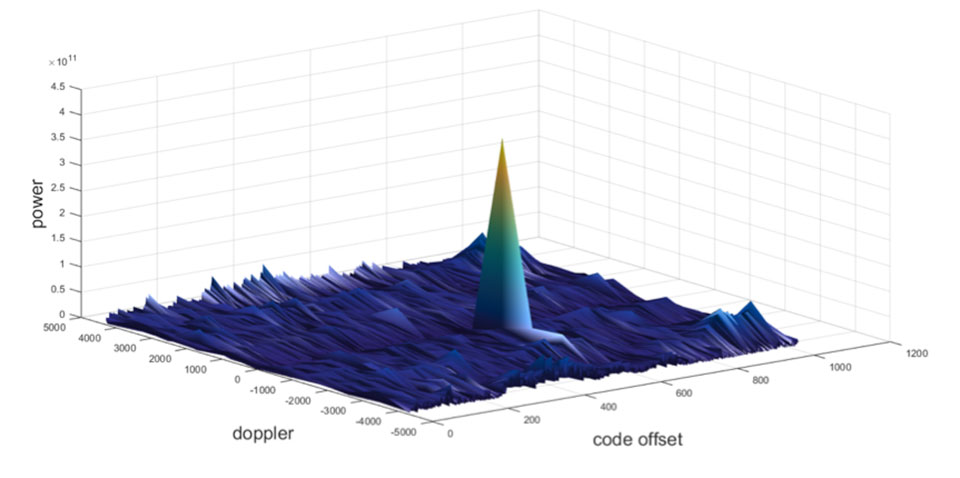
Let’s take a quick look at what it means to spoof GPS. A receiver searches for a satellite over a two-dimensional surface to find a correlation peak, and it must examine a range of Doppler frequencies and code offsets. An example is shown in Figure 1. Once the receiver finds the peak, the satellite is acquired, and it will then track the satellite as it moves and can demodulate the navigation data message.
When a spoofer comes along, it tries to recreate this peak. By doing so, and usually with little more power than the real satellites, the receiver will begin to track the spoofed signal. Once the spoofed signal is being tracked, the spoofer can begin to manipulate reality by slowly modifying the properties of the signal.
Figure 1. GPS correlation surface. (Image: Michael Jones)
A poor spoofer doesn’t always align itself very well with reality, which essentially creates a second peak on the correlation surface. But a gullible receiver can still be fooled by this, and may lock on to false peaks.
The reality of spoofing and anti-spoofing
To understand the reality of spoofing and anti-spoofing, we carried out outdoor experiments at one of the Roke Manor trials areas (thanks go to my colleague Mike Wells for letting me use some of his results here).
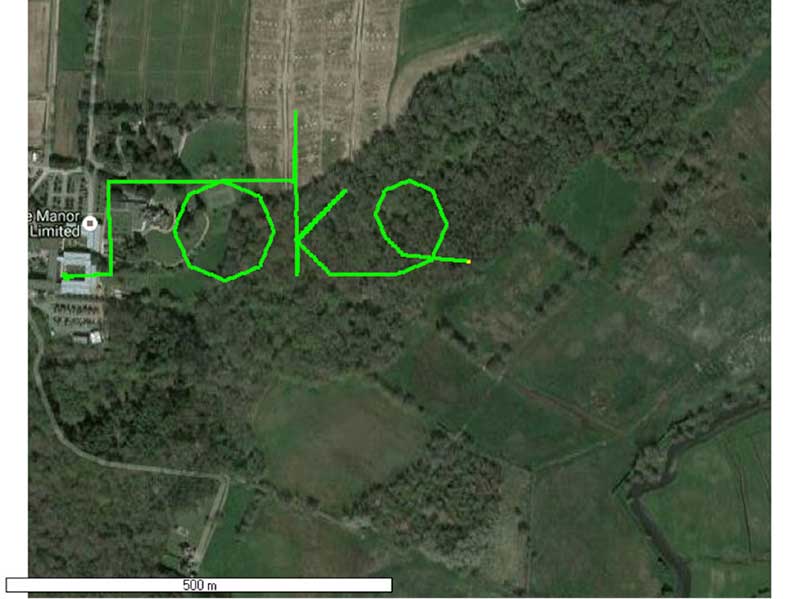
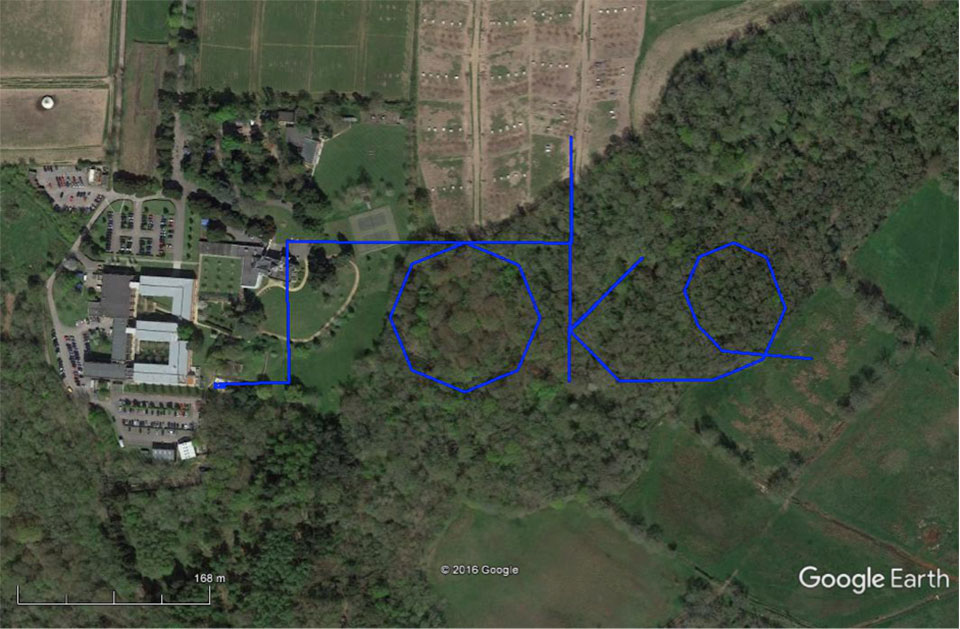
In the first experiment (Figure 2), we spoof a commercially available mass-market receiver. The receiver is outside, reporting its correct location at Roke Manor. When we commence the spoofing attack, we are able to take control of the receiver. Once captured, we can then make the receiver appear to follow an arbitrary course. Here we make it wander off into the forest, spelling the word “roke” as it goes.
Figure 2. Spoofed GPS receiver appears to follow a course, whilst in reality being stationary. (Image: Michael Jones)
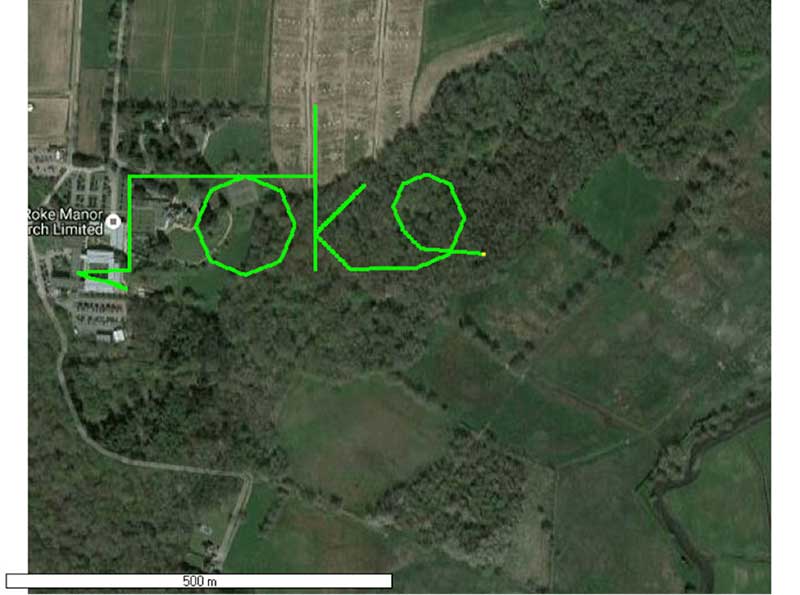
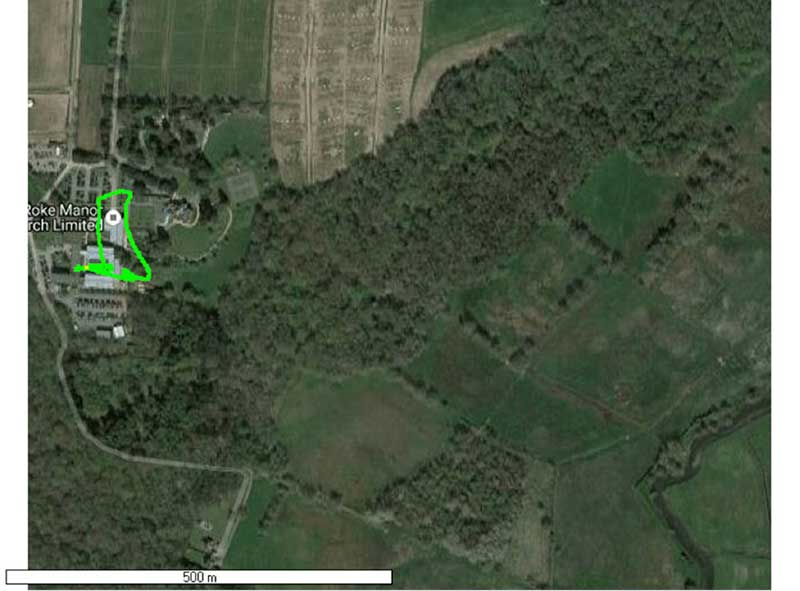
In the next experiment (Figure 3), we place a conventional anti-jam antenna (a CRPA) on the receiver. What we observe, as you might expect, is that the basic CRPA offers no protection against the spoofing attack.
Figure 3. A GPS receiver is still successfully spoofed when protected by a conventional CRPA. (Image: Michael Jones)
Now let’s make the experiment more interesting. We’ll move away from the basic commercial receiver, and replace it with a unit that contains not only a GPS receiver, but also a 3-axis accelerometer, 3-axis gyro, 3-axis magnetometer and a barometric sensor. An Extended Kalman Filter (EKF) performs an optimal fusion of the various sensors to yield the position solution.
The result, when we again try our spoofing attack, is shown in Figure 4. In short, the receiver is still successfully spoofed, despite the additional sensor inputs it offers.
Figure 4. A GPS receiver with integrated inertial sensors is still spoofed. (Image: Michael Jones)
Before everyone gets too depressed by the ease at which GNSS, and even GNSS fused with other sensors, can be spoofed, there are answers to this problem. Some decent, modern GNSS receivers contain a whole host of algorithms for detecting and ignoring spoof signals. The issue is that many legacy receivers are still in the field, and these can be extremely vulnerable indeed.
Another option is to use a more advanced CRPA, which offers anti-spoof capabilities. These adaptive antennas are able to correlate on the spoof signals, and then remove them based on direction of arrival. So, in our final experiment here, we use our commercial mass-market receiver again, and protect it with an anti-spoofing CRPA.
The result is shown in Figure 5. You can see that the receiver is briefly spoofed, and starts to wander off course. When the anti-spoof is enabled and kicks in, the position quickly drifts back to the true location and stays there. Good job.
Figure 5. With an anti-spoof CRPA, the GPS receiver detects the spoofer and quickly returns to its true location. (Image: Michael Jones)
Back to the Black Sea
Let’s finish by returning to the hot topic of the day. Did spoofing occur in the Black Sea back in June? Or was it a different form of interference? Could it have been a low-level jamming incident, causing the GPS receivers to report misleading information?
Without resorting to SIGINT (signals intelligence) data, and basing this discussion solely on public domain information and anecdotal evidence, I would say this was almost certainly a spoofing incident. A number of factors lead to this conclusion, and I’ll share some of them.
Firstly, it didn’t happen to one ship – it happened to over 20 separate vessels. So it wasn’t a malfunctioning GPS unit; it was an external incident of some kind.
Secondly, a large number of ships in the area reported identical or very close locations. This is a symptom of a large-scale spoofing attack. If it was a low-level jamming attack, then any misleading positions reported by vessels would typically have some randomness to them.
Thirdly, ships reported that their positions would periodically “jump” from the true location to the incorrect location. Again, this is very typical behavior in some spoofing experiments: For various reasons, GPS receivers may temporarily lose lock on a spoof set of satellites, and then reacquire the real ones, and vice versa. This causes the characteristic random flipping between two well-defined locations.
If we accept that a GPS spoofing attack did occur, it brings us to the million-dollar question.
Who did the spoofing, and why?
What I’ll do here is a bit of a lightweight analysis exercise using public information and basic physics, and you can formulate your own conclusions.
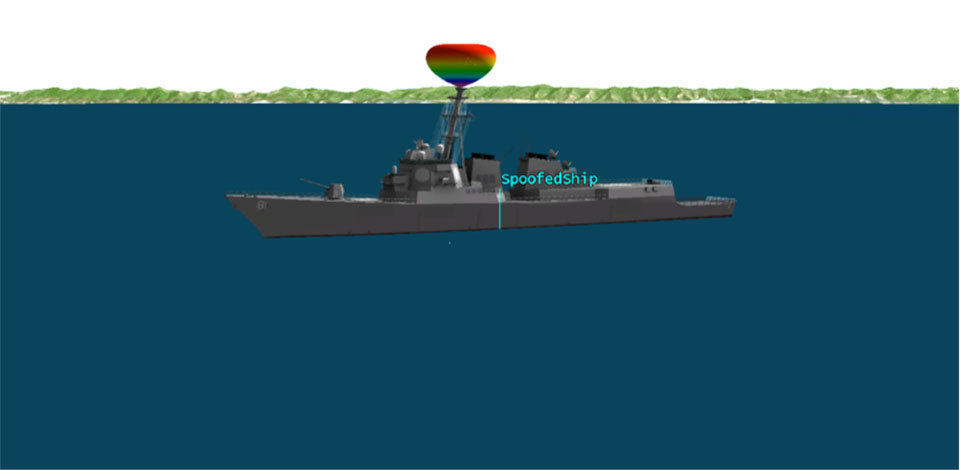
Let’s start by placing a ship, located in the Black Sea at 44°14.0’N 037°43.1E, which is the actual position of one of the reported spoofed vessels. For this example, I have placed a representative GPS antenna on the ship’s mast, with its antenna pattern shown.
Figure 6. Victim ship in the Black Sea, with GPS antenna pattern shown. (Image: Michael Jones)
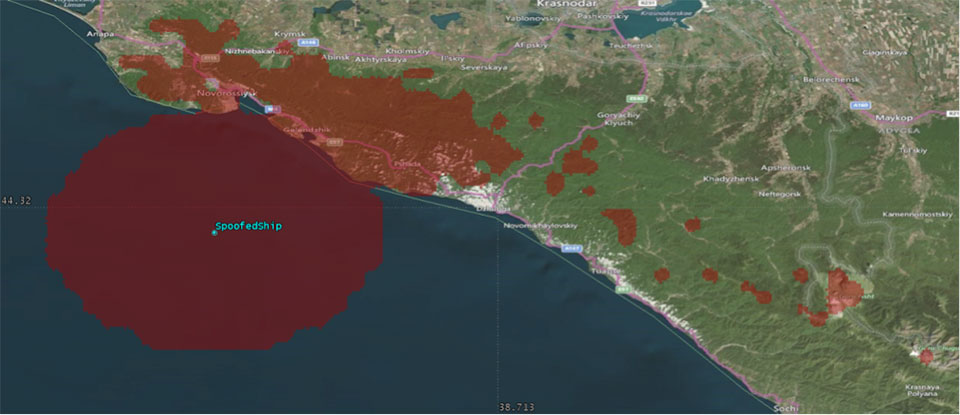
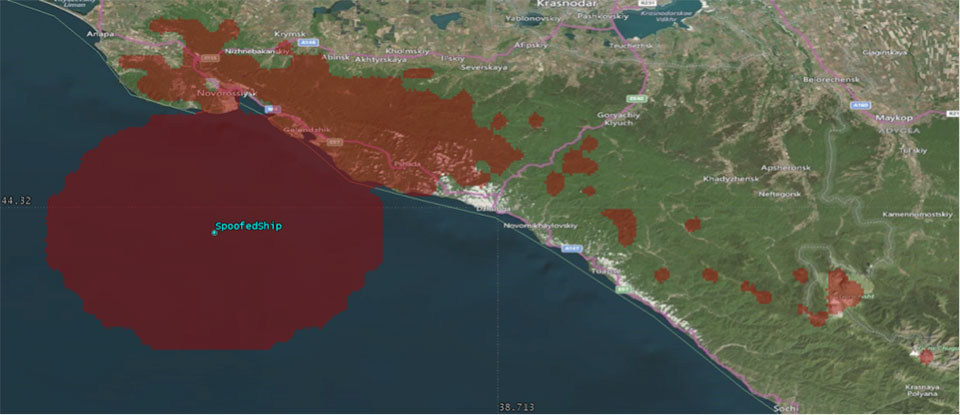
To get a rough handle on the scenario, consider the possible propagation of the spoofing signal. As a first-order approximation, let’s assume a standard 4/3 Earth refraction model, with obstruction by terrain. That’s a reasonable assumption at this frequency: Any obscuration by terrain will block the spoof signal. Let’s also initially assume that our GPS antenna on the ship is mounted 38 meters above sea level, and our spoofing equipment is mounted on a mast 20 meters aboveground. From this information, we can plot a map of possible spoofer locations for this particular incident (Figure 7).
Figure 7. Possible spoofing source locations. (Image: Michael Jones)
The first thing we might conclude from this is that the spoofing indeed originates from Russian territory, close to the Black Sea coast. To spoof the ship from further afield would require a much higher antenna, or even an airborne antenna. Which, of course, is possible, but then we would also expect vessels over a much wider area to report interference.
To me, it’s fairly conclusive that spoof GPS signals are being transmitted from this area, to make GPS receivers in the area think they are at an airport. The final question is: “Why would someone do this?” To answer this question, we must resort to educated speculation. Why would you want to spoof GPS receivers into thinking they are at an airport?
There’s one explanation that fits very nicely: drone defense. Many drones, especially those operated by casual users, have geofencing rules that prevent flights over airports and other restricted areas. So, if you were trying to perform aerial surveillance of the Russian border, your drone may suddenly think it was over an airport, and take action accordingly. The action taken depends, of course, on how the drone is programmed, but often includes “land immediately” or “return to launch point.” Certainly some of the drones we operate will immediately attempt to land if they find themselves in restricted airspace.
So if your drones are falling into the sea, you now have one idea why.
Just over three weeks remain to apply to the Mobile Monitoring Challenge (MMC), led by Stanford and the Environmental Defense Fund (EDF) with technical advice from ExxonMobil.
There’s a big push to develop mobile technologies to monitor and quantify methane leaks at oil and natural gas sites. Mobile monitoring offers the promise of surveying highly dispersed industrial facilities — including smaller and older ones — quickly and effectively.
Stanford and EDF, aided by industry and other expert advisors like those from ExxonMobil, will rigorously field test and compare the most promising new mobile technologies and approaches submitted via the MMC – with extra interest in commercially scalable options. Results will be published in peer-reviewed journals.
Details on the competition, what is required, and the benefits of applying can all be found here.
In a technical report titled GPS Vulnerability released Sept. 15, the Alliance for Telecommunications Industry Standards (ATIS) renewed its call for an eLoran system to support telecom and other critical infrastructure in the United States.
As part of its “Recommendations to Assure Time for Telecom” the report says:
“An eLoran system (or equivalent) should be developed and implemented in the U.S. to provide a near-term alternative to GPS for the telecom system and other critical infrastructure. The physical and cyber security of eLoran transmission stations should be a consideration in their operation.”
ATIS termed its report “a major resource to help better understand and address a formidable telecommunications industry challenge: the vulnerabilities in the Global Positioning System (GPS).”
Requirements for precise time delivery have driven the industry toward the increased use of GPS and GPS-dependent technologies, it says. Yet this dependency has left the industry vulnerable to disruptions and manipulations of the GPS signal.
GPS Vulnerability (ATIS-0900005) provides insight into the sources of the most common problems with GPS and their impacts. The report also covers several mature proposed solutions that would satisfy telecommunications sector timing requirements.
“GPS disruptions have economic, financial and service impacts to carrier network operators, suppliers, cellular services as well as adjacent industries and government agencies that depend on a functioning wireless communications sector,” said ATIS President and CEO Susan Miller. “We believe that our report on this topic will contribute to solutions to help secure the delivery of time — a function critical to many sectors in our economy.”
Known vulnerabilities to deliver GPS time to a system include environmental phenomena, malicious interference and spoofing, incidental interference, adjacent band interference, poor antenna installations and rare but present GPS segment errors.
GPS Vulnerability discusses techniques to address these vulnerabilities as well as alternatives to GPS timing, with the goal of mitigating GPS vulnerabilities for the timing receivers used in the critical infrastructure.
Alternatives covered in the report include Navigational Message Authentication on modernized GPS civil signals, atomic clock time holdover, sync over fiber, eLoran, WWVB, terrestrial beacons and more.
Putin shows taste for spoofing
For several days in June, more than 20 ships reported problems with GPS reception in the Black Sea (see Expert Opinion column, August GPS World). Experts concluded the problems were probably the result of a spoofing attack in the area.
Norwegian journalist Henrik Lied of NRKbeta compared this with accounts of similar episodes near the Kremlin complex in Moscow, where tourists have reported their smartphones showing them at an airport outside the city.
Lied interviewed University of Texas professor Todd Humphreys about his theory that this is an effort to keep drones from flying in the area: “Several of us [researchers in GNSS] have concluded the Kremlin spoofing was likely trying to trigger UAV geo-fencing, which prevents UAVs from flying near airports,” Humphreys said.
A Moscow correspondent for the Norwegian Broadcasting Company reports that these GPS problems only tend to occur when President Vladimir Putin is in town.
Several of the ships spoofed in the Black Sea were sailing in the vicinity of the Russian premier’s Black Sea vacation home. Putin was actually in the area when the incidents occurred. This may indicate that Russian authorities are spoofing wherever the Russian president is located.
Humphreys said, “It’s long been assumed that Russia, China and other nations (including the U.S.) have the technology to carry out a spoofing attack. What’s surprising is Russia’s willingness to use it openly and somewhat indiscriminately. It does fit nicely into what has been called Russian disinformation technology.”
Orolia, through its Spectracom brand, has launched VersaPNT. VersaPNT provides virtually failsafe battlefield navigation, even in GPS-denied environments, to protect critical networks with Assured PNT technology, the company said.
The new, ground, air or sea vehicle-mounted solution is designed for military environments, with a ruggedized, compact, low-power and lightweight form factor.
Today, military vehicles are portable networks, providing seamless connections with U.S. headquarters, regional command posts and individual soldiers. Remote areas are challenging environments for military networks, and enemy forces are jamming, spoofing and disrupting operations.
“VersaPNT provides continuous mission assurance and C4ISR support, even in hostile environments,” said Rohit Braggs, Orolia vice president, PNT networks and sources. “This innovative technology solution protects critical networks for complex military and homeland security land, air and sea operations.”
Every minute counts on the battlefield, and VersaPNT provides critical decision support with real-time situational awareness to facilitate a rapid response, according to the company. This lifesaving technology can also help keep soldiers and civilians out of harm’s way, while ensuring continuous tracking of friendly and enemy forces.
VersaPNT provides essential command and control, navigation, communication and electronic intelligence support for U.S. and allied military, homeland security, first responder, civilian agency, special operations and intelligence missions.
Demonstrations are available at the AUSA Annual Meeting, Orolia Booth #2944.
General Motors Co.’s (GM) self-driving unit, Cruise Automation, has more than doubled the size of its test fleet of robot cars in California during the past three months, a GM spokesman told Reuters.
The unit is testing vehicles in San Francisco as part of its effort to develop software capable of navigating congested and often chaotic urban environments.
GM has reported more run-ins between its self-driving cars and human-operated vehicles and bicycles. Its vehicles were involved in six minor crashes in September, all of which were caused by the other vehicle.
In the past three months, the Cruise unit has increased the number of vehicles registered for testing on California streets to 100 from the previous 30 to 40.
Lidar acquisition. GM announced Oct. 9 that it hasacquired lidar technology company Strobe. Strobe’s engineering talent joins GM’s Cruise Automation team to define and develop next-generation lidar solutions for self-driving vehicles.
In September, Cruise Automation revealed the world’s first mass-producible car designed with the redundancy and safety requirements necessary to operate without a driver. The vehicle will join Cruise’s testing fleets in San Francisco, metropolitan Phoenix and Detroit.
Lidar uses light to create high-resolution images that provide a more accurate view of the world than cameras or radar alone. As self-driving technology continues to evolve, lidar’s accuracy will play a critical role in its deployment.
My last e-newsletter column discussed the basic foundation parameters of the North American-Pacific Geopotential Datum of 2022 (NAPGD2022); that is, a global geopotential model, the GRAV-D project, and the GEOID2022 geoid model. It emphasized that NAPGD2022 will provide a more efficient and cost-effective way to maintain consistent orthometric heights, but evaluating the relative accuracy of the geoid model is critical to a successful implementation of NAPGD2022. Performing GNSS/Leveling evaluation surveys will help in evaluating the relative accuracy of GEOID2022. NGS realizes that users will still have the need to perform leveling to obtain millimeter-level accuracy between closely spaced stations, and to evaluate the relative accuracy of a geoid model. NGS is developing geodetic routines and tools to assist users in transforming heights from NAVD 88 to NAPGD2022, and enabling the incorporation of geodetic leveling data into NAPGD2022 to establish NAPGD2022 orthometric heights. This newsletter will highlight NGS’ current plans for estimating NAPGD2022 GNSS-derived orthometric heights and incorporating geodetic leveling data into NAPGD2022 to establish orthometric heights consistent with GNSS-derived NAPGD2022 orthometric heights. Dan Gillins and Kandell Fancher did an excellent presentation titled “Leveling after 2022” at the 2017 Geospatial Summit. This e-newsletter will highlight some sections of the presentation.
As described in my last e-newsletter, NAPGD2022 will not be realized with leveling data. So, how will users access the National Spatial Reference System (NSRS) in 2022? NGS has prepared frequently asked questions about the new datums (https://www.ngs.noaa.gov/datums/newdatums/FAQNewDatums.shtml#CAN ). The following is the answer to the question How will accessing the National Spatial Reference System (NSRS) change with the release of the new datums?
How will accessing the National Spatial Reference System (NSRS) change with the release of the new datums?The NSRS will be accessed using Global Positioning System (GPS) technology that references Continuously Operating Reference Stations (CORS) and relies on a time-dependent gravimetric geoid model. This method of accessing the NSRS is a paradigm shift from accessing NAD 83 and NAVD 88 through the use of geodetic survey marks.
As described in previous newsletters, GNSS-derived Orthometric Heights are computed using the following formula: orthometric height (H) = ellipsoid height (h) minus geoid height (N). (See box titled “Slide 9 from Gillins and Fancher presentation titled ‘Leveling after 2022’ presented at the 2017 Geospatial Summit.”) It will not be necessary to connect to a geodetic monument, i.e., a bench mark, because the NATRF2022 ellipsoid height (hNATRF2022) is determined using the NGS CORS and the geoid model (NGEOID2022) is consistent with NATRF2022. In other words, GNSS observations combined with the geoid model will become the primary means for deriving orthometric heights on marks.
Slide 9 from Gillins and Fancher presentation titled “Leveling after 2022” presented at the 2017 Geospatial Summit
Gillins and Fancher addressed the expected relative accuracy of a 2022 NAPGD2022 GNSS-derived orthometric height difference in slide 11 of their presentation. (See box titled “Slide 11 from Gillins and Fancher presentation titled “Leveling after 2022” presented at the 2017 Geospatial Summit.”) Their estimation assumes a 1 cm sigma for each ellipsoid height value and 1 cm sigma for the relative geoid height value. This results in an estimated relative accuracy of a NAPGD2022 GNSS-derived height difference of +/- 1.7 cm. Gillins and Fancher also addressed the expected accuracy of leveling-derived heights in their slide 12. (See box titled “Slide 12 from Gillins and Fancher presentation titled “Leveling after 2022” presented at the 2017 Geospatial Summit.”)
Slide 11 from Gillins and Fancher presentation titled “Leveling after 2022” presented at the 2017 Geospatial Summit
This slide is just meant to give an idea of the error budget of GNSS leveling. Actually, if both stations are observed simultaneously, then there is a correlation term that must be tracked and added to the equation for sigma delta H. Further, the value for sigma delta N is poorly understood over very short distances (which are typical for leveling). However, it is reasonable to assume that differences in orthometric height of approx. 2 cm can be achieved with GNSS and a geoid model. The point is to say differences in height are to around 2 cm when only using GPS+geoid
Slide 12 from Gillins and Fancher presentation titled “Leveling after 2022” presented at the 2017 Geospatial Summit
Comparing slides 11 and 12, it’s obvious that leveling-derived orthometric height differences are more accurate than GNSS-derived orthometric height differences between closely spaced stations. NGS recognizes that some users will require a high level of relative accuracy and will continue to perform leveling; and, therefore, they will want their leveling-derived orthometric heights consistent with NAPGD2022. Gillins and Fancher’s presentation stated that NGS has ongoing research to develop models to combine and adjust GNSS-derived heights and/or observations with leveling, and to develop software applications and tools for incorporating leveling-derived heights into NAPGD2022. NGS has performed some preliminary tests of adjusting GNSS derived heights with leveling data using weighted constraints. Slides 16-18 from Gillins and Fancher presentation titled “Leveling after 2022” presented at the 2017 Geospatial Summit” depicts the basic concept.
The basic concept is that the user will first establish NAPGD2022 orthometric heights at two stations using GNSS observations and a geoid model. Then, the user will observe leveling height differences between the two stations (see box titled “Slide 16 from Gillins and Fancher presentation titled “Leveling after 2022” presented at the 2017 Geospatial Summit”), and finally the user will perform a least squares adjustment to estimate NAPGD2022 orthometric heights using appropriated weighted constraints of the NAPGD 2022 GNSS-derived orthometric heights and appropriated weighted leveling observations (See box titled “Slide 18 from Gillins and Fancher presentation titled “Leveling after 2022” presented at the 2017 Geospatial Summit.”).
Slide 16 from Gillins and Fancher presentation titled “Leveling after 2022” presented at the 2017 Geospatial Summit (Before Adjustment)Slide 18 from Gillins and Fancher presentation titled “Leveling after 2022” presented at the 2017 Geospatial Summit (After Adjustment)
We will address this topic in more detail in another newsletter but the major takeaways are given in slide 22 from Gillins and Fancher presentation titled “Leveling after 2022” presented at the 2017 Geospatial Summit. Basically, the GNSS and a high-accuracy geoid model connects the user to NAPGD2022 and provides the overall network accuracy, and the leveling data improves the accuracy of height differences between marks and provides the local accuracy. The addition of leveling with GNSS increases the overall redundancy in a survey network which increases the ability to detect outliers and improves the relative accuracy of the final adjusted height differences.
To assist users in obtaining accurate relative NAPGD2022 height differences, NGS has plans to develop software applications and tools for incorporating leveling-derived heights into NAPGD2022. They have a project called “OPUS-Projects for GNSS & Leveling.” The box titled “Slide 25 from Gillins and Fancher presentation titled “Leveling after 2022” presented at the 2017 Geospatial Summit” is a mockup of the proposed tool. This tool will apply the appropriate corrections to the leveling data and perform a least-squares adjustment to estimate NAPGD2022 heights based on weighted constraints.
Slide 25 from Gillins and Fancher presentation titled “Leveling after 2022” presented at the 2017 Geospatial Summit
This newsletter focused on NGS’ current plans for estimating NAPGD2022 GNSS-derived orthometric heights and incorporating geodetic leveling data into NAPGD2022 to establish orthometric heights consistent with GNSS-derived NAPGD2022 orthometric heights. It emphasized that after NAPGD2022 is established, the primary means for deriving orthometric heights on monuments will be using GNSS observations combined with the geoid model. Future newsletters will discuss in more detail some of NGS’ ongoing research to develop models and tools to combine and adjust GNSS-derived heights and/or observations with leveling.
Sokkia has unveiled a new radio modem designed to offer advanced radio connectivity with GNSS receivers. The R4S-BT UHF radio provides an external option for use with the Sokkia GCX receiver line.
The UHF multichannel radio modem has a tuning range of up to 70 MHz. Additionally, the radio features an IP67 certified housing with internal batteries that is designed to be easy to carry with versatile mounting options.
“The R4S-BT makes the GCX GNSS receiver into an even more scalable and modular solution,” said Jason Hallett, vice president of global product management at Sokkia. “It is perfect in situations without a network connection or when long-range Bluetooth technology is not enough on its own. Survey and mapping professionals can simply add on this external UHF and extend the range between the base and rover.”
Connectivity options include wireless data transfer and USB connections.