SuperGeo released SuperGIS Server 3.1, a comprehensive and server-based GIS that enables organizations to create, manage, integrate and publish a variety of spatial data, images and GIS abilities over the Internet and apply to desktop, mobile and web applications. It allows enterprises to build ideal workflow and improve decision making and productivity.
According to the announcement, the newly updated SuperGIS Server 3.1 Value Edition provides a new SuperGIS Server Manager so that administrators are allowed to publish and manage GIS services through web browsers. Additionally, SuperGIS Server 3.1 Value Edition adds Web Map Tile Service (WMTS).
To improve the efficiency of spatial data management, SuperGIS Server 3.1 provides users with SuperGIS Server Map Cache Tool to produce cache maps and maintain map services. Meanwhile, SuperGIS Server 3.1 also improves the integration with open GIS resources and can combine the network analysis abilities of SuperGIS Network Server 3, allowing the administrators to have a more flexible server framework.
Google announced on its official blog that it has released more than twenty popular U.S. museums to its collection of over 10,000 indoor maps that they launched in November: the de Young Museum in San Francisco, the Philadelphia Museum of Art, Cincinnati Museum Center, the Indianapolis Museum of Art, the American Museum of Natural History and 17 Smithsonian museums and a zoo.
American Museum of Natural History, New York City
National Air and Space Museum—Smithsonian Institution, Washington, D.C.
Google reports that to access the floor plans, simply open Google Maps on your Android phone or tablet and zoom in on the museum of interest. To find the museum, either search for it by name using the magnifying glass icon or, if you’re already there, use the “My location” feature to orient yourself. With the “My location” feature enabled you can even get indoor walking directions.
According to the announcement, more museums are adding their floor plans to Google Maps for Android soon, including the SFMOMA, The Phillips Collection, the Nelson-Atkins Museum of Art and the National WWII Museum in New Orleans. If you’re interested in getting your museum’s floor plan included in Google Maps, visit the Google Maps Floor Plans tool.
TomTom launches the first quarterly Congestion Index that accurately identifies and analyses traffic congestion in major cities across Europe. The report, initially covering 31 cities, finds Warsaw the most congested city in Europe.
On average, journey times in Warsaw are 42% longer than when traffic in the city is flowing freely and 89% longer during morning rush hour. The TomTom Congestion Index, including individual city reports, can be found at www.tomtom.com/congestionindex.
The TomTom Congestion Index is the world’s most accurate barometer of congestion in urban areas. The Index is uniquely based on real travel time data captured by vehicles driving the entire road network. TomTom’s traffic database contains over five trillion data measurements and is growing by five billion measurements every day. The overall congestion level for all the cities analysed in Europe is 24% – meaning journey times take 24% longer than when traffic is flowing freely.
The top ten most congested European cities, ranked by overall congestion level, between January and March 2012 were:
Warsaw, 42%
Marseille, 41%
Rome, 34%
Brussels, 34%
Paris, 32%
Dublin, 30%
Bradford – Leeds, 28%
London, 27%
Stockholm, 27%
Hamburg, 27%
“Over the years, with the help of our customers, we have built the largest and most accurate database of travel times in the world,” said Harold Goddijn; Chief Executive Officer of TomTom. “When we combine this travel database with our detailed real-time traffic information and routing technology, we can not only pin point congestion, but can guide drivers away from congested areas onto faster routes.”
“Even when only a percentage of drivers use a different and faster route, the available capacity on the entire road network increases, which benefits all drivers,” Goddijn added.
TomTom’s Congestion Index also compares congestion levels between January and March 2012 with the same period in 2011. Based on this analysis, Bradford – Leeds in the UK saw the biggest increase in traffic congestion with journey times slowing significantly. Munich, Berlin, Marseille and Vienna all saw increased levels of congestion. Lisbon, Bern, Amsterdam, Milan and Rome all experienced a reduction in congestion levels.
TomTom also launched the first quarterly Congestion Index that accurately identifies and analyzes traffic congestion in major cities across North America. The report, initially covering 26 major cities, finds Los Angeles to be the most congested city in North America. On average, journey times in Los Angeles take 33% longer than when traffic in the city is flowing freely and 77% longer during evening rush hour.
The Congestion Index compares travel time during non-congested periods (free flow) with travel times in peak hours. The difference is expressed as a percentage increase in travel time, representing the congestion level. The top ten most congested North American cities, ranked by overall congestion level, between January and March 2012 were:
Los Angeles, 33%
Vancouver, 30%
Miami, 26%
Seattle, 25%
Tampa, 25%
San Francisco, 25%
Washington, 24%
Houston, 23%
Toronto, 22%
Ottawa, 22%
TomTom’s Congestion Index also compares congestion levels between January and March 2012 with the same period in 2011. Based on this analysis, Seattle saw the biggest increase in traffic congestion, while Houston, Ottawa and San Francisco also saw increased levels of congestion. Conversely, Edmonton, New York, Boston, Minneapolis and Toronto experienced a reduction in congestion levels.
TerraGo Technologies Inc. has acquired the complementary software products and technologies of Manhattan Beach, CA-based Geosemble Technologies Inc. Terms between the privately held companies were not disclosed. Both firms are In-Q-Tel portfolio companies.
According to the announcement, Geosemble’s flagship product, GeoXray automates the process of discovering, geospatially visualizing, monitoring and sharing relevant unstructured information from any source. The software mines and processes content from news, blogs and social media and analyzes data by place, time and topic. GeoXray decreases the amount of time analysts spend sifting through big data and produces more germane information specific to an area of interest. The solution, which is used by a number of intelligence agencies, frees analysts to spend more time on quality analysis and enables better collaboration with peers, decision makers and field personnel.
TerraGo reports that the strategic acquisition of Geosemble builds on TerraGo’s growing geospatial intelligence applications and reports expertise. The combined companies’ solutions will now enable users to selectively discover relevant spatial content; compose dynamic, interactive geospatial intelligence applications and reports; and collaborate in online and disconnected environments. The new TerraGo suite of solutions will facilitate enhanced situational awareness and actionable intelligence for better planning, improved decision making and faster response.
Founded in December of 2004, TerraGo reported that Geosemble is a spin-off from the University of Southern California (USC). Its founders are computer science faculty members and originally developed the company’s core artificial intelligence and geospatial data analysis algorithms at USC. The technology has since been strengthened and refined to apply to a range of government and commercial user needs focused on automatically discovering and integrating information into satellite and aerial imagery and maps. The Geosemble business and technical team will be brought into TerraGo as the Geosemble solutions group, and the office in Manhattan Beach will be expanded to accommodate additional engineering staff as well as support resources to serve TerraGo’s growing West Coast customer base. Both firms are In-Q-Tel portfolio companies.
“The strategic acquisition of Geosemble will enable our customers to discover, visualize, monitor and share geospatial intelligence relevant to their operations and areas of interest,” said TerraGo Pres. and CEO Rick Cobb. “We warmly welcome our new colleagues to the TerraGo team, which, as always, remains committed to our tradition of product innovation and dedication to customer success.”
“This union is a perfect fit for Geosemble since TerraGo brings valuable distribution, implementation and customer support capability to Geosemble’s products, in addition to TerraGo’s own valuable suite of complementary technology. The combined resources of our companies will enable us to further develop advanced geospatial intelligence solutions for our existing defense and intelligence customers as well as others in crisis management, public safety and a wide range of commercial businesses,” said Andre Doumitt, former Geosemble CEO and now TerraGo vice president of business development for Geosemble solutions.
Esri announced that GeoIQ, a small geo-location company based in Arlington, Virginia, will be joining their organization. The addition of GeoIQ’s team will strengthen Esri’s capabilities in the areas of user experience design, web development and cloud-based applications.
"We are excited to join the Esri family, integrating our technology and extending the Esri platform,” says Sean Gorman, founder of GeoIQ. “Esri’s approach to ‘GIS for Everyone’ is transformational in the industry and is very closely aligned with GeoIQ’s vision, so we are extremely excited about working together.”
“We believe this will help us supplement our capabilities in delivering simple geospatial solutions for our customers around the world as well as the rapidly growing web developer and content delivery communities,” said Jack Dangermond, president, Esri.
According to the announcement, GeoIQ staff will join Esri at a new software development center located in Washington, D.C. and extend the ArcGIS platform with special emphasis on federal government clients in the areas of self-service mapping, analytics, big data, content streaming and social media. This center will also support web developers that are focusing on geo-enabling their web solutions with Esri’s geospatial platform. Existing GeoIQ users will continue to be supported.
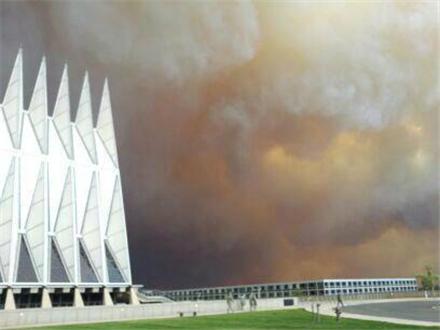
Tuesday, the 26th of June, started off as a beautiful day in Colorado Springs, if you ignored the towering plume of smoke to the west from the Waldo Canyon Wildfire.
The wildfire started three days before in the popular Waldo Canyon hiking area in the Rocky Mountains just off Highway 24. While people in the Colorado Springs area were concerned, there were currently eight other wildfires raging in the state of Colorado and over the past month arsonist(s) were suspected of starting up to 20+ wildfires. So, many had become inured to the sight and smell of smoke. Only one serious wildfire was known to be currently out of control in Colorado at the time, so concerns in the Colorado Springs community could be described as moderate.
Then, at 1630, that’s 4:30 P.M. for my non-military readers, the wildfire displayed its true personality. Driven by what meteorologist later described as “a perfect storm of weather conditions” and howling winds exceeding 65 miles per hour out of the West, the fire spread eastward toward Colorado Springs at an alarming rate.
The dark black roiling smoke blotted out the sun, which was suddenly no more than an angry red disc in the sky providing little illumination. The suddenly disobedient wildfire began marching, indeed running and leaping, relentlessly eastward voraciously consuming homes and lifetimes of memories. My wonderful wife of 32 years and I had all of five minutes to leave our comfortable foothills home, amid swirling, stinging, cloying black smoke, flying embers, and flames that danced over 100 feet high. It was simply a terrifying event. As we fled the wildfire with quickly gathered pictures, important papers, and little more than the clothes on our backs, neither of us thought we would ever see our home of 22 years or anything inside intact again.
Fox 21 file photo of the Waldo Canyon Fire in Colorado Springs, June 26, 2012.
Evacuation
The wildfire and smoke turned a now-indelible drive down familiar streets into an alien landscape. Visibility was limited to less than ten feet and premature night had fallen in a fiery, smoky, unbreathable pall on more than half of Colorado Springs. In the end more than 32,000 people were evacuated, 11,000 homes were threatened in several nearby communities, and approximately 350 homes were lost in the Mountain Shadows neighborhood in the foothills of the Rocky Mountains. Firemen tell me the heat was incredibly intense, and homes that were lost were quickly turned into nothing more than smoky white ash. It was a truly devastating turn of events but without all the capabilities generated by and enabled by GPS, the results could have been much worse. Mayhem was avoided, and I have no doubt that GPS units of various descriptions guided thousands of people to safety that unforgettable day. Thousands of people, who suddenly and unexpectedly found themselves to be evacuees, followed voice and visual commands from small electronic GPS units that eventually led them to safety and safe havens all around the state of Colorado.
Heroes
Firefighters and support agencies from around the U.S. responded. When the fire broke out and wreaked havoc in the Rocky Mountain foothills, there were ~423 firemen fighting the fire. After the breakout and at the height of the fire, there were firefighting assets from every source available including the DoD and the National Guard. They totaled more than 1500 in number, and in my book they are all heroes. Case in point, as we were fleeing down the mountain from our home in a billowing preternatural darkness, along with thousands of others just like us that just wanted to get out safely, the brave men and women of Fire Station #12, at the end of our street, were racing up the mountain to confront the fire and save our homes and our neighborhood. In this regard I hold them and all firefighters in the same regard as U.S. Marines, who when shots are fired run toward the sound of gunfire, not away from it. Our courageous local firefighters, joined by a thousand more from across our nation, were running toward the fire, not away from it. Their bravery brought tears to your eyes that had nothing to do with the smoky atmosphere.
We Survived
All this occurred less than two weeks ago — as I write this column from my home, which was fortunately spared, albeit with a slightly smoky bouquet. We certainly consider ourselves to be blessed as the fire was stopped just a few hundred feet from our neighborhood.
When we finally and gratefully returned home and were able to fire up our computers, I discovered several testimonials from readers, first responders, firemen, and GPS users extolling the virtues first of the firemen and then of the GPS equipment that played such an important role in averting a total catastrophe.
One note from a couple who had only been in the local area for a couple of months described their experience fleeing before the raging wildfire in an only vaguely familiar neighborhood suddenly plunged into darkness, with air that was difficult to breathe and street signs that were unreadable. However, they movingly wrote, “Our brand new Garmin, that led us across country, also led us to safety during the WC wildfire and it was extremely comforting to know that the GPS knew the way…it eventually led us safely to a hotel outside the evacuation area…we had no idea which way to go and were totally dependent on our Garmin…we had a map but in all the confusion and panic it was of very little use…we could not read the map in the sudden darkness…we just listened to that small little voice that said…prepare to turn right in 400 feet…it saved our lives.”
USAFA under Attack by the Waldo Canyon Wildfire.
Another shining example of bravery in firefighting came from the various agencies and firefighters that joined the firefighters from the United States Air Force Academy (USAFA). A USAF Colonel went on local television and declared that they had evacuated the academy and then established what they hoped was an impenetrable several-mile-long firebreak with bulldozers and heavy equipment, and although their numbers were limited, they would not allow the fire to penetrate the USAFA beyond that line and hold the line they did. These brave men and women were not all trained and certified wildfire firefighters, but they had the courage of their convictions and they held the line. The fire did not penetrate the USAFA beyond that firebreak. There are many more examples of true heroism that are too numerous to mention.
Firefighters from across the Nation
I spoke with many first responders — as I said, eventually 1500+ were fighting the fire — from as far away as California and Utah, who knew nothing about Colorado Springs or the Rocky Mountains to the west when they arrived on the scene, but who efficiently navigated the fiery wasteland with their map reading skills and various official and commercial/civil GPS units, both stand-alone and embedded units. And again Garmin units were almost always mentioned in the conversation — from sophisticated Garmins using elaborate forestry and military grid systems used by military and Forest Service first responders, in vehicles and aircraft, to wrist Garmins that simply allowed users to immediately locate their positions on a local area map.
At the height of the WC Wildfire, which as I write this is 98% contained but most certainly not under control, there were firefighters and first responders from the Forest Service, U.S. Army, U.S. Air Force, National Guard (Army and Air Force), the U.S. Air Force Academy, and numerous federal agencies to include C-130 MAFF (Modular Airborne Fire Fighting System) units from Peterson AFB, in Colorado Springs (the 302nd) and from a National Guard Unit in Wyoming. The majority of the firefighters were not from the local area; consequently, most all of them were using an incredible array of various GPS devices to locate and navigate. And in most all cases there was some reference to an external map. Local television stations, which covered the fire exclusively for the first five days, all had different and multiple maps and many were frankly almost indecipherable. What was interesting is that in almost every case there was a definite and clearly visible unfamiliarity by the participants with both the maps and even the local area. It seems that except for certain branches of the military and those who use maps daily in their profession, map reading and orienting skills have fallen by the way side, if indeed there was ever any initial proficiency. It is a skill we all need to relearn.
Maps and GPS
A very close friend and business colleague of mine, Robert Rosenberg (Maj Gen USAF Retired), once ran what was then known as DMA or the Defense Mapping Agency and is now known as NGA or the National GeoSpatial Intelligence Agency. NGA specializes in maps and may be the best in the world at gathering the necessary data and producing them. Indeed, some of the NGA maps are simply amazing and true works of art. However, the sad fact is they are utterly useless if you don’t know how read and utilize them properly.
Historically, some of the inaccuracies wrongly attributed to the GPS were actually map errors. I personally observed an incident where Dr. Ivan Getting, a possible father of the GPS, whom I have written about previously, determined the exact geographical coordinates of his home from a long integrated GPS position, but which DMA maps showed to be in the middle of a lake. Obviously the map was several hundred meters in error, and this was a common occurrence in the “old” days. However, modern map-making techniques and accuracies today are such that this is no longer the case. But even the best and most accurate map in the world today is useless if we don’t know how to make use of it — we must learn to orient ourselves, accurately locate our position on a map, and generally make use of the features all modern maps provide. It is time to stop blaming the maps and map makers and start learning to use the phenomenal maps and PNT tools at our disposal.
Now, please don’t misinterpret my comments or take them out of context. After all, this is GPS World magazine and there is not a greater proponent of GPS anywhere than yours truly; however, I have also always been a proponent of developing simple map reading skills as well, which to some seems to be anything but simple.
Dwindling Skillsets
Like many of you, I have read passionate and somewhat inaccurate articles bemoaning the use of GPS for the navigation and situational skills that are lost by blindly following GPS dictates, and certainly I have received numerous letters from and responded to those who prefer to navigate using granddad’s old Texaco map in the glove compartment. However, unlike many uninformed critics of the GPS and proponents of map reading skills, I do not believe the two are mutually exclusive. In fact, one of the features I most appreciate about the GPS navigation system in my Audi is the traffic avoidance feature that when potential routes are blocked, or conflicts arise, automatically reroutes, without ever broadcasting that most irritating word “recalculating.” The other feature is the map display zooms out and displays more map features and alternate routes, so if I wish I may manually choose an alternate route. I have, just as you do, the option of blindly trusting the GPS, picking my own route on the map display or, as I most frequently do, using a combination of both map-reading skills and PNT automation.
In the grand scheme of things, map-reading skills are not difficult to develop and the basics are simple; however, it does take some practice — practice that can be gained every day by choosing different routes to work or common destinations and challenging yourself and your map reading skills when you travel. And here is a novel idea — actually read the instructional/operators manual that came with your GPS — learn all its secrets and built-in capabilities. You might be surprised by what you will learn and the skills GPS can help you develop.
Plethora of PNT Equipment
I had the enviable opportunity to speak with representatives from many of the more than 20 agencies that responded to the Waldo Canyon Wildfire and get a brief look at some of their PNT equipment. The equipment in general ranges from high end and highly sophisticated official first responder units with built-in communications capabilities to Garmins, iPhones, and iPads. The Garmins were equally split between vehicle-mounted, aircraft-mounted, and portable units, while the more sophisticated units were large and considered more appropriately as portable units with communication capabilities than as true handhelds. By far the most noticeable and prevalent units, other than Garmins, were Apple iPads, especially the new iPad IIIs with retina displays and ruggedized with Otterbox and Otterbox-like enclosures. There are numerous mapping and GPS/GIS applications that run on the iPad and other portable display devices, and in the future I will be reviewing the best mapping applications to assist you in choosing the one that is best for your situation. However, regardless of the application or device it would behoove us all to learn a bit more about maps and the devices we have on hand to display them, to include becoming familiar with that old Texaco map in the glove compartment, even if it is a last resort.
Tragically two souls perished in the Waldo Canyon Wildfire, as they were unable to evacuate their home before the fast moving wildfire overcame them. The Waldo Canyon Wildfire is truly a catastrophic event that will long be remembered in Colorado, and from which we can all learn a valuable lesson. And I wholeheartedly believe that many lives were and will continue to be saved by GPS/PNT devices in these types of catastrophes. We simply owe it to ourselves and our loved ones to learn how to best use our GPS/PNT equipment now, so it will be second nature when a catastrophe occurs. Take it from me, you life may depend on it. When you are fleeing for your life, you need all the help and good fortune available — it is not the time to figure our how your GPS/PNT device really functions.
God bless our firefighters and first responders.
Until next time, as Tennessee Ernie Ford said, “God willin’ and the creek don’t rise,” happy navigating and remember to read your GPS/PNT equipment owners manual.
Thanks to those able to attend the June 21 webinar titled “Mobile GIS: What’s the New Normal? Windows, Android, iOS, Open Source?” If you weren’t able to attend and would like to listen to it, you can by registering here. It’s a fascinating discussion about the direction that mobile GIS devices are taking in the future. To top it off, two days after the webinar, Google announced its own tablet computer, the Nexus 7.
I conducted three live audience polls during the webinar. One audience member noted that by asking the poll questions after presenting slides on the subject that I may have skewed the results. I guess it’s possible, but I think most audience members already had some idea of which direction they were going even before attending the webinar. However, I do agree that by presenting information the audience may not have been aware of (such as Microsoft’s commitment to support Windows Mobile until at least 2019), that this may have caused audience members to reconsider or change their answers based on new knowledge, but isn’t that what the webinar is supposed to do? Provide timely and current information for more informed decision-making?
Followng are the poll results from the webinar.
Poll #1: For Mobile GIS work, which type of device do you prefer?
Gakstatter comment: The audience results don’t surprise me. Some might expect that smartphones would be higher, but as one audience member noted, “The screen is too small and who wants to risk using their phone?” Also, there are a very limited number of mobile GIS apps available for smartphones running Android or iOS. But, I think the fundamental issue is risk. Yes, for lightweight mobile GIS, a smartphone may be very useful, but if you’re tasked with an all-day intensive mapping project, would you really use a smartphone for this? It’s a valid question.
Poll #2: Which Mobile device operating system do you foresee using in the future for Mobile GIS?
Gakstatter comment: This is interesting, but not completely surprising. The dominance of Android makes sense because the vast number of Android-based devices being introduced, from smartphones to tablets. I expected the iOS number to be higher, but I think what’s hurting iOS is the lack of apps for mobile GIS and the inability of iPads/iPhones to interface (Bluetooth) with external sensors (such as GPS, lasers, cameras, etc.). Another interesting point is the high number of “Don’t Know yet” responses (27.4%). With the lack of powerful mobile GIS apps for Android and iOS and the user community’s uncertainty about Microsoft’s intentions with Windows Mobile, there’s a lot of “wait and see” going on. My gut tells me that Windows Handheld will garner the largest share of the “Don’t know yet” audience. It’s going to take quite some time before mobile GIS Android apps are developed, introduced, debugged, etc. Plus, there are so many versions and variations of Android that I think developers will have to target certain devices to support. It’s not a “one-size-fits-all” thing. An app developed for Android doesn’t mean it’s going to run properly on all Android devices.
Poll #3: In the future, do you think your organization will be using cloud-based mobile GIS apps or standalone mobile GIS apps?
Gakstatter comment: I have to say, this is the most confusing webinar question I’ve ever asked. During the webinar, I noted this and asked the audience to respond Yes for cloud-based apps and No for standalone apps. If you understood it that way and responded accordingly, the results seem reasonable. Either way, there’s no doubt about the huge interest in working with cloud-based apps. It’s going to be interesting to watch where the cloud-based apps go. It’s not like a small consulting company or local government agency can deploy cloud-based mobile GIS apps easily. They would need a whole level of back-end support (hardware and software) to do this. In that case, maybe there’s companies that will offer SaaS (Software as a Service) for these folks to use? That starts to make sense. But, where are they? Is ArcGIS for Android/iOS and Google for Android as good as it’s going to get? One segment where I have seen some traction is local governments offering mobile GIS SaaS from companies like Accela and CitySourced.
If I haven’t said it enough, what’s hindering Android and iOS in mobile GIS is the lack of apps. Esri will never have ArcPad (arguably the world’s most popular mobile GIS software) rewritten to Android or iOS, that’s pretty clear. Esri’s successor for ArcPad is ArcGIS for Windows Mobile, in which they just released version 3.0. It’s a hybrid standalone/cloud app so you can use it when your not connected to the Internet, but it still doesn’t have some of the useful features that ArcPad (and others) have like supporting related tables and direct support for raster imagery, CAD, and shapefiles that don’t have to be “pre-processed” in ArcGIS. There’s really nothing similar for Android or iOS.
Due to the lack of apps for Android and iOS apps, I’m not so quick to write off Windows Mobile devices as many people have. As poorly as Microsoft has communicated its intentions, they have committed to supporting Windows Embedded Handheld (essentially, the same as Windows Mobile) until at least 2019. That’s plenty of time to let Android mature and settle (or even some other operating system to emerge), which it needs to do in order to not drive software developers insane. Android ships in many flavors today, from version 2.3 to the new Google Nexus 7 tablet running version 4.1. Since Android is an open operating system, you can have so many variations and nuances that it will be nearly impossible for app software to run flawlessly across so many different hardware devices and operating system versions.
On the flip side, Apple (iOS) has a highly-controlled app registration process, so other than varying screen sizes, apps will largely run across the iOS hardware platforms. The highly controlled environment seems to work well in ensuring smooth running apps. I’m told that Apple does this to ensure the “best user experience.” However, in some areas, notably Bluetooth connectivity, the proprietary nature of Apple rears its head in a not-so-flexible way. For example, for those of you waiting for the day you can use Bluetooth to connect your high-precision GPS, camera, or laser rangefinder to the iPad or iPhone, don’t hold your breath. If it wasn’t specifically made to Bluetooth to iOS, it’s not going to work. For example, following is a Bluetooth GPS receiver (XGPS150) that works with iPads/iPhones as well as other non-Apple Bluetooth hosts. Note the “Mode” toggle switch where the user must select between Apple and non-Apple products.
Dual XGPS150 (Source: Dual)
The Dual XGPS150 is your typical consumer-grade GPS receiver. It has value for pilots, auto nav, and other apps where the users need to place the GPS antenna in a different location than the iPad/iPhone. However, none of the professional-grade Bluetooth GPS receiver manufacturers have designed “Apple Bluetooth” into their systems, so there’s no way to connect your iPad/iPhone to a high-precision GPS/GNSS receiver via Bluetooth, unless you jailbreak the Apple Bluetooth stack.
With iOS devices “out” for the forseeable future, that leaves the battle between Android and Windows Mobile devices for the most flexible and powerful GIS data collection devices.
Google’s New Nexus 7 Tablet Computer
Just two days after Mobile GIS webinar, Google introduced its Nexus 7 tablet computer.
Google Nexus 7
Even though Google says it’s not meant to target the Apple iPad, it may be better suited for geospatial apps than the iPad. One of the apps it was built for is gaming, so it’s got a pretty strong processor, a 1.3GHz quad-core CPU backed by 1 GB of RAM. Given that, dealing with raster imagery efficiently may not be an issue, although storage might. The Nexus 7 comes in 8-GB and 16-GB versions, with no memory expansion slot. That’s a lot of storage, but we like our SD cards.
Of course, the “7” in the Nexus 7 name matches the display size, 7 inches, with 1280 x 800 pixel resolution, which is higher-res than the first two iPads. The Nexus 7 weighs in at 12 ounces, which is ligher than a Kindle Fire and half the weight of an iPad (although the iPad has a larger 9.7″ display). It reportedly works fine in direct sunlight, which is a must for geospatial users.
It’s 4300-mAh Li-Ion battery will run it 9+ hours and I’d probably buy the $20 protective case for it since it’s not built for outdoor use any more than a notebook computer is. Ruggedness is always the rub with using consumer electronics devices outdoors, and the Nexus 7 is no different.
By the way, the Nexus 7 is actually an ASUS Transformer Prime tablet that Google has rebranded. This is a good thing because the hardware bugs have likely been flushed out. Gizmodo rated the ASUS unit its favorite Android-based tablet.
The Nexus 7 is one step closer to bringing consumer tablet computer technology to professional geospatial users. Although it has a built-in GPS receiver and 1.2-megapixel cameras, we need better geospatial tools. If various Bluetooth geospatial devices like high-precision GPS receivers, cameras, laser rangefinders, etc. can be interfaced to the Nexus 7, it’s a better match for geospatial apps than the iPad.
Running Android’s latest 4.1 operating system, it’s going to suffer from a lack of geospatial apps, for now. But maybe this is the sort of hardware that developers need to see to get them excited.
Did I mention the price?
$200 bucks. If you want to splurge, $250 for the 16-GB model.
A new method brings together advantages of real-time kinematic (RTK) and precise point positioning (PPP) in a technique that does not require local reference stations, while still providing the the high productivity and accuracy of RTK systems with the extended coverage area of solutions based on global satellite corrections. The real-time centimeter-level accuracy without reference-station infrastructure is suitable for many market segments — and is applicable to multi-GNSS constellations.
By Rodrigo Leandro, Herbert Landau, Markus Nitschke, Markus Glocker, Stephan Seeger, Xiaoming Chen, Alois Deking, Mohamed Ben Tahar, Feipeng Zhang, Kendall Ferguson, Ralf Stolz, Nick Talbot, Gang Lu, Timo Allison, Markus Brandl, Victor Gomez, Wei Cao, and Adrian Kipka
Real-Time eXtended (RTX) positioning is a technology produced by combining a variety of innovative techniques, which together provide users with centimeter-level real-time position accuracy anywhere on or near the Earth’s surface. This new technique is based on the generation and delivery of precise satellite corrections (that is, orbit, clocks, and others) on a global scale, either through a satellite link or the Internet. The innovative aspects of the new solution can be divided into different categories, which directly relate to the areas that have previously limited the provision of global high-accuracy positioning:
Because of various new aspects of the technique, RTX differs from both differential RTK and precise point positioning as currently understood by the general GNSS community.
System Overview
RTX technology is used to provide centimeter-level GNSS positioning through the CenterPoint RTX service. Figure 1 shows the general infrastructure of the system.
Data from monitoring stations distributed around the globe are collected and transmitted via the Internet to operation centers at different locations. The complete operation centers (enclosed by the red dashed square) are redundant in order to assure the very high (~100 percent) availability of the system. In case it is needed, the correction stream source might change between operation centers and/or processing servers within centers. These operational changes are handled in a deterministic way by all parts of the system including the user receiver. Inside the operation centers, redundant communication servers relay the network observation data to the data processing servers, which host the network processors that produce precise orbit, clock, and observation biases valid for any place on the globe.
After being generated, the precise satellite data are compressed in messages compliant with the CMRx format, specially developed for compact transmission of satellite information. The messages are finally routed to either a satellite uplink station or made available for Internet connection access by the users.
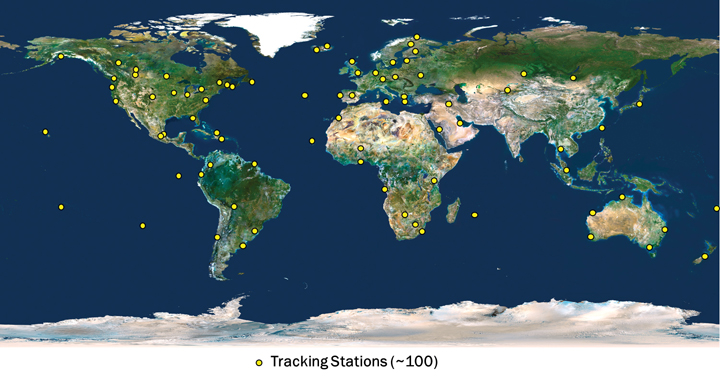
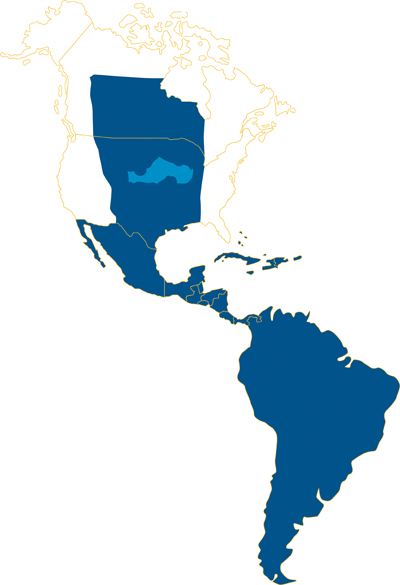
The CenterPoint RTX tracking network currently consists of around 100 stations, distributed across the globe, as shown in Figure 2. The CenterPoint RTX service is currently offered in North and South America, via satellite link, as indicated in Figure 3. Today the CenterPoint RTX service has been made available globally for all those with Internet access.
FIGURE 2. CenterPoint RTX tracking network distribution. (Click to enlarge.)FIGURE 3. CenterPoint RTX L-band satellite service coverage in the Western hemisphere.
Limiting Factors
To understand the limiting factors associated with global high-accuracy positioning, it is helpful to consider the simplified basic GNSS observation equations for carrier-phase and code measurements:
Φi=ρ+c(dT−dt)+T−Ii+λi Ni,
+Ai−ai+λi(WΦ−wΦ)+BΦ,i−bΦ,i+MΦ,i+nΦ,i
and
Pi=ρ+c(dT−dt)+T+Ii,
+Ai−ai+BP,i−bP,i+MP,i+nP,i
where:
Φi is the carrier-phase measurement for frequency i in meters;
ρ is the geometric distance between the antennas of the receiver and satellite in meters;
c is the speed of light constant in meters per second;
dT is the receiver clock error in seconds;
dt is the satellite clock error in meters per second;
T is the slant neutral atmosphere delay in meters;
Ii is the ionospheric delay for frequency i in meters;
λi is the carrier-phase wavelength for frequency i in meters;
Ni is the integer carrier-phase ambiguity for frequency i in cycles;
Ai is the combined receiver antenna offset and directional variation correction for frequency i in meters;
ai is the combined satellite antenna offset and directional variation correction for frequency i in meters;
WΦ is the receiver antenna phase wind-up effect, in cycles;
wΦ is the satellite antenna phase wind-up effect, in cycles;
BΦ,i is the carrier-phase receiver bias for frequency i in meters;
bΦ,i is the carrier-phase satellite bias for frequency i in meters;
MΦ,i is the carrier-phase multipath for frequency i in meters;
nΦ,i is the carrier-phase observation noise and other un-modeled effects for frequency i in meters;
Pi is the pseudorange measurement for frequency i in meters;
BP,i is the pseudorange receiver bias for frequency i in meters;
bP,i is the pseudorange satellite bias for frequency i in meters;
MP,i is the pseudorange multipath for frequency i in meters;
nP,i is the pseudorange observation noise and other un-modeled effects for frequency i in meters.
The feasibility of high-accuracy absolute positioning relies on the assumption that phase and code measurements on the different frequencies or on specific observation combinations are modeled quite reliably. This ultimately means that the parameters (or certain combination of them) of the two equations given are known very precisely, that is, with an accuracy of better than a few centimeters.
Having a global system where every component of the un-differenced GNSS observational model is well known requires advanced understanding and modeling of the involved GNSS-related effects. This is a general achievement of the RTX system.
(An extensive section here, encompassing satellite orbits and clocks, receiver clock error, antenna phase center odeling, phase wind-up effects, neutral atmosphere delay, and ionospheric delay, appears in the online version of this article, at env-gpsworld-integration.kinsta.cloud/rtx.)
Real-Time Network Processing
As previously stated, the RTX system works based on precise satellite information generated at processing centers and broadcast to users. The precise information employed by the systems comprises satellite orbits, satellite clocks, satellite biases, and other auxiliary information.
The requirements for the satellite orbits to be used in the global RTX system can be summarized as accuracy, continuity, robustness, and reliability. The satellite positions have to be accurate for obvious reasons, including the fact that orbit errors have direct impact on rover-position determination quality. Furthermore, because the RTX network process algorithms use ambiguity resolution, the reliability of the ambiguity determination is highly affected by the satellite orbits quality due to the distances between reference stations in the tracking network. The continuity requirement is put in place to avoid the need of handling observation modeling inconsistency over time for both network and rover processing.
For the same reason, the overall system employs techniques to properly handle switches between redundant orbit-processing servers without degradation of position quality. As one would expect, network processors have to be, in general, robust against the eventuality of poor data entering the system for various reasons. The RTX network processors employ a variety of quality-control techniques to ensure that only data with the highest expected quality is used for the computation of end products.
Finally, reliability is a very important factor for real-time orbit processing. At the current stage, the RTX real-time orbit processors are able to run for several months with virtually zero intervention from operators, while handling events such as satellites going through unhealthy periods and satellite maneuvers (during unhealthy period or not).
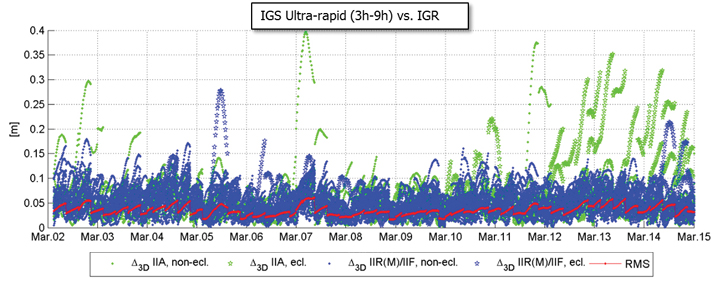
There are at least two strong reasons for justifying the need of implementing and running an RTX proprietary orbit processing server. The first one is simply the need of reliably meeting the above-mentioned requirements. The second one is that from an operational perspective, the RTX system is conceived in such a way that it does not rely on any external source of information to run at its full accuracy capability. Figure 4 shows the achieved orbit errors provided by IGS ultra-rapid products during two weeks of March 2011, where IGS rapid orbit products are used as truth. The ultra-rapid orbits are evaluated using the initial portion of the predicted arc, thus making use of the most reliable part of the predicted arcs as the products become available in real-time. In that case, neither accuracy nor continuity requirements for RTX processing are completely met.
FIGURE 4. IGS ultra-rapid orbit errors, as compared to IGS rapid orbit products.
Orbit Estimation. The orbit estimation in the CenterPoint RTX system is based on a combination of a UD-factorized Kalman filter estimating satellite position, satellite velocity, troposphere states, integer ambiguities, solar radiation pressure parameters, harmonic coefficients, and Earth-orientation parameters. The prediction step in the filter uses a numerical integration of the equations of motion in connection with a dynamic force modeling. Forces considered in the approach are: the Earth’s gravity field, lunar and solar direct tides, solar radiation pressure, solid earth tides, ocean tides, and general relativity.
In RTX orbit processing carrier phase integer ambiguities are resolved in real-time. Also, the satellite orbit states are truly estimated in real-time and continuously adapted over time to better represent the current reality. This means that the satellite positions that are evaluated by the user have prediction times of no more than a few minutes since the last orbit processing filtering update, providing negligible loss of accuracy. Figure 5 shows the orbit errors obtained from the RTX orbit processor. Similarly to the previous figure, IGS rapid orbit products are used as reference. The time span is also the same as in the previous figure. The RTX real-time orbit components have a typical overall accuracy of around 2.5 centimeters (cm), and a 3D error accuracy of around 4 cm, considering IGS rapid products as truth.
FIGURE 5. RTX real-time orbit errors, as compared to IGS rapid orbit products.
Clock Estimation. Satellite clock estimation forms an essential part of the RTX system. It plays a fundamental role on positioning performance due to a number of reasons. Satellite clocks map directly into line-of-sight observation modeling, yielding into a one-to-one error impact from clocks into GNSS observables modeling. Due to the same strong relationship, it is of fundamental importance that clocks are generated in a way to facilitate ambiguity resolution within the positioning engine. The processing speed of a clock processor is also of critical importance, due to the fact that any delay in computing satellite clocks is directly translated into correction latencies when computing real-time positions on the rover side. For that matter, one should keep in mind that regardless how late satellite corrections get to the GNSS receiver in the field, positions have to be provided to the user as soon as the rover GNSS measurements are available. Therefore latencies typically introduce errors into the final real-time position. In this article, we define real-time positioning as the computation of positions at the time when the rover observables are available, regardless of the latency of the correction stream. This is a necessary concept in order to support dynamic rover GNSS positioning.
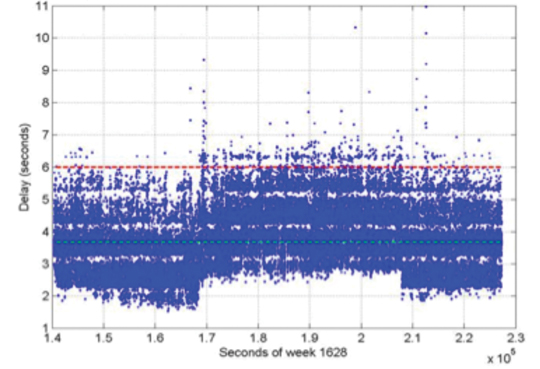
The RTX clock network processor was designed around the requirements discussed earlier. It computes clocks that are compatible with ambiguity resolution on the user receiver. As a matter of fact, the clock network processor itself employs ambiguity resolution for the generation of the RTX clocks. The processor architecture is based on an innovative design that allows processing data of several hundreds of reference stations, including all necessary steps such as data quality control, ambiguity resolution, and the final clock generation, within a fraction of second. The processing time of this kind of real-time network processor has to be minimized as much as possible in order to allow the processor to operate at 1 Hz, and to minimize the final correction latency at the rover end. Note that the final latency of the correction stream is a composition of three basic components: the time for the network data to arrive at the network processing server; the network processing time; and the correction transmission time to reach the final user. Figure 6 shows the typical total correction latency for the RTX system, when corrections are broadcast through a satellite link.
FIGURE 6. Typical RTX correction stream latency. The dashed green line represents the latency at 50 percent (3.7 s), and the dashed red line represents the latency at 99 percent (5.6 s).
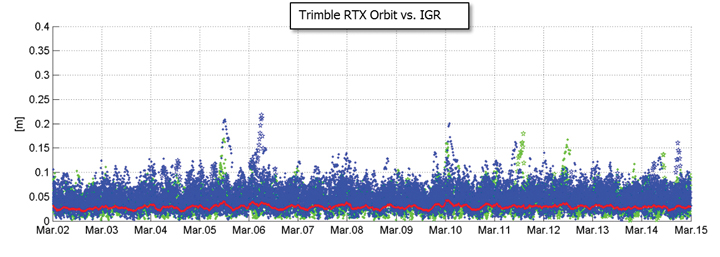
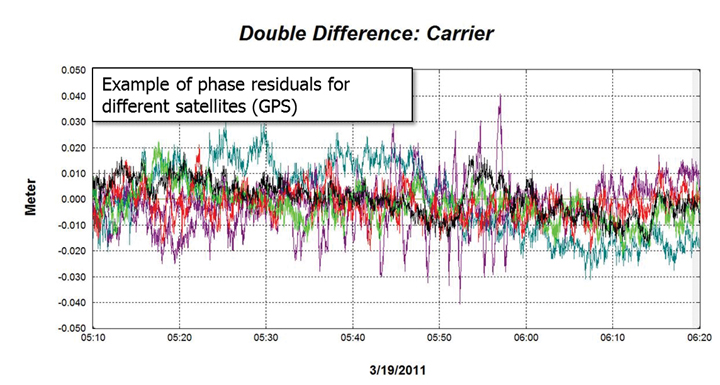
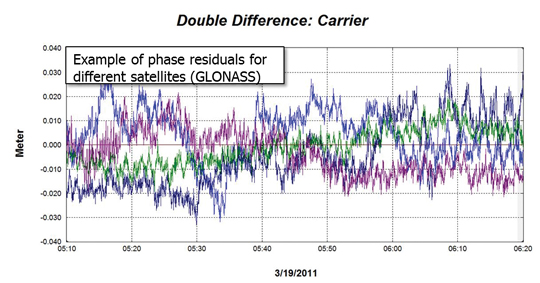
Unlike satellite orbits, satellite clock solutions are more difficult to compare directly. This is because different clock solutions might have offsets between each other, as well as behave differently due to differences in their GNSS reference time realization process as well as in their observation modeling approaches. That said, one way of verifying the quality of satellite clocks is to quantify how well it can be used to model actual receiver observation data. This can be in general achieved by applying satellite orbit and clock correction onto GNSS data and verifying the remaining residuals. Other quantities such as receiver coordinates have to hold their correct values for the residuals to be meaningful. In this case, the combined satellite orbit and clock error are assessed, and not just the satellite clock alone. For our purposes this is perfectly fine, since this is the way orbits and clocks are employed in rover positioning as well. Figures 7 and 8 show typical combined satellite orbit and clock errors at line-of-sight for different satellites. Figure 7 shows the ionospheric-free phase modeling error for GPS satellites, while Figure 8 is for GLONASS. Note that observations of a reference satellite (highest elevation at the time of observation) were reduced from the others. This was done in order to remove the receiver clock errors from the residuals. For both GPS and GLONASS cases, the observation modeling error after using RTX orbit and clock corrections is on average at the 1 cm level, with values typically less than 2 cm. The GPS satellite with outlying behavior in the plot below was setting at that time, and the increased amplitude of the residuals is mostly due to receiver observation errors such as multipath.
FIGURE 7. RTX clock quality (GPS) by means of corrected ionospheric-free phase measurements.FIGURE 8. RTX clock quality (GLONASS) by means of corrected ionospheric-free phase measurements.
Communication and Positioning
Once all satellite information is available, it must be compressed in a message that can be broadcast to the user in the field. The transmission of global corrections can be done in different ways, such as via Internet, in case the user has access to it, or using a satellite link. In the latter it is customary that corrections sufficient to cover the transmission satellite footprint are broadcast, rather than corrections complete enough to cover the globe. Firstly, because it is expected that users operating inside the satellite footprint will use the corrections only for that region, and secondly because bandwidth restrictions usually play a role in message design for satellite-based communication. The bandwidth restrictions not only enforce maximum bandwidth utilization below a certain limit, but also require that the utilization over time is homogeneous to ensure optimal usage of the satellite channel.
Furthermore, satellite signals are typically susceptible to frequent message-packet losses depending on the user environment, such as when a receiver is running under canopy. To mitigate packet losses, the message must be built in such a way as to allow the rover to continue operations with minimum loss of availability. In that case not only the message design has to foresee this type of situation, but also the message decoding, usage, and positioning algorithms have to be optimized to most favorably couple with the received messages. All these factors have been taken into account in RTX system communication design. A new message format was created to carry information on satellite orbits, clocks, observation biases, and other auxiliary information. The new RTX CMRx satellite messages deliver 1-millimeter resolution for satellite orbits and clocks.
The RTX positioning engine inherits several technological aspects from Trimble’s pre-existing RTK engine. This aspect makes the RTX positioning mode, and traditional RTK positioning modes (for example, single base, virtual reference station) easy to co-exist. Among other things, the new engine has been thoroughly tested and optimized for challenging tracking environments. In these scenarios the engine is presented with observation data collected with a high level of multipath and low signal-to-noise ratio, often producing cycle slips and gaps in the data. As previously mentioned, at the same time the correction stream also suffers packet losses and the correction data might not be completely available during certain masking conditions.
Positioning Performance. The RTX engine delivers typical final accuracies at 1–2 cm level for horizontal positioning, and 2–4 cm for vertical, 1-sigma. The final convergence of the system is achieved in 10 to 45 minutes after receiver startup. The time to converge might depend on several aspects, including satellite geometry and multipath conditions.
To overcome the increased convergence time as compared to traditional RTK systems, a number of features have been implemented as part of the RTX positioning engine, two of which are worthy of mention here. The Fast Restart feature allows users to power up or place the receiver at a known location and immediately obtain a converged solution. This is also applicable when users have not moved their equipment since the last RTX solution. This feature is quite valuable in agriculture applications, where the user typically does not move the tractor between RTX-steered field work activities, thus avoiding in the majority of cases the need to wait through a new convergence period before starting work, one or more days after the last system usage.
The second feature is also related to avoiding system re-convergence. The Bridging feature, an outage recovery capability, enables the RTX positioning engine to immediately recover from a complete constellation outage with loss-of-lock during any dynamic activity. This prevents the system from entering a new convergence phase in case the receiver loses track of up to all satellites in view, coupled with outages of up to a couple of minutes, such as when running behind a tree line, or under a bridge.
Accuracy
Horizontal position error obtained in real time in a receiver acquiring the RTX correction data through the satellite link in North America is shown in Figure 9. The receiver was running continuously for several days, and was located in Ames, Iowa. As displayed, the horizontal RMS was 1.4 cm, with a 95 percent horizontal error of 2.4 cm. These are typical values for satellite-based RTX horizontal performance.
FIGURE 9. RTX real-time horizontal positioning performance. Results obtained from a receiver operating in Ames, Iowa.
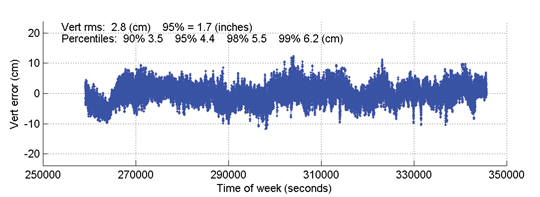
Figure 10 shows the vertical performance for the same receiver and time period: the vertical RMS was 2.8 cm, with 95 percent vertical error of 4.4 cm.
Time to Achieve Convergence. Convergence is directly connected to the level of productivity that can be achieved for actual field applications. In the following example a continuously powered RTX receiver was used to show an assessment of the RTX (re-)convergence capability. The receiver’s tracking of all satellites was disabled every hour by an antenna switch. Each outage lasted three minutes, during which times no GNSS satellites were tracked.
FIGURE 10. RTX real-time vertical positioning performance.Results obtained from a receiver operating in AMES, Iowa, US.
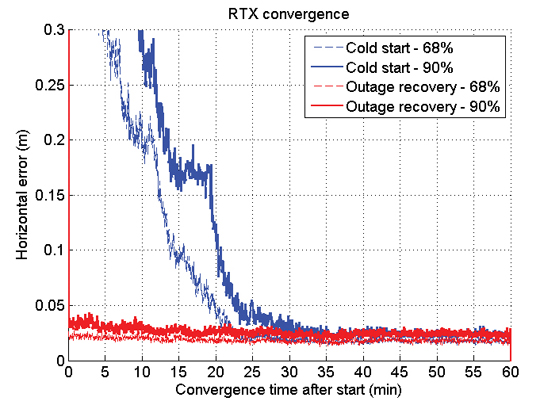
This procedure was repeated hourly for several days in order to gather enough performance runs to derive meaningful statistics. Figure 11 shows the resulting performance of this assessment. The standard cold-start re-convergence performance is indicated with blue lines, where the solid lines represent 90-percent performance and the dashed line represents 68-percent performance.
As the figure shows, the RTX system converged to better than 5 cm horizontal error after 20 and 25 minutes for 68 percent and 90 percent of the runs, respectively. Convergence time is correlated with a number of aspects, including satellite geometry and multipath environment. Because of these variations, the claimed RTX convergence time is between 10 and 45 minutes for full accuracy achievement.
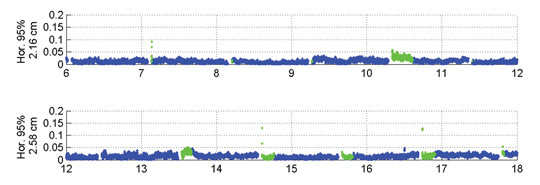
The red lines in Figure 11 indicate performance obtained with a second receiver, connected to the same antenna, and thus subject to the exactly same GNSS signal outages. This second receiver had the Bridging functionality enabled, and thus is expected to bridge the outages and phase cycle slips without resetting the positioning solution. The red lines confirm that the desired behavior is achieved. To better visualize what happens over time in this case, Figure 12 shows a few hours of the real-time results obtained with the receiver running with the Bridging functionality activated.
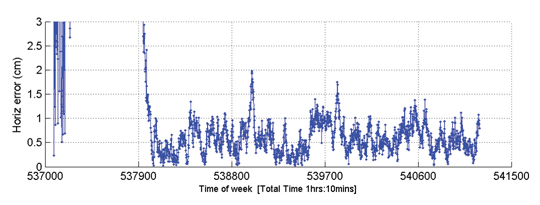
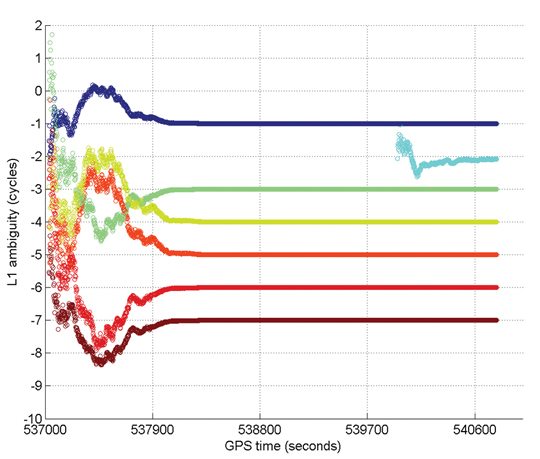
Figure 13 gives an example of Internet protocol (IP)-based RTX performance. This is a single run where the system converged to better than 5 cm (horizontal) in approximately 15 minutes. Figure 14 shows how the L1 ambiguities of individual satellites in view during that time converged.
FIGURE 13. RTX IP-based run example.FIGURE 14. Example of ambiguities convergence during an RTX IP-based run.
In these two plots, positioning convergence is, as expected, highly correlated with the ambiguities convergence to their final integer values in cycles. Note that satellites that come in after the overall solution is converged (for example, in light blue) achieve their final ambiguity values much quicker than during the position convergence phase, also as expected. The proprietary algorithms used for ambiguity resolution and validation in RTX allow the ambiguities to reliably converge to their integer values. Arbitrary integer number of cycles have been removed from the original ambiguity values to allow better simultaneous visualization of the ambiguities for several satellites.
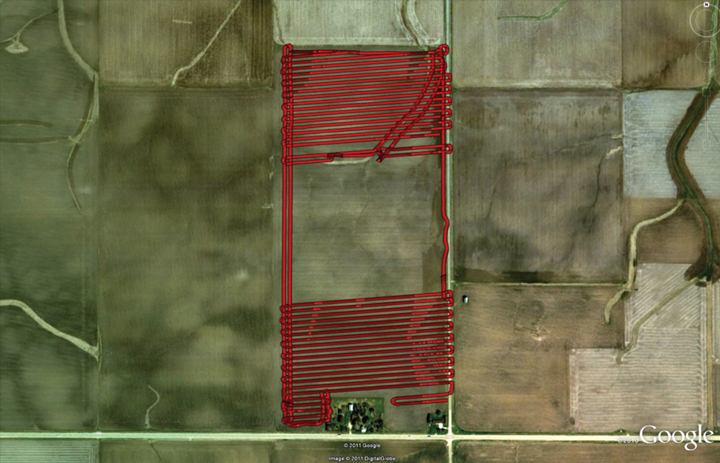
Optimizing the RTX system to work under different scenarios was necessary because the multipath and signal availability levels are reasonably different between running an antenna with a reference station setup and the actual user environment, where the data tracking conditions impose additional challenges on making high-accuracy positioning effective on a global basis, in a productive manner. Therefore, an extensive field test campaign was conducted during the pre-release phase of the RTX system. The next example shows RTX in-field performance for an precision agriculture application in Illinois. The setup is typical for agricultural use, with the antenna and receiver mounted on a tractor that ran for about 103 minutes. Figure 15 shows theactual track of the tractor; RTX corrections were received via satellite link.
FIGURE 15. RTX tractor field test track in Illinois.
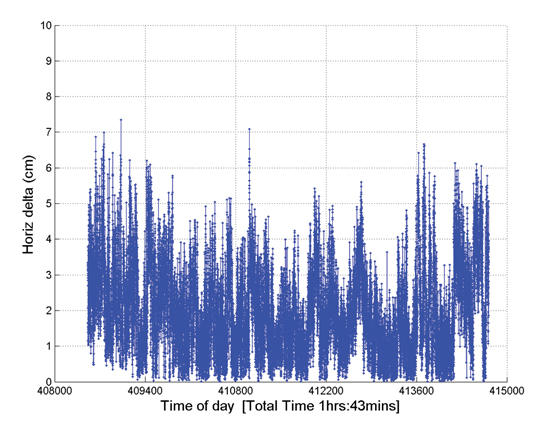
The horizontal positioning performance for that field test can be seen Figure 16. The overall 2D RMS was 2.3 cm and the 95 percent horizontal error was 4.2 cm. Note that this position difference plot is between the RTX solution and a short-range single baseline (SBL) RTK solution providing truth. Therefore the numbers and plot actually show a combination of errors between the global RTX solution and the SBL solution to the local reference station.
FIGURE 16. Horizontal positioning results for a real-time RTX tractor field test in Illinois.
Nevertheless the error magnitudes achieved lie within the same range as in the previous assessments shown here.
Summary
RTX positioning brings together the advantages of positioning techniques that do not require local reference stations while providing the productivity of RTK positioning. Its deployment introduces innovations in GNSS network processing, as well as advancements in the rover global positioning algorithms.
RTX employs ambiguity resolution on a global scale for both network and rover processing, including GPS and GLONASS satellites in the solution. The delivery of this new technology is achieved through the CenterPoint RTX positioning service, capable of providing world-wide real-time centimeter-level accuracy without the direct use of a reference station infrastructure.
A longer version of this article was presented at the 2011 ION-GNSS conference in Portland, Oregon.
Rodrigo Leandro, Herbert Landau, Markus Nitschke, Markus Glocker, Stephan Seeger, Xiaoming Chen, Alois Deking, Mohamed Ben Tahar, Feipeng Zhang, Kendall Ferguson, Ralf Stolz, Nick Talbot, Gang Lu, Timo Allison, Markus Brandl, Victor Gomez, Wei Cao, and Adrian Kipka are members of the Trimble Engineering Team in Höhenkirchen, German
This discussion of current trends in location-enabled mobile devices takes as its foundation the different operating systems (OSs) for those devices. Why? For GPS/GNSS hardware units to be useful, there have to be software applications — apps — also riding on those units. Apps are totally dependent on the operating system. An analogy is that the operating system is the foundation of a house and the app is the house itself. The type of foundation you have drives what type of house you can build.
For example, no one is going to write an app today for Palm OS because that OS is essentially dead. While that’s an obvious one, a not-so-obvious one is Microsoft Windows Mobile. Most apps written for professional users are written in Windows Mobile, but Microsoft hasn’t done a good job of communicating its intentions regarding Windows Mobile, so users and developers think Microsoft may abandon it.
On the other hand, Android is gaining so much momentum. Will developers rewrite their apps from Windows Mobile for Android? Or for Apple’s iOS? Can they afford to? Can they afford not to? If they don’t, that would mean that fewer professional apps will be available for Android and iOS users. Will that mean Windows Mobile will be the OS for professional GPS/GNSS users, and conversely, will Android/iOS be the OS for consumer-level GPS/GNSS users? Taking it to a practical conclusion, according to the type of mobile computing device that you purchase, what kind of location application will you be able to use?
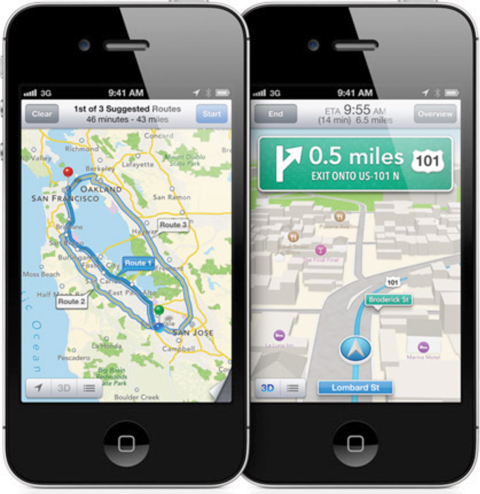
Smartphones. Apple iOS’s new Maps app will likely be the largest scale crowd-sourced app ever introduced.
PNDs Out-Smarted
For the past decade, GPS personal navigation device (PND) sales have burned white-hot. In 2007, Garmin experienced double- and triple-digit growth, selling more than 10 million units. TomTom grew from zero to hero and sold more than 9.5 million units in that same year. During that brief golden era, every consumer electronics company who was anyone took a stab at introducing a PND to get a piece of the action. As unlikely as it seems, Garmin and TomTom stayed on top, fighting off consumer electronic giants like Sony, Panasonic, Hewlett-Packard, and Philips, all orders of magnitude larger. PNDs ruled the GPS world during that era.
Download a PDF of our Mobile Computing Product Showcase.
At the height of that period of explosive GPS PND growth, Apple introduced a new generation of smartphone, the iPhone, in January 2007. At that time, there were approximately 17 million smartphones on the market. Nokia with its Symbian operating system led the pack at 63 percent of worldwide market share, Blackberry was the rising smartphone of choice, while Microsoft Windows Mobile operating system captured 18 percent. Google’s Android operating system had not yet debuted.
It’s amazing how a mass-market technology, so personal to us all, can change so quickly. Today, Google’s Android operating system dominates the smartphone market (roughly144.4 million smartphones were sold in Q1 alone of 2012, according to Gartner Research) with a 56.1 percent share. Apple’s iOS follows at 22.9 percent; Symbian (Nokia) has fallen from leader to bit player at 8.6 percent, and keeps company in the low rungs with RIM/BlackBerry (6.9 percent), Samsung’s Bada (2.7 percent), and Microsoft Windows (1.9 percent).
The trend is clear. Android and iOS are cleaning up at the expense of all the others. Is it any coincidence that these two are the ones making the most of their maps and nav? More on this in a moment.
By the way: every one of the 144.4 million smartphones that shipped in the first three months of 2012, no matter what operating system it ran on, carried a GPS receiver inside, typically a chipset from Broadcom, CSR/SiRF, u-blox, Qualcomm, or Texas Instruments. That spells trouble for Garmin and TomTom. Google and Apple are doing to Garmin and TomTom what Microsoft did to NetScape with Internet Explorer.
Even with GPS PND prices at an all-time low, Google’s Navigator, with high-quality, PND-like turn-by-turn street navigation, is included on Android smartphones free of charge. Apple is following suit. Just last month, Apple introduced the Maps app for turn-by-turn street navigating as well as real-time traffic information. With more than 100 million iPhones behaving like traffic sensors, Apple’s Maps app will likely be the largest scale crowd-sourced app ever introduced.
What does this mean to Garmin and TomTom? The numbers don’t lie. In February 2012, TomTom reported a 40 percent decrease in GPS PND sales for Q4 2011 compared to Q4 2010.
Tablet Computers
For another wild ride, take a look at the tablet-computer market. The tablet has been around for many years. I remember playing with them in the 1990s when they were horribly expensive ($3,000–$5,000). The price, a limited outdoor-viewable display, and power usage all combined to squash unit sales. Only a few manufacturers such as Fujitsu had the determination to stay. That all changed in 2010 when Apple introduced the iPad.
Prior to the iPad rollout, tablet computer sales were limited primarily to business users. Healthcare provided a particular arena for Fujitsu and others to focus on, and there were a few other markets that were not very price-sensitive, and so receptive to the tablet. The iPad blew away that $3–5K price point (iPad 2, $629) and brought the tablet experience to the average consumer. The result? Roughly 67 million units sold since its introduction, far surpassing all tablet computer unit sales in history in just two years. Apple hit a sweet spot, for sure.
The iPad catalyzed the tablet industry for two reasons:
It opened the eyes of the consumer to the applications of a tablet computer.
It drove the price-point expectation of all tablets down.
Of course, the iPad has its limitations. It runs Apple’s proprietary operating system, iOS, so you are limited to the number of apps written for that platform. It also lacks horsepower to run more challenging programs that an Intel or AMD-based computer can breeze through. From a GPS/GNSS perspective, certain models of the iPad sport a GNSS chipset (from Broadcom) similar to mobile phones; however, because of the way the GPS functionality is designed into the system, accuracy is limited to a few meters at best. Power GPS/GNSS users would love it if Apple would implement serial port profile (SPP) in its Bluetooth software. Then, GPS/GNSS users could attach any Bluetooth-compliant GPS/GNSS receiver they like, even RTK-capable receivers for centimeter-level accuracy. But Apple doesn’t seem interested.
As in the mobile-phone market, Google is making a strong tablet play with its Android operating system. Google’s device-agnostic operating system is attracting tablet hardware makers in droves with iPad-like tablet computers, notably Samsung Galaxy (with GPS) and Amazon Kindle Fire (no GPS). Also, there’s an interesting link between mobile phones and tablets. Gartner reports that 40 percent of user apps run on both mobile phones and a corresponding tablet computer. This is significant because the operating system may well drive the tablet purchase. For example, a person with an iPhone is more likely to buy an iPad than a Samsung Galaxy, which runs Google Android.
However, Android has not achieved the dominance in the tablet computer space that it has in smartphones. iOS (iPad) held 67 percent market share in 2011, falling to 61 percent in 2012,but still retaining the pole position. Android is a strong second with 29 percent in 2011, rising to 32 percent in 2012, according to Gartner. No other operating system even comes close.
Gartner forecasts show that Android will eventually approach iOS in market share, and my guess is that it will overtake iOS within five years. Apple’s proprietary system will catch up to it. While GPS/GNSS chipsets aren’t as widely integrated in tablets as they are in mobile phones, that will change as GPS/GNSS use becomes even more ubiquitous. Further, there are plenty of ways to add GPS to a non-GPS model via Bluetooth, PCMCIA, and USB.
Android supports Bluetooth SPP, or a derivation of it, so you can connect any Bluetooth SPP-compliant GPS receiver that you like and not be limited to the receiver chipset the tablet engineer decided to design into the system.
]Although PDAs have an embedded receiver, they are lower-precision systems, in the 1- to 5-meter range, largely due to poor antennas. For higher precision requirements, these are used as field data collectors connected to an external antenna and/or a high-precision GPS/GNSS receiver.Handheld PDAs
Handheld personal digital assistants (PDAs) were all the rage 10 years ago when Compaq Computer Corp. introduced the iPAQ H3100 running Microsoft’s PPC2000 (Pocket PC) operating system, the precursor to Microsoft’s Windows Mobile operating system. The iPAQ made a strong run through 2009, with the last models running Windows Mobile 6 before smartphones became powerful enough to negate the purpose of the PDA.
While we probably will never see another introduction of a new iPAQ-branded PDA, it was a useful device and an inexpensive handheld for interfacing to GPS/GNSS receivers. Albeit a niche market, there’s still a demand for such handhelds for field data collection.
According to the nature of capitalism, where there’s a demand, suppliers will show up. Since the iPAQ has faded, and smartphones aren’t yet well-suited as field data-collection devices, a new breed of semi-rugged and rugged PDAs has emerged in the past year from small, niche-oriented companies. Examples include the SXPad from Geneq, Juno 3 series from Trimble, and the Mesa/Rampage 6 from Juniper Systems/SDG Systems.
These devices, with GPS/GNSS receivers embedded, are not built for the average consumer. Their prices are higher — but coming down — and they are more rugged; some are water-resistant, some waterproof.
In a nutshell, PDAs went professional, targeting organizations that need maximum data-collection productivity from field personnel. Although they have an embedded receiver, they are lower-precision systems, in the 1- to 5-meter range, largely due to poor antennas. For higher precision requirements, these are used as field data collectors connected via Bluetooth to a high-precision GPS/GNSS receiver.
Although the professional PDA market is not immune to the operating-system wars we’ve seen in mobile phones and tablet computers, it’s a bit stickier. Professional data-collection apps have been written almost exclusively around the Microsoft Windows Mobile operating system. These niche software programs are written for relatively small audiences (compared to the mass-market apps on smartphones), and it can be economically tough to justify porting the apps to iOS or Android. Therefore, the professional PDA market has been slower in adopting iOS and Android.
Microsoft hasn’t helped the cause. It stopped certifying new products with the Windows Mobile operating system, creating confusion in the user community. Is Microsoft exiting the mobile device business? Not according to the company. It appears that it has split the mobile device business into two operating systems. Smartphones will run Windows Phone, and other mobile devices will run Windows Embedded Handheld, which is compatible with Windows Mobile.
The problem, the confusion, and the frustration come from the fact that the Windows Phone operating system is not compatible with Windows Mobile (or Windows Embedded Handheld). Microsoft split the market between smartphones and other Microsoft-driven mobile devices. Given Gartner’s research that 40 percent of users’ smartphone apps also run on a tablet device, this means that Microsoft is going to either change that dynamic or suffer the consequences.
No matter which direction mobile devices take, be it phone, handheld, or tablets running Android, iOS, Windows, or something we haven’t yet seen, embedded GPS/GNSS functionality will remain the centerpiece of location technology in all mobile devices. Even more exciting are the new GNSS signals and constellations in the next five years that will bring unprecedented accuracy to all mobile devices, driving the development of a tremendous number of new apps to exploit the improving accuracy.
Eric Gakstatter is contributing editor for survey at GPS World magazine and the editor of Geospatial Solutions. He has spent the past 20 years in the GPS survey/mapping industry, using many brands of GPS equipment and software. He is a non-partisan advocate for the GPS user community, and a frequent speaker at user and technical conferences.
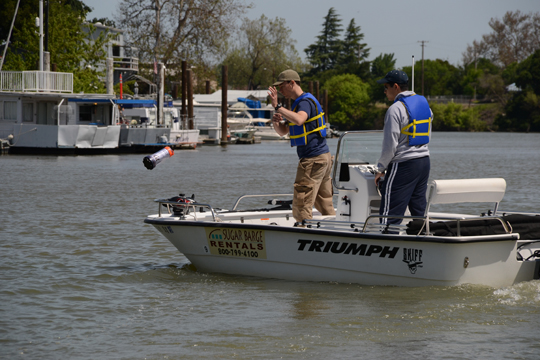
UC Berkeley researchers have developed a method to provide real-time, high-resolution data in hard-to-map waterways, using GPS. Tossing a robot is Andrew Tinka, with Kevin Weekly. (Photo courtesy of Jérôme Thai.)
By Tracy Cozzens
A fleet of 100 robots equipped with GPS and sensors were released May 9 into California rivers to measure water flow, salinty levels, and pollution. The Floating Sensor Network is a project by the University of California, Berkeley, to improve the way water quality and flows are monitored.
About two-thirds of California’s fresh water is in the Sacramento-San Joaquin river system where the test took place. This water supplies about two-thirds of the state’s population with drinking water and irrigation. The initiative is led by associate professor Alexandre Bayen at the Center for Informatin Technology Research in the Interest of Society (CITRIS).
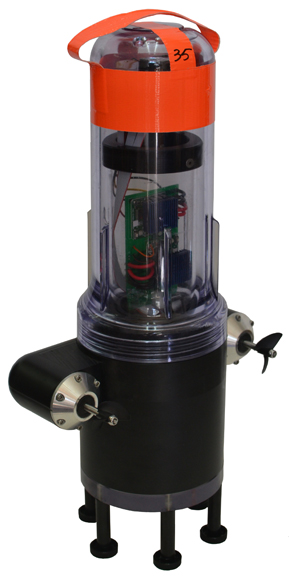
The robots each have a sensor to test salinity and a GPS unit from a smartphone. Some have propellers so they can maneuver around obstacles and reach specific destinations. The robots also sent Tweets to @fsnandroid61.
The robots drifted through the area of the river being measured, then were retrieved by boat. “One advantage of our real-time communication system is that we can see where all our sensors are on a map, which makes it very easy to chase them down and retrieve them,” said graduate student researcher Andrew Tinka.
With the first test completed, the team’s efforts over the summer have two priorities, Tinka explained. “First, we’re using the flow data that we gathered on May 9 to understand how this ‘mobile’ data can be best used for river hydrodynamics studies. We’re learning how to turn the individual traces of water that each sensor gives us into a big-picture view of the entire river region, sort of how like meteorologists take the data from a few weather stations and turn it into an overall view of what the weather is doing over a large area. Second, we’re working with other hydrodynamics research groups to expand the use of this kind of mobile sensor. We’re loaning our equipment to other groups, doing pilot projects with others, and basically trying to get these sensors into researchers’ toolboxes throughout the water community.”
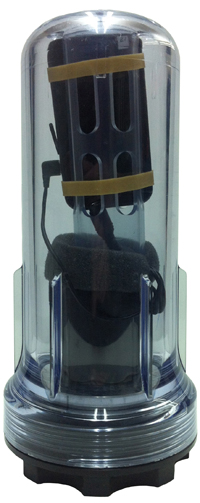
There are two types of devices in the fleet, active and passive. The active sensors have a twin-propeller drive system that lets them move through the water to avoid obstacles or stay in the correct region of the river. “We developed the internal electronics for this device ourselves,” Tinka said. “We integrated a Magellan AC12 GPS receiver along with a Gumstix embedded computer and a Motorola GSM module. Our passive sensors don’t have a propulsion system; they do exactly what the water does. We developed this system with a focus on cost and ease of assembly.” The team used a waterproof consumer smartphone, the Motorola Defy, for the GPS positioning, computation, and comunications.
So far, the test has proven the usefulness of such a network. The devices were developed to be easily deployable, especially where a lot of flexibility is needed, such as in disaster response. “The ability to quickly and easily put these sensors into new inland environments, by just about any method (throw them from a boat, drop them from a helicopter, toss them from a dock or a bridge) makes them a really useful new tool,” Tinka said.
photos courtesy of Jonathan Beardphotos courtesy of Jonathan Beard
A hundred robots, 40 with propellers, were released into the Sacramento River near Walnut Grove (photos courtesy of Jonathan Beard).
Likely none of us needs a reminder as the upcoming leap second has been all over the news outlets for the past few days. But just to provide the details again, read this article.
Presumably, all GPS receiver manufacturers have checked to make sure their receivers will handle the leap second properly. However, at least one late-model high-end receiver from a leading manufacturer is currently reporting incorrect advance leap second information in its data files.
The European Satellite Services Provider (ESSP), the EGNOS system operator and EGNOS safety-of-life service provider, announced in a service notice dated 22 May that there might be an interruption in service for a 72-hour period should the leap second not be managed correctly.
AGI, a company that develops commercial modeling and analysis software for the space, defense and intelligence communities, has warned: “The consequence of failing to accommodate this event is that orbit in-plane motion and corresponding Earth orientation will both become inaccurate by at least one second until the leap second is properly implemented. This will also affect estimating orbits using time sequences of observations spanning this leap second event. GEO satellites might be inaccurate to about 3 km and LEO satellites to about 8 km. How great the discrepancy will be depends on how long one waits to implement the leap second. The probable inaccuracies may be within the collision keep-out zones of many satellites, causing either false alarms or totally missed threat detections.”
And it has also been reported that some computer operating systemsmight hang due to improper handling of the leap second.
An article on the upcoming leap second for the popular press may be found here. And, in case you missed it, a recent Physics Today article on the leap second and its future can be found here.
Although the LightSquared issue seems to have waned, it’s like a virus in that it’s really difficult to erradicate it completely. However, Harbinger Capital Partners (LightSquared’s primary financial backer) and LightSquared are facing tougher problems than they have since they’ve started this adventure, not only from their technical foes but now from the U.S. Securities and Exchange Commission (SEC).
Earlier this week, the SEC filed fraud charges against Phil Falcone and Harbinger. In particular, the SEC alleges that:
Falcone fraudulently obtained $113.2 million from a hedge fund that he advised and misappropriated the proceeds to pay his personal taxes;
Falcone and two Harbinger investment managers through which Falcone operated manipulated the price and availability of a series of distressed high-yield bonds by engaging in an illegal “short squeeze;”
Falcone and Harbinger secretly offered and granted favorable redemption and liquidity rights to certain strategically-important investors in exchange for those investors’ consent to restrict redemption rights of other fund investors, and concealed the arrangement from the fund’s directors and investors; and
Harbinger engaged in illegal trades in connection with the purchase of common stock in three public offerings after having sold the same securities short during a restricted period.
“Not only are hedge fund managers expected to be savvy investors, they are supposed to serve the interests of their clients. Here, in addition to raiding a fund for personal benefit and cutting secret deals with favored investors, Falcone then lied to investors about what he had done,” said Bruce Karpati, Chief of the Asset Management Unit in the SEC’s Division of Enforcement.
Yes, it’s getting ugly. However, they aren’t giving up. I wouldn’t expect so after spending ~$4 billion on this project.
LightSquared’s latest proposal to the Federal Communications Commission (FCC) is a spectrum swap. Read the details of their proposal here. In fact, LightSquared was able to convince a group of your legislators to lobby the FCC in support of the spectrum swap.
“In the absence of a viable technical solution that would allow LightSquared to use its own licensed spectrum, we believe a spectrum swap is the most resourceful and efficient way to quickly expand broadband access nationwide,” wrote Reps. Jim Moran (D-Va.), Maurice Hinchey (D-N.Y.), Steve Rothman (D-N.J.), Rodney Alexander (R-La.) and Ander Crenshaw (R-Fla.), who all serve on the Appropriations Committee.
Seriously? Our own U.S. legislators want to trade for spectrum worth almost nothing for spectrum worth billions of dollars? Who’s side are these people on? Clearly, not the taxpayer. However, there’s little or no chance a spectrum swap is going to happen. It’s a dream that they ran up the flagpole so see who would salute it. I doubt anyone did, at least anyone of significant influence, and now the legislators can say they fulfilled their obligations (in exchange for ??) and no harm done.
Serious Technical Issues Still Exist
Aside from the serious financial, legal, and political challenges LightSquared faces, they are no closer to solving the GPS interference problems disclosed a year ago.
If you recall, the National Telcommunications and Information Administration (NTIA), a U.S. government agency tasked by the FCC to study the LightSquared/GPS interference issue, concluded:
“The federal agencies and LightSquared have invested significant time and resources to identify and analyze proposed solutions to address the impact of LightSquared’s planmned network implementations. Based on the testing and analyses conducted to date, as well as numerous discussions with LightSquared, it is clear that LightSquared’s proposed implementation plans, including operations in the lower 10MHz would impact both general/personal navigation and certified aviation GPS receivers. We conclude at this time that there are no mitigation strategies that both solve the interference issues and provide LightSquared with an adequate commercial network deployment.”
That pretty much says it all. While the “lower 10” the NTIA is likely a technically solvable problem, the cost of redesigning and redeploying GPS receivers across commercial, military, aviation, etc. markets to accomodate the lower 10 MHz is huge. It’s likely in the high tens of billions or even into the hundreds of billions.
The upper 10 MHz of LightSquared’s spectrum, there is no practical technical solution that exists. If there was one, even one that was close, LightSquared would be talking about it all day long. You can bet that many engineers from many different companies and agencies have been working to solve this technical problem since early last year, but no one has come up with any reasonable solution yet. Also, remember that the upper 10 MHz hammered the vast majority of all GPS receivers in existence, not just high-precision receivers.
The Way Forward
Without a technical solution to their GPS interference problem, LightSquared is stuck trying to convince regulators that it deserves to be gifted alternative spectrum since they couldn’t make theirs work. As I wrote earlier, I think the possibility of a spectrum swap is low, but the conversation may linger.
From now on, it’s clear that the technical discussion has disappeared. It’s turning into a pure political discussion. Even though the FCC received the NTIA’s recommendation to not allow LightSquared to proceed back in February, the FCC still hasn’t declared a ruling on anything regarding this matter. Some speculate that they won’t make a ruling before the U.S. presidential election this coming November in order to fly under the radar. For this reason, it would not be surprising to me if this issue hung in limbo for the rest of the year; dormant, but it’s still lurking, like a virus.
Last Monday, June 25, 2012, I was a guest on America’s Web Radio’s ACSM Radio Hour discussing the current LightSquared situation. It’s a good discussion (60 minutes). The podcast is a standard audio recording you can play on your MP3 player or listen to on your computer. You can download it here.
FCC Narrowbanding Rule
While we’re on the subject of the FCC, you might have heard about the Narrowbanding rule the FCC established some years ago. It’s going to kick in January 1, 2013. If you’re an RTK user who uses UHF or VHF radios, you’re likely going to be affected and should be aware of it. Following is a summary statement from the FCC:
“On January 1, 2013, all public safety and business industrial land mobile radio systems operating in the 150-512 MHz radio bands must cease operating using 25 kHz efficiency technology, and begin operating using at least 12.5 kHz efficiency technology. This deadline is the result of an FCC effort that began almost two decades ago to ensure more efficient use of the spectrum and greater spectrum access for public safety and non-public safety users. Migration to 12.5 kHz efficiency technology (once referred to as Refarming, but now referred to as Narrowbanding) will allow the creation of additional channel capacity within the same radio spectrum, and support more users.
After January 1, 2013, licensees not operating at 12.5 KHz efficiency will be in violation of the Commission’s rules and could be subject to FCC enforcement action, which may include admonishment, monetary fines, or loss of license.”
Essentially, the FCC is trying to increase the efficiency of the UHF and VHF radio spectrum so it can accomodate more users.
If you use UHF or VHF radios for RTK, you’ll likely need to upgrade or replace your UHF/VHF radio hardware. Be aware that this could be quite expensive.
Following are some relevant FCC documents on the matter: