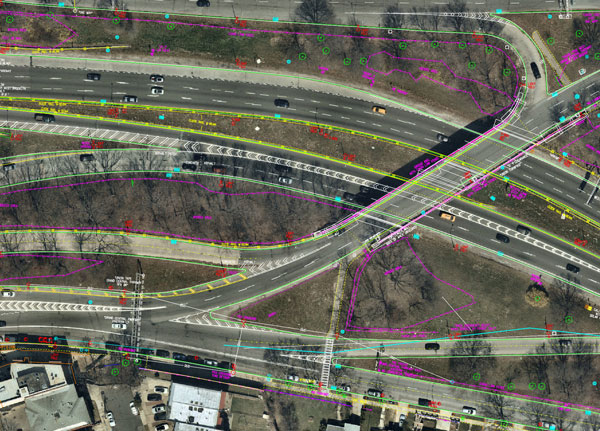
Nearmap aerial imagery is used as a basis for survey linework. Photo: Nearmap
With Congressional approval of $17 billion in infrastructure funding, the largest single allocation ever, the scramble to win contracts is about to get red hot and AEC firms are gearing up. In this very competitive game, top engineering firms are relying on their experience, technology, business acumen and ability to execute.
Advances in aerial mapping play a key role in how AEC firms pursue these contracts. Savvy firms have been using this technology for years. Rather than rely on lower resolution satellite imagery or local drone imagery, they use wide-area-coverage aerial maps to clearly display the detail needed to plan and execute.
Over the past decade, maps made using aerial photogrammetry have played an important role in the AEC space. Using high-performance cameras, fleets of planes capture hundreds of square miles per plane per day, provided that the weather is clear. The imagery is processed and made available to engineering companies within days of capture, allowing them to see very clear imagery.
AEC organizations use different forms of aerial maps to evaluate sites, improve their survey designs, and build and maintain infrastructure (roads, highways, bridges, tunnels, overpasses, rail, airports, housing, commercial building development, water resources, parks, pavement and more). Imagine you’re a state or local government that needs to build a bridge, or a developer who wants to contract with an engineering and construction firm to build affordable housing. Why travel to perform time-consuming site evaluations when you can meet with engineering teams in your office and review hundreds of potential sites instantly using current aerial photos that show change over time?
The engineering teams point out elevation changes, the presence and height of vegetation, neighboring communities, bodies of water, ponding and more. They easily navigate from one location to another as you discuss where the entrance to the community could be, how the road network might be configured, and the proximity to retail, schools and healthcare. Within minutes you measure risk, understand the landscape, make decisions, and begin to estimate the project costs. Your teams collaborate, discuss the pros and cons, measure distances and navigate across the terrain virtually.
Aerial mapping provides a competitive advantage for AEC companies to win their fair share of the infrastructure bill. It also gives governments and developers the confidence they need to make the right decisions. Typically, this involves looking at sites from all angles. The classic form of aerial mapping used by engineers is a top-down perspective. Increasingly, these organizations have used oblique imagery captured at an angled perspective, which shows height.
Artificial Intelligence and Aerial Photography
Starting a few years ago, 3D imagery and digital surface models began to allow engineers to navigate through the imagery and query it based on elevation. More recently, aerial mapping has leveraged artificial intelligence (AI) to classify properties and the landscape. Do you need to see nearby construction sites? AI applied to aerial photography can do that automatically. This rich set of data includes attributes such as tree overhang, roof condition, roof material, building footprints, vegetation height, surface material, swimming pools and even solar panels.
The blend of all these imagery types and AI into a single solution makes everything discoverable. Users can search by address, city, location or point of interest. They can visualize the imagery along with lat/long coordinates and quickly switch from top-down views to obliques to 3D. As they learn more about the landscape, they begin to turn on AI attributes, gaining deeper insights.
Sometimes, the analyses go even further. Engineering organizations export the imagery to tools of their choice from such companies as Autodesk, Esri or Bentley Systems, use field-collected ground control points to ensure that it is survey grade, then use it as a base layer for their designs. They even create marketing presentations and video content to help them win the business. Current high-resolution aerial maps have become a cornerstone of how these organizations operate.
This approach provides unique advantages for engineering firms. For example, they can combine geospatial and construction datasets in a common operating environment to reduce complexity, streamline communication, ensure that all stakeholders are up to date, and check their progress toward meeting contractual obligations.
Planners have current, contextual designs and models to make accurate decisions about planning and development activities. They can view asset locations and conditions to facilitate maintenance and upgrades, leverage aerial maps inside other platforms to improve work orders and reduce field visits, and ensure regulatory compliance.
Whether it’s improving highway safety, constructing ferry terminals, improving transportation systems, developing land or building a network of recreational trails, aerial imagery provides engineering and construction companies with a competitive advantage to win new business, improve client satisfaction and meet growth targets. With $17 billion on the line, sophisticated firms are finding a way to secure their fair share of the pie.
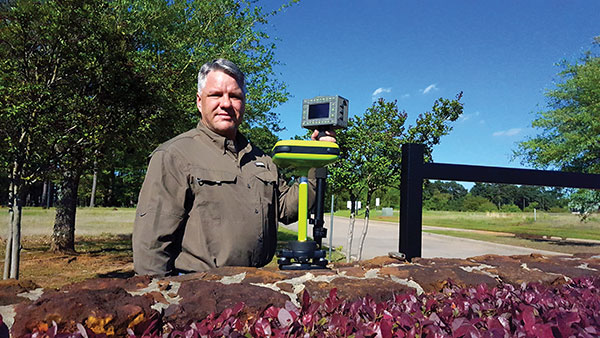
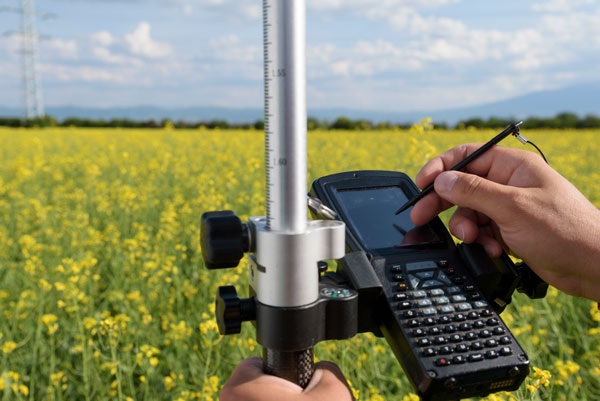
Shawn Billings, RPLS, reinvests some of his profits in surveying gear, like this JAVAD GNSS unit. (Photo: Rebecca Billings)
By Shawn Billings RPLS, Proprietor, Pendulum Surveying and Dealer
The AEC industry relies on surveyors to be a bridge between the existing landscape and the design landscape. Surveyors have been providing virtual reality for centuries, albeit in a mostly analog way, until very recently.
Imagine that a school board needs a new school. It describes the need to an architectural or civil engineering company, which develops a conceptualized plan. Next, it is time to figure out how to adapt this rough concept to the real world. Will the school fit within the boundaries of its district’s property? How will it access public rights-of-way? Can the current roads accommodate the traffic it will bring? How will the school access utilities? How will the building impact existing stormwater drainage? How do various data collected by others (such as geotechnical and wetlands delineation) fit into the site plan?
The data collected by the surveyor inform the designer, usually in the form of a map — historically on paper, but now in digital form. Most designers want the key features extracted rather than a dense point cloud, so it is important for surveyors to be able to understand what those key features are.
AEC surveying differs from boundary surveying in several ways. First, it usually requires consideration of a 3D world, not only two dimensions. Secondly, it will usually involve many thousands of points, not a few tens of points as is usually the case in boundary surveying. Third, AEC surveying will typically involve many more stakeholders. Fourth, the liability in AEC surveying will usually (but not always) be greater because of the significant costs involved.
AEC surveying can be challenging because the timeframes are typically tight, with numerous professionals involved. Surveyors will often have to wait on others one day, only to be rushed the next day once the ball moves into their court. However, the tools available to us today allow us to collect data much more quickly than we ever could before.
Today, I can carry almost everything I need to survey in a compact car—my Javad GNSS real-time kinematic (RTK) system, my robotic total station, my handheld electronic distance measuring device, my laptop computer, my smartphone (which provides internet access), my digital camera, my lidar and my photogrammetric drone, as well as the accessories needed for each device. All these devices have become more portable, more powerful, and less expensive. The gains in efficiency have reduced fieldwork by more than half over the past couple of decades, requiring fewer people and generally providing much better quality data.
Today, it is rare for a surveyor to provide paper deliverables to designers. Almost all prefer digital files, usually vector data in DWG or DGN format along with surfaces in XML format.
Recently, I have worked on several small commercial building projects. The requirements were the same for each. The initial survey includes (among other things):
a title boundary survey
the location of existing utilities and structures
contours at one-foot intervals
the delineation of the floodplain, if present on the site
the location of streets and other public access.
Once the initial survey is complete, I often set control for machine control, which heavy machinery uses to perform grading without requiring stakes. Once grading is complete, I often stake out building locations and sometimes paving.
Challenges have included working with city planners who do not always have the same sense of urgency as the project developers and designers.
Perhaps the greatest lesson I have learned is the importance of being efficient without being in a hurry, which breeds mistakes, such as missing important details or breaching a safety protocol and causing a serious injury.
I also have learned that while technology can increase profits, it is important to reinvest some of them into improving my work product. This way, I enjoy a better return on my investment, but I also enjoy a better deliverable for my clients.
A roundup of recent products in the GNSS and inertial positioning industry from the February 2022 issue of GPS World magazine.
OEM
GNSS Receiver
For tracking, telematics
Photo: u-blox
The LENA-R8 GNSS receiver is based on the u-blox M10 platform. The compact module balances cost and performance with a single antenna and primarily targets customer deployments in the Europe, Middle East, Africa, Asia, and South America regions. Designed for tracking and telematics, the module series was designed to minimize material costs and data charges. The LENA-R8 supports a broad range of frequency bands with 2G fallback, providing maximum roaming coverage for global tracking applications using a single stock keeping unit (SKU).
The low-profile triple-band HC997EXF embedded helical GNSS antenna features eXtended Filtering (XF). It is designed for precise positioning, covering the GPS/QZSS-L1/L2/L5, GLONASS-G1/G2/G3, Galileo-E1/E5a/E5b, BeiDou-B1/B2/B2a, and NavIC-L5 frequency bands. It also covers regional satellite-based augmentation systems (WAAS, EGNOS, MSAS, GAGAN) and L-band correction services. It is packaged in a light (11 g), compact form factor (60 x 25 mm). Its precision-tuned, high-accuracy helical element provides an excellent axial ratio and operates without a ground plane, making it suitable for lightweight unmanned aerial vehicle (UAV) navigation and a wide variety of precision applications.
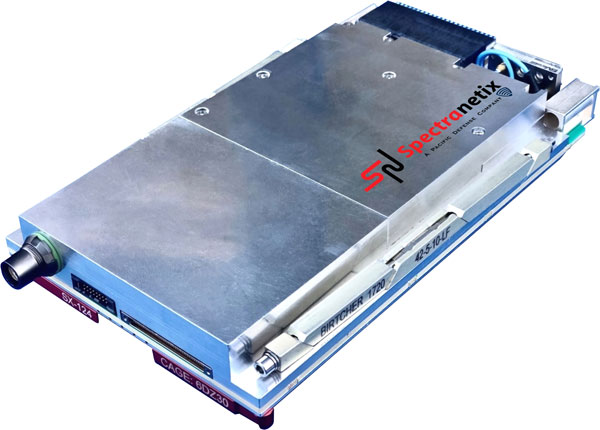
The SX-124 ruggedized 3U OpenVPX high-performance positioning, navigation and timing (PNT) card can provide timing and positioning information in a GPS-denied environment through sensor fusion. It is designed for highly integrated systems with a requirement for the U.S. Army’s C5ISR Modular Open Suite of Standards (CMOSS) and alignment with the Open Group Sensor Open Systems Architecture (SOSA) technical standard. The SX-124 can accept external sources or use its onboard GNSS receivers as reference inputs for timing and positioning data. The positioning data can be fused with internal and external inertial measurement units.
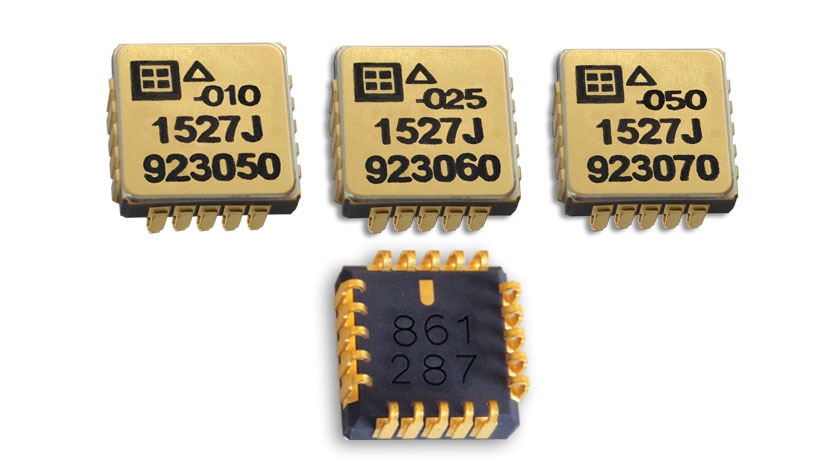
The Model 1527 series is a family of miniature, radiation-tested, tactical-grade micro-electromechanical (MEMS) accelerometers. Offered in three full-scale acceleration ranges — ±10 g, ±25 g and ±50 g — the series is designed to support a variety of critical space electronics testing requirements, including those of spacecraft, satellites and CubeSats. Their small bias and scale-factor temperature coefficients, excellent in-run bias stability and zero cross-coupling make the Model 1527 series particularly well-suited for spacecraft electronics testing applications requiring low power consumption (+5 VDC, 6.5 mA), low noise, long-term measurement stability in –55° C to +125° C environments, and performance reliability under intermittent radiation exposures.
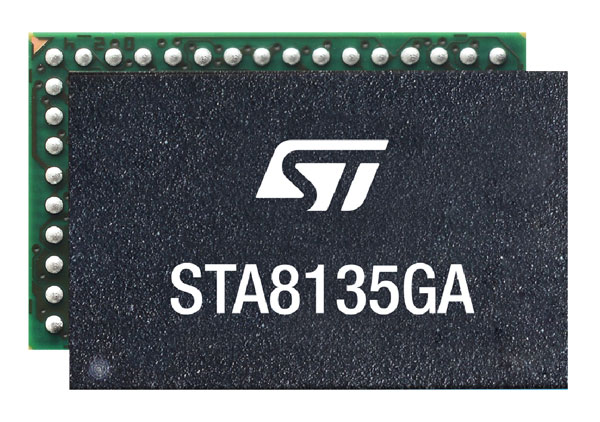
The STA8135GA automotive-qualified GNSS receiver is designed to deliver the high-quality position data needed by advanced driving systems. Part of the Teseo V family, the STA8135GA integrates a triple-band positioning measurement engine. It also provides standard multi-band position-velocity-time (PVT) and dead reckoning. The multi-constellation receiver delivers raw information for the host system to run any precise-positioning algorithm, such as PPP/RTK (precise point positioning/real-time kinematic). The receiver can track satellites in the GPS, GLONASS, BeiDou, Galileo, QZSS and NAVIC/IRNSS constellations.
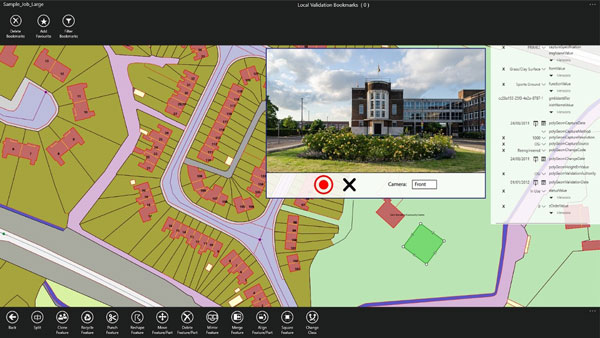
Survey application 1Edit now has increased support for photos and 2.5D data. 1Edit 3.1 allows users to attach feature photos, including automated geotagging, which enables surveyors to visualize assets and fine tune observations. Also included are new validation functions and improved handling for heights (2.5D data), typically useful for detailed asset and land-management surveys. Enhanced styling, including bitmap fills and dashed lines, make it easier to identify and classify different asset types during surveys. Additional control of editable layers and fields provides protection for non-editable data and protects the data quality. Significant improvements to rendering of thematic mapping enhances the speed and fluidity of the intuitive user interface.
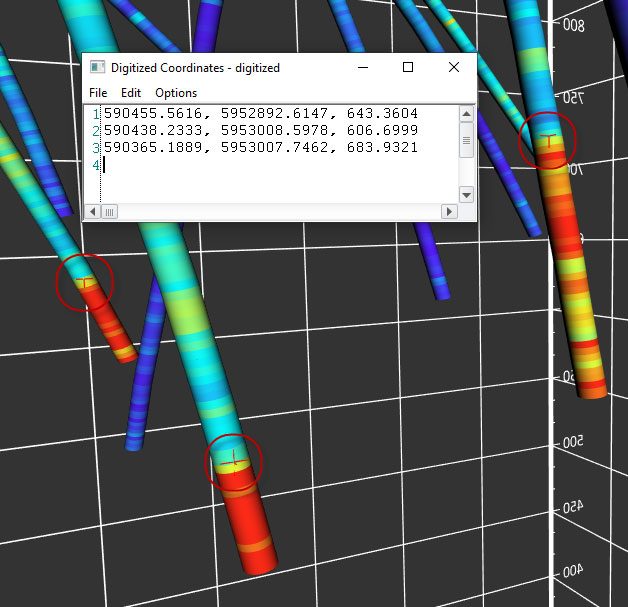
The latest version of Surfer surface mapping software has improved map-making functionality and data exporting capabilities. Surfer is used by more than 100,000 people worldwide, many involved in oil and gas exploration, environmental consulting, mining, engineering and geospatial projects. It provides fast and powerful contouring algorithms, enabling users to model data sets, apply an array of advanced analytics tools, and graphically communicate the results. Frames now have outlines and background fill colors to make them easier to read when placed on top of maps and attribute data can now be exported as numeric data.
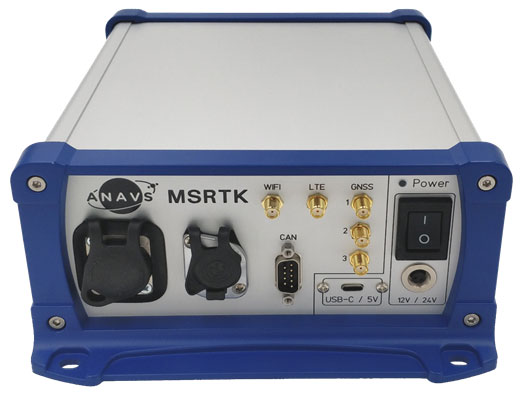
The Multi-Sensor (MS-) RTK/PPP device is a turnkey system easily integrated into surveying applications. The module includes up to three multi-frequency, multi-GNSS (GPS + Galileo + Glonass + BeiDou) receivers, a MEMS IMU, a barometer, a CAN interface for reception of vehicle data (wheel odometry and steering angle), and an LTE module for reception of RTK/PPP corrections. ANavS sensor fusion performs tight coupling of all sensor data with an Extended Kalman Filter (EKF). Various interfaces can connect additional sensors (such as camera or lidar) or output position information.
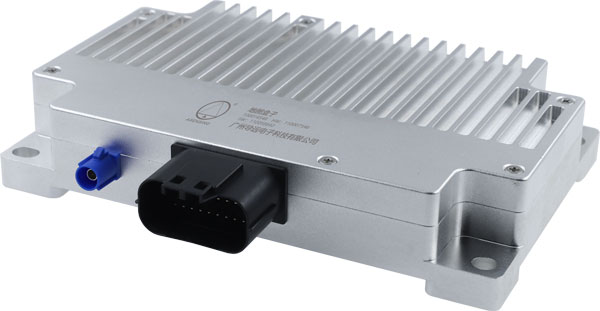
The HD-MapBox integrates high-precision map data based on high-precision positioning. Fusing data from a GNSS receiver, IMU, ADAS camera, vehicle dynamics and HD maps, the HD-MapBox can achieve a lateral error of less than 8 inches (0.2 meters) and a longitudinal error of less than 6.5 feet (2 meters) with a 95% confidence interval, providing an accurate reference for highway pilots and automated valet parking. Even if both GNSS and lane line detection are not available, the HD-MapBox can still enable vehicles to keep inside the lane for at least a quarter mile (400 meters).
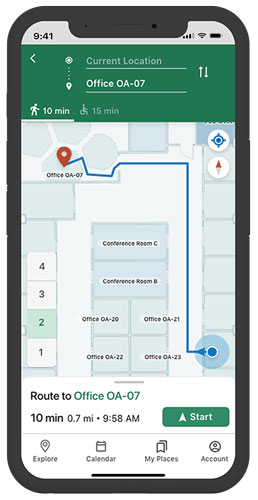
Esri ArcGIS IPS is an indoor positioning system that adds a blue dot to indoor maps, enabling users to locate their current position inside a building in the same way GPS enables outdoor location indicators. It uses an alternative technology to enable real-time positioning and navigation inside buildings. It also provides live location sharing and tracking, location data capture and analytical insights. ArcGIS IPS is available for users of ArcGIS Indoors, an indoor mapping system for smart building management, and ArcGIS Runtime SDKs, which enable the indoor positioning capability in custom-built apps.
In this issue’s cover, a man with a backpack lidar unit, a GNSS receiver and a tablet computer is surveying in a complex and challenging urban setting. That same lidar unit also can be mounted on a UAV. One of the contributors to this month’s cover story describes the role of aerial photogrammetry in the architecture, engineering and construction (AEC) industry. Satellite navigation, remote sensing, mapping software, a great variety of platforms, and ever more powerful handheld computers — those are the key ingredients in today’s ecosystem of geospatial technologies. The current generation of surveying equipment has more than halved fieldwork in the past two decades while greatly improving the quality of the data collected.
The AEC industry relies on surveyors to be “a bridge between the existing landscape and the design landscape,” said another contributor to our cover story. Unlike traditional boundary surveying, he explained, surveying for AEC requires consideration of a detailed 3D world. It also involves many more stakeholders and much greater liability.
The tight integration of GNSS, inertial systems, lidar sensors and 360° spherical imagery into mobile mapping systems makes 3D modeling possible and traditional GNSS or optical measurement instruments obsolete. However, while inertial systems are invaluable to bridge brief gaps in the availability and reliability of GNSS signals, they are far from the panacea they are sometimes claimed to be, as Brad Parkinson reminds us in an interview with Dana Goward, also in this issue.
Surveying for AEC requires at least centimeter accuracy. The challenges of surveying in urban settings include urban canyons that occult signals and create multipath, traffic and multiple layers of underground, ground-level and above-ground infrastructure.
Beyond the construction phase, 3D survey data is increasingly used to create digital twins of buildings, which facilitate their operation and maintenance throughout their life cycle and help lower their carbon footprint. Once they have completed an initial survey, surveyors often set control to be used for machine control — the theme of our cover story in next month’s issue.
In this issue we also:
• Inaugurate a “letters to the editor” section to make more room for debate in the GNSS/PNT community on the critical issues it faces.
• Report on a Jet Propulsion Laboratory study of the impact on the ionosphere of the enormous volcanic eruption in Tonga and the beginnings of a GNSS-based early warning system for natural hazards.
• Continue our series of articles on GNSS constellations, with an update from Japan’s QZSS constellation.
• Feature three studies: one on real-time simulator testing using an NMEA data stream, one on the first transmission of L1C/B signals by QZSS, and one on self-driving cars in major metropolitan areas.
All these advances, however, are threatened when GPS is threatened. Earlier in the month, three members of our editorial advisory board comment on the recent threat to GPS satellites by the Russian government.
A positioning service energizes large pipeline surveying projects, saves time, and becomes a field crew favorite
For projects spanning large areas, a large engineering and construction firm discovered that a precise point positioning (PPP) service — Trimble’s CenterPoint RTX — could solve the challenge of receiving high-precision GNSS in remote areas.
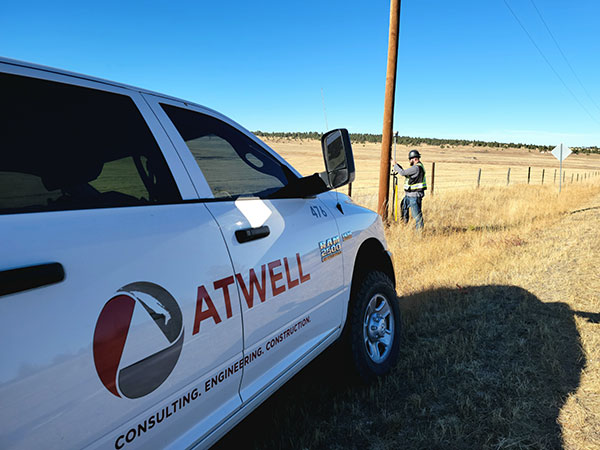
Atwell Group LLC is a national consulting, engineering and construction services firm with 33 offices throughout the country and more than 1,000 team members. The company delivers a broad range of strategic and creative solutions to clients in three core markets: oil and gas, power and energy, and real estate and land development.
Atwell provides comprehensive turnkey services, including land and right-of-way support, engineering, land surveying, environmental compliance and permitting, and project and program management.
Photo: Trimble
Pipeline construction
Atwell’s introduction to PPP and Trimble’s CenterPoint RTX took place during two large-scale linear pipeline projects within remote areas. Atwell has substantial experience with projects of this scale, but the remoteness of some of the projects’ sections was proving to be a challenge. While they could expect to rely on base or network correction methods for most projects, Atwell needed to seek other correction alternatives — and up their efficiency for the long-corridor projects.
With the CenterPoint RTX service at hand, Atwell performed construction staking and as-built surveys for a 50-mile pipeline. The project spanned a five-month period, with an hour or more of time saved each day using the service.
Crews noticed an additional benefit: rapid response time. On any given day, there could be project managers, right-of-way agents, or inspectors on site, asking for additional survey data.
“Inspectors and others started to notice how fast our crews could jump from one place to another and get the shots they requested, without having to do any base setups,” said Jason Jung, project manager with Atwell.
“The speed at which our crews can get up and running with RTX is awesome.” — Jason Jung, 3D laser scanning projects manager, Atwell
Because of the range limits of base radios, the crews might have to do multiple setups of a conventional real-time kinematic (RTK) base each day. RTX removed this hindrance, saving the crews time by not having to use temporary RTK bases, which entails driving to base reference points, setup and teardown, and downtime from malfunctioning equipment and battery issues.
“RTX completely freed us from the time and hassle of base setups,” Jung said. “You turn it on, and it’s ready to go before you’ve had time to take a sip of coffee. And once our crews got used to it and gained confidence in the results, they have really loved this solution.”
Photo: Trimble
Scanning a pipeline
Atwell recently used CenterPoint RTX on a 135-mile large-diameter pipeline project that included 19 facilities along the route. Atwell provided as-built services related to the facilities using a Trimble X7 scanner.
The data captured was used to generate spatially correct site models that included the material traceability necessary to comply with Pipeline and Hazardous Materials Safety Administration (PHMSA) regulations. Crews used RTX to georeference point clouds from the scanner to provide the accuracy needed to comply with industry regulations. Each site was referenced with permanent monuments or scribes that tied into the master control system.
Crews also used the RTX service to establish hard checkpoints to meet Atwell’s strenuous quality-control requirements for ground targets, such as those used in UAS control work. To do the daily “in and out” check shots, they used the free BenchMap app to locate nearby survey control marks from the National Geodetic Survey database. Most checks were sub-0.08’.
The time saved in not having to change base positions, as well as setup and breakdown, were significant time savers along this lengthy project. The precisely registered scans helped speed up PHMSA required inspections and audits, and construction change management field operations.
A crew favorite
Atwell’s crews use Trimble R10 receivers and Trimble Access running on TSC7 controllers, but Jung noted that they have recently upgraded to some R12i GNSS receivers, “and they are already earning their keep.” He expects to realize even more benefits from RTX coupled with the advanced multi-constellation capabilities of the Trimble ProPoint RTK engine in the R12i.
RTX has not only become a crew favorite, it is fast becoming a go-to solution for many Atwell projects.
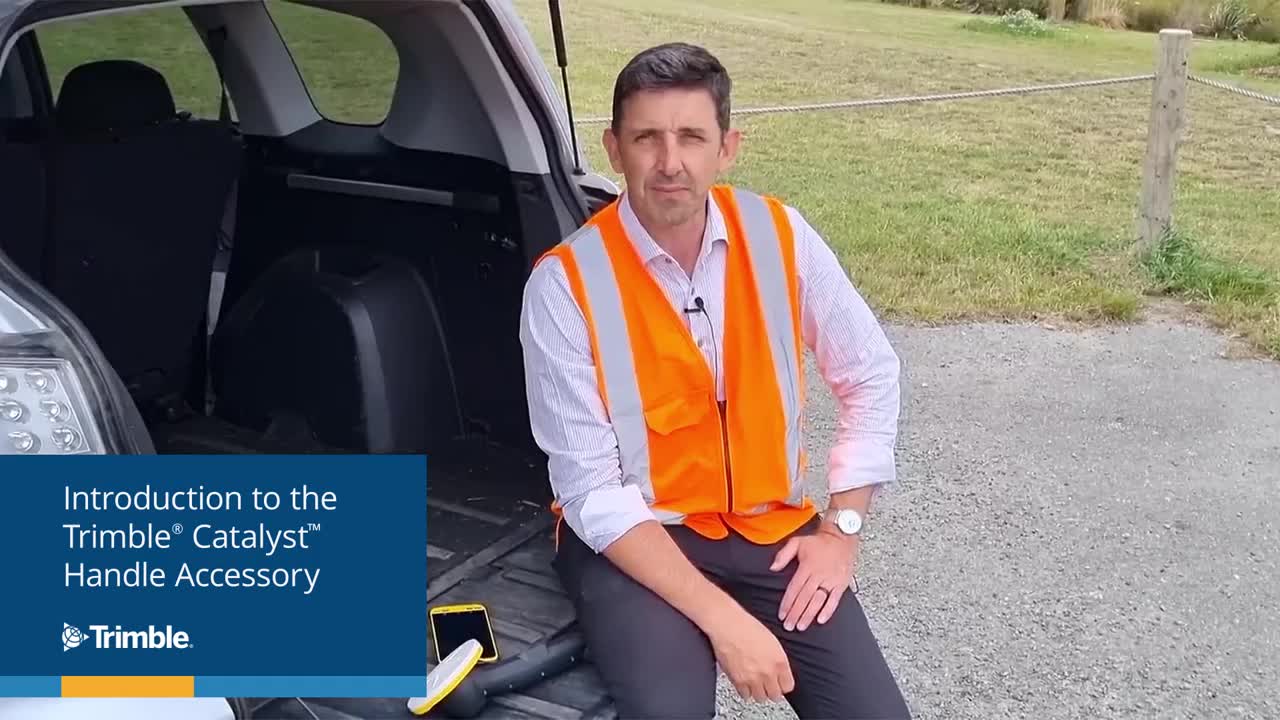
Trimble has introduced the Trimble Catalyst handle, which adds a new level of flexibility to accessing GNSS data. The lightweight, ergonomic handle provides a convenient way to carry Trimble’s Catalyst-enabled mapping and field data-collection workflows.
Users can:
choose their device, whether iOS or Android, which turns any smartphone or tablet into a Trimble-quality handheld positioning system
swap out a device at any time, whenever an upgrade is needed
adjust accuracy level as requirements change by switching the accuracy-based Catalyst subscription
affix a monopole when decimeter-level or better positions are crucial.
1Spatial has extended the capability of its survey application 1Edit, increasing support for photos and 2.5D data.
1Edit 3.1 allows users to attach feature photos, including automated geotagging, which enables surveyors to visualize assets and fine-tune their observations. The latest version now includes new validation functions and improved handling for heights (2.5D data), typically useful for detailed asset and land-management surveys.
Enhanced styling, including bitmap fills and dashed lines, make it easier to identify and classify different asset types during surveys. Additional control of editable layers and fields provide protection for non-editable data and protects the quality of data. Significant improvements to rendering of thematic mapping further enhances the speed and fluidity of the intuitive user interface.
1Edit also now supports the storage of photographs as an attribute on a feature. The photos can be captured from the front or rear camera and are stored as a Label object.
“1Edit’s new survey capabilities further expands our customers’ ability to collect trusted, validated data that is right first time,” said Robert Chell, chief product officer. “By increasing the number of validation options available during a survey, we improve both the quality and accuracy of data, and the effectiveness of survey processes.”
A new surveying and mapping textbook is now available on the OPEN Textbook network.
Written in English, the book provides an academic introduction to the field of surveying and mapping. It is based on handouts and readers written for the third-year course “Surveying and Mapping” in the civil engineering bachelor’s program at Delft University of Technology in The Netherlands.
The textbook covers a wide range of measurement techniques, from land surveying using GPS/GNSS and remote sensing to the associated data processing, the underlying coordinate reference systems, and the analysis and visualization of the acquired geospatial information.
Although a few parts of the book are specific to The Netherlands, for the most part the material is applicable globally.
Surveying and Mapping
Authors: Christian Tiberius, Hans van der Marel, René Reudink and Freek van Leijen / Delft University of Technology / The Netherlands
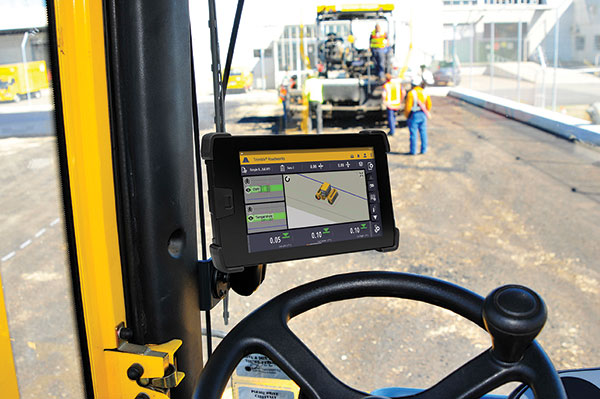
Trimble has introduced Trimble Roadworks Paving Control Platform for Asphalt Compactors. It enables operators to accurately control the compaction process, while reducing unnecessary passes that can result in over compaction. The highly accurate, 3D paving control system is designed to improve the speed, accuracy and ease of asphalt compaction.
The system leverages the highly intuitive Android-based Trimble Roadworks software to maximize ease of use, shorten training times and decrease downtime for operators already familiar with the Roadworks user interface. With the proper hardware and software configurations, the new system is flexible and can support a variety of jobsite needs and specifications.
Roadworks helps contractors save on fuel costs and reduce both machine wear and tear and operator hours. In addition, asphalt temperature mapping provides color-coded data to allow operators to compact at the correct temperature, reducing material waste and rework.
Photo: Trimble
In addition to helping operators achieve greater accuracy and efficiency, Roadworks is available at various pricing levels to help meet the needs of each contractor. New compactor licenses make it possible for contractors to pay for only the functionality they need, and office-only licenses provide increased functionality in the office. Users can also benefit from ongoing Roadworks platform development.
“We’re expecting there to be an influx of projects over the coming months and years as the result of increased infrastructure funding,” said Kevin Garcia, general manager, Trimble Civil Specialty Solutions. He said the release was important because more departments of transportation and private owners are building technology requirements into their requests for proposals (RFPs).
Connected Site Functionality. Roadworks is compatible with Trimble WorksOS and Trimble WorksManager software. This enables contractors to send construction-ready models from the office to the machine as well as to remotely monitor jobsite progress and activity. In addition, productivity data collected from the machine is automatically synced back to the office.
It’s the beginning of 2022 and the new, modernized NSRS is only about three years away. Hopefully, everyone has been reading NGS’s blueprint documents updated during 2021, and participating in NGS’s webinar series. Together, they provide the latest information about the changes from the existing NSRS to the new NSRS.
My previous columns highlighted many aspects of the new geometric reference frame and geopotential datum. In this month’s column, I will highlight the time-dependent aspect of the modernized NSRS and why it is necessary for the new system.
As I stated before, NOAA’s National Geodetic Survey (NGS) is developing models and tools for users to be able to transform coordinates between the four national terrestrial reference frames and the International Terrestrial Reference Frame, the Geopotential Datum and the North American Vertical Datum of 1988 (NAVD 88), as well as estimate coordinates at epochs different from the survey observation epoch by accounting for movement.
What does NGS mean by estimate coordinates at epochs different from the survey epoch, and why is it necessary to account for movement for the new, modernized NSRS? This column will address these issues.
NGS’s January 2022 (Issue 27) edition of NSRS Modernization News announced a paper about the modernized NSRS and a change in name to the Intra-Frame Velocity Model (IFVM). See the box below. Users can sign up for these newsletters here, and can obtain access to previous newsletters here.
The Latest Issue of
NSRS Modernization News
Image from GovDelivery Communications Cloud on behalf of NOAA’s National Ocean Service.
The new paper was published in October 2021 and is titled “The Mathematical Relation between IFVM2022 as Expressed in ITRF2020 with IFVM2022 as Expressed in the Four Terrestrial Reference Frames of the Modernized NSRS with Dependence on EPP2022.” It can be downloaded here.
The paper describes the mathematical relationship between the Intra-Frame Velocity Model (IFVM2022) and the Euler Pole Parameters (EPP2022).
The NSRS Modernization News announcement states that the IFVM2022 name has been changed to the Intra-Frame Deformation Model (IFDM2022). The latest version of blueprint 1 and the October 2021 (NOS NGS 90) report were published before the name changes, so they refer to IFVM2022 instead of IFDM2022.
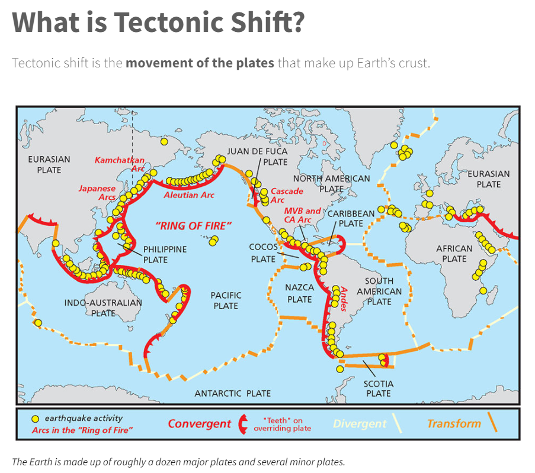
Why is it necessary to account for movement? Coordinates basically change because the Earth’s surface is moving due to the movement of major tectonic plates. See the box below for information about why it is called plate movement or tectonic shift. NGS understands this and is attempting to manage the changing coordinates by providing a time-dependent component.
Image: National Ocean Service websiteScreenshot: NOAA Website
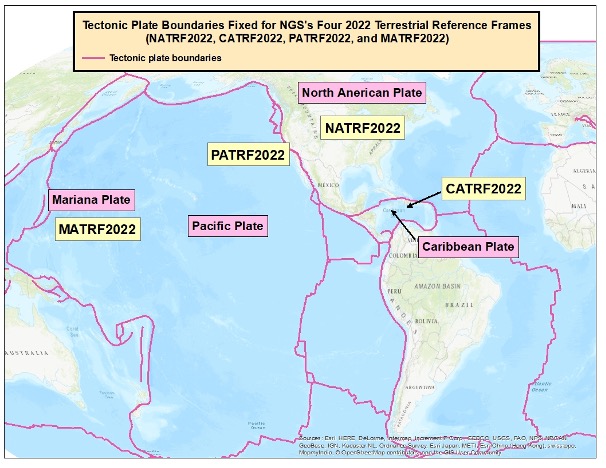
NGS will be defining the following four geometric terrestrial reference frames that are based on the tectonic plates (see map below):
North American Terrestrial Reference Frame of 2022 (NATRF2022)
Pacific Terrestrial Reference Frame of 2022 (PATRF2022)
Caribbean Terrestrial Reference Frame of 2022 (CATRF2022)
Mariana Terrestrial Reference Frame of 2022 (MATRF2022)
Four Tectonic Plates Part of NGS’s New NSRS
Image: Dave Zilkoski
As previously stated, NGS is developing models and tools for users to be able to transform coordinates between the four national frames and the International Terrestrial Reference Frame, as well as estimate coordinates at epochs different from the survey observation epoch by accounting for movement. These models are denoted as EPP2022 and IFDM2022.
So, what are EPP2022 and IFDM2022? And what does this mean to surveyors and mappers?
EPP stands for Euler pole parameters (a way of describing a plate’s rotation) and IFDM2022 is a way of computing the drift in coordinates.
Why Euler Pole? See the box titled “Who was Euler?”
Who was Euler?
Leonhard Euler was a Swiss who lived in the 1700s. He was one of the greatest mathematicians that ever lived and has been called the greatest mathematician of the 18th century. He founded the studies of graph theory and topology, and made pioneering and influential discoveries in many other branches of mathematics such as infinitesimal calculus. He introduced a lot of modern mathematical terminology and notation, including the notion of a mathematical function. He is also known for his work in mechanics, fluid dynamics, optics, astronomy and music theory.
The definition of Euler’s fixed point theorem states that any motion of a rigid body on the surface of a sphere may be represented as a rotation about an appropriately chosen rotation pole, called a Euler pole. This theorem has been used by geologists to understand and describe the motions of tectonic plates.
NGS’s 2021 revised Blueprint 1, NOAA Technical Report NOS NGS 62, Blueprint for the Modernized NSRS, Part 1: Geometric Coordinates and Terrestrial Reference Frames provides an explanation of Euler poles and “plate-fixed” frames. As stated in the “Who was Euler?” box, the definition of Euler’s fixed-point theorem states that any motion of a rigid body on the surface of a sphere may be represented as a rotation about an appropriately chosen rotation pole, called a Euler pole. The following is stated in the NOS NGS 62 report under “Plate-Fixed Frames and Euler Poles,” section 4:
When considering only the rigid (not deforming) part of a tectonic plate, the horizontal motion of the plate (relative to a global plate-independent reference frame, like the ITRF) can be modeled as a rotation about a geocentric axis passing through a fixed point on Earth’s surface. Although such models must make certain assumptions (such as the rigidity of the plate), the dominant motion of the majority of points on most tectonic plates is the rotation about a fixed point. That point is known as an “Euler pole.”
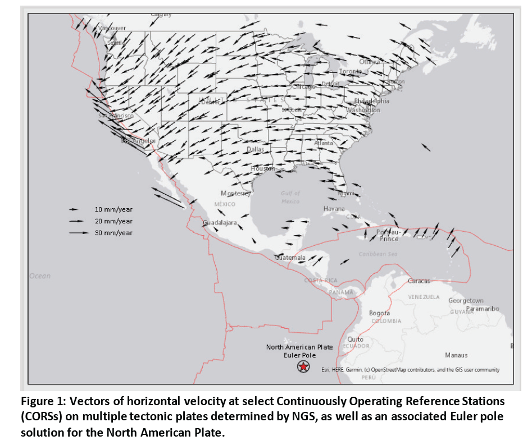
What is important to know is that the determination of a plate’s Euler pole location and the angular velocity with which the plate rotates can be empirically determined using GNSS observations from a CORS network distributed throughout the plate. Figure 1 from the NOS NGS 62 report provides a plot of the North American plate Euler pole and the vectors of the horizontal velocities at select CORS (see the box titled “Figure 1 from NOS NGS 62”).
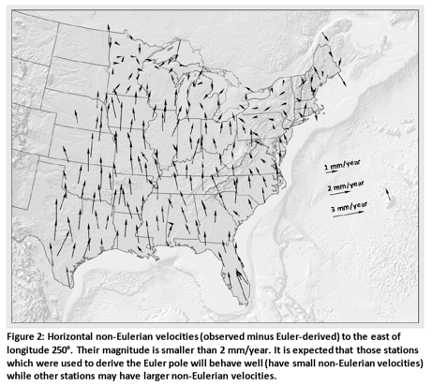
Every place on Earth is moving. That includes neighboring marks on the same tectonic plate. What this means is that after the Eulerian motions are removed, the remaining motions left over change the relative differences in coordinates of neighboring marks located on the same tectonic plate. Figures 2 and 3 from the NOS NGS 62 report provide plots of estimates of these remaining velocities (see the boxes titled “Figure 2 from NOS NGS 62” and “Figure 3 from NOS NGS 62.”)
Figure 2 is a plot of the non-Eulerian motions east of 110° west longitudes. As stated in the report, most of the velocities are less than 2 mm/year. The concept is that the EPP2022 and IVDM2022 models will remove the Eulerian and non-Eulerian movement of the marks.
Figure 2 from NOS NGS 62
Image: NGS website
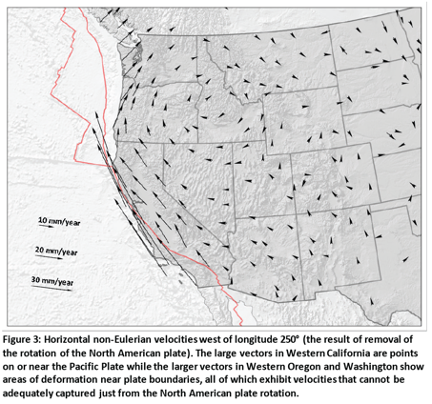
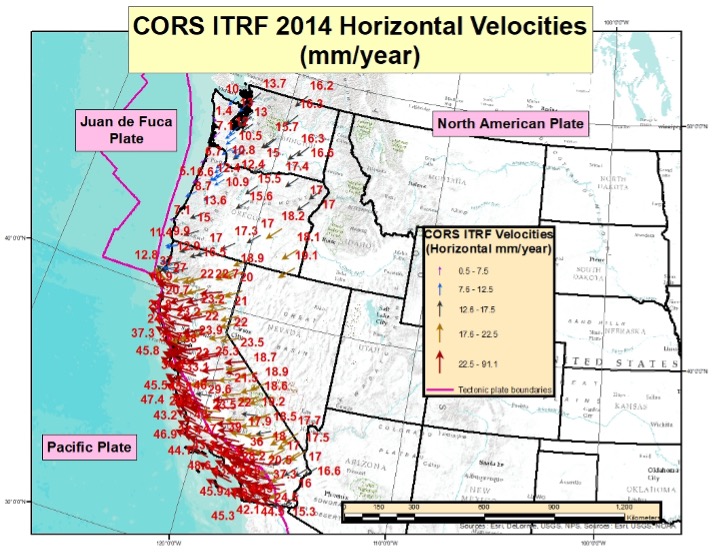
Figure 3 is a plot of non-Eulerian vectors west of 110° west longitude. As indicated in the plot, the large vectors in Western California, Western Oregon and Western Washington show areas of deformation near plate boundaries that don’t appear to be adequately captured just from the North American plate rotation.
Figure 3 from NOS NGS 62
Image: NGS website
It should be noted that the size of the vectors on Figures 2 and 3 depict a different magnitude of movement. Figure 2 depicts vectors at 1-3 mm/year and Figure 3 depicts movement at 10-30 mm/year.
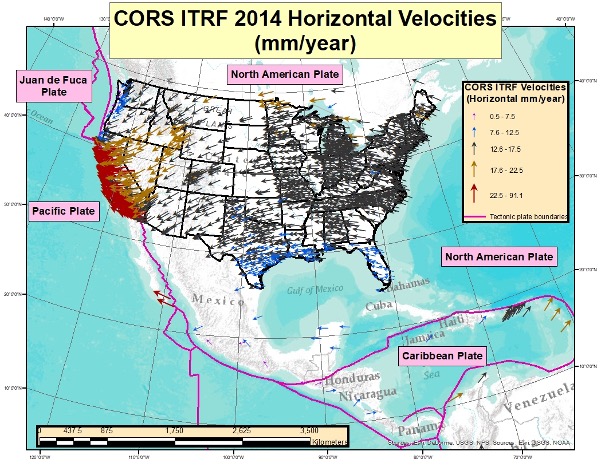
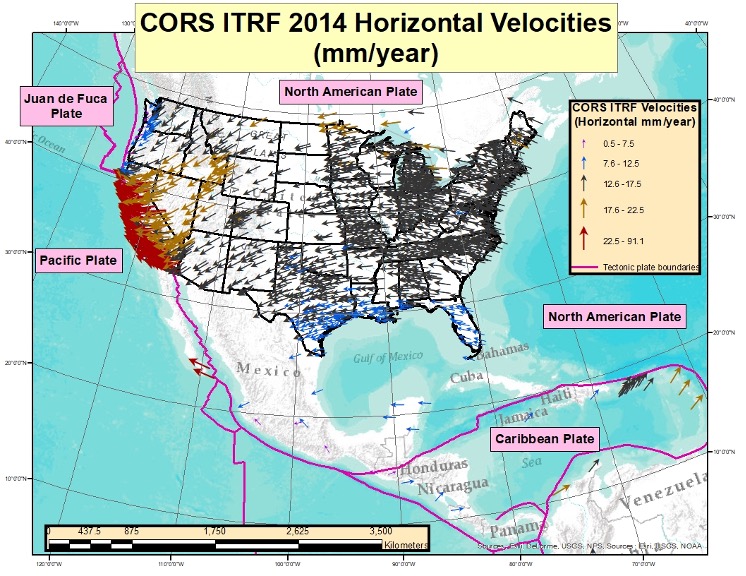
To better visualize the potential size of the movement, I downloaded the CORS ITRF2014 coordinates and velocities from NGS’s website and compiled the results. See the boxes titled “CORS ITRF 2014 Horizontal Velocities” and “Table of ITRF 2014 Horizontal and Upward Velocities of U.S. CORSs.”
Computed Velocities Only (Downloaded Jan. 13, 2022)
Image: Dave Zilkoski
The box titled “CORS ITRF 2014 Horizontal Velocities” provides the horizontal vectors based on NGS’s file downloaded on Jan.13. Only CORSs designated as operational and computed velocities were included in the plot.
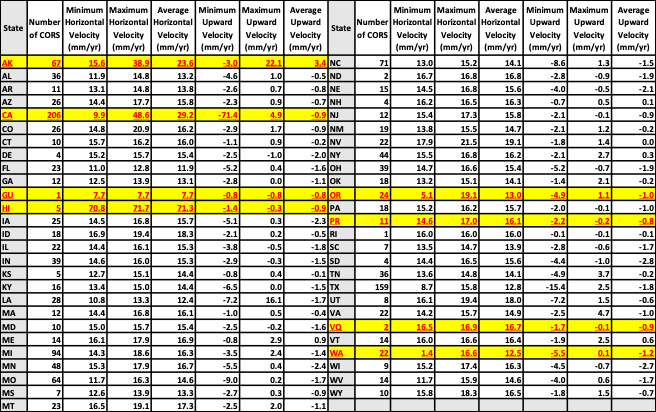
I have also created a table that includes a summary of the ITRF rates for CORS labeled as part of the United States. The table includes the following information for each State and Territory of the United States:
Number of CORS
Minimum Horizontal Velocity (mm/year)
Maximum Horizontal Velocity (mm/year)
Average Horizontal Velocity (mm/year)
Minimum Upward Velocity (mm/year
Maximum Upward Velocity (mm/year),
Average Upward Velocity (mm/year).
See the table below.
Table of ITRF 2014 Horizontal and Upward Velocities of U.S. CORSs
Computed Velocities Only (Downloaded Jan. 13, 2022)
Highlighted territories are not on the North American plate (GU, HI, PR, and VQ), and highlighted states are partly inside or close to the boundary of the North American plate and another tectonic plate (AK, CA, OR, WA).
The highlighted territories in the table are not on the North American plate (GU, HI, PR and VQ), and the highlighted states are partly inside or close to the boundary of the North American plate (CA, OR, WA). This is one of the reasons why their minimum and maximum horizontal velocity values are different from most of the other states’ values.
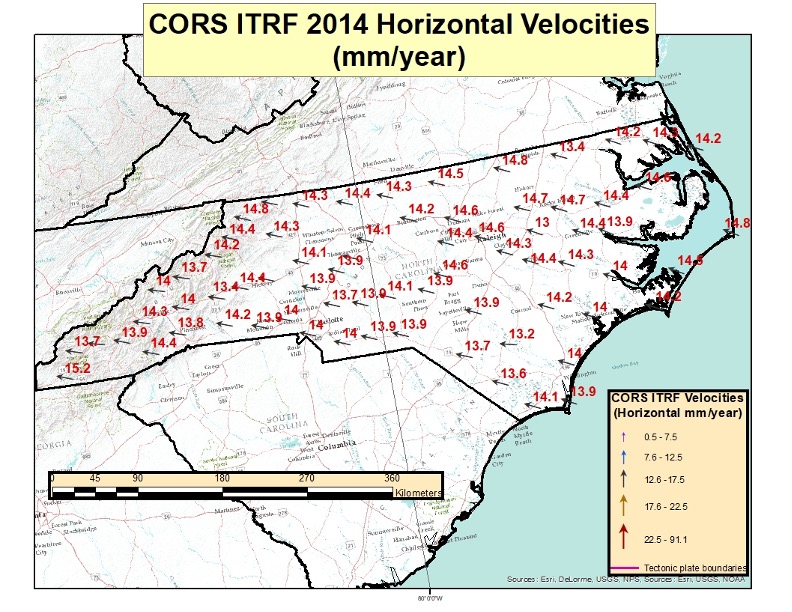
To visualize the relative differences in horizontal velocities between neighboring CORSs, I plotted the ITRF 2014 Horizontal Velocities for CORSs located in North Carolina (see the box titled “CORS ITRF 2014 Horizontal Velocities in North Carolina”). Looking at the figure, it’s obvious that all of the velocities are around 14 mm/year and moving in the same direction.
CORS ITRF 2014 Horizontal Velocities in North Carolina
Computed Velocities Only (Downloaded Jan. 13, 2022)
Screenshot: Dave Zilkoski
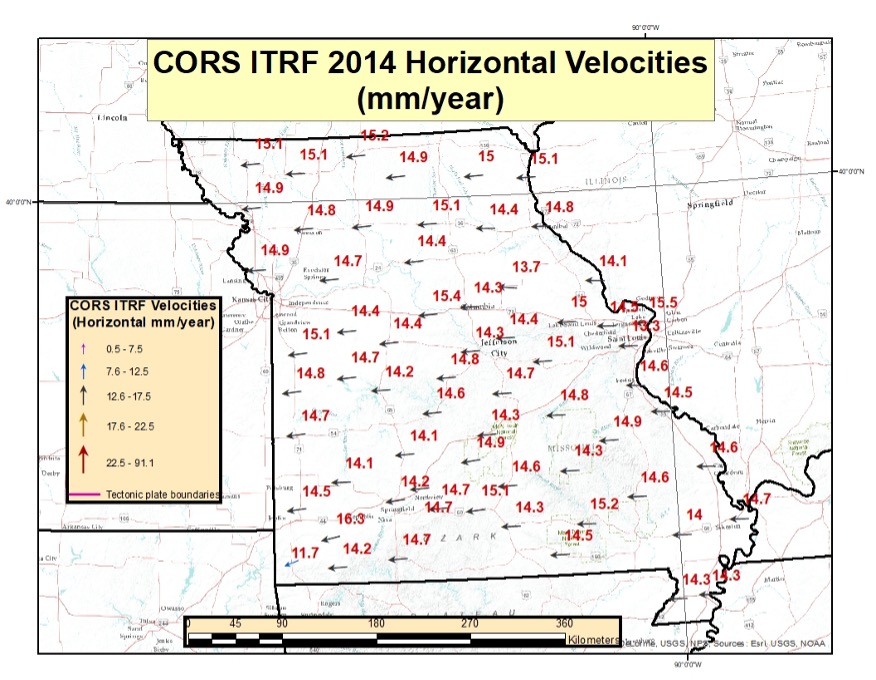
I plotted the horizontal velocities for Missouri to provide an example of the velocities in the central region of the conterminous United States. The magnitude of the velocities is similar to that for North Carolina, but the direction of the vector is slightly different. North Carolina’s average horizontal velocity is 14.1 mm/year and Missouri’s average horizontal velocity is 14.6 mm/year.
CORS ITRF 2014 Horizontal Velocities in Missouri
Computed Velocities Only (Downloaded Jan. 13, 2022)
Image: Dave Zilkoski
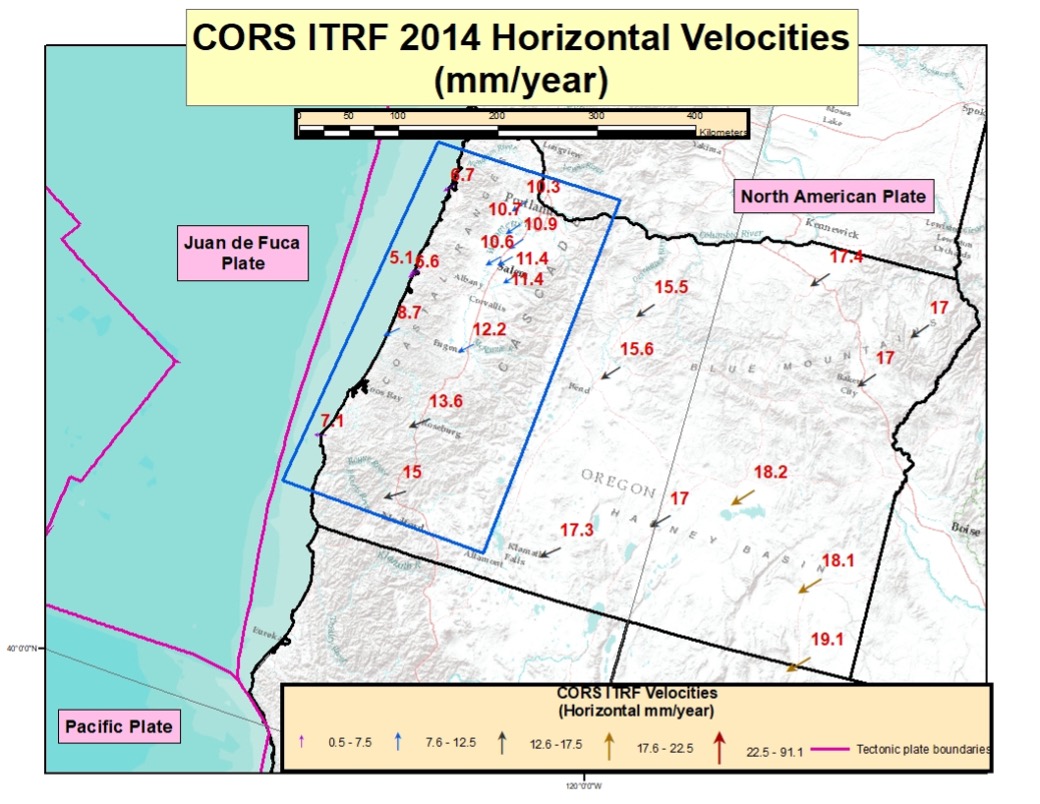
To emphasize the differences along the boundaries of the tectonic plates, I’ve included a plot of the CORS ITRF 2014 horizontal velocities for the State of Oregon and a plot of the states along the West Coast of the United States. See the boxes titled “CORS ITRF 2014 Horizontal Velocities in Oregon” and “CORS ITRF 2014 Horizontal Velocities Along West Coast of CONUS.” As indicated in the plot, there are significant changes in horizontal velocities near the Oregon coast. The values decreased by about 10 mm/year from the inland CORS to the CORS along the coast.
CORS ITRF 2014 Horizontal Velocities in Oregon
Computed Velocities Only (Downloaded Jan. 13, 2022)
Image: Dave Zilkoski
The plot of the CORS ITRF 2014 Horizontal Velocities Along West Coast of CONUS clearly indicates the change in magnitude the closer the CORS are to the Pacific and Juan de Fuca plates.
CORS ITRF 2014 Horizontal Velocities Along West Coast of CONUS
Computed Velocities Only (Downloaded Jan. 13, 2022)
Image: Dave Zilkoski
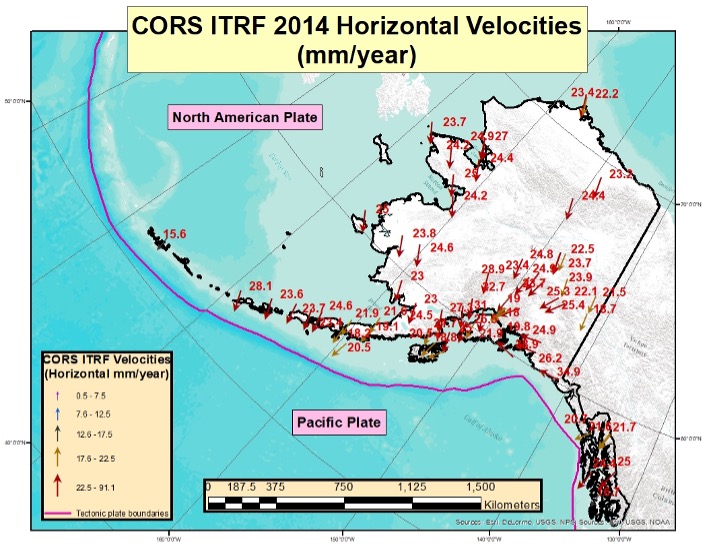
For completeness, I’ve also included a plot of the horizontal velocities for Alaska.
CORS ITRF 2014 Horizontal Velocities in Alaska
Computed Velocities Only (Downloaded Jan. 13, 2022)
Image: Dave Zilkoski
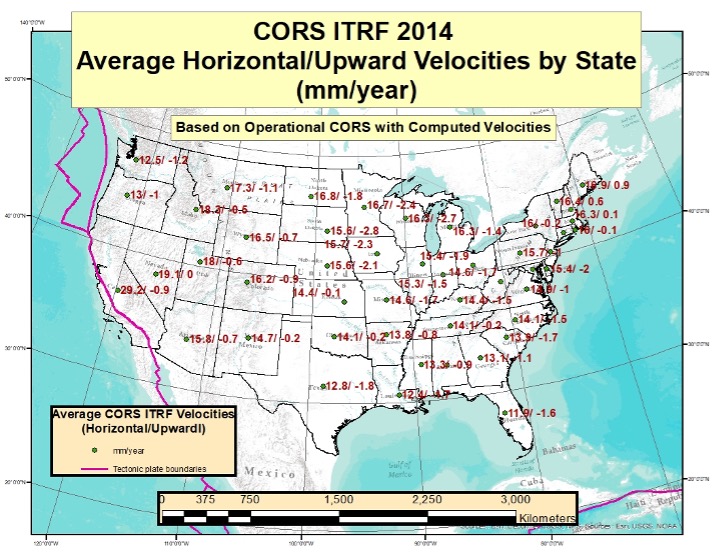
To better visualize the horizontal and upward velocities of CORS among states, I plotted the average horizontal and upward velocity value for each state based on that states’ CORS. See the box titled “Average Velocities by State.”
Average Velocities by State
Image: Dave Zilkoski
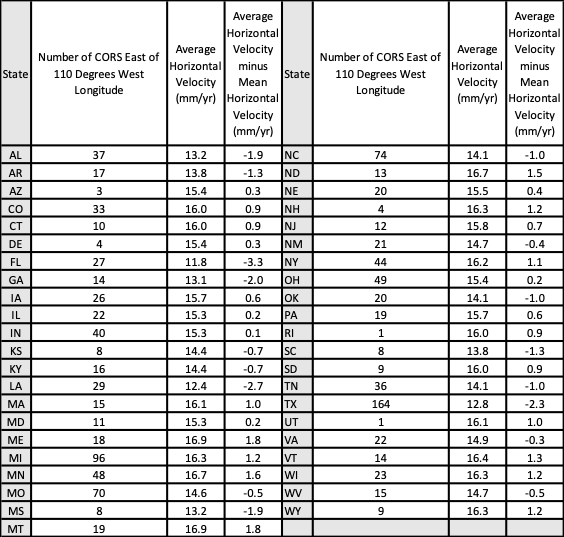
I also computed an average horizontal velocity value based on CONUS CORS east of 110° west longitude (denoted here as a regional horizontal velocity value). [I used the CORSs east of 110° west longitude to be consistent with NGS’s Figure 2 in NOS NGS 62.]
The box below summarizes the average horizontal motion for each state. The table provides:
The Number of CORS East of 110° West Longitude
Average Horizontal Velocity (mm/year)
Average Horizontal Velocity minus Regional Horizontal Velocity (mm/year).
This provides an estimate of the variation of the relative horizontal motion between States.
Table of ITRF 2014 Horizontal Velocities minus Regional Velocity of U.S. CORS East of 110° West Longitude
Table only includes CORS East of 110° West Longitude (Image: Dave Zilkoski)
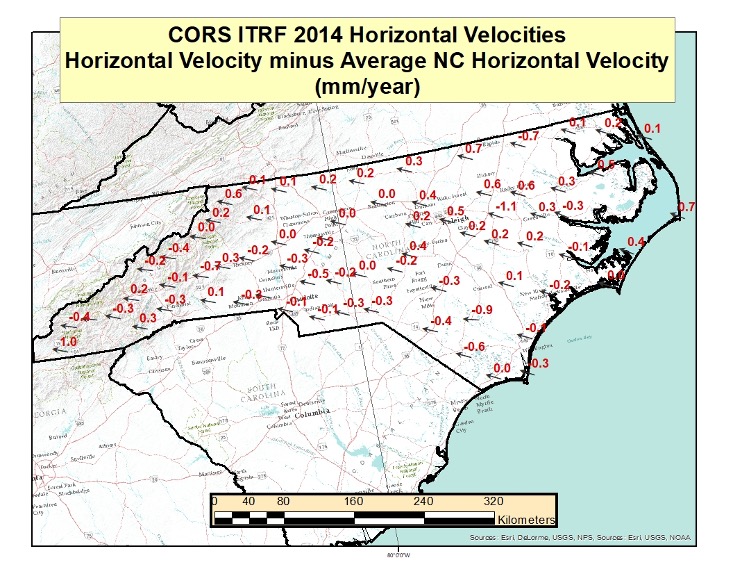
The box titled “Horizontal Velocities in NC Minus Average Velocity” depicts the resulting horizontal velocities with an average velocity removed (the average velocity was based on NC CORS only) for all CORS in North Carolina. As one can see from the plot, most of the resulting horizontal velocities are less than 1 mm/year, but they are still not zero. Once again, this is only meant to provide an idea of the size of the relative vectors between CORS in North Carolina.
As indicated in the NOS NGS 62 report, these horizontal velocities will be small, but they will not be zero. Hence the reason that NGS needs to provide models and tools for users to be able to transform coordinates between the four national frames (NATRF, PATRF, CATRF and MATRF) and the International Terrestrial Reference Frame (ITRF), as well as to estimate coordinates at epochs different from the survey observation epoch by accounting for movement within the reference frame. Surveyors in California have been dealing with these types of movements for many years now.
Horizontal Velocities in NC Minus Average Velocity
(Downloaded Jan. 13, 2022)
Image: Dave Zilkoski
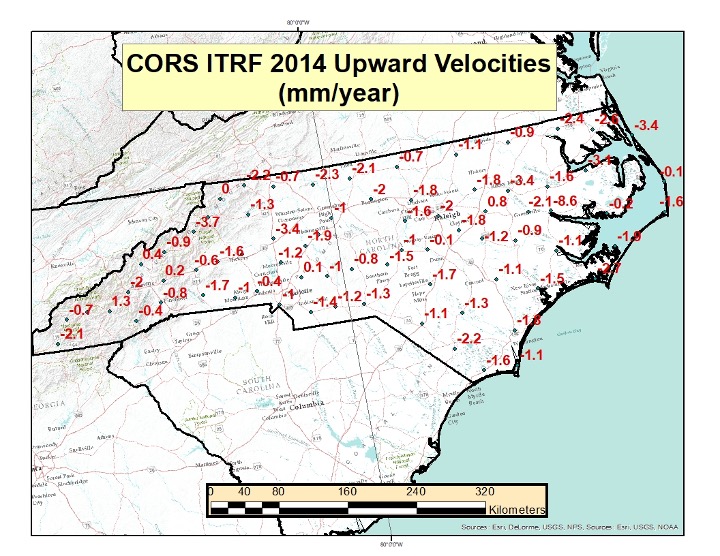
I plotted the ITRF 2014 upward velocity values of the CORS in North Carolina to depict an estimate of the vertical movement of the CORS in North Carolina. See the box below. The vertical velocities values are much less than the horizontal velocities, but they still are not zero. A future column will address the upward velocities based on the ITRF 2014 rates and crustal movement models.
CORS ITRF 2014 Upward Velocities in North Carolina
(Downloaded Jan. 13, 2022)
Image: Dave Zilkoski
This column explained why it is important to account for movement of marks everywhere and not just in areas influenced by active crustal movement due to earthquakes such as in Southern California. It provided information about the CORS rates of movement based on NGS’s ITRF2014 coordinates and velocity information. It highlighted NGS’s reports that describe models that will facilitate users transferring coordinates between reference frames and dealing with intra-frame movement between marks based on survey performed at different epochs. This is not just a horizontal positioning issue.
A future column will address estimates of vertical velocities in the new, modernized NSRS.
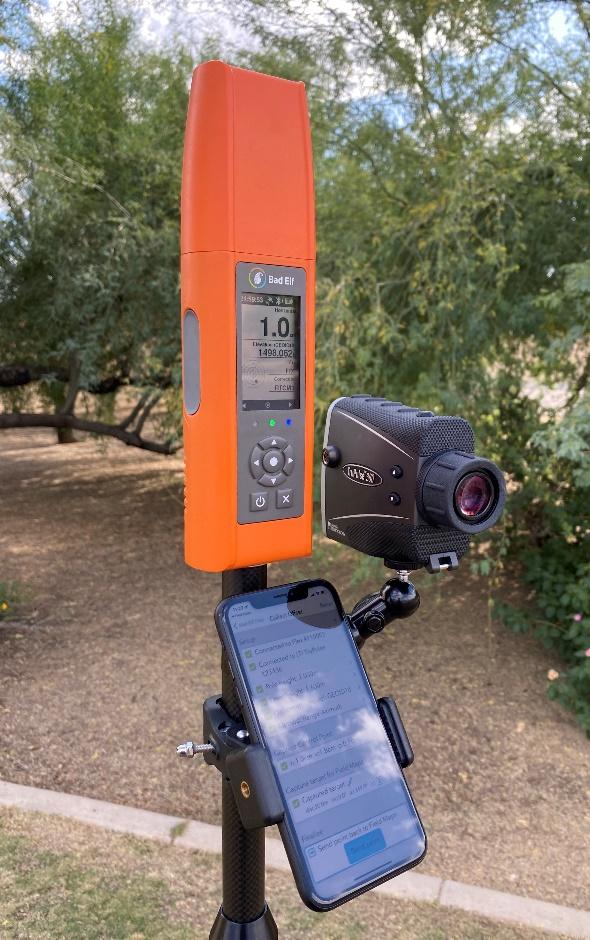
Bad Elf LLC now provides an integrated laser-offset workflow for acquiring high-accuracy field data in GNSS-challenged environments using Esri ArcGIS Field Maps for Android.
The workflow integrates Bad Elf and Laser Tech (LTI) hardware in collaboration with ArcGIS technology from Esri.
“Extending compatibility to the Android mobile operating systems further promotes our commitment to the bring-your-own-device (BYOD) professional,” said Larry Fox, vice president of marketing and business development at Bad Elf. “As a member of the Esri Partner Network, we are pleased to collaborate with Esri in offering this capability to our Android customers.”
The Bad Elf Flex connects to any LTI TruPulse rangefinder over a wired or Bluetooth connection to deliver high-accuracy location data to Esri ArcGIS Field Maps. Mobile workers can efficiently complete position and height data collection in access-limited situations, saving time, money and effort.
“With the inclusion of Android support, Bad Elf introduces a powerful and innovative solution for accurate location offset and height data capture that extends the capabilities of ArcGIS Field Maps across all supported platforms,” Esri Product Lead Jeff Shaner said.
Bad Elf’s app workflow focuses on enhancing productivity, reducing field collection difficulties, and mitigating quality issues. The Bad Elf app workflow runs on Android and iOS. Connection versatility minimizes operating system limitations and allows for app-based or standalone operation.
Bad Elf also provides free tools for Esri ArcGIS Desktop and ArcGIS Pro for configuring offset-enabled point-feature capture using the ArcGIS Field Maps on iOS and Android.
TerraStar-C PRO is the first global correction service from Hexagon to incorporate RTK From the Sky technology to achieve RTK-level accuracy in three minutes with 99.999% availability
In late 2020, Hexagon’s Autonomy & Positioning division announced its technological breakthrough of global RTK From the Sky, demonstrating a future where instantaneous PPP and global RTK-level accuracy is possible.
Integrating this innovation into the core of TerraStar-C PRO, NovAtel’s corrections service, is the first phase in implementing RTK From the Sky technology into the company’s diverse portfolio of correction services for users worldwide.
As a result, TerraStar-C PRO has become the fastest global correction service to provide centimeter-level accuracy, not just in open-sky environments but also across challenging conditions created by buildings and foliage, according to Hexagon | NovAtel.
“RTK From the Sky technology is the foundation that enables our global correction services to be world-leading across agriculture, automotive, defense, survey, marine and autonomous applications,” said Michael Ritter, Autonomy & Positioning division president and CEO. “Our dedication to research culminated in an industry-changing technology; we’ll continue that commitment by providing the best positioning experience in speed, accuracy, availability and reliability anywhere in the world.”
TerraStar-C PRO now converges in less than three minutes by utilizing quad-band receiver and antenna technology to leverage modernized BeiDou III, GPS III and Galileo E6 signals. The resulting process generates state-of-the-art corrections for all GNSS frequencies.
Hexagon is a consistent innovator in GNSS, as seen in its role in developing RTK and PPP solutions. With this next-generation modernization of PPP correction generation and algorithm development, the company continues this tradition in providing the highest quality and best performing global positioning experience to users with land- and air-based applications.
“It’s been a privilege to collaborate across the division to develop RTK From the Sky technology and leverage our collective expertise in correction generation, PPP algorithms and the entire positioning ecosystem,” said Leos Mervart, head of PPP algorithm development at Hexagon’s Autonomy & Positioning division. “I’ve worked with PPP technologies since the beginning of my career and am proud to say that this is a new era of what global positioning can look like.”
The TerraStar-C PRO improvements are accessible now through the 7.08.10 firmware release for users on OEM7700, OEM719 and OEM729 cards and their associated enclosures for land and air applications.
Future firmware releases will include global RTK From the Sky technology throughout Hexagon’s correction service portfolios for its global client base, including precision agriculture and marine applications.
To learn more about TerraStar correction services or to request a free 5-day trial, visit NovAtel.com/TerraStar.