Category: Mapping

  • GPS + modeling reveal shrinking glacier

    GPS + modeling reveal shrinking glacier

    Photo: Jupiterimages/PHOTOS.com/Getty Images Plus/Getty Images
    Photo: Jupiterimages/PHOTOS.com/Getty Images Plus/Getty Images

    The Juneau Icefield Research Program (JIRP) calculates that thinning of Alaska’s Taku Glacier has increased from an average rate of 0.5 meter to 2 meters per year over the past two decades. Annual mapping by JIRP reveals the glacier’s thickness has varied from one year to the next, likely due to snow accumulation variability, but the overall current trend shows an annual net loss of ice.

    “Taku is losing enough meltwater every day to fill an NFL stadium,” said Seth Campbell, JIRP director of Academics & Research.

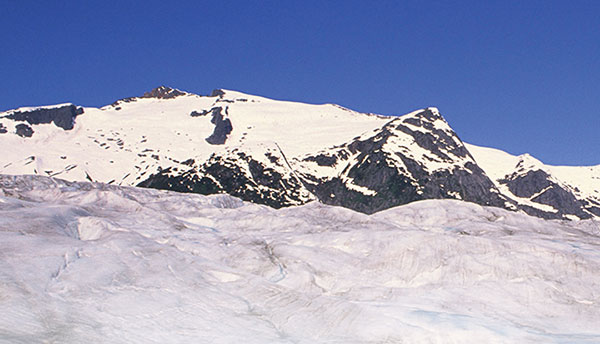
    At more than 800 square kilometers, Taku Glacier is the largest in the massive Juneau Icefield, making it vital to the study of climate change.

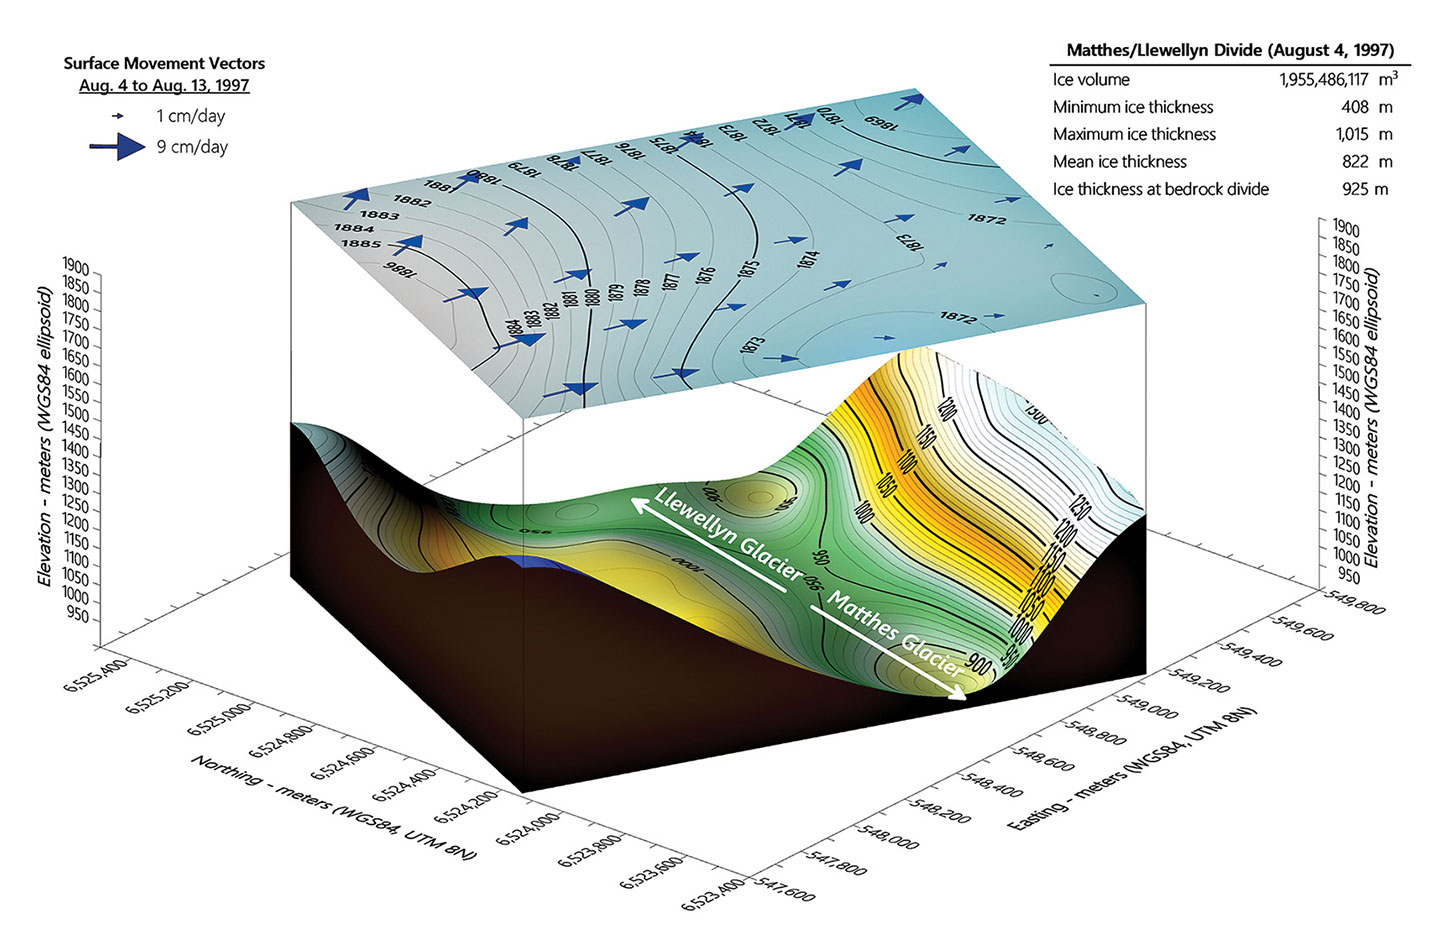
    JIRP monitors the complex kinematics and mass balance of the Juneau Icefield — changes to ice velocity, snow accumulation and surface melting — to estimate whether the glacier is advancing or retreating over time. The team maps yearly GPS field measurements in Golden Software’s Grapher and Surfer modeling packages.

    Image: JIRP/Golden Software
    Image: JIRP/Golden Software

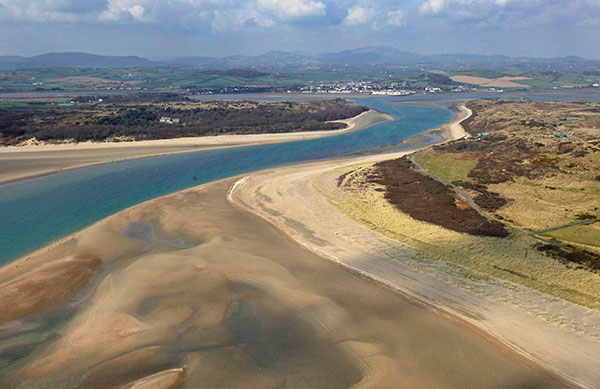
    Straddling the Alaska-Canada border, the receding icefield plays multiple important roles in local ecosystems. For British Columbia, it provides fresh water, but for the Gulf of Alaska, increasing glacier meltwater can potentially harm the marine ecosystem and valuable fisheries.

    JIRP research dates from 1946; the introduction of GPS in 1993 contributed significantly to annual summer fieldwork. Volunteers capture more than 1,000 GPS measurements at designated transect locations on the icefield each year to record glacial velocity and surface elevation changes.

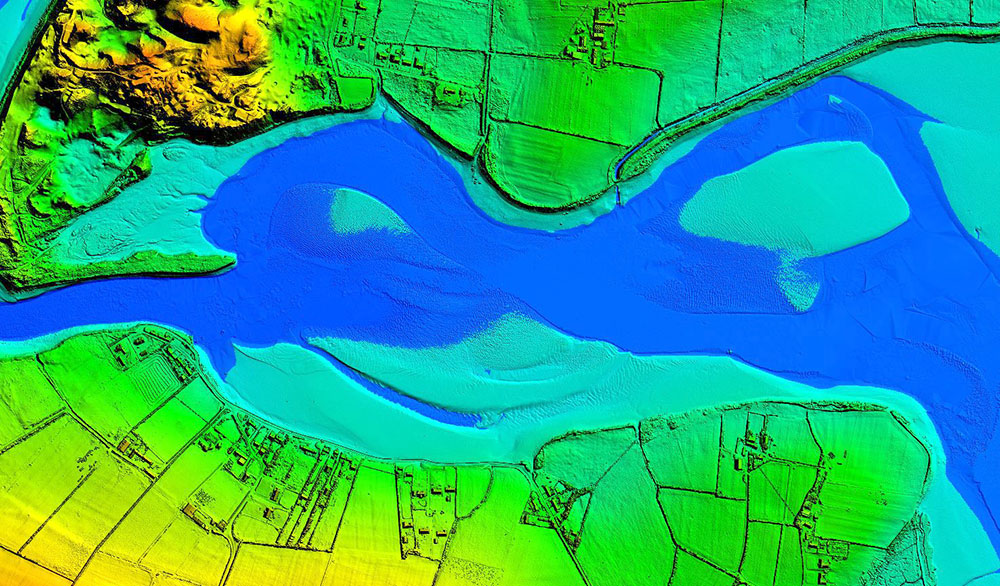
    Using Grapher, the team plots GPS “Z” elevation values across transects in 2D to generate thickness profiles. The scientists also input GPS field points for multiple transects from multiple years into the Surfer 3D surface mapping package to gain a sense of overall glacier volume change.

    The primary revelation from the JIRP work has been a greater understanding of how and where the glaciers are changing, according to Scott McGee, JIRP Geomatics Program Lead. Until recently, glacial melt was assumed to occur mostly at lower elevations of the icefield, where temperatures are generally higher. However, McGee and the JIRP team have routinely discovered thinning occurring at all elevations of the icefield, including at the highest elevations of 1,900 meters.

  • L3Harris provides detailed mapping for UAV flights

    L3Harris provides detailed mapping for UAV flights

    Image: L3Harris
    Image: L3Harris

    L3Harris provided a detailed digital map of Blacksburg, Virginia, to aid in the development of a Navigation Performance Forecast for UAVs, specifically for beyond-visual-line-of-sight flights.

    L3Harris used a novel method of 3D map generation using a deep stack of high-resolution satellite imagery and artificial-intelligence technology without the time or expense of a site visit. This detailed mapping technology, known as multi-view photogrammetry, was used in a pilot study to determine the viability of using modern, automated, mapping technologies to build a scalable methodology that can be applied to very large-size mapping programs, potentially covering the urban areas of North America and Western Europe.

    The company is using these 3D maps with its GNSS forecast technology to accurately predict GPS performance for UAS flight planning and operation. This prediction helps the unmanned aircraft service supplier and UAS operator ensure safe operations.

    The L3Harris Geospatial Data Products team provided 2D and 3D products, including the vector map shown above.

  • Remembering U.S. history by mapping internment camp with UAV

    Remembering U.S. history by mapping internment camp with UAV

    Photo: Eos Positioning
    Photo: Eos Positioning

    It has been 78 years since 110,000 Japanese-Americans were forcibly interned in 10 camps across the United States.
    In 1942, President Franklin Roosevelt signed an executive order announcing their internment. When World War II ended in 1945, the 10 camps were unceremoniously abandoned. The people interned there, their descendants, and historical groups are now trying to preserve memory of the camps.

    A new Esri StoryMap from Eos Positioning Systems explores the stories of two men whose lives were connected by Amache Internment Camp in southeastern Colorado.

    In the first chapters, we meet Dennis Otsuji, a renowned landscape architect who was born at Amache in 1943. Then we meet Jim Casey, GIS user and philanthropist on a quest to preserve Amache. Besides using Esri ArcGIS Online tools, Casey used the Arrow Gold GNSS receiver from Eos Positioning Systems for ground control points.

    In an unlikely story twist, Otsuji and Casey happened to meet when Otsuji went searching for his past, just as Casey was working to preserve the past. The StoryMap ends with the first augmented-reality look at Amache.

    The project — selected for Esri Favorite Stories of 2020 — was 10 years in the making. Learn more at Mapping Amache.

  • Bad Elf, ProStar partner on utility data solution

    Bad Elf, ProStar partner on utility data solution

    Photo: Bad Elf
    Photo: Bad Elf

    Mapping company ProStar Holdings Inc. and survey device company Bad Elf have partnered to produce a solution designed to gather the precise location of surface and subsurface utility data.

    PointMan combined with Bad Elf is designed to quickly and precisely, locate, identify and display critical surface and subsurface utility data.

    Bad Elf’s survey-grade GPS/GNSS receiver combined with ProStar’s flagship mobile-mapping solution, PointMan, now provides a powerful and user friendly solution for any industry requiring precision mapping including subsurface utility engineering (SUE) and utility locating professionals.

    “The Bad Elf Flex was quickly configured by ProStar and performed flawlessly with the PointMan app. We found that consistent high accuracy was easy to maintain while collecting data,” said Larry Fox, vice president of marketing and business development at Bad Elf. “The depth of collection tools and export facilities exceeded our expectations. Given the seamless integration with Bad Elf Flex, PointMan demonstrated it’s a top-tier app for utility management, and expands our ability to provide best in class solutions to our users worldwide.”

    “Equipment manufacturers like Bad Elf and their distribution networks are an important component of our sales and marketing strategy,” said Page Tucker, CEO and founder of ProStar. “Our goal is to continue to work with leading equipment manufacturers around the world to provide the most comprehensive, modern, and low-cost data collection solutions.”

    ProStar’s flagship product, PointMan, is natively cloud and mobile, offered as a Software as a Solution (SaaS). ProStar’s solutions are being adopted by some of the largest entities in North America, including Fortune 500 construction firms, the largest subsurface utilities engineering (SUE) firms, and government agencies.

    ProStar’s strategic partnerships are with geospatial technology and data-collection equipment manufactures and their dealer networks, including Trimble, Juniper Systems, Vivax-Metrotech, Radiodetection, Bad Elf and Subsite Electronics.

  • Phase One announces P3 drone payload for asset inspection

    Phase One announces P3 drone payload for asset inspection

    Photo: Phase One
    Photo: Phase One

    Phase One, a developer of digital imaging technologies, has announced the P3 Payload, a versatile solution designed for fast, efficient and safe inspection of critical infrastructure with an unmanned aerial vehicle (UAV).

    The P3 Payload includes a Phase One iXM 100MP or 50MP camera, one of the RSM lens options, and a new gimbal with integrated rangefinder.

    Available in the second quarter of 2021, the P3 Payload is offered in two configurations to meet a wide range of user requirements.

    • The P3 for the DJI M300 is plug-and-play, developed mainly for operators and service providers that already own, or are considering purchasing, a DJI M300.
    • The P3 MAVLink is ready for integration with drones based on the open-source MAVLink protocol, and suitable for bundling by OEMs and solution integrators.

    “The P3 addresses the unmet need for a high-quality, integrated imaging solution for inspection of critical assets where capturing the details is of paramount importance,” said Michael Messerschmidt, portfolio director for drones and inspection. “The P3 Payload is designed specifically for aerial drone inspection of diverse infrastructure where every flight — and every shot — must count.”

    The centerpiece of the payload is the customer’s choice of Phase One iXM 100MP or 50MP camera. Robust and waterproof, these sensors feature a dynamic range that guarantees sharp image collection in high-contrast or low-light environments. The variety of lens options ensures large surface areas can be captured with millimeter-level detail, even at safe distances from the asset. The new gimbal with the integrated laser rangefinder ensures precise and fast focusing on every shot, eliminating blurry and out-of-focus images.

    The P3 Payload is suitable for these inspection applications:

    • High-value assets. Bridges, dams and energy facilities where the value of the structure itself is high and the demand for frequent, accurate and detailed data is critical.
    • High-risk assessment. Electric transmission lines, oil refineries and other complex sites where inherent danger requires high-resolution inspection from a distance that is safe for the structure, the drone and personnel.
    • Time-critical assets. Wind turbines, offshore oil rigs, and other facilities where inspection windows are limited, and every UAV flight must successfully capture the required information.

    “We developed the P3 Payload for cost-effective, productive operation so that large surface areas can be covered in fewer images, significantly shortening the mission time,” Messerschmidt said. “More importantly, the P3 can be operated with minimal risk to the asset and ground crew.”

  • New gateway connects users to Open Maps for Europe

    New gateway connects users to Open Maps for Europe

    Image: EuroGeographics
    Image: EuroGeographics

    Free-to-use maps from more than 40 European countries will be made available through a new online gateway.

    Open Maps for Europe will signpost and provide easy access to pan-European open data created using official map, geospatial and land information.

    The project, which is co-financed by the Connecting Europe Facility of the European Union, is coordinated by EuroGeographics, the voice of European National Mapping, Cadastral and Land Registration Authorities, in partnership with the National Geographic Institute (NGI) Belgium.

    Users will be able to access the data, created by the not-for-profit membership association, through an online interface developed by thinkWhere. The specialist in open source geographic information system (GIS) technologies will deliver the enhanced gateway for discovering, viewing, licensing and downloading the open datasets after winning an open tender.

    The open data will include topographic data, a digital elevation model, imagery, a cadastral index map, and a regional gazetteer. The first maps are expected to be available in summer 2021.

    “As the official national sources of map, cadastral and land information, our members’ data is fundamental to the everyday lives of people across Europe,”said Angela Baker, program manager, Data Access and Integration, EuroGeographics. “We may not always realise it, but their authoritative information underpins our public services, provides certainty of property ownership and helps to save precious time and potentially save lives when responding to emergencies. In an ever-connected world, it is also increasingly used in a wide range of applications relied upon by both citizens and businesses.”

    “The Open Data Directive recognises that the value of data lies in its use and re-use. By providing easy access to free to use harmonised maps for Europe, our members want to boost the development of these innovative services. Their aim is to encourage greater use of their official geospatial data to drive market development and economic growth, and increase competitiveness by reducing costs.

    “By working to ensure their data is interoperable, readily available and easily accessible, they are demonstrating a commitment to delivering Open Maps for Europe both now and in the future.”

    Alan Moore, Chief Executive, thinkWhere added: “We are delighted to be working with EuroGeographics and its members on the Open Maps for Europe project where the primary aim is to drive up the use of official geospatial and open data.”

    “Our mission is to make geographic data highly accessible, easy to use and an essential part of your information architecture. Collaborating with EuroGeographics and its members we will harness the power of our cloud-based geospatial data infrastructure and drive the development of a user-centric portal that makes it easy to find, view, publish and share the rich suite of pan European digital mapping, cadastral and topographic datasets.”

    Open Maps for Europe runs until Dec. 31, 2022.

    EuroGeographics is an international not-for-profit organization and the membership association for the European National Mapping, Cadastral and Land Registry Authorities. It brings together members from 46 countries, covering the whole of geographical Europe.

  • Hexagon releases machine-learning GIS tool for smart cities

    Hexagon releases machine-learning GIS tool for smart cities

    Hexagon’s Geospatial division has launched M.App Enterprise 2021, a significant update to its platform for creating geospatial and location intelligence applications. The latest release features new browser-based 3D capabilities and enhanced visual effects, plus the ability to create and configure custom applications more easily.

    M.App Enterprise 2021 adds complete and seamless integration with Hexagon’s LuciadRIA. Now, users can access LuciadRIA’s 3D features, including support for panoramic imagery, shading, ambient occlusion and other visualization effects, to build browser-based solutions with no development necessary.

    The latest version also features a new browser app configurator that makes it even easier to create spatio-temporal dashboards, known as Smart M.Apps. Additionally, Feature Analyzer has been expanded to allow users to add and manage multiple datasets on the fly and set up workflows. These enhancements enable more dynamic configurations, allowing field workers to be alerted quickly when action is required.

    The city of Klagenfurt, Austria — a long-time Hexagon customer — has already begun using M.App Enterprise 2021 to create a city app platform that features a detailed 3D urban landscape of the entire city.

    “This opens up endless possibilities for applications to automate several manual processes within different departments of the city,” said Günter Koren, head of the department of surveying and GIS at the city of Klagenfurt. “We believe M. App Enterprise will be an essential step in our journey to become a smarter, safer city for our 100,000 citizens.”

    The latest release contains other new features and improvements, including an overhauled style editor, a new default dark theme, options for customized theming and full support for SAP HANA databases.

    “M.App Enterprise 2021 helps organizations achieve smart monitoring of their cities, infrastructure and services by seamlessly incorporating location intelligence into enterprise systems and workflows,” said Georg Hammerer, chief technology officer of Hexagon’s Geospatial division. “With augmented visuals and dynamic configurations, this new version of M.App Enterprise can help customers easily set up powerful applications, allowing them to be more productive and efficient.”

    Screenshot: Hexagon Geospatial
    Screenshot: Hexagon Geospatial
  • Topcon partnership with CyArk bolsters cultural site archiving efforts

    Topcon partnership with CyArk bolsters cultural site archiving efforts

    Screenshot: CyArk
    Screenshot: CyArk

    Topcon Positioning Group is partnering with CyArk, a non-profit organization committed to the conservation of cultural heritage sites around the globe.

    Using 3D digital documentation technology, CyArk works to ensure that culturally significant sites can be thoroughly and accurately documented for the benefit of current and future generations. Many of the technologies needed for doing so come from the geospatial world, making the Topcon partnership a welcome one, according to John Ristevski, CEO of CyArk.

    “We have supported the documentation of over 200 sites around the world from the Mosque City of Bagerhat in Bangladesh to the iconic statues on Easter Island, but the need for high precision documentation continues to grow and there are many exciting projects yet to come,” he said. “High-precision measurement and documentation of these culturally significant sites is critical for decision making, so we are thrilled to be partnering with Topcon, an industry leader in that area and more.”

    The commitment from Topcon includes GNSS receivers, robotic total stations, field controllers, MAGNET software and a subscription to Topnet Live, the company’s real-time GNSS reference network. According to Ulrich Hermanski, executive vice president of Geopositioning for Topcon Positioning Group, having worked alongside CyArk in the past, it was a pleasure to continue to support the organization in this way.

    ”Our relationship with CyArk dates back to 2015 when we helped them digitally document the Sogi Power Plant, one of Japan’s national industrial historic sites,” Hermanski said. “We quickly recognized and admired the crucial role they are playing in ensuring cultural landmarks of all types are preserved in a digital format. Our expertise — providing precision measurement solutions — blends perfectly with their needs, now and as they move forward.

    “One of the first projects on which they plan to use the new solutions is mapping the redwood grove in Big Basin Redwood State Park, in California, an area that suffered severe damage in the recent wildfires,” Hermanski said. “We are pleased to help with this important effort.”

    CyArk’s mission, to record, archive and share the world’s most significant cultural heritage sites, stems from a desire to not only save these places digitally but provide critical information to aid in the physical conservation and restoration of the sites today.

    “In recent years alone, we’ve seen instances in which culturally-invaluable sites were damaged or lost to arson, terrorism or the effects of climate change,” said Ristevski. “To know that the accurate digital documentation efforts can play a role in rebuilding or reconstruction is a humbling opportunity. We are grateful to have Topcon partnering with us in our efforts.”

  • Trimble SX12 total station adds features for tunneling

    Trimble SX12 total station adds features for tunneling

    Photo: Trimble
    Photo: Trimble

    Trimble has introduced its SX12 Scanning Total Station, the next iteration of its 3D scanning total station that provides fast and efficient data capture for surveying, engineering and geospatial professionals.

    New features include a high-power laser pointer and high-resolution camera system, expand capabilities in surveying, and complex 3D modeling. The SX12 enables enable new workflows in tunneling and underground mining, Trimble said.

    The Trimble SX12 merges high-speed 3D laser scanning, Trimble VISION imaging technology and high-accuracy total station measurements into familiar field and office workflows for surveyors.

    A new green, focusable Class 1M laser pointer — safe for viewing with the naked eye — offers high-power visibility and makes it easy to see at a distance. An improved camera system provides enhanced pointing and site documentation capabilities.

    “The new SX12 adds more features and applications to an already widely adopted, field-proven scanning total station,” said Gregory Lepere, marketing director of Optical and Imaging for Trimble Geospatial. “The addition of a premium laser pointer completes the picture for surveyors wanting an instrument that can operate as an everyday high-end total station with the added value of scanning and imagery.”

    Tunnels and underground mining

    The Trimble SX12 allows users to quickly and easily operate with common survey workflows, including new versions of Trimble’s field and office software.

    With Trimble Access 2021 Field Software, users can harness the full potential of the Trimble SX12, whether performing accurate measurements or comparing 3D scanning as-built data in the field. The combination is designed for infrastructure projects such as utilities, roads, rail, water, transportation and telecom.

    The laser pointer enables new applications for laser-guided drilling and excavation guidance, rock bolt and blast hole set out, and as-built verification for underground tunnel and mine construction.

    By integrating rich data from the Trimble SX12 into intuitive office workflows, Trimble Business Center version 5.40 enables users to quickly create complete customer deliverables. With its enhanced point-cloud management, eCogAI automated information extraction, and interoperability to leading CAD and GIS packages, the solution empowers users to exceed even the toughest client demands.

    The combination also enables the capture of tunnel point clouds for as-built comparison, automated tunnel extraction routines and detailed 3D mesh inspection resulting in intuitive reporting deliverables for construction verification.

    “Tunneling projects are highly dependent on accurate positioning to precisely control equipment and track progress in difficult underground construction environments,” said Boris Skopljak, marketing director of Monitoring and Tunneling for Trimble Geospatial. “The combination of the SX12 and new software workflows, simplifies the capture of site conditions, enabling tunneling and mining surveyors to make accurate and informed decisions without the complexity and additional cost of multiple systems.”

  • Bluesky to create 3D map of Northern Ireland’s coastline

    Bluesky to create 3D map of Northern Ireland’s coastline

    Dundrum Bay on the coast of Northern Ireland is captured by a mapping airplane in a project to document climate change effects. (Photo: DAERA/Bluesky)
    Dundrum Bay on the coast of Northern Ireland is captured by a mapping airplane in a project to document climate change effects. (Photo: DAERA/Bluesky)

    Bluesky International will use aircraft-mounted lidar sensors and laser scanners to create a highly detailed 3D map of the whole of the Northern Ireland coastline.

    Working on behalf of the Department of Agriculture, Environment and Rural Affairs (DAERA), the lidar survey will be used to create the first complete baseline. The baseline will underpin recording of coastal change and help identify the rate at which the coastline is changing as a result of climate change.

    In addition to the lidar data Bluesky will simultaneously capture high detailed aerial photography which will be processed to produce to a fully orthorectified, 10-centimeter-resolution database.

    The Bluesky data will form part of the wider Northern Ireland 3-dimensional coastal survey. The survey will extending into the marine environment with a satellite-derived bathymetric survey and a pilot bathymetric lidar survey. Together, the surveys will inform the development of future coastal management policies.

    “The Northern Ireland coast is a hugely valuable resource which is currently facing increasing pressure from climate change,” said Joanne Hanna, senior scientific officer within the Marine and Fisheries Division of DAERA. “Sea-level rise, in combination with an increase in extreme storm events, is resulting in greater energy impacting our coastlines, altering coastal processes and accelerating change.

    “Despite the importance and the value of this coastline, the nature and scale of the issues arising from coastal change and sea-level rise are currently not known and there is limited and insufficient baseline data available,” Hanna said. “The coastal lidar survey carried out by Bluesky will provide scientifically robust baseline data which will enable decision makers and coastal managers to make informed decisions and devise solutions and appropriate management to the problems currently facing our coastline.”

    Bluesky will undertake the specialist survey using a fixed wing manned aircraft and will fly the 763 kilometres of Northern Ireland coastline capturing height measurements of both the underlying terrain and any surface features at a resolution of better than 16 points per metre. This data will be used to create highly accurate 3D digital terrain and surface models (DTM, DSM) with a spacing of up 25 centimetres.

    The Bluesky datasets will be supplied ready for use in a range of geographical information system (GIS), desktop mapping and other specialist software packages and will be compatible with other DAERA datasets including Ordnance Survey mapping.

    Photo: DAERA/Bluesky
    Photo: DAERA/Bluesky
  • Topcon Positioning Group launches point creation software

    Topcon Positioning Group launches point creation software

    Photo: Topcon Positioning Group
    Photo: Topcon Positioning Group

    Topcon Positioning Group has released Topcon Point Manager, a point creation software that’s available as a plug-in for Autodesk AutoCAD and Autodesk Revit users in the U.S. and Canada.

    According to Topcon, the solution is designed to automate point creation and easily import and export layout files to and from a robotic total station. It’ll also simplify the BIM-to-field process with a faster, more seamless point creation experience from within the design platform, reducing the time and cost of layout, Topcon added.

    “Unlike standalone point creation software, which requires the user to leave their particular design environment, users of these two widely used Autodesk technologies will be able to access the solution as a plug-in component to their design package,” said Ray Kerwin, director of Topcon global product planning. “Users will benefit from the ability to automatically create multiple points on BIM objects and 2D/3D drawings from within the Autodesk environments. Just as importantly, however, they will see an increase in their quality assurance and control efforts through easily generated point and deviation reports; a likely reduction in on-site personnel (key during these challenging times), and, with the simplified processes, avoid costly construction errors and rework — the goal of most any operation working in today’s highly competitive construction environment.”

    Photo: Topcon Positioning Group
    Photo: Topcon Positioning Group

    In addition, Topcon MAGNET users can wirelessly send points to the field for layout and completed layout files can be sent back to the office to update the model to match as-built conditions.

    “With the cloud-connected MAGNET workflow, BIM personnel or CAD teams can immediately share information to and from the field crew using a layout device. Doing so can prove invaluable, as any conflicts in point data can be quickly identified, keeping production levels up and eliminating costly rework,” Kerwin added.

    Topcon Positioning Group designs, manufactures and distributes precision precision measurement and workflow solutions for the global construction, geospatial and agriculture markets.

  • Golden Software releases updated 3D surface mapping package

    Image: Golden Software
    Image: Golden Software

    Golden Software has improved visualization and other functionality in the new version of its Surfer gridding, contouring and 3D surface mapping package. Surfer users now have a greater number of options for displaying their scientific data in the new version, the company said.

    Surfer enables users to model data sets, apply an array of advanced analytics tools and graphically communicate the results in ways anyone can understand, Golden Software added.

    “In the new Surfer release, we worked on making it easier for users to gain insights into their data sets by providing additional visualization tools,” said Kari Dickenson, Surfer product manager. “New display options also enable users to more easily communicate the information extracted from their data.”

    The updated Surfer

    In its latest version of Surfer, Golden Software has added the peaks and depressions layer type. This layer type automatically identifies and outlines closed high and low areas, or peaks and depressions, in a grid file. In addition, a statistics report is generated for the areas, including information such as length, width, depth, volume and orientation. The feature also allows high and low areas to be colorized, annotated and displayed on their own.

    The company also added four new capabilities to 3D Views: color scale bars can be added to explain the elevation, concentration or other data values depicted by colors; VRML file format exporting enables users to export their 3D Surfer model into another 3D software package or to a 3D printer; anti-aliasing makes axes and grid lines inside the 3D model appear smoother and more professional; and improved 3D PDF exporting has reduced the PDF file size and made the file exporting process faster.

    In addition, Golden Software added several existing capabilities to the automation function so that users can write scripts to automate certain workflows. Automated features now include base from data layer type, vector base map symbology, new scale bar options, new legend options and new grid data options. Finally, the new Surfer version allows users to identify objects in vector base maps, such as polygons, polylines or points, by automatically renaming them based on any attribute, as well as select multiple polygons and choose to calculate their statistics, areas or volumes either as a single combined polygon or as individual polygons.

    Surfer Beta

    Golden Software released a Beta version of Surfer simultaneously with the new version to give customers a chance to try out new features while they are still in development. The three features the company plans to release for the spring/summer 2021 release of Surfer include 3D base maps, contour volume/area calculation and more automated features.

    The 3D base maps feature allows .DXF, .SHP and other file formats to be imported with their 3D geometry (3D polylines, polygons and polymeshes) and displayed as three-dimensional features in the 3D View.

    A new shortcut also will enable users to calculate volumes and areas above, below or between contour lines with just a few clicks of the mouse, the company said. Finally, additional functions that have been added to automation include point sample, grid project, new classed post layer options and label options for the degrees-minutes-seconds label format.

    Golden Software, headquartered in Golden, Colorado, develops 2D and 3D scientific modeling packages.