Category: Mapping

  • Tennessee leverages GIS technology to streamline septic permits amid rapid population growth

    Tennessee leverages GIS technology to streamline septic permits amid rapid population growth

    Throw a dart at a map of Tennessee. You will probably hit somewhere that is growing. Nashville’s outskirts are projected to add a quarter to their population in the next 15 years. The Ford Motor Company has begun construction on the BlueOval City manufacturing plant outside of Memphis. A multibillion-dollar uranium enrichment facility has broken ground in the Knoxville exurbs.

    Tennessee growing at double the rate of the rest of the U.S. does not surprise anyone who issues residential building permits in the state. Inspectors at the Tennessee Department of Environment and Conservation (TDEC) saw requests for subsurface sewage disposal system services jump 18% in one year. “It’s a monumental, staggering rate to grow,” said Steve Owens, the TDEC environmental consultant tasked with expediting service delivery across the state.

    Owens, a meteorologist by training, hydrologist by virtue, and self-taught geographic information system (GIS) engineer by practice, streamlined the work of TDEC inspectors with enterprise GIS technology. With it, a team of fewer than 100 inspectors processed over 23,000 requests last year in Tennessee’s rural fringe communities.

    Designing a System Around How Inspectors Work

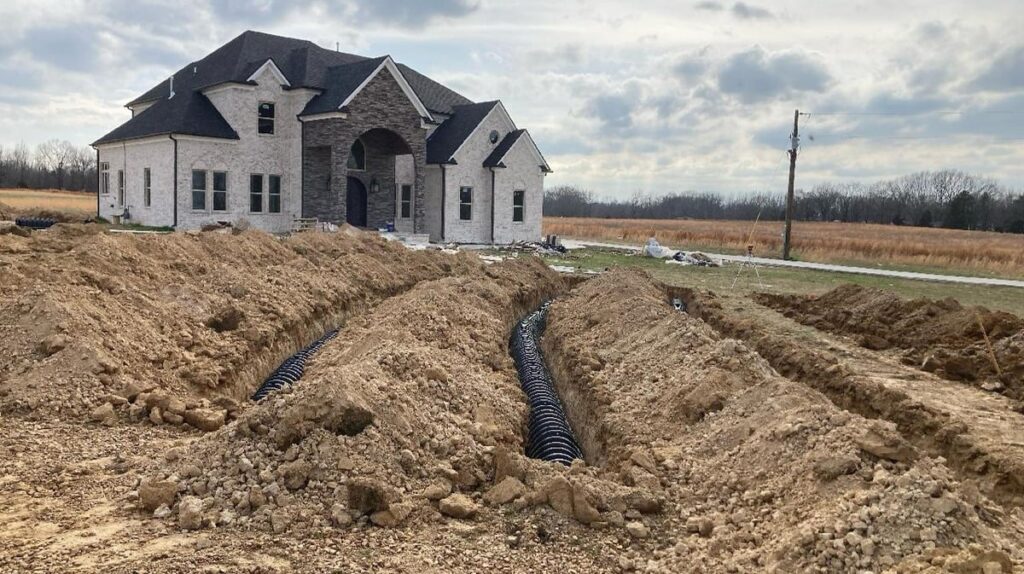
    About one in five Americans lives in a home that relies on a septic system. They are built in remote areas too far to connect to municipal sewage systems, which happen to be the places where Tennessee is growing the fastest. High demand for housing created a sense of urgency to issue permits as swiftly — and as safely — as possible.

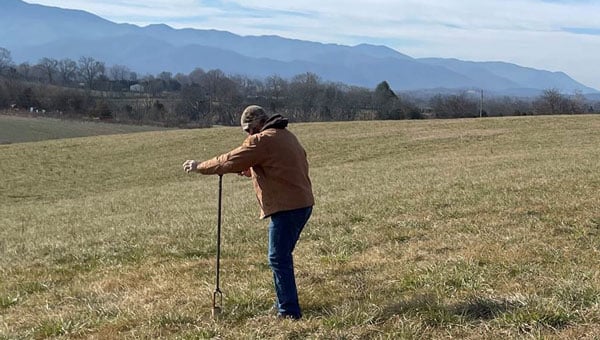
    Owens spent his early career in a truck as a septic permit inspector. “It’s hard work,” he said from his Memphis office. “You’re dealing with outdoor conditions all day and you’re never working fast enough.”

    Inspectors often eat lunch in their trucks while driving to their next site. The septic systems that they design, permit and inspect treat wastewater from homes and businesses. These systems must be well suited to the specific soil conditions of the land to work properly. When evaluating proposed subdivisions, inspectors conduct a range of fieldwork assessments — such as soil profiles, percolation data, and absorption rates — all while answering calls from the public.

    Inspectors assess whether a new septic drain field meets state regulations before the property can be occupied.
    Inspectors assess whether a new septic drain field meets state regulations before the property can be occupied.

    A malfunctioning or ill-fitted septic system can pollute wells of drinking water and springs. Foul-smelling sewage can pool on the surface, creating a breeding ground for parasites, mosquitoes and other vectors that can spread pathogens to neighbors and pets.
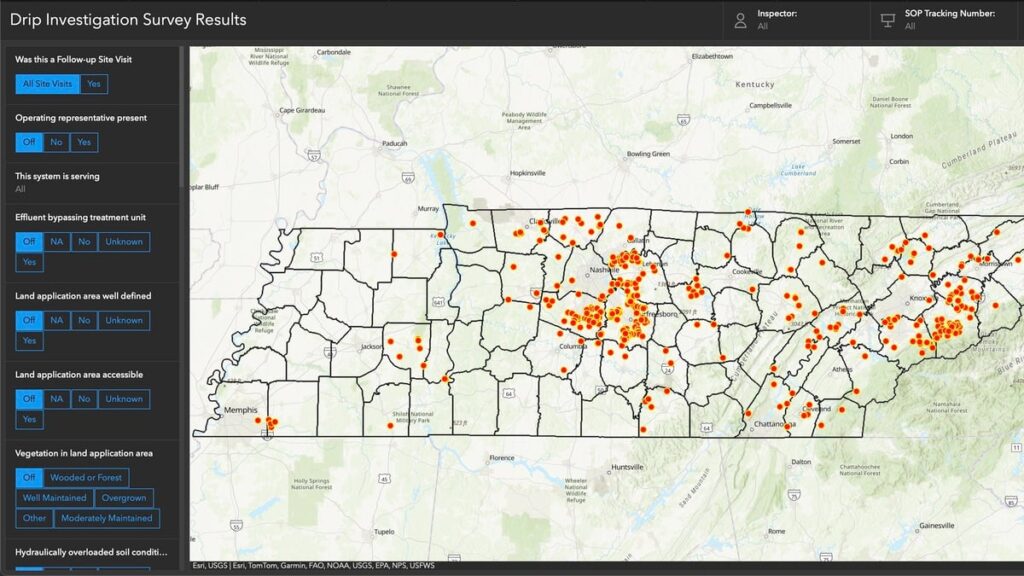
    June 2024 TDEC audit of drip dispersal systems documented more than 400 site visits in a short time frame. Inspectors used an ArcGIS enterprise program to compare standard observations and record site-specific notes and photographs at each site. Results are filtered and displayed on an interactive map.

    The audit represents a fraction of the work that TDEC permit inspectors do. Complaint investigations, repair designs, and expansion assessments are among the 13 different types of services inspectors deliver each day. To modernize, Owens configured an enterprise GIS to manage the full scope of operational data for those services—from how residents make requests, to how inspectors execute the work and get documentation to the customer, to how management reports progress.

    “It’s different from the typical mapping and analysis you might associate with GIS,” Owens said. “We’re utilizing ArcGIS Survey123 and ArcGIS Dashboards to create an efficient ecosystem for what we do with our work and how to get that work out to the public.”

    The drip dispersal system audit documented all results from more than 400 site visits.
    The drip dispersal system audit documented all results from more than 400 site visits.

    A “Flintstones to Jetsons” Digital Transformation

    As recently as seven years ago, Tennessee septic permit data existed entirely on paper. Pulling a permit meant driving to a state office in the county seat and making photocopies. Digitization came with an announcement from the governor that made headlines across the state. Trucks hauled away filing cabinets full of septic records, and technicians scanned their contents to create a FileNet public document system of record. “We have gone from Flintstones to Jetsons in the last decade,” Owens said.

    In the past, permit requests came to TDEC inspectors as a list of addresses and contact information. Inspectors started each day punching addresses into online mapping sites, guessing at an efficient route. Their days ended back at the office to log their time, update templates, and input data into various spreadsheets.

    In high-growth counties, where multiple inspectors collaborate to tackle a significant workload, they often duplicated efforts. “It would not be uncommon for someone to go out to a site on Wednesday, and the next guy would go out there on Friday and not know the work had already been done,” Owens said.

    Owens considered the extensive manual processes involved in permit inspections. Having used GIS technology for environmental impact assessments for other TDEC projects, he knew the work could be automated. “We had already been using mobile GIS tools for some time at that point, so staff were used to it,” Owens explained. “I thought we could utilize a lot of the tools that Esri already has built in and customize it a little bit to meet our needs.”

    Conversations with TDEC managers confirmed the hunch. Inspectors were spending up to two hours each day planning their routes and logging what they had done. “It ended up being somewhere about 34,000 hours a calendar year just figuring out where we’re going and tracking what we do,” Owens said.

    The project to upgrade the workflow with GIS would pay for itself in eight months if they could cut the tracking and logging time in half.

    Automating Data Editing and Management Workflows

    Owens envisioned a system that would link service requests to jobsite workflows. He designed configurable applications for inspectors to use for data collection. Permit and inspection data would integrate into an enterprise geodatabase that serves as a source of truth for TDEC septic service requests. The database would sync to the public document viewer.

    In the new GIS-based system, residents and developers make permit service requests by filling out an online application. The system then locates the request, assigns an inspector, and sends the appropriate form that guides the inspection work. Inspectors check the boxes, record the test results, upload photos and drawings, and issue letters and certificates—all from tablets in the field.

    Inspections in the queue now appear on a shared map.
    Inspections in the queue now appear on a shared map.

    Submitting the completed permit or inspection through ArcGIS Survey123 generates PDFs that automatically go to the applicant, TDEC staff, and the database that syncs to the public site.

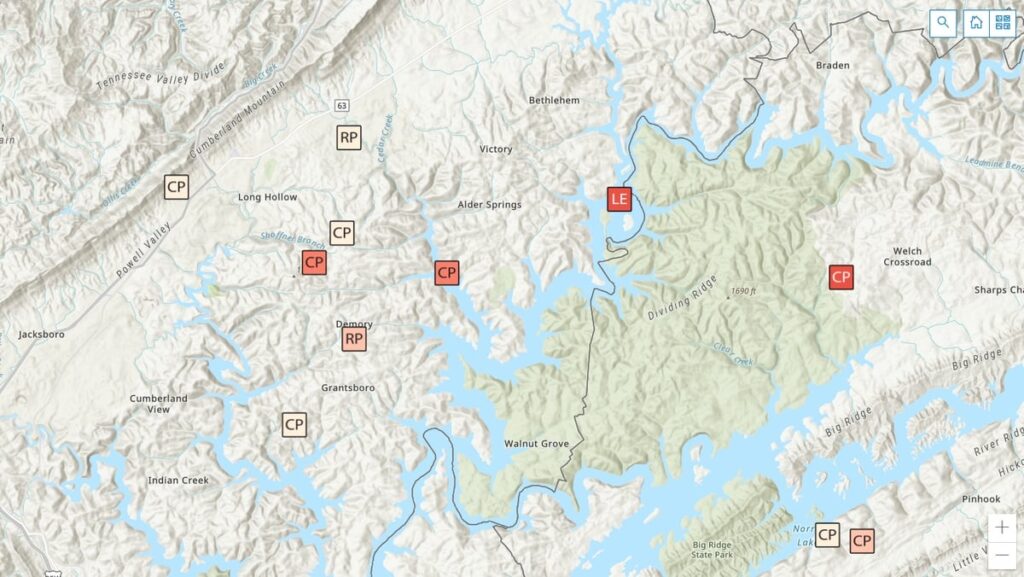
    “The real gem is for staff to be able to plan their day by using a map instead of entering all that data into online map tools and seeing what they come up with for their route,” Owens said. The map is part of a real-time operations dashboard with hundreds of requests dotted across Tennessee.

    Points colored with darker hues alert inspectors to older requests—fees are waived if they are not completed within 45 days. All the related information—requester contact, location data, violations, resolutions, test results, and historical records—is organized by location. “This used to be done in spreadsheets and file cabinets so it’s a huge time-saver,” Owens said.

    TDEC staff now have a completed inspection report that details their work across the state and allows managers to keep an eye on the completion rate.
    TDEC staff now have a completed inspection report that details their work across the state and allows managers to keep an eye on the completion rate.

    When management sees clusters of requests on the map, they know it is time to reallocate resources. “They can pull in inspectors from other counties to get the work done, and then go back to normal workload,” Owens added.

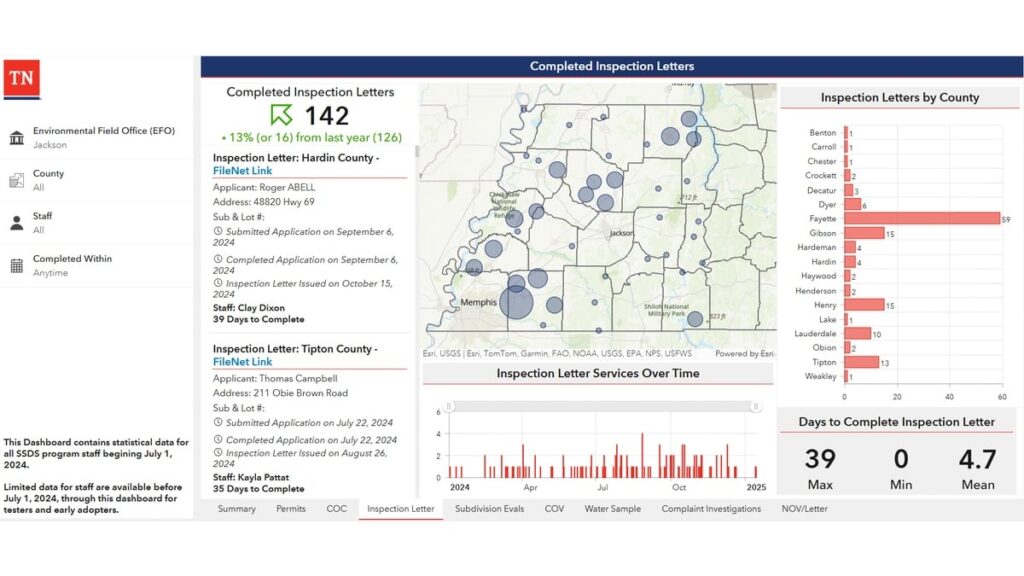
    Management watches a splash page that tabulates completed work to keep a pulse on field staff and avoid backlogs. They can drill down on how long specific tasks are taking, and view performance metrics for individual staff members. They pay close attention to the average number of days it takes to issue permits. If the times go up, they have the data to bring to the budget office to justify hiring more inspectors.

    Amid Tennessee’s building boom, officials face intense pressure to keep pace and deliver high-quality results. Modernizing their permitting and inspection system has provided TDEC with tangible efficiency gains to present to legislators and the public.

    “This was a major investment in our division, and we want to let them know that, ‘we hear you,’” Owens said. “We can show how much work that we have done to address those concerns, and the output speaks for itself.”

    This year, TDEC was awarded honorable mention by the Environmental Council of the States (ECOS) in the State Innovation category for their septic permitting modernization project.

    Learn more about how state and local governments use GIS to empower environmental compliance.


    This article originally appeared at Esri Blog.

  • The spatial AI revolution: Entering the age of intelligence

    The spatial AI revolution: Entering the age of intelligence

    The intriguing paradox about the information age is that it relies on semiconductor chips, which are fundamentally made from sand (silicon dioxide) — the most tangible and seemingly infinite resource on Earth. Yet, in 2023, the global digital storage capacity reached 110 zettabytes (110 followed by 21 zeros), which is a staggering figure; in fact, it is 15,000 times more than the number of grains of sand on Earth and it’s doubling every three years. The information age is suffering from excess information. Data is consuming the universe.

    The velocity and quantity of information are overloading the ability to process it. This causes data-driven decision-making systems to fail. The limiting factor is human cognitive capacity to select, prepare and process the data, plus the ability to analyze it for meaningful insights. It is reminiscent of the early days of the Corona satellites of the TALENT KEYHOLE (KH) mission series that began in the 1950s during the height of the Cold War.

    Understanding activities behind the Iron Curtain was critical for national security. The KH
    satellites were expensive to launch and had short life spans. They used rolls of wet film dropped from space and captured by specialized aircraft with hooks to catch the canisters in mid-air. The low-resolution images (3 m to 5 m per pixel) were processed manually in darkrooms. Teams of 100 specialists, using razor knives and scotch tape, meticulously pieced together image strips into massive mosaics spanning several square meters. Working around the clock, assembling the full image would take up to five days, with subsequent analysis requiring another week. In total, from catching the film canister to delivering a final intelligence report, it took 17 days — a testament to imagery intelligence in the industrial era, characterized by massive operations demanding significant time and manpower, but it was too expensive and unsustainable.

    Photo: PRESIDENT EISENHOWER awards Capt. Mitchell, USAF, C-119 pilot, the Distinguished Flying Cross for the first ever capture of
a film cartridge dropped from space, in a photo circa 1960. cia.gov/resources/csi/static/corona.pdf
    Photo: PRESIDENT EISENHOWER awards Capt. Mitchell, USAF, C-119 pilot, the Distinguished Flying Cross for the first ever capture of a film cartridge dropped from space, in a photo circa 1960. cia.gov/resources/csi/static/corona.pdf

    “We live in a world where there is more and more
    information, and less and less meaning.”

    — Jean Baudrillard,

    “Simulacra and Simulation,” 1994

    In 1976, the technological landscape shifted dramatically with the launch of the KH-11 satellite, which could transmit 15 cm resolution images digitally to ground stations and was capable of distinguishing objects as small as a dinner plate. The satellite dramatically compressed intelligence-gathering timelines. Processing and analysis time decreased from 17 days to mere hours. The first digital image was shown to President Carter. That first image is believed to be of ongoing tensions in the Middle East, but it symbolized more than the triumph of technology; it represented a fundamental shift marking the end of the industrial era and ushered in the information age.

    Advancements in imagery were paralleled by developments in mapping, driven by the need for accurate spatial referencing. Various technologies throughout the 1970s offered partial solutions, but a solution did not happen until 1981 when Esri introduced Arc/INFO, a breakthrough geographic information systems (GIS) software that could operate on minicomputers instead of huge mainframes. That formed the basis of modern spatial analysis and visualization technologies; coming together with digital imagery is what allowed the information age to overtake the industrial era.

    In 2025, a similar technological transformation currently is underway. As the amount of information overwhelms existing systems, artificial intelligence (AI) is emerging as the solution. The information age is transforming into the intelligence age, where big processing meets big data. Advanced algorithms, machine learning and large language models (LLM) can swiftly and efficiently handle vast amounts of information. So, with data being the new oil, AI is the refinery.

    The Esri Federal GIS Conference in February could have been promoted as the “Dawn of GeoAI” conference. The term Geo AI is a subset of Spatial AI, and it is in its infancy. Esri is incorporating AI into many of its applications. Companies at the expo were teasing Spatial AI solutions in their products and services.

    What is Spatial AI?

    When the transformative power of AI is combined with spatial information systems, magic happens. Value is created that did not exist before.

    Spatial intelligence is the ability to think, visualize and understand in three dimensions. It is one of the primary types of intelligence. Currently, Spatial AI is capable of interacting with analysts using natural language to build models and perform tasks. Similar to so much else happening with AI, its capabilities are increasing rapidly.

    Photo: A CORONA SATELLITE image of Moscow captured May 28, 1970, as part of the TALE…
    Photo: A CORONA SATELLITE image of Moscow captured May 28, 1970, as part of the TALE…

    With iterative learning, the AI repeats a task millions of times on various training data to perfect its abilities, running through different scenarios multiple times with different datasets while completing multiple tasks. The AI quickly learns and can eventually surpass humans. This makes AI a super tool.

    Combine that capability with AI’s ability to access and infer an entire compendium of knowledge on a subject. The AI is able to ingest text, images, audio and video in minutes, and then reason and understand them all within the context of the parameters provided. Through its own AI agents, it will automatically run functions to garner insights, and then communicate those results through data visualizations, text, audio and natural speech. Spatial AI is an evolved form of AI able to understand data in the context of space and time within the body of knowledge it can access. It will monitor everything in real time to identify anomalies and hidden patterns and provide deep insights. It doesn’t just solve the information overload dilemma for data-driven decision-making, but it enhances it far beyond expectations.

    The Coming World of AI Assistants

    The future is already here. Reality is approaching science fiction at warp speed. A person living 100 years ago would only be able to understand the world of today as magic; and likewise, the world 20 years from now will appear magic to us.

    Interfacing with a Spatial AI system is similar to the multi-dimensional world we already exist within. Flat screens, keyboard and mouse will be secondary tools behind natural language and natural gestures and immersive experiential environments. The Spatial AI- enabled world will blur the lines between what is virtual and what is real. Jobs, businesses and the economy already are transitioning. The most well capitalized businesses are investing in this new technology.

    One of the industries at the forefront is healthcare. Imagine you are a neurosurgeon. Your patient has a glioblastoma identified by the MRI/CT scans uploaded into the Spatial AI Medical Assistant called SAIMA (pronounced Sāmă; when speaking with the system, you call it “Sammi”). The MRI/CT scans show a 3D model of the patient’s brain, highlighting the glioblastoma in red. Placing the integrated augmented reality (AR) glasses on, you can zoom in on the glioblastoma to see the extent of the growth and view it from any angle. This helps formulate a surgery plan. The patient’s medical records are in SAIMA along with the corpus of knowledge about glioblastomas. SAIMA is regularly updated with the latest algorithms and models. After reviewing the preliminary data, you have SAIMA run the spatial analytics and all the applied functions on the data. It takes approximately 35 minutes to complete. During that time, you review the SAIMA updates and go to lunch. You receive a text message from SAIMA after it completes its processing, letting you know it is finished without encountering any issues. SAIMA works with a system called VisAR, which is a precision surgical navigation system. After returning to your office, you put on the VisAR glasses to begin the review. Sammi begins by showing you the glioblastoma and pointing out it is a large, heterogeneous mass located in the frontal lobe and appears to be 4 cm to 5 cm in diameter, in an irregular shape with nodular and cystic components. As it goes through the review, it zooms in and rotates the 3D image, highlighting the exact area being talked about. You interrupt Sammi during this review and ask if the patient has been experiencing motor function issues since the tumor is in the frontal lobe, and you continue to probe further in a natural conversational tone as you delve deeper into the analysis. The conversation between you and Sammi is recorded and added to the file.

    The review with Sammi takes several hours, during which a high-confidence surgery plan is developed that you will present to the multidisciplinary tumor board, who will further query SAIMA. This thorough process ensures the best results and further trains SAIMA about glioblastomas, which will be used for a post-surgery debrief and for insurance purposes. Following a successful board meeting, SAIMA proceeds to reserve the operating room, schedule the patient, and create a detailed surgery plan with specific duties and exact times for each member of the surgical team. This plan is then disseminated to all members of the surgical team and preoperative staff. A detailed surgical procedure file is generated, which serves as a navigation file, similar to Waze or Google Maps, providing step-by-step instructions to guide the surgery. This file will be loaded into ROSA (Robotized Surgical Assistant), a high-precision robotic surgeon.

    On the day of the surgery, you wear special Bluetooth gloves that are synced with the SAIMA/VisAR glasses and ROSA. In real-time, magnified between 15x and 40x, you observe ROSA surgically removing the cancerous tissue. Overseeing the process, you see a tumor that has spread beyond the original CT/MRI scan and zoom-in on the tumor, and you take control of ROSA to manually remove the tissue. The surgical system uses a “differential engine” concept to scale down the surgeon’s movements to match the magnification level of the procedure, allowing for precise and delicate tissue removal. This means that the surgeon’s natural movements are reduced to a smaller, more precise scale, enabling accurate and intricate procedures. For example, a 1 cm movement by the surgeon might be translated into a 0.1 mm movement of the robotic arm, allowing for high-precision work. The system is dependent upon a high-level of spatial intelligence to make those calculations in real-time.

    Afterward, you return the surgery back to the automated control of ROSA to follow the surgical procedure file plan. Throughout the fully immersive procedure, you speak with Sammi in a calm, natural language and responsive manner.

    The patient, a married middle-aged father of two, not only survives but thrives because of the accurate analysis of SAIMA and the precision of ROSA, with you overseeing the entire process. The Spatial AI-based surgical system allows you to do what you wanted to do as a neurosurgeon and save people’s lives.

    Nothing is Permanent Except Change

    Breakthrough innovations, such as the internet, have changed the world. Spatial AI is going to do the same. These technologically driven schisms are huge opportunities. One can only speculate how it will alter the future. Once a technology takes hold, and it becomes obvious there is no going back, its adoption will accelerate, and in those moments, careers make exponential leaps. Those in front of it will make substantial gains. Position yourself accordingly. Learn about Spatial AI and Geo AI. Carve out your own specialty, such as Spatial AI/AR (augmented reality), Spatial AI/VR (virtual reality), Spatial AI/XR (mixed reality), and Spatial AI/FMV (full motion video). The future is yours to imagine.


    Photo: William Tewelow
    Photo: William Tewelow

    WILLIAM TEWELOW is a designated Geographic Information Systems Professional. He has a master’s degree in Organizational Leadership with a focus on Performance Management, a bachelor’s degree in Intelligence Studies focused on geospatial intelligence, and an undergraduate degree in Geographic Information Technologies. William retired from the Federal Aviation Administration in 2025 after 16 years in various roles supporting geospatial information for aviation operations in the national airspace. He is a graduate of the management fellowship Program for Emerging Leaders where he served on special assignment to the Department of Transportation, leading a national strategic geospatial initiative under the authority of the White House Open Data Partnership.

  • SPH Engineering launches multibeam echosounder payload for UAVs

    SPH Engineering launches multibeam echosounder payload for UAVs

    SPH Engineering has released a multibeam echosounder system for UAVs that uses the Cerulean Surveyor 240-16, a compact bathymetric sensor designed for shallow-water mapping.

    The system expands drone-based hydrographic surveying capabilities by providing high-resolution bathymetric data collection over shallow waters. The Surveyor 240-16 operates at 240 kHz with a measurement range of 0.5 m to 50 m, targeting inland waterways, reservoirs, ports and environmental monitoring locations.

    The multibeam system generates an 80° cross-track swath with a 16-element receive array and 1° angular resolution, allowing operators to map wider bottom coverage compared to traditional single-beam payloads.

    The payload integrates with SPH Engineering’s UgCS flight planning software and SkyHub onboard computer for automated missions. Weighing 2.4 kilograms with all components and consuming 15 watts of power, the system works with UAVs including DJI M300, M350 and M400 models, as well as Inspired Flight IF800 and IF1200 aircraft.

    SPH Engineering conducted field validation at Titutga Lake in Latvia in August 2025. Survey flights operated at an average speed of 1.2 m per second, balancing data collection density with UAV battery endurance.

    Testing compared the multibeam system’s performance against single-beam payloads, which engineers noted remain useful for quality control verification of multibeam datasets. The combined approach demonstrated capabilities for high-resolution mapping in areas previously difficult to access with boat-based systems.

    Software compatibility includes full support in BeamworX, with Hydromagic integration planned for future releases.

    “The payload based on Cerulean Surveyor 240-16 represents a milestone in drone-based bathymetry,” said Alexey Dobrovolskiy, CEO of SPH Engineering. “By combining multibeam technology with UAV platforms, we are enabling hydrographers to collect dense bathymetric datasets at a fraction of the time and cost of conventional systems. This integration opens new opportunities for surveying reservoirs, lakes, and coastal areas that were previously inaccessible or unsafe.”

  • California updates its spatial reference network

    California updates its spatial reference network

    The California Spatial Reference Center (CSRC) modernized the California Spatial Reference Network (CSRN) on July 31, 2025. The new California Spatial Reference Network is denoted as CSRN Epoch 2025.00. 

    These coordinates changes affect California geospatial users, but the transition process to the new epoch is something that others should understand to prepare for the new, modernized National Spatial Reference System (NSRS), which is expected to be adopted in 2026. As I mentioned in my August 2025 newsletter, NSRS users should proactively assess their geospatial data dependencies and evaluate how adoption of the new datum will affect workflows, datasets and operational decision‑making. 

    The California Spatial Reference System (CSRS) is the official geodetic datum in California, as published by the California Spatial Reference Center (CSRC) according to Public Resources Code (PRC) §§8850–8861. The image below depicts the CSRN. It is rigorously aligned to the current definition of the National Spatial Reference System (NSRS) through a set of coordinate transformations from ITRF2020 to NAD83(2011) as published by the NOAA/NOS National Geodetic Survey (NGS). The California Spatial Reference System (CSRS) is realized by the geodetic coordinates and uncertainties of the CSRN on the date of 2025.00 (January 1, 2025; GPS week 2347, day 3) of 1068 GNSS stations (881 active and 187 defunct stations) in California and at the borders of Arizona, Nevada, Oregon and Baja California. CSRN Epoch 2025.00 NAD83(2011) replaces the previous CSRS Epoch 2017.50 NAD83(2011).

    The latest hybrid geoid model GEOID18 published by NGS was used to compute Global Navigation Satellite System (GNSS)-derived orthometric heights (DCOH) on the North American Vertical Datum of 1988 (NAVD 88) datum in accordance with the California PRC §§8890-8902 (California Orthometric Heights).

    Plot of CSRN (Credit: SOPAC)
    Plot of CSRN (Credit: SOPAC)

    As previously mentioned, the new CSRC Epoch 2025.00 (NAD83 (2011) replaces the previously published CSRC Epoch 2017.5 NAD83 (2011). Readers can obtain the project report that provides technical information about the new realization at the following link: https://sopac-csrc.ucsd.edu/index.php/csrn-epoch-2025-00/ . The website provides web-links to the project report and a table of stations that includes information about the coordinates.  See the image captioned “Excerpt from CSRC Epoch 2025.00 Web Page” for the links to the reports and tables.  The CSRC Epoch 2025.00 realization is aligned with NAD83 2011, Epoch 2010.0.  See the image captioned “Excerpt from Project Report V2” for the summary from the report. I have highlighted some sections of the summary that I thought others would find of interest.

    Excerpt from CSRC Epoch 2025.00 web page.
    Excerpt from CSRC Epoch 2025.00 web page.

    Excerpt from Project Report V2

    Summary

    This report, prepared under California Department of Transportation (Caltrans) Contract No. 52A0157, Task Order 1, documents the modernization of the California Spatial Reference Network (CSRN) by the California Spatial Reference Center (CSRC). This updated realization aligns the CSRN with the North American Datum of 1983 (NAD83 2011, epoch 2010.00).

    The new reference frame, effective on January 1, 2025 (GPS Week 2347, Day 3), is called CSRN Epoch 2025.00 NAD83(2011), referred to for short as CSRN Epoch 2025.00. It replaces the previous adjustment at Epoch 2017.50 and remains a core component of the California Spatial Reference System (CSRS).

    The CSRN is defined by the geodetic coordinates and uncertainties (Table 1) of 1,068 continuous GNSS stations881 active and 187 inactive or decommissioned—located throughout California and bordering regions in Arizona, Nevada, Oregon, and Baja California, Mexico. As California’s official geodetic reference network under Public Resources Code (PRC) §§8850–8861, all Caltrans surveys using the California Coordinate System of 1983 (CCS83) must reference CSRN control stations or comply with CSRN specifications. The definition and use of CCS83 are governed by PRC §§8801–8819. This new realization is fundamentally tied to the International Terrestrial Reference Frame 2020 (ITRF2020) through the IGb20 coordinates adopted by International GNSS Service (IGS) Analysis Centers. All multi-year processing for this project was performed within this state-of-the-art global reference frame. Furthermore, the CSRN Epoch 2025.00 is rigorously aligned with the National Spatial Reference System (NSRS) maintained by the National Geodetic Survey (NGS). Epoch 2025.00 geodetic coordinates are transformed from ITRF2020 to NAD83(2011) using the NGS Horizontal Time-Dependent (HTDP) utility (Figure 1). The ITRF2020 coordinates (X,Y,Z) of the 1068 CSRN stations are transformed into geodetic coordinates (latitude, longitude and ellipsoidal height), using the GRS80 ellipsoidal parameters (semi-major axis, a = 6378137 m and inverse flattening, 1/f = 298.257 222 101).

    CSRC submitted to the European Petroleum Survey Group (EPSG) definitions for datums, transformations, and coordinate reference systems for Epoch 2025.00 to facilitate unique terminology with associated metadata.

    GPS data (phases and pseudoranges contained in RINEX data files) collected at the CSRN stations from June 10, 1992 to May 17, 2025, and about 300 global tracking stations of the IGS network were re-analyzed in the ITRF2020 reference frame. The complete set of RINEX data and metadata are accessible from the Scripps Orbit and Permanent Array Center data archive.

    The latest hybrid geoid model GEOID18 published by NGS is used to interpolate geoid heights for each of the CSRN stations as the basis of Global Navigation Satellite System (GNSS) derived California Orthometric Heights (DCOH) on the NAVD 88 datum in accordance with the California PRC §§8890-8902 (California Orthometric Heights).

    Figure 1. Reference frames for CSRN Epoch 2025.00 NAD83(2011).
    Figure 1. Reference frames for CSRN Epoch 2025.00 NAD83(2011).

    As provided in the summary of the report, a diagram noted that the ITRF 2020 cartesian (XYZ) coordinates were transformed into NAD83 (2011) cartesian (XYZ) coordinates, and then into local topocentric coordinates (NEU) to obtain the CSRC Epoch 2025.00 NAD83 (2011) coordinates. 

    I downloaded the table of stations with their various coordinates and plotted the differences between the new CSRC Epoch 2025.00 NAD83 (2011) and the previous CSRC Epoch 2017.50 (NAD83 (2011) for stations that were designed as operational stations in 2025.  The following plots depict the difference in coordinates between Epoch 2025.00 and Epoch 2017.50.  One can see that there’s a reason that California needs to periodically update the coordinates of the California Spatial Reference Network.  Some of the horizontal coordinates have changed over 300 mm or around one foot.  The vertical coordinate changes are not as large, but some do shift more than 4 cm.

    Note: The plots do not include newer stations with less than 6 months of solutions (no velocities estimated) and defunct stations (stations in Epoch 2017.50 but no data before January 1, 2025.

    Differences in horizontal coordinates (N, E) between Epoch2025.00 and Epoch 2017.50 northern section.
    Differences in horizontal coordinates (N, E) between Epoch2025.00 and Epoch 2017.50 (northern section).
    Differences in horizontal coordinates (N, E) between Epoch2025.00 and Epoch 2017.50 southern section.
    Differences in horizontal coordinates (N, E) between Epoch2025.00 and Epoch 2017.50 (southern section).
    Differences in vertical coordinates (U) between Epoch2025.00 and Epoch 2017.50 (northern section)
    Differences in vertical coordinates (U) between Epoch2025.00 and Epoch 2017.50 (northern section).
    Differences in Vertical Coordinates (U) between Epoch2025.00 and Epoch 2017.50 (southern section)
    Differences in Vertical Coordinates (U) between Epoch2025.00 and Epoch 2017.50 (southern section)

    The image below provides some statistics about the differences in coordinates between Epoch 2025.00 and Epoch 2017.50.

    Photo:
    Notes: (1) Only includes operational stations in 2025 (2) Does not include newer stations with less than 6 months of solutions (no velocities estimated). (3) Does not include defunct stations: in Epoch 2017.50 but no data before January 1, 2025.

    This newsletter highlighted that the CSRC has adopted a new Public Resources Code–compliant geodetic datum (reference frame) for California: CSRN Epoch 2025.00 NAD83(2011), which replaces CSRN Epoch 2017.50 NAD83(2011). The updated datum incorporates secular (linear) tectonic motions across the North America–Pacific plate boundary, transient motions (such as coseismic and postseismic deformation and fault creep), vertical land motion (subsidence and uplift), and data from new stations established since Epoch 2017.50. Additionally, the new vertical datum provides a comprehensive set of California Orthometric Heights on the NAVD88 datum for all CSRN stations.

    In essence, the CSRC has released three new datums. The first is tied to ITRF2020, the second to NAD83(2011), and the third to NAVD88. Transformation parameters are available between the first two datums. The NAD83(2011)-based datum satisfies California’s Public Resources Code requirements and is the recommended standard for geodetic control in the state. The NAVD88-based datum provides GNSS-derived California Orthometric Heights of 1988 (COH88).

    These new datums will be added to the European Petroleum Survey Group (EPSG) database, the worldwide standard for coordinate reference systems (CRSs) and transformations. Each will receive a unique EPSG code, making it easy to reference and use. This will ensure that CSRN Epoch 2025.00 NAD83(2011), CSRN Epoch 2025.00 (ITRF2020), and COH88 Epoch 2025.00 (NAVD88) can be seamlessly integrated into industry software.

    The CSRC report also noted that NGS has released a beta version of the modernized horizontal and vertical datums for the NSRS: NGS New Datums.

    Once the modernized NSRS is fully published, and in response to the needs of California’s user community, CSRC will continue working to secure resources that support its partnership with NGS and ensure ongoing compatibility with national programs.

  • Ghana launches nationwide CORS network exercise

    Ghana launches nationwide CORS network exercise

    Ghana Lands Commission, through its Survey and Mapping Division (SMD), in collaboration with the Licensed Surveyors Association of Ghana (LiSAG) and GMX Systems Ghana Limited, has launched a nationwide observation exercise for Ghana’s GNSS Continuously Operating Reference Station (CORS) Network.

    This initiative is a major milestone in modernizing the country’s geospatial infrastructure and improving land administration.

    The exercise aims to integrate more than 60 newly established CORS stations into the national geodetic framework, consolidating Ghana’s Grid Coordinate System. The partners plan to expand the network to 100 stations before the end of the year.

    With a modern CORS network, surveyors and spatial data users will have 24/7 access to high-precision data, improved efficiency and cost savings, while aligning Ghana with international geospatial standards.

    It will improve accuracy for land records, agriculture, disaster management, infrastructure development, and revenue generation for the Lands Commission. The observation will be rolled out in three phases — Southern, Middle, and Northern zones — to ensure systematic coverage and data management.

  • Changes in OPUS products when the new NSRS is adopted: what does this mean to users?

    Changes in OPUS products when the new NSRS is adopted: what does this mean to users?

    On July 23, 2025, the National Geodetic Survey (NGS) sent a news notice announcing the rollout plan for remaining NSRS modernization products, including OPUS Products Changes, and on June 11, 2025, they sent a news notice to users stating that NGS’s Multi-Year CORS Solution 3 (MYCS3) was released. This newsletter will highlight these two News notices and what they mean to users of the United States National Spatial Reference System (NSRS).

    A colleague recently reminded me that the new NSRS is more than just a technical update — it presents an ideal opportunity to review existing processes and workflows, address current products and process considerations, and strategically plan for future requirements. It is well known that the new NSRS will significantly improve geospatial data accuracy. Improved accuracy and reliability of geospatial data empower management to make more informed decisions and optimize resource allocation. NSRS users should proactively assess their geospatial data dependencies and evaluate how adoption of the new datum will affect workflows, datasets and operational decision‑making. I will provide you with more information at a later date.


    NGS NEWS

    Rollout Plan for Remaining NSRS Modernization products, including OPUS Products Changes

    On June 17, 2025, NGS released the first preliminary products of the modernized National Spatial Reference System (NSRS) for beta testing and feedback. In the coming months, additional products listed below will be made available. As each product is released, it will undergo at least six months of testing preceding the final adoption and implementation of the modernized NSRS.

    The descriptions below supersede previous updates or information shared in NSRS Modernization blueprint documents, plans, or presentations. These products and their status will be described on the Track Our Progress webpage.

    1. The Data Delivery System (DDS) landing page will provide an updated version of the “NGS Map” and “Looking for Benchmarks” pages. This new landing page will allow you to access modernized informational pages about geodetic stations and geodetic marks.
    2. Geodetic station pages will offer an updated version of the current NOAA CORS Network (NCN) station pages. Geodetic mark pages will be updated datasheets, replacing the current ASCII text file version of datasheets. The updated coordinates (reference epoch coordinates) for marks and updated CORS coordinate functions (CCFs) for CORSs in the modernized NSRS will be available through these pages. 
    3. The NGS Coordinate Conversion and Transformation Tool (NCAT) will be updated through multiple versions, currently with state plane coordinates, then later adding support for various geopotential calculations including ellipsoid/orthometric height conversion as well as NADCON (geometric) and VERTCON (orthometric) transformations from the current NSRS to the modernized NSRS.
    4. OPUS-Static will function similarly to today’s tool, but it will operate with the modernized NSRS, including the support of multi-GNSS data. Additionally, the popular function of “sharing” your solution with others (colloquially called “OPUS-Share”) will be retained, but with appropriate caveats that the shared solution should not be used as geodetic control. These shared solutions will be available through the geodetic mark pages of the DDS.

    The following products will not be included in the release of the modernized NSRS. However, plans to replace the services or mitigate gaps are described below.

    • OPUS-Projects 5 will not be included in the modernized NSRS. Instead, NGS will focus on both developing an improved software suite for OPUS, known as OPUS 6, and minimizing any gap in service in which the current OPUS-Projects functionality is not available for users to organize, process, adjust, and submit high-accuracy GPS surveys for use by NGS in expanding and improving the NSRS. As noted above, OPUS-Share will remain available as a means to submit data to NGS.
    • OPUS-Rapid Static (OPUS-RS) will not be included in the modernized NSRS. Instead, the modernized version of OPUS-Static, noted above, will be capable of processing multi-GNSS static data files that are shorter in duration (i.e., less than 2 hours).

    Note: the current OPUS Projects 5 software will be supported until the modernized system is adopted, and a deadline for OPUS-Projects users to submit their surveys for publication will be announced with at least six months’ notice.

    To stay informed about these releases, please subscribe to NGS News. If you have questions, please email [email protected].


    Now, I would like to address the issues associated with July 23, 2025, announcement. This NGS News announced the rollout plan for the remaining NSRS modernization products. I have highlighted several sentences in this announcement that I believe users need to understand to determine the impact on their processes and workflows that are used to generate their products and services.

    The news announcement states that NGS released the first preliminary products of the modernized National Spatial Reference System (NSRS) for beta testing and feedback. My July 2025 GPS World Newsletter highlighted these preliminary products. It mentioned that in the coming months, additional products will be made available.  Each product will undergo at least six months of testing preceding the final adoption and implementation of the modernized NSRS. This seems to be a good process, but users need to understand the complete message.

    The NGS News announcement provides a list of products that will be available and a list of products that will not be available when the new NSRS is adopted. Users need to understand what products will not be available after NGS officially adopts the new NSRS so they can determine what that means to their workflow process and client requirements.  In my opinion, for the new NSRS to be successfully implemented by users, it is essential that all the necessary software tools are available to enable users to submit projects for review, approval, and publication by NGS.  As many of you know, when I worked for NGS, I was the Project Manager of the North American Vertical Datum of 1988 (NAVD 88). That said, from my experience as the NAVD 88 Project Manager, having the appropriate tools available was important for users to implement NAVD 88.  As a matter of fact, NGS accepted and processed vertical control data in both NGVD 29 and NAVD 88 for a period to assist users in the implementation of the new vertical reference datum.

    It is important to note that the NGS News Announcement states that OPUS-Project 5 will not be included in the new NSRS when it is officially adopted. See the below image.

    Credit: NGS

    Since OPUS Projects 5 will not be supported after the modernized system is adopted, users will not be able to submit their projects for review, approval, and publication by NGS like they can do today. NGS does indicate that they will be working on OPUS 6 to “minimize any gap in service.” There are a few questions that I believe should be addressed: (1) What does “minimize any gap in service” mean? Is this one month, one year, or several years?  (2) Why must the new NSRS be adopted before users can submit their projects to NGS for official publication? And (3) Why should users use OPUS-Share when NGS itself advises against relying on OPUS-Share results for establishing geodetic control?  If the federal agencies and surveying community allow the new NSRS to be adopted before OPUS 6 is available or OPUS Project 5 is modified for use in the new NSRS, the only way to get an updated coordinate such as NATRF2022 and NAPGD2022 using NGS process will be to use NGS OPUS-Share products. Again, NGS states that OPUS-Share results should not be used as geodetic control.  See NGS’ statement on OPUS Share below.


    This is NGS’s statement on OPUS-Share: Additionally, the popular function of “sharing” your solution with others (colloquially called “OPUS-Share”) will be retained, but with appropriate caveats that the shared solution should not be used as geodetic control. These shared solutions will be available through the geodetic mark pages of the DDS.


    Using OPUS-Share results that are NOT official NSRS coordinates published by NGS could lead to confusing results and potential lawsuits since NGS does not stand behind the results and recommends NOT using OPUS-Share results for geodetic control. Why would users use OPUS-Share to establish geodetic control when NGS itself advises against relying on OPUS-Share for establishing geodetic control?  OPUS-Share results are not officially submitted to NGS for review, approval, and publication on an NGS Datasheet. I don’t believe this approach will meet the needs of users who require their projects to be reviewed, approved, and published by NGS. What is your opinion? You should let NGS, and others know your thoughts and concerns about NGS’s rollout plan for remaining NSRS modernization products.

    Now for the release of NGS’s Multi-Year CORS Solution 3 (MYCS3).

    NGS MYCS 3 released. (Credit: NGS)
    NGS MYCS 3 released (Credit: NGS)

    First, why did NGS perform the NGS Multi-Year CORS Solution 3 (MYCS3)?  To maintain consistency with the International Earth Rotation and Reference System Service (IERS) and the International GNSS Service (IGS) reference frames, NGS has implemented the new International Terrestrial Reference Frame 2020 (ITRF2020) and IGS20 realizations in the U.S. NOAA CORS Network (NCN). What this means to NSRS users is that NGS has updated the North American Datum 1983 (NAD 83), epoch 2010.0 coordinates for stations in the NOAA CORS Network (NCN). This update is called the Multi-Year CORS Solution 3 (MYCS3).

    In summary, the MYCS3 news notice states the following:

    • The coordinate functions for NOAA CORS Network (NCN) stations are now consistent with ITRF2020,
    • NGS datasheets will display the new NAD 83 coordinates transformed from ITRF2020 coordinate functions,
    • The new NAD 83 coordinates will be referenced to NAD 83 2011 (epoch 2010.0),
    • Position and velocity files will display coordinates/velocities in both NAD 83 and ITRF2020, and
    • The NGS Online Positioning Users Service (OPUS) will begin processing data with NCN control that is consistent with ITRF2020 at the time of measurement; and the results will still be transformed to NAD 83 2011, epoch 2010.0.

    The first question that everyone asks is, what are the changes to the coordinates in my region? And, of course, why was it necessary to do this update now, but that’s a discussion for another day.  I downloaded the data and prepared a few plots and a table to depict the differences between the new and old coordinates.  First, it should be noted that the old NCN coordinates were published in ITRF 2014, epoch 2010.0, and the new NCN coordinates are published in ITRF 2020, epoch 2020.0. So, there will be differences in coordinates because of updates between ITRF2014 and ITRF2020, and because the CORS ITRF 2020 coordinates are published at epoch 2020.0 instead of 2010.0.

    The image below provides the new and old CORS coordinates and velocity information for NOAA CORS Monroe (NCMR). These values can be obtained from NGS CORS website.

    ITRF coordinates for NCMR.
    ITRF coordinates for NCMR. (Credit: NGS)

    The difference between ellipsoid heights is straightforward.  In the example, the difference is 144.357 meters minus 144.345 meters or 0.012 m. The image captioned “Change in Ellipsoid Height in NC based on ITRF 2020” provides the differences between MYCS3 and MYCS2 NAD83 2011, epoch 2010.0 published ellipsoid heights for the CORS in North Carolina.  In other words, this is the change in the NAD 83 2011, epoch 2010.0 ellipsoid height at the CORS after updating to ITRF2020, epoch 2020.  I’ve highlighted the NCMR CORS in the box. As you can see from the plot, there are several CORS in North Carolina that their ellipsoid heights have changed significantly; that is, greater than 20 mm and as large as -89 mm.

    Change in Ellipsoid Height in NC based on ITRF 2020 (units in mm)
    Change in Ellipsoid Height in NC based on ITRF 2020 (units in mm).

    I don’t know about you, but I can’t determine the change in coordinates by looking at XYZ or Latitude/Longitude values.  For the horizontal change I computed the differences in latitude and longitude and converted the results to millimeters. As indicated in the image above, the changes in the horizontal component are typically small; that is, less than a few mm.  There are, however, a few larger changes such as the one at CORS TN1B (which is in Tennessee) that changed 30 mm.

    Change in Horizontal Coordinates in NC based on ITRF 2020 (units mm).
    Change in Horizontal Coordinates in NC based on ITRF 2020 (units mm).

    I suppose for all “practical purposes” the changes are small and shouldn’t impact most survey projects.  Some of the larger changes are probably a good thing because that may mean that the CORS coordinates needed to be updated to account for movement or something else that affected the coordinates. I created a table that provides the minimum, mean, and maximum values in ellipsoid height and horizontal differences.  See the table titled “Differences Between MYCS 3 and MYCS  2 Solutions of NOAA CORS.”  I highlighted the State of North Carolina values.

    Photo:
    Photo:
    Photo:
    Photo:

    So, why is it important to understand these differences?  The NGS Online Positioning Users Service (OPUS) has begun processing data with NCN control that is consistent with ITRF2020 at the time of measurement.  This means that if you compare old projects to new projects, you may find some small differences due to the change in CORS NAD 83 2011, epoch 2010.0 coordinates.  As I previously mentioned, these differences are small and should not affect the results of most survey projects. Although, any difference can lead to someone questioning their results.

    As another example of the changes, the two plots below in the image captioned, “Change in CORS coordinates in Colorado based on ITRF 2020” provides the differences between MYCS3 and MYCS2 NAD83 2011, epoch 2010.0 published coordinates for the CORS in Colorado.

    Change in CORS coordinates in Colorado based on ITRF 2020
Ellipsoid Height Change (units in mm)
    Change in CORS coordinates in Colorado based on ITRF 2020 Ellipsoid Height Change (units in mm).
    Change in CORS Coordinates in Colorado based on ITRF 2020
Horizontal Change (units in mm)
    Change in CORS Coordinates in Colorado based on ITRF 2020 Horizontal Change (units in mm).

    Another difference that I computed using the results from the MYCS3 solution is an estimate of the changes between the current NSRS, that is NAD 83 2011 (epoch 2010.0) and new NSRS, for example NATRF2022, epoch 2020.0.   This is only an estimate but provides a value that users can attain the magnitude of the changes in their local region. The image below depicts the approximate changes in horizontal and vertical components between the current NSRS (NAD 83 2011, epoch 2010.0) and the future NSRS (NATRF2022, epoch 2020.0) based on the CORS in the NCN. (Note that the units have changed to cm.)

    Differences Between ITRF2020 and NAD 83 2011 in NC
Horizontal Change (units in cm)
    Differences between ITRF2020 and NAD 83 2011 in NC Horizontal Change (units in cm).
    Differences Between ITRF2020 and NAD 83 2011 in NC  Ellipsoid Height Change (units in cm)
    Differences between ITRF2020 and NAD 83 2011 in NC Ellipsoid Height Change (units in cm).

    To demonstrate that these changes vary region by region, I prepared plots depicting the changes in the State of Washington and the U.S. Gulf Coast region. As indicated in the plots, the differences between the current NSRS and the new modernized NSRS will vary from state to state and are significantly different than the current NSRS coordinates. 

    Differences Between ITRF2020 and NAD 83 2011 in Washington State
Horizontal Change (units  in cm)
    Differences between ITRF2020 and NAD 83 2011 in Washington State
    Horizontal Change (units in cm).
    Differences Between ITRF2020 and NAD 83 2011 in Washington State
Ellipsoid Height Change (units in cm)
    Differences between ITRF2020 and NAD 83 2011 in Washington State Ellipsoid Height Change (units in cm).
    Differences Between ITRF2020 and NAD 83 2011 in the Gulf Coast Region Horizontal Change (units in cm)
    Differences Between ITRF2020 and NAD 83 2011 in the Gulf Coast Region Horizontal Change (units in cm).
    Differences Between ITRF2020 and NAD 83 2011 in the Gulf Coast Region Ellipsoid Height Change ( units in cm).

    Differences Between ITRF2020 and NAD 83 2011 in the Gulf Coast Region Ellipsoid Height Change (units in cm).

    This newsletter underscored upcoming OPUS product changes that NGS will implement following adoption of the modernized NSRS, along with updates to CORS station coordinates resulting from the Multi‑Year CORS Solution 3 (MYCS3). It clarified what these changes mean for users of the U.S. NSRS. I also flagged several topics in the NGS News bulletins that warrant further attention, as they are critical for understanding how the modernized NSRS will impact geospatial products and services.  The new NSRS offers a strategic opportunity for users to comprehensively review existing processes and workflows, reassess current products, and proactively plan for future requirements. By auditing geospatial data dependencies now, NSRS users can evaluate how transitioning to the new datum will impact workflows, datasets, and operational decision-making.

    Will you be ready to implement the new NSRS after NGS officially adopts it?  Will you have the appropriate tools available to implement the new NSRS? These are questions that everyone that uses the NSRS should be addressing now.

  • Drones detect moss beds and changes to Antarctica climate

    Drones detect moss beds and changes to Antarctica climate

    GNSS and unmanned aerial vehicles (UAVs) have revolutionized precise mapping in polar regions. For a team from Queensland University of Technology (QUT), UAVs enabled a flexible platform for deploying hyperspectral imaging (HSI) sensors and collecting high-resolution data, enhanced by GNSS with real-time kinematic (RTK) to ensure accurate geolocation for reliable vegetation analysis.

    The team turned to UAVs to meet the unique challenges of monitoring Antarctic vegetation. Harsh conditions, remoteness, limited access and climate variability make traditional field surveys time-consuming and costly. Worse, they risk disturbing sensitive vegetation, explain the researchers.

    What Grows There. Antarctica’s terrestrial ecosystems are home to freeze-tolerant vegetation like mosses and lichens, which play a crucial role in biogeochemical cycles, soil insulation and supporting biodiversity. These organisms underpin the continent’s fragile ecosystems, increasingly threatened by climate change, extreme events, and human activitiees.

    While satellite imagery enables large-scale observations, its limited spectral and spatial resolution, alongside cloud interference, constrains fine-scale vegetation analysis. HSI captures a broad wavelength range, enabling discrimination of vegetation by their spectral signatures. Multispectral imaging (MSI) data, such as that from Sentinel-2, is also being explored.

    Each technology contributes uniquely:

    • GNSS RTK provides georeferencing
    • Machine-learning techniques enable precise segmentation
    • UAVs offer flexible spatial coverage and high-resolution datasets.

    However, unless these elements are integrated, mapping accuracy diminishes. Moreover, limited validation of spectral libraries and simulated imagery against field data restricts the reliability of remote sensing outcomes.

    The team’s study addresses current gaps by building on the UAV-based HSI workflow that incorporates ground-based HSI data and MSI. “We expand this approach by integrating UAV-captured HSI data to enhance remote sensing capabilities in polar environments,” researchers explain. The updated methodology combines UAVs, high-resolution red, green, blue (RGB) imagery, and ground and aerial HSI data with machine-learning-based semantic segmentation.

    The new workflow was evaluated in Antarctic specially protected area (ASPA) 135, Windmill Islands, East Antarctica, focusing on lichen detection and moss health mapping (Fig. 1).

    Photo:
    Location of ASPA 135 (6616’60” S, 11032’60” E) and studied vegetation. (a) Map of Antarctica showing Casey Station’s location using the Polar Stereographic Projection. (b) Map delineating ASPA 135 (purple) near Casey Station (top left). (c) Ground-level imagery of moss and lichen at ASPA 135, along with surrounding rock and ice formations. (Credit: QUT)

    Read the full study, “Drone hyperspectral imaging and artificial intelligence for monitoring moss and lichen in Antarctica,” on the Scientific Reports website.

  • SandboxAQ and Acubed advance magnetic navigation 

    SandboxAQ and Acubed advance magnetic navigation 

    As GNSS denial, jamming and spoofing threaten aviation safety, SandboxAQ and Acubed, the Silicon Valley innovation center for Airbus, have released real-world test results from a five-month, nationwide project designed to test the accuracy of AQNav.

    AQNav is an artificial intelligence-driven magnetic navigation (MagNav) system. AQNav uses advanced quantum magnometers to read Earth’s crustal magnetic anomalies, like a geoohysical fingerprint, then employs large quantitative models (LQMs) to filter out electromagnetic interference and precisely determine an aircraft’s position without relying on satellite signals.

    These new results come from a nationwide initiative with Acubed’s Flight Lab to test the navigational accuracy of AQNav. Meeting the aviation industry’s Required Navigation Performance (RNP) standards is necessary for deploying the system on military, commercial and civilian aircraft.

    AQNav’s performance was tested under various opertional scenarios and demonstrated advanced precision, accoding to SandboxAQ. The goal was to determine whether magnetic anomaly-aided navigation could broadly meet navigation requirements for commercial aircraft. AQNav’s capabilities exceeded the accuracy required for en route travel between airports — even on the program’s longest flight.

      Accuracy

      RNP StandardRequired Accuracy (meters)% of Flight Time Met
      RNP 0.355064%
      RNP 11,85295%
      RNP 23,704100%

      To demonstrate how the real-time capable system would operate in real-world conditions, flight data was collected, reprocessed, and streamed in real time to produce statistical insights, offering representative capability data for joint team evaluation. 

      Real-World Impact

      SandboxAQ and Acubed focused on designing tests to mirror authentic, real-world aviation scenarios. For example: 

      • Standard aircraft platform: AQNav was tested using publicly available magnetic maps aboard a standard Beechcraft Baron 58 – rather than a compensated geosurvey platform. This aircraft was modified only to accommodate the additional AQNav instrumentation – no extensive electromagnetic shielding or specialized noise isolation were used. All sensors were positioned inside the aircraft, powered by AQNav’s software to deliver a clean magnetic signal. 
      • Use of a publicly available map. For all flights, AQNav researchers used the publicly available North American Magnetic Anomaly Map (NAMAM), which covers the U.S., Canada, parts of Mexico and surrounding oceanic regions. 
      • Unfiltered flight paths: Flight operations spanned diverse, operationally relevant routes between 200 airports across the entire continental U.S. (Fig. 1), without filtering based on magnetic anomaly strength, magnetic map quality, or favorable geomagnetic gradients. More than 150 hours of flight data was collected.
      • Diverse geophysical environments: Data was collected over a full range of conditions, from magnetically-rich mountains to sparsely featured plains, reflecting real-world geographies where aircraft might operate without GNSS. 
      • True operational noise: Onboard, AQNav successfully filtered out the real-world interference generated by the aircraft, including electromagnetic, vibrational and other airframe-induced noise. 
      Fig. 1: Acubed Flights with AQNav (Credit: AQNav
      Fig. 1: Acubed Flights with AQNav (Credit: AQNav

      Elijha Williams, AQNav’s technical engagement manager, said: “Our campaign was not about demonstrating proof of concept performance under ideal conditions, it was about proving AQNav’s viability under the noisy, messy, and unpredictable environments real pilots face every day.” 

      During test flights exceeding two hours, AQNav outperformed the Inertial Navigation System (INS) without GNSS 100% of the time. During a one-hour flight over the challenging mountainous and forested terrain of California, AQNav achieved its best-observed accuracy of less than 74 meters, or roughly two-thirds the length of an American football field. 

      Precision, Scale and Autonomy for the Future 

      This campaign marks a significant step toward widespread adoption of AQNav in aviation. By consistently maintaining accuracy in an uncontrolled, national testbed, SandboxAQ demonstrated AQNav’s operational robustness under real-world conditions.

      Andrew Sosa Sosanya, a quantum navigation machine learning engineer at SandboxAQ, highlighted the impact of the data collected: “Thanks to Acubed, the U.S. Air Force, and other partners, we’ve accumulated a highly relevant MagNav dataset. This creates a flywheel effect—the more data we gather, the faster we can improve model accuracy across diverse mission profiles.”

      AQNav is also undergoing testing with Boeing, a U.S.-allied air force, and as part of NATO’s 2025 DIANA cohort.

    • CHC Navigation launches vehicle-mounted mobile mapping system

      CHC Navigation launches vehicle-mounted mobile mapping system

      CHC Navigation (CHCNAV) has released the AU20 MMS, a vehicle-mounted mobile mapping system designed for accurate and efficient collection of 3D spatial data. The system combines high-performance lidar technology, versatile sensor support and intelligent data processing to provide a practical and flexible solution for professionals in road surveying, asset management and infrastructure documentation.

      The AU20 MMS features a sophisticated lidar system that uses fourth-generation real-time waveform processing technology. It achieves a scan rate of 2 million points per second and 200 revolutions per second, producing point cloud data with 5 mm accuracy and 3 mm precision. This level of detail allows for the identification of fine surface characteristics and features, supporting comprehensive asset inventories and condition assessments. The system’s long-range, multi-cycle laser technology enables high-density data capture up to 250 m in vehicle-mounted applications.

      Built on the adaptable AP7 vehicle platform, the AU20 MMS supports a dual laser scanner setup to increase data density. The platform includes a 45° scanning angle to reduce data shadows and improve detection of vertical structures and road signage. The AP7’s built-in processor allows integration of up to eight external sensors, including specialized pavement detection cameras and panoramic cameras such as the Ladybug5+ and Ladybug6, giving users flexibility in data acquisition strategies.

      The AU20 MMS uses artificial intelligence-based algorithms to refine data quality and streamline processing. AI-driven vehicle motion trajectory adjustment automatically identifies control points, correcting point cloud inaccuracies to within two centimeters to meet highway-grade survey requirements. AI-powered panoramic coloring achieves more than 95 percent accuracy in recognizing and handling vehicles and pedestrians, resulting in clean, interference-minimized colorized point clouds with efficient one-click optimization.

      CHCNAV’s software suite, CoPre and CoProcess, streamlines workflows through intelligent automation. CoPre optimizes data preprocessing, allowing real-time adjustments to point clouds and imagery while minimizing manual intervention. CoProcess uses AI algorithms for feature extraction, including road assets, terrain models and building structures, to accelerate project delivery.

    • CHCNAV’s cloud-based platform enhances 3D data processing and collaboration

      CHCNAV’s cloud-based platform enhances 3D data processing and collaboration

      CHC Navigation (CHCNAV) has introduced CoCloud, a cloud-native platform developed for 3D data processing, management and collaborative analysis. The platform is designed to handle multi-source 3D data and supports streamlined workflows from data acquisition to deliverable creation, eliminating the need for local hardware investment.

      CoCloud incorporates an advanced photogrammetry engine capable of efficiently processing data from sources such as aerial imagery and lidar scans. The platform produces digital orthophotos, point clouds and OSGB models with a high level of precision suitable for professional applications.

      The platform offers tools for online data visualization, sharing and real-time collaboration on tasks such as volume calculations and point cloud editing. Its interface is designed to be intuitive and user-friendly, so users can perform complex 3D data operations without requiring extensive specialized training. CoCloud supports a range of data formats and includes features for dataset and timeline management.

      Photo: CHCNAV
      Photo: CHCNAV

      The platform offers API access and private deployment options, which allows organizations to integrate the platform into existing systems and customize workflows, from initial data collection through to final application delivery, according to their operational needs.

      The platform uses distributed data centers located in Germany and Ireland for localized storage and processing. Both facilities comply with the European Union’s General Data Protection Regulation for reliable data protection throughout collection, transmission and storage.

      Photo: CHCNAV
      Photo: CHCNAV
    • New Esri book explores GIS and AI

      New Esri book explores GIS and AI

      A new Esri book, GeoAI: Artificial Intelligence in GIS, provides real-life stories about public- and private-sector organizations as well as NGOs and nonprofits successfully using GeoAI (artificial intelligence) to manage processes, workflows, policies and communication. The book includes a technology showcase that provides ideas, strategies, tools and actions to help jump-start the use of GeoAI. 

      Organizations around the globe rely on geographic information system (GIS) technology to manage and analyze data through the powerful lens of location to tackle some of the toughest business and societal challenges. The emergence of AI-enhanced GIS has opened new opportunities to automate complex spatial analyses and harness the full power of spatial analysis.

      This democratization of GIS can help everyone make better decisions faster, from city planners and policymakers to businesses, research groups, and constituents. In addition, organizations that already use GIS extensively will benefit from the ability to tackle complex problems by combining human GIS expertise with AI capabilities. 

      GeoAI: Artificial Intelligence in GIS, by Matt Artz, Ismael Chivite and Nicholas Giner, publishes Sept. 2, by Esri Press. While the book officially publishes on Sept. 2, Esri is printing it early so that it will be available at the Esri User Conference in San Diego July 14-18.  

      GeoAI: Artificial Intelligence in GIS
      Authors: Matt Artz, Ismael Chivite, and Nicholas Giner
      Publication Date: September 2, 2025

      $39.00, 120 pages
      5.5 x 8”
      Full-color illustrations, maps and photos throughout
      Print ISBN: 9781589488441
      eISBN: 9781589488458

    • Seen & Heard: Mapping electronic warfare, Türkiye’s satellite system and quantum GPS backup

      Seen & Heard: Mapping electronic warfare, Türkiye’s satellite system and quantum GPS backup

      “Seen & Heard” is a monthly feature of GPS World magazine, traveling the world to capture interesting and unusual news stories involving the GNSS/PNT industry.


      West Point Cadets Map Electronic Warfare
      West Point cadets conducted a senior thesis project investigating the use of GNSS technology to map and visualize electronic warfare activities in the South Pacific, specifically focusing on GNSS spoofing. Their research, centered on the Huangpu River and Northeastern Shanghai, aimed to identify patterns of malicious GNSS interference and potential perpetrators, highlighting the strategic and economic motivations behind these actions in the region. By developing data visualizations of spoofing incidents, the cadets created a model that could be scaled up to analyze larger areas.

      Credit: Eric S. Bartelt / USMA PAO-VI
      Credit: Eric S. Bartelt / USMA PAO-VI

      South Africa Rising Above Water
      Researchers from the University of Bonn have found that South Africa’s land is rising by up to 2 mm per year, not because of deep mantle activity, but due to water loss from severe droughts. This uplift was detected using the TrigNet network of GNSS stations, which precisely measures changes in land elevation. As groundwater is depleted, the Earth’s crust rebounds upward — a process GNSS stations can monitor in real time.

      Credit: THEGIFT777 / E+ / Getty Images
      Credit: THEGIFT777 / E+ / Getty Images

      Türkiye to Launch Homegrown Satellite Navigation and Mapping System
      Türkiye is developing the Regional Positioning and Timing System (BKZS) to launch its own GPS and mapping application, in an effort to reduce dependence on foreign technology and enhance cybersecurity amid growing industrial automation. The system will provide precise location, navigation and timing data via Turkish satellites as an alternative to global systems including GPS, supporting critical sectors such as military operations, civilian communications, smart transportation, and precision agriculture.

      Credit: Tippapatt / iStock / Getty Images Plus / Getty Images
      Credit: Tippapatt / iStock / Getty Images Plus / Getty Images

      Quantum Navigation System Serves as GPS Backup
      Q-CTRL, a quantum infrastructure software company based in Sydney, Australia, has demonstrated a new quantum navigation system, Ironstone Opal, as a backup to GPS technology. The Ironstone Opal system uses quantum sensors to detect variations in the Earth’s magnetic field, determining precise geographic coordinates with the help of artificial intelligence-based software. Ironstone Opal is passive and does not emit signals, making it resistant to detection and jamming. Field trials showed the system outperformed a high-end inertial navigation system and served as a reliable GPS backup by up to 50 times in ground vehicles and 11 times in aircraft.

      Photo: Oundum / iStock / Getty Images Plus / Getty Images
      Photo: Oundum / iStock / Getty Images Plus / Getty Images