Trimble has introduced its next-generation Trimble Indoor Mobile Mapping Solution (TIMMS) that produces fast and accurate maps of difficult-to-navigate indoor spaces and translates them directly into 2D and 3D models of structured interiors.
TIMMS 2 is a fusion of technologies for capturing spatial data of indoor and other GNSS denied areas, the company said. It provides both lidar and spherical video, enabling the creation of accurate, real-life representations of interior spaces and all of their contents. The maps are geo-located, meaning that the real world positions of each area of the building and its contents are known and can be easily placed and oriented in a wide area model.
TIMMS 2 is smaller, lighter and more easily maneuverable than its predecessor. It can negotiate tight corners, closets and catwalks, and can be carried up and down staircases where no elevator is available for travel between building levels.
“The new Trimble Indoor Mobile Mapping Solution has been designed with greater emphasis on ease of use. It is very easy to maneuver, lift, ship and operate,” said Louis Nastro, director of Land Products at Applanix, a Trimble Company. “Our extensive experience with a broad range of projects with the previous generation TIMMS has led to a number of enhancements in data collection, processing and workflow management — making an indoor mapping project a seamless experience for users both pre- and post-mission. Whatever the building type and shape, TIMMS 2 can deliver exceptional results, both in accuracy and ease-of-use.”
Building on the success of the first-generation solution, TIMMS 2 also provides improved software workflow to manage the complete process from collection through post-processing to model production. Fully compatible with POSPac MMS, Applanix’ post-processing suite, TIMMS data can be presented in a variety of ways, including integration into Trimble Business Center and other infrastructure management or CAD packages.
Because of its increased efficiency, speed and ease-of-use, TIMMS 2 is an effective and high-productivity indoor mapping solution for buildings and facilities of all shapes and sizes, according to Trimble, including large or small areas, multi-level, industrial or commercial spaces. Users can obtain holistic 3D indoor geospatial views of all kinds of infrastructure including public buildings (government offices, schools, hospitals); industrial facilities (factories, warehouses); transportation hubs (airports, train stations); retail spaces (malls, concourses); entertainment venues (theatres, auditoriums, sound stages); and residential property (especially multi-occupancy high-rise buildings).
Maps and models of these spaces can be used for activities including revenue management and space planning; emergency preparedness and disaster planning; and historical building conservation and preservation. In addition, the base map provides a platform on which building owners and managers can serve location-based services.
Manufactured and sold by Applanix, TIMMS 2 indoor mobile mapping solution is available in the first quarter of 2016.
Elmar Lenz, general manager of Trimble‘s GNSS Geospatial Division, talks about the company’s MX7 mobile mapping system and its GNSS solutions at INTERGEO 2015, which was held Sept. 15-17 in Stuttgart, Germany.
The Trimble MX7 with VISION technology is a vehicle-mounted photogrammetric system equipped with six cameras and Applanix GNSS and inertial geo-referencing modules. The MX7 can be mounted on any size vehicle and can capture 30 MP geo-referenced images at highway speeds.
Eric Liberty of Applanix, a Trimble company, gives an overview of Applanix’s POS AV, POS AVX 210 and TIMMS indoor mobile mapping system at INTERGEO 2015, which was held Sept. 15-17 in Stuttgart, Germany.
POS AV is a hardware and software system specifically designed for direct georeferencing of airborne sensor data.
The POS AVX 210 is a GNSS-inertial solution designed for mapping with small and medium format cameras. The positioning components are now smaller and integrate MEMS technology.
TIMMS (Trimble’s Indoor Mobile Mapping System) captures spatial data of indoor and other GNSS-denied areas of all sizes and locations, according to Trimble. It provides both LiDAR and spherical video of a facility, enabling the creation of accurate, real-life maps or models of interior spaces.
Applanix Corporation has announced the POS AVX 210, the latest addition to its airborne position and orientation portfolio for direct georeferencing of airborne mapping sensors. Using Applanix’ GNSS and inertial technology, the POS AVX 210 enables airborne surveyors to achieve gains in accuracy, efficiency and productivity for low-altitude or small form factor sensors, when compared to GNSS-only point-matching or aerial triangulation techniques.
The announcement was made at the INTERGEO 2015 conference and exhibition in Stuttgart, where Applanix is exhibiting in Hall 8, Booth C8.047.
For photogrammetric applications, the POS AVX 210 delivers highly accurate exterior orientation solutions — reducing the requirement for ground control in assisted aerial triangulation of digital single lens reflex (DSLR) or medium-format photogrammetric imagery. For low-altitude lidar applications, the POS AVX 210 provides the required precision and accuracy of direct georeferencing to enable users to generate point clouds for further refinement in adjustment software.
The POS AVX 210 is fully compatible with, and supported by, POSPac MMS, Applanix’ post-mission software for direct georeferencing of airborne mapping sensors. It is also features a seamless integration with the NanoTrack system from Track’Air, a leading commercial flight management system designed for highly efficient survey flight operations. Aircraft equipped with the POS AVX 210 and NanoTrack will be able to fly missions with reduced sidelap between flightlines, and a greatly reduced requirement for ground control points. These benefits can reduce costs and improve the efficiency of both data collection and the production of finished data sets for end users.
“With POS AVX 210, Applanix has answered a need in the marketplace for a small, compact system that enables efficient data gathering from low-cost yet highly effective sensors. These include DSLR and Medium format cameras, low-altitude lidar systems, and other systems,” said Joe Hutton, director of Inertial Technology and Airborne Products at Applanix.
POS AVX 210 consists of a single rugged enclosure containing a precision GNSS receiver and micro-electro-mechanical-system (MEMS) inertial sensors calibrated with the Applanix SmartCal technology, coupled with on-board data logging capability and interfaces for mapping sensors and flight management systems. POSPac MMS, available as an option with POS AVX 210, is a powerful GNSS-inertial processing software package that includes proprietary advanced capabilities such as the Applanix SmartBase virtual reference station, Applanix InFusion algorithms for increased productivity, and CalQC, a suite of data optimization and quality management tools.
“POS AVX 210 builds on the technological foundation of our established POS AV portfolio for large format sensors, and brings into play the innovations developed for our unmanned solutions. This combination of experience and innovation enables us to deliver a package that strikes the optimal balance between price and performance for this segment,” Hutton said.
POS AVX 210 is expected to be available in the first quarter of 2016 through Applanix’ airborne sales channels.
Esri and FlightAware have partnered to combine the power of a flight tracking and status company with the ArcGIS mapping platform. The partnership features the ability to view and analyze large amounts of accurate, live-aviation data in one powerful spatial system.
FlightAware aggregates live flight tracking data from more than 50 government air traffic control authorities, satellite data link partners such as Garmin and ARINCDirect, and FlightAware’s own in-house ADS-B receiver network, consisting of more than 3,400 receivers in more than 100 countries.
“Esri has the tools and expertise to visualize data in a proven GIS environment,” FlightAware business development manager Max Tribolet said. “FlightAware data is the perfect addition. We’re the largest flight tracking company in the world, based on how many disparate data feeds we have coming into our system. So it’s pretty powerful when you pull our data into GIS.”
“This is a really good way to provide an additional option to our existing and potential customers, who might not have an easy way to consume larger volumes of flight tracking data,” Tribolet said. “A stand-alone app like Esri’s ArcGIS is adept at handling large quantities of data and is able to visualize it. This relationship with Esri allows FlightAware to focus on what we do best: constantly adding and aggregating quality flight tracking data and providing it to the industry.”
Airports and agencies have started exploring opportunities to use FlightAware data in GIS to improve proactive noise monitoring and airspace design as well as monitoring airspace congestion in real time. FlightAware visualizes live and historic data — such as altitude, longitude, latitude, ground speed, and estimated and actual schedule times—in 2D, 3D, and even 4D maps.
“The ability to fuse FlightAware data within the ArcGIS platform unlocks a host of new and innovative capabilities with regard to visualization, analysis and collaboration,” Esri aviation business development lead Stephen Willer said. “That results in a higher level of operational intelligence. We’re excited to bring this to our users across the globe. Real-time information access like this is essential not only today but also to our future air traffic systems.”
GPS World staff will cover the 2015 INTERGEO Trade Show, being held Sept. 15–17 in Stuttgart, Germany. The show opens with keynote speeches by Chris Cappelli (Esri) on location platforms and Georg Gartner (Vienna University of Technology) on the future of the map.
INSPIRE examines geo-issues from a European perspective, providing practical examples and focusing on further development of this European directive. Other central themes include geodata as a basis for construction management and land development, as well as issues relating to property markets and valuation.
A panel discussion on the second day tackles geospatial Information with a high-profile panel of speakers: Bengt Kjellson (UN-GGIM Europe), Ola Rollen (Hexagon), Steve Berglund (Trimble) and Chris Cappelli (Esri). Another key topic is geoinformation and mobility. DDGI and DVW will be addressing this together and discussing practical examples in two event strands.
A Big Data discussion focuses on the rapid development of data capture, processing and presentation as well as the direct integration of data into business processes.
As important as data may be in the digital world, it is also crucial to have the right visualization concepts in place. This will be demonstrated through presentations on German Cartographers’ Day, which will form part of INTERGEO.
Tap into our up-to-the-minute show coverage here at gpsworld.com and via Twitter (@GPSWorld). Below are the GPS World videos from INTERGEO 2014.
Microsoft will no longer collect its own map data, according to the website re/code. As part of the change, Microsoft is selling some of its assets to rideshare company Uber, including a data center, cameras, intellectual property and roughly 100 engineers. Uber is also buying a data center near Boulder, Colo.
Microsoft plans to continue to offer Bing Maps using data licensed from partners.
Microsoft already gets much of its map data from Nokia and other partners, but had been collecting its own aerial, 3D and street-level maps. It will now source those images from partners, focusing its Bing Maps work on the user experience that overlays the map data and imagery.
Industry watchers suggest the cameras might soon end up on the roofs of Uber vehicles. Uber already has hundreds of thousands of cars being tracked around the world every day.
GEOINT 2015, like other major conferences, was both fascinating and frustrating. There was so much to see and learn and absolutely not enough time to take it all in. GEOINT 2015 took place June 22-25 in Washington, D.C.
Fortunately, the USGIF staff along with the USGIF Trajectory magazine staff under CEO Keith Masback’s direction made the best of this mega event through superb event planning and top-notch documentation, both in print and video. This column is just one man’s view and covers highlights that I saw and documented.
I shot video clips of technology that caught my eye, but with more than 300 exhibitors, keynote sessions, break-out and educational sessions plus special interest meetings (such as the Army Geospatial Center GeoPDF workshop), covering it all was not possible. However…
Every day of the conference, the USGIF Trajectory magazine staff published and printed a Show Daily. This slick publication was available every morning and served as a guide to the day’s events, along with providing highlights of the previous day. You can view/download each day’s issue. These five documents are probably the fastest way to get a full overview of the conference.
Below is a playlist of the videos I shot.
Key presentations that are a must-read:
Retired General Stanley McChrystal talked about transforming the Joint Special Operations Command from a purely top-down organization to one of shared intelligence and responsibility. Thanks to this “shared consciousness,” local units were able to act quickly, responding to rapidly changing events with smart autonomy because everyone shared the same intelligence.
National Security Agency (NSA/CSS) Director Adm. Michael Rogers said that each component of the signals intelligence (SIGINT) world has a physical location, and described how he has directed a much closer working relationship with the National Geospatial-intelligence Agency (NGA) to further intel and cyber efforts. He said that humans are very visually oriented, and although NSA’s SIGINT tools and products are very powerful, a more complete picture could be visualized if enhanced with GEOINT.
I was able to interview NGA Director Cardillo and Admiral Thad Allen, former commandant of the Coast Guard. I asked Director Cardillo about the NGA Emerald program and Adm. Allen about eLoran, one possible back up to GPS/PNT.
The pre-conference included education sessions and a fascinating group of five-minute lightning talks (pecha-kucha). I’m going to cover these in detail sometime in the next few months.
Generally, when I attend conferences I try to visit the small booths on the periphery of the exhibit hall. I’ve found that many showcase emerging technologies or are uniquely interesting. One example at GEOINT was the “Cartographic and Geographic Information Society” booth manned by Dr. Eric Anderson and Dr. Lynn Usery. They really struck a nerve with me — in the massive exhibit hall packed with high-tech wonders was this simple booth with a simple message: promoting good cartography. In this day of computer mapping and electronic media, too many technicians produce maps and sites that are really terrible looking and hard to grasp, so I fully appreciate the importance of good cartography to communicate effectively. See my Powerpoint/mapping rant several years ago to get my perspective.
Here are my videos of other exhibitors on the floor:
CACI — The ability to predict human activity with very high correlation using social media
GeoWeb3D — Very rapid display of imagery and 3D models
TerraGo — Edge, a disruptive technology for data collection
USGIF CEO Keith Masback (right) presents Bosarge with the USGIF Academic Research Award.
Tipping my hat to my adopted state of Alabama, I was pleased to see a Huntsville booth touting the 70-plus geospatial firms in the city along with a keynote from Huntsville Mayor Tommy Battle highlighting GEOHuntsville’s pending 2015 GEOINT Workshop August 12. Additionally, native son George Stanley Bosarge, University of South Alabama, was awarded the USGIF Academic Research Award for his work in assessing post-oil spill recovery and reef habitat off the coast of Alabama.
In general, attending GEOINT was like drinking from a firehose: lots of information in a very short period of time. However, I did build a list of great material for future columns, including a potentially small underground revolution growing in the GEOINT community.
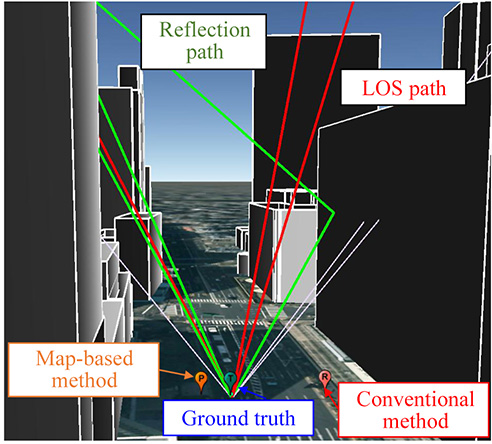
Figure 1. Example of the GNSS signal propagation using ray-tracing and a 3D building map.
A particle-filter-based positioning method using a 3D map to rectify the errors created by multipath and non-line-of-sight signals on the positioning result delivered by a low-cost single-frequency GPS receiver takes a multi-GNSS approach, using the combined signals of GPS, GLONASS and QZSS. The method outperforms conventional positioning in availability and positioning accuracy. It will likely be fused with other sensors in a future pedestrian navigation application.
By Li-Ta Hsu, Shunsuke Miura and Shunsuke Kamijo
GPS provides an accurate and reliable positioning/timing service for pedestrian application in open field environments. Unfortunately, its positioning performance in urban areas still has a lot of room for improvement, due to signal blockages and reflections caused by tall buildings. The signal reflections can be divided into multipath and non-line-of-sight (NLOS) effects. Recently, use of 3D building models as aiding information to mitigate or exclude multipath and NLOS effects has become a promising area of study.
At first, researchers used the 3D map model to simulate multipath effects to assess the single-reflection environment of a city. Subsequently, the metric of NLOS signal exclusion using an elevation-enhanced map, extracted from a 3D map, was developed and tested using real vehicular data. An extended idea of identifying NLOS signals using an infrared camera onboard a vehicle has been suggested. The potential of using a dynamic 3D map to design a multipath-exclusion filter for a vehicle-based tightly coupled GPS/INS integration system has also been studied. A forecast satellite visibility based on a 3D urban model to exclude NLOS signals in urban areas was developed.
The research approaches outlined above seek to exclude the NLOS signal; however, the exclusion is very likely to cause a horizontal dilution of precision distortion scenario, due to the blockage of buildings along the two sides of streets. In other words, the lateral (cross direction) positioning error would be much larger than that of the along-track direction.
Therefore, approaches applying multipath and NLOS signals as measurements become essential. One of the most common methods, the shadow-matching method, uses 3D building models to predict satellite visibility and compare it with measured satellite visibility to improve the cross street positioning accuracy. A multipath and NLOS delay estimation based on software-defined radio and a 3D surface model based on a particle filter was proposed and tested in a static experiment in the Shinjuku area of Tokyo.The research team of The University of Tokyo developed a particle-filter-based positioning method using a 3D map to rectify the positioning result of commercial GPS single-frequency receiver for pedestrian applications.
An evaluation of the QZSS L1-submeter-class augmentation with integrity function (L1-SAIF) correction to the proposed pedestrian positioning method was also discussed in an earlier paper by the authors of this article. However, satellite visibility in the urban canyon using only GPS and QZSS would not be enough for this proposed method. The use of emerging multi-GNSS, encompassing GLONASS, Galileo and BeiDou, could furnish a potential solution to the lack of visible satellites for this method. This article assess the performance of the proposed pedestrian positioning method using GPS, GLONASS and QZSS.
Building Models Construction
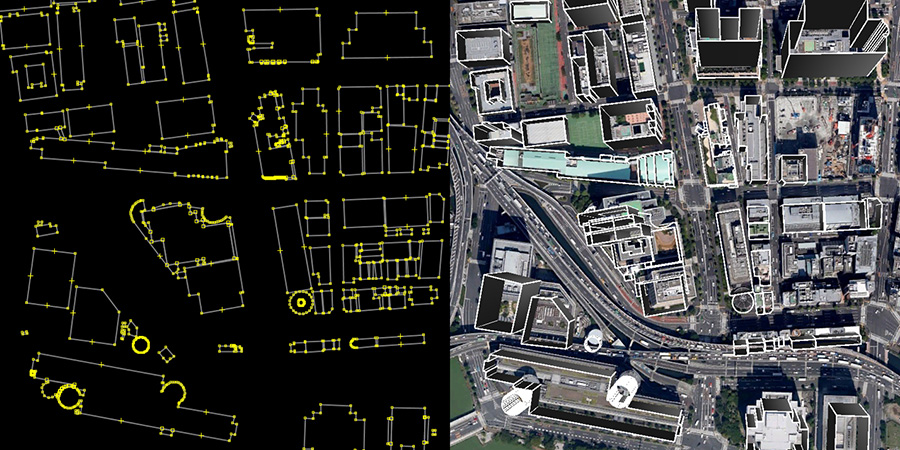
Our work established a 3D building model by a 2D map that contained building location and height information of buildings from 3D point-clouds data. The Fundamental Geospatial Data (FGD) of Japan, which provided by Japan geospatial information authority, is open to the Japanese public. This FGD data is employed as 2D geographic information system (GIS) data. Thus, the layouts and positions of every building on the map could be obtained from the 2D GIS data. In this article, the 3D digital surface model (DSM) data is provided by Aero Asahi Corporation. Figure 2 shows the process of constructing the 3D building model used here. This process first extracts the coordinates of every building corner from FGD as shown in the left of Figure 2. Then, the 2D map is integrated with the height data from DSM. The right of Figure 2 illustrates an example of a 3D building model established in this way. The 3D building map contains a very small amount of data for each building in comparison to that of the 3D graphic application. For our purposes, the file only contains the frame data of each building instead of the detail polygons data. This basic 3D building map is utilized in the simulation of ray-tracing.
Figure 2. The construction of the 3D building map from a 2D map and DSM.
Our version of the ray-tracing method does not consider diffractions or multiple reflections because these signals occurred under unfavorable conditions. Here, we utilize only the direct path and a single reflected path. The developed ray-tracing simulation can be used to distinguish reflected rays and to estimate the reflection delay distance. Our research work assumes that the surfaces of buildings are reflective smooth planes, that is, mirrors. Therefore, the rays in the simulation obey the laws of reflection. In the real world, the roughness and the absorption of the reflective surface might create a mismatch between the ray-tracing simulation and the real propagation. Here we ignore this effect, as the roughness of the building surface is much smaller than the propagation distance.
The opening figure (Figure 1) shows an example of the GNSS signal propagation using ray-tracing and a 3D building map. Red, green and white lines denote the LOS path, reflected paths and the NLOS paths, respectively. In this environment, a conventional positioning method such as weighted least squares (WLS) usually estimates the position on the wrong side of street as shown in the red balloon. With the aid of 3D building model and ray-tracing, the map-based positioning method is able to provide a result close to the ground truth.
Map-Based Pedestrian Positioning
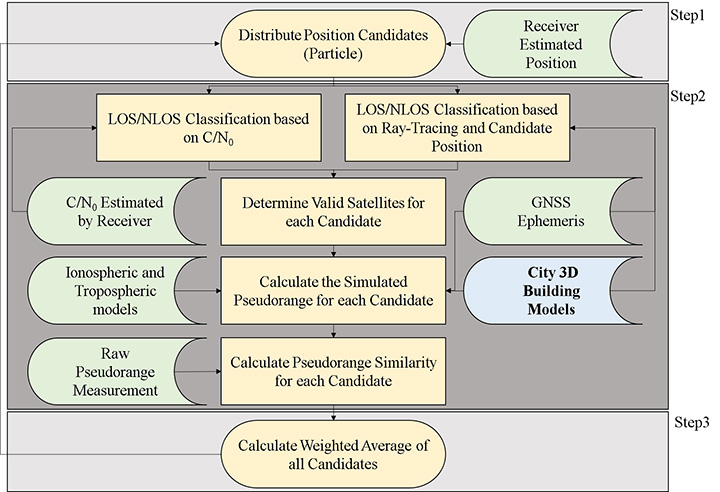
The flowchart of the 3D city building model-based particle filter is shown in Figure 3. This method first implements a particle filter to distribute position candidates (particles) around the ground-truth position. In Step 2, when a candidate position is given, the method can evaluate whether each satellite is in LOS, multipath or NLOS by applying the ray-tracing procedure with a 3D building model. According to the signal strength, namely carrier-to-noise ratio (C/N0), the satellite could be roughly classified into LOS, NLOS and multipath scenarios. If the type of signal is consistent between C/N0 and ray-tracing classification, the simulated pseudorange of the satellite for the candidate will be calculated. In the LOS case, simulated pseudoranges can be estimated as the distance of the direct path between the satellite and the assumed position. In the multipath and NLOS cases, simulated pseudoranges can be estimated as the distance of the reflected path between the satellite and the candidate position via the building surface.
Figure 3. Flowchart of the particle filter using 3D city building models.
Ideally, if the position of a candidate is located at the true position, the difference between the simulated and measured pseudoranges should be zero. In other words, the simulated and measured pseudoranges should be identical. Therefore, the likelihood of each valid candidate is evaluated based on the pseudorange difference between the pseudorange measurement and simulated pseudorange of the candidate, which is simulated by 3D building models and ray-tracing.
Finally, the expectation of all the candidates is the rectified positioning of the proposed map method. This method can therefore find the optimum position through a dedicated optimization algorithm of these assumptions and evaluations. The positioning principle of the proposed method is very different from the conventional GPS positioning method, that is, WLS. As a result, the calculation of the positioning accuracy of the 3D map method should be also different.
We define two positioning performance measures for the 3D map method: user range accuracy of the 3D map method (URA3Dmap) and positioning accuracy.
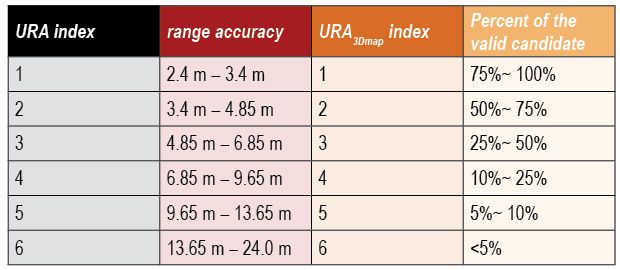
The value of URA3Dmap is to indicate its level of positioning service, which is similar to the user range accuracy (URA) of conventional GPS. The URA3Dmap is defined based on the percentage of the valid candidates from all candidates outside the building. The higher percentage of the valid candidate implies a higher confidence of the estimated position. Ideally, if the center of the candidate distribution is not far from the ground truth, the simulated pseudorange of the candidates located at the center of distribution would be very similar to the measurement pseudorange. We define the URA3Dmap as shown in Table 1.
Table 1. The definition of URA and URA3Dmap used in this article.
Experiments and Discussion
We selected the Hitotsubashi and Shinjuku areas in Tokyo to construct a 3D building model because of the density of the tall buildings. In this area, multipath and NLOS effect are frequently observed. We tested pedestrian navigation in a typical path that included walking both sides of street and passing through/waiting at a road intersection. The cut-off angle is 20 degrees. The data were collected in November and December 2014.
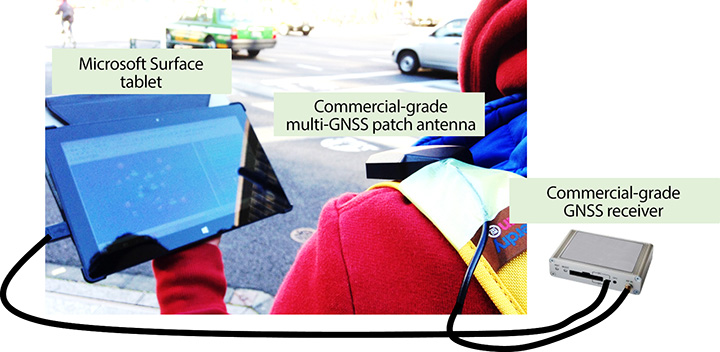
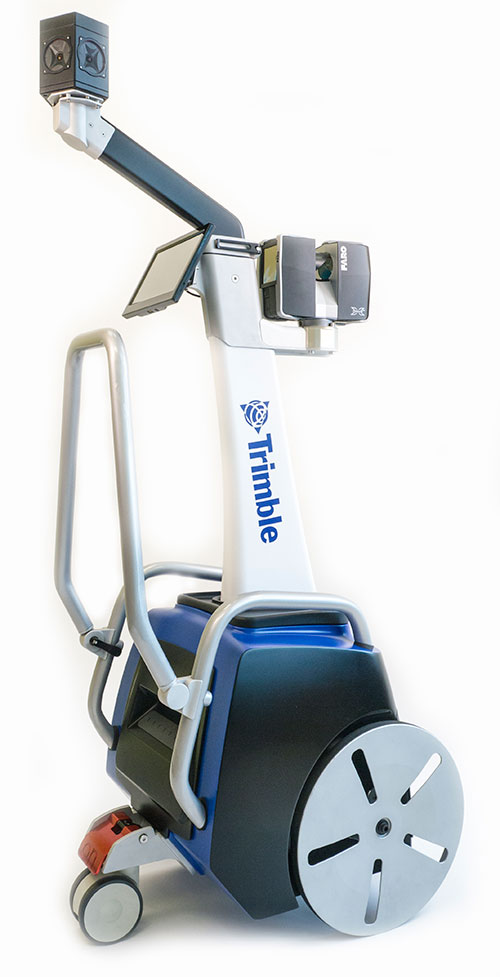
We compare here two single point positioning methods: single-point positioning solutions provided by open source RTKLIB software (RTKLIB SPP), and the proposed 3D map method. RAIM FDE of the RTKLIB SPP is used here as a conventional NLOS detection algorithm. The test used a geodetic-grade GNSS receiver and a commercial grade receiver. The geodetic receiver was only used to collect the QZSS L1-SAIF correction signal. The antenna of the commercial receiver was attached in the strap of the backpack as shown in Figure 4. The receiver is connected to a tablet to record the GNSS measurements and is set to output pseudorange measurements and positioning results every second.
Figure 4. Equipment set-up.
We generated a quasi-ground truth using a topographical method.Video cameras were set in the ninth and18th floors of a building near the Hitotsubashi and Shinjuku areas, respectively, to record the traveled path. The video data output by the cameras are used in combination with one purchased high-resolution aerial photo to get the ground truth data. The aerial photo is 25 cm/pixel and therefore the error distance for each estimate can be calculated. The synchronization between video camera and commercial GNSS receiver is difficult to get as accurate as in the topographical method. As a result, we used point to “points” positioning error to evaluate the performance of the dynamic experiment. The synchronization error is limited to 1 second. Hence, for each estimated position x(t), the ground truth points used to calculate the positioning error is xGT (t-1), xGT (t) and xGT (t+1). The point to “points” positioning error is calculated as:
Three performance metrics are used here: mean, standard deviation of the point to points error, and the availability of positioning solution. The availability defined here means the percentage of given solutions in a fixed period. For example, if a method outputs 80 epochs in 100 seconds, the availability of the method is 80 percent.
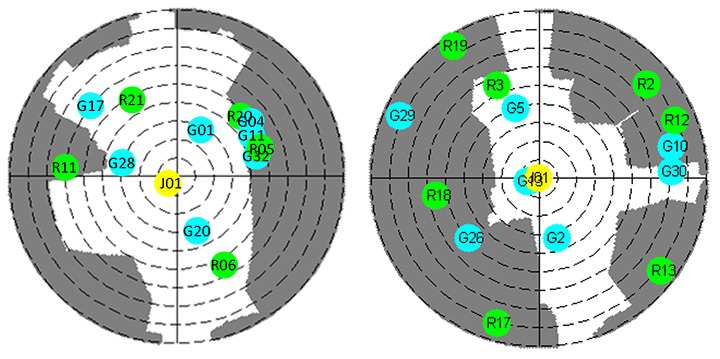
This research demonstrates two dynamic data. The skyplot of the data are shown in Figure 5. The satellites are tracked by the commercial receiver. The grey areas indicate the obstruction of the surrounding buildings. The two dynamic data are typical signal receptions at Hitotsubashi (middle urban canyon) and Shinjuku (deep urban canyon) areas.
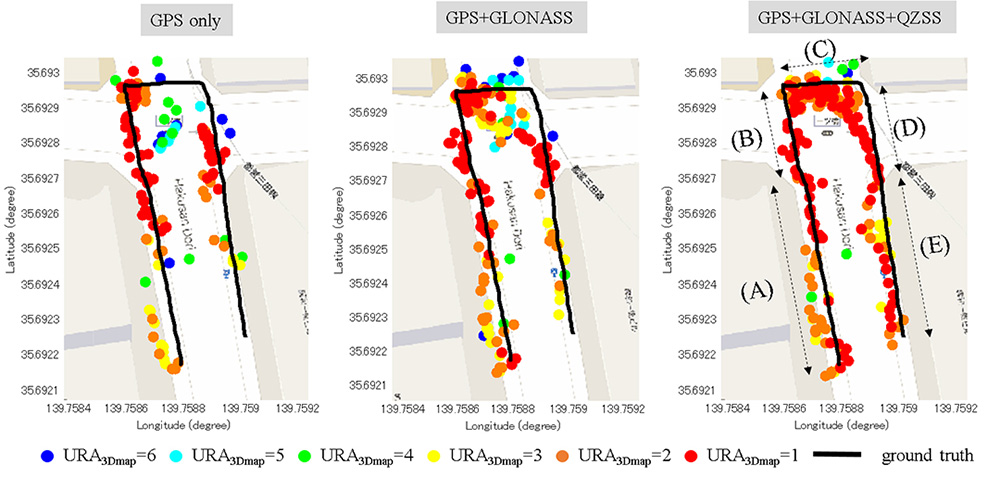
Hitotsubashi Mid-Canyon. To study the benefit of using different GNSS constellations in the 3D map method, Figure 6 shows the trajectory estimated by the proposed method under different satellite constellations. The different colors indicate different values of URA3Dmap of each point. This walking trajectory is divided into five sections (identified as A, B, C, D and E in the right-most of the three plots). In the GPS-only case (left), results in A and B sections have much better performance than sections D and E, because more than half of the GPS satellites are blocked at D and E, as shown in the left of Figure 5.
Figure 5. The left and right are the skyplot of the dynamic experiment at the Hitotsubashi and Shinjuku areas, respectively, in Tokyo.
The middle plot in Figure 6 shows the trajectory using GLONASS. It is obvious that the positioning results located at the right side of street are greatly increased, derived from the greater number of satellites in view. However, the quality of the GLONASS signal is not as good as GPS because multipath has a double effect on GLONASS.
Figure 6. Positioning results of the proposed 3D map method using different combinations of satellite constellations in a middle urban canyon.
In summary, the positioning error of applying GLONASS maintains a similar level, and availability increases about 12 percent compared to using GPS only. The right plot of Figure 6 shows the result after adding QZSS L1 C/A and L1-SAIF. This increases the results of C, D and E sections, because QZSS provides a high-elevation-angle satellite to the 3D map method. As a result, the number of valid candidate points in C, D and E sections increases dramatically. The reliability in C, D and E sections is also much higher than that of GPS+GLONASS. In addition, the trajectory became smoother than before.
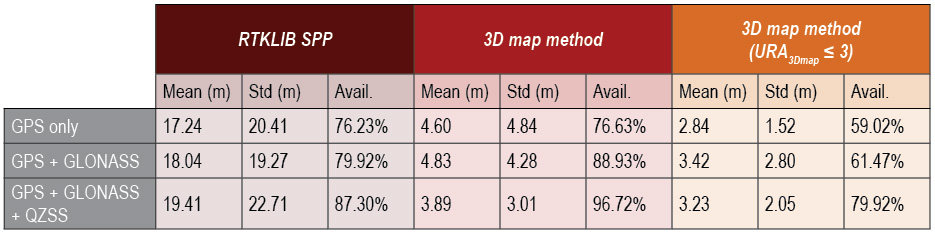
Table 2 compares the positioning results of both RTKLIB SPP and the 3D map method, showing the 3D map method using GPS, GLONASS and QZSS to have the best performance among three scenarios. The positioning error mean and availability are 3.89 meters and 96.72 percent, respectively. The positioning error mean could be further improved to 3.23 meters if selecting the position point with URA3Dmap ≤ 3 (yellow, orange and red points in Figure 6). This selection will lose about 17 percent of availability.
Table 2. Positioning results of the 3D map method using different combinations of satellite constellations in a middle urban canyon.
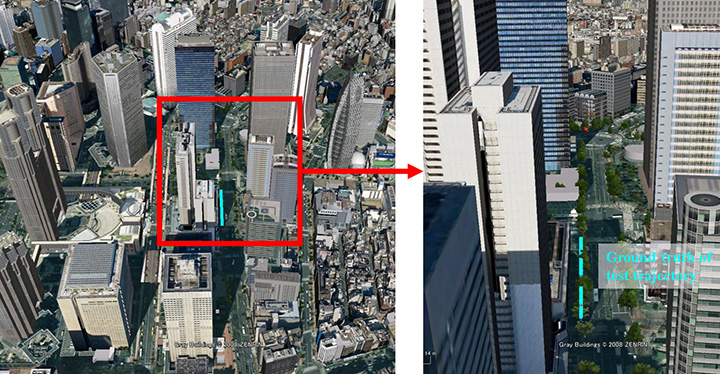
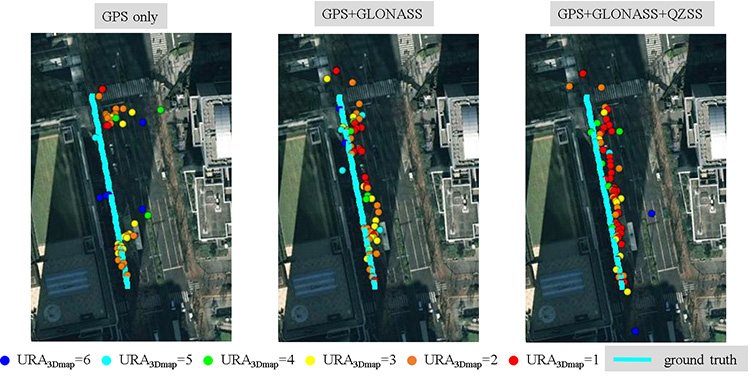
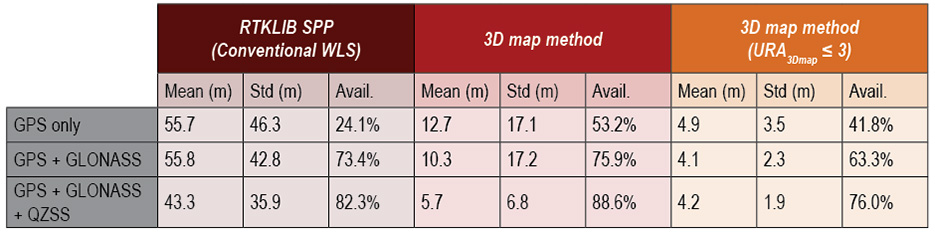
Shinjuku Deep Canyon. We conducted a similar experiment in the Shinjuku area of Tokyo, the most urbanized area in Japan (Figure 7). The positioning results and skyplot are shown in Figure 8 and the right of Figure 5, respectively. Table 3 compares the results of the two methods using the three constellation configurations.
Figure 7. Deep urban canyon environment, Shinjuku, Tokyo. (Courtesy Google Earth)Figure 8. Positioning results of the proposed 3D map method using different combinations of satellite constellations in a deep urban canyon.Table 3. Performance comparison of RTKLIB SPP and the proposed 3D map method using different combinations of satellite constellations in a deep urban canyon.
As shown in the left of Figure 8, only half of the GPS-only solutions are on the correct side of the street. A few points are incorrect due to the insufficient number of satellites. Adding GLONASS measurements greatly increases the availability, and most of the GPS-only outliers are corrected. The positioning error mean improves from 12.7 to 10.3 meters, and the availability improves from 53.2 to 75.9 percent. GLONASS measurements provide such a significant improvement because the distribution of GPS and GLONASS satellites are complementary.
After adding the QZSS measurements, availability further increases to 88.6 percent, and positioning error mean is reduced to 5.7 meters. The positioning error mean could be further improved to 4.2 meters if selecting the position points with URA3Dmap ≤ 3: the red, orange and yellow points in Figure 8. Although this selection will lose about 12 percent of availability, it could be easily compensated by a simple filtering technique.
Comparing Table 2 and Table 3, we find the positioning error of the proposed method in the middle urban canyon is about 1 meter worse than that in the deep urban canyon. This is because of the increase of multiple reflected signals.
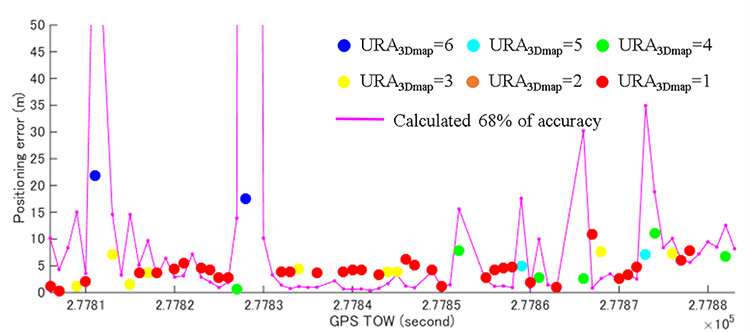
The target application of this 3D map method is consumer-based pedestrian navigation. Most of these applications benefit from an integrated system of multiple sensors. The 3D map method could serve as one sensor for such an integrated system. The calculation of positioning accuracy is required to indicate the quality of the point solution estimated by this method. Figure 9 shows the relationship between the calculated accuracy and positioning error. We can find that the calculated accuracy is able to describe the performance of the proposed method.
Figure 9. Positioning error of the 3D map method using GPS+GLONASS+QZSS. The purple line denotes the calculated 68 percent accuracy of the proposed method.
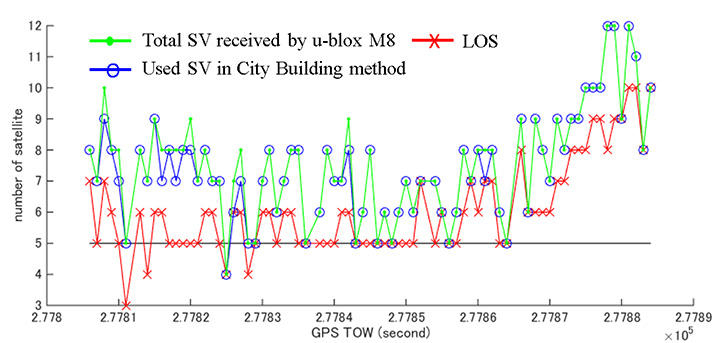
The performance of the conventional method is very inaccurate in this deep urban canyon. Its positioning error is larger than 40 meters. Figure 10 shows the number of satellites in this data. Note the number of LOS satellites is determined by the ray-tracing simulation according to the ground truth trajectory.
Figure 10. Number of LOS satellites, the number of satellites used in the 3D map method, and the total number of satellites tracked by the commercial-grade receiver.
The number of LOS satellites means the light-of-sight path of satellite is not blocked by buildings. Note that the LOS signal also contains the multipath effect. In this deep urban canyon, the number of LOS signals is much less than that of all received satellites. This implies a lot of NLOS is received, which deteriorates the performance of the conventional method. The map-based method is able to correct most of the NLOS signals.
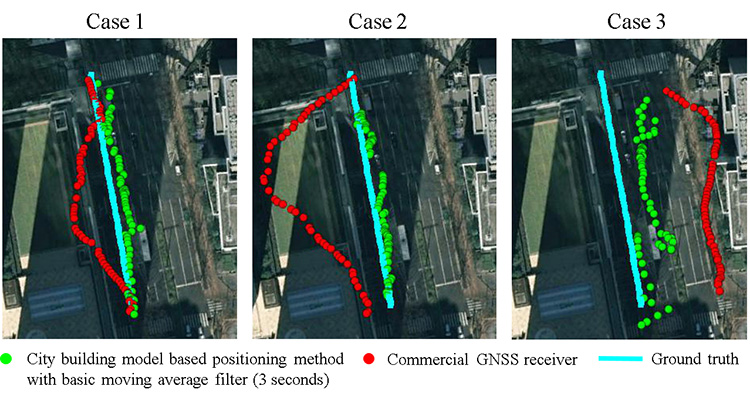
The number of satellites used in the map-based method is close to the number of all the satellites received. Therefore the map-based method can achieve better performance than the conventional method. Figure 11 demonstrates the comparison between the map-based method and the commercial GNSS receiver. The map-based method is simply smoothed by a moving average filter with 3 seconds data. It is difficult to understand the pedestrian trajectory by the commercial-grade receiver result. In some cases, the commercial receiver will estimate the pedestrian to be on the wrong side of the streets. The proposed method, instead, is capable of estimating the result at the correct side of the street.
Figure 11. Positioning results of the proposed 3D map method and commercial-grade receiver using GPS+GLONASS+QZSS in the deep urban canyon.
Li-Ta Hsu is a post-doctoral researcher at the Institute of Industrial Science of the University of Tokyo. He received his Ph.D. degree in aeronautics and astronautics from National Cheng Kung University, Taiwan.
Shunsuke Miura received an M.S. degree in information science from the University of Tokyo in 2013.
Shunsuke Kamijo received a Ph.D. in information engineering from the University of Tokyo, where he is now an associate professor.
High-performance digital camera maker Point Grey has added a new 12 MP CCD model to its Grasshopper3 USB3 Vision camera line. With high-resolution CCD image quality, high-dynamic range, and USB 3.0 interface, the Grasshopper3 is suited for a variety of demanding applications including industrial inspection, 3D scanning, microscopy and mobile mapping.
The Grasshopper3 GS3-U3-120S6 models are based on color and monochrome versions of the 1-inch Sony ICX834 global shutter CCD sensor, which features 3.1 micron pixels and 4242 x 2830 image resolution running in dual-tap at 7 FPS. The ICX834 device uses Sony’s EXview HAD CCD II pixel architecture with improved quantum efficiency and near infrared response (NIR).
EXview HAD CCD II also enables smaller pixel sizes while maintaining excellent imaging performance. This allows the high-resolution ICX834, with its 1-inch optical format, to be integrated into compact C-mount cameras like the Grasshopper3, and used with smaller, lower cost C-mount lenses.
Grasshopper3 Like all Point Grey USB 3.0 cameras, the Grasshopper3 uses a proprietary USB 3.0 link layer and frame buffer-based architecture for optimal performance and reliability. The Grasshopper3 uses an advanced image processing pipeline to enable color interpolation, look up table, gamma correction, pixel binning and USB3 Vision support.
“We’re excited to continue expanding our Grasshopper3 USB3 Vision family with even higher resolution sensors,” says Michael Gibbons, Director of Sales and Marketing at Point Grey. “This new 12 MP Grasshopper3 camera is Point Grey’s highest resolution machine vision camera to date. The ultra HD 4K Sony ICX834 CCD sensor achieves a higher sensitivity in the near infrared range (NIR) and offers better price performance than other high resolution cameras on the market.”
The Grasshopper3 GS3-U3-120S6 is list priced at $3695/€2795 and is available to order now from Point Grey, its network of distributors and the online store (for North American, EU and Australian customers).
Editor’s Note:This week, Geointelligence Insider’s Art Kalinski reports from GEOINT 2015, being held in Washington, D.C., June 22-25.
GEOINT 2015 is not your daddy’s geospatial conference. If there is a common theme to this convention, it’s the problem of too much data and not enough analysts, so there are many exhibitors addressing the issue with automated systems that merge the “man and machine,” taking advantage of the best capabilities of each.
Introduction
NGA Director Robert Cardillo on the Agency’s Strategy
NGA Director Robert Cardillo discusses the agency’s new strategy at GEOINT 2015. Cardillo became the sixth director of the National Geospatial-Intelligence Agency in October 2014.
A Demonstration of Esri’s ArcGIS Full Motion Video Add-In
Geointelligence Insider’s Art Kalinski talks with Craig Cleveland, Esri solution engineer, about the ability to geo-register full motion video inside an ArcMap.
Thad Allen Discusses eLoran at GEOINT 2015
In this interview Admiral Thad Allen, former commandant of the U.S. Coast Guard, discusses PNT alternatives to GPS for navigation, including eLoran and the activation June 19 of a signal on an eLoran tower in preparation for a timing signal trial.
Allan is an executive vice president at Booz Allen Hamilton, and a leader in the firm’s Departments of Justice and Homeland Security business in the civil market. In 2010, President Obama selected him to serve as the National Incident Commander for the unified response to the Deepwater Horizon oil spill in the Gulf of Mexico.
Geoweb 3D Demonstration at GEOINT 2015
Vincent Autieri, vice president and CEO of Geoweb 3D, explains the company’s 3D mapping engine.
CACI Predictive Tool Using Social Media Discussed at GEOINT 2015
Andrew Doyle, engineering senior manager of CACI, describes the EMBERS system, which uses social media to predict socially significant events such as protests or disease outbreaks.
GEO Business 2015, which took place at the Business Design Centre in London May 27-28, report another successful show following its launch in 2014. Visitors were queuing to get in on the first day and the overall attendance was up 25 percent on the 2014 show. More than 2,000 people attended from 47 countries, positioning GEO Business as a truly international show, organizers said.
A highlight of GEO Business show was the international exhibition with a bigger and improved layout from the 2014 launch show, incorporating an additional lower floor area and exhibitors from 20 different countries. Running alongside the exhibition was a conference that hosted presentations about projects and more than 140 free commercial workshops and outside demonstration sessions for hands-on product testing, which proved a real benefit to visitors with some sessions so packed there was standing room only.
Caroline Hobden, Event Director for GEO Business, commented, “We have had so much positive feedback following the show and are thrilled to see such an increase in attendance in just a year since we launched the first show. We are keen to support the community through our annual show by offering an opportunity to share knowledge, promote cutting-edge commercial solutions and provide networking opportunities.”
Derry Long, Business Development Manager of MBS Survey Software Ltd., was one of many who provided personal feedback after the event. “GEO Business is now the established show for everyone involved or interested in geospatial activities. Once again GEO Business delivered a top quality exhibition and conference that showcases the best that the geospatial community has to offer. We will be back next year.”
The GEO Business conference featured an exceptional line-up of presentations with updates about high profile projects and technologies. The keynote address by Kate Hall, director of the Built Environment at HS2, the UK’s proposed new high speed rail line, attracted much interest with an enlightening talk about how high quality geospatial and GIS data will form the core of rail travel in the future. Other popular subjects included wearable GIS tools, future technologies, and BIM — with the second keynote address by Stephen Hamil, director of Design and Innovation at NBS National Building Specification, providing insight into BIM tools for digital planning and project management.
Conference Chairman Graham Mills (chairman of Technics Group and past president of The Survey Association) reported a conference that was bustling with delegates, explaining, ”The conference perfectly represented the energy of the geospatial industry at the moment, with inspiring presentations to reflect all the opportunities of a growing community. I’m delighted to have achieved this through our 50 papers.”
In addition to the exhibition, conference and workshops, GEO Business also hosted a lively social program with welcome drinks and a gala dinner which raised over £1700 for the charity MapAction. MapAction is on standby 365 days a year, ready to deploy skilled volunteers to the scene of a disaster within hours of an alert. The humanitarian mapping service they deliver can make the difference between life and death for survivors.
Caroline Hobden, summarized, “With so much achieved at our second GEO Business event, we’re already looking forward to our 2016 event where we hope to reach an even greater level of success for the industry. GEO Business 2016 will once again return to the Business Design Centre on May 24-25, 2016 and we look forward to welcoming the industry once again.”
 Trimble has introduced its next-generation Trimble Indoor Mobile Mapping Solution (TIMMS) that produces fast and accurate maps of difficult-to-navigate indoor spaces and translates them directly into 2D and 3D models of structured interiors.