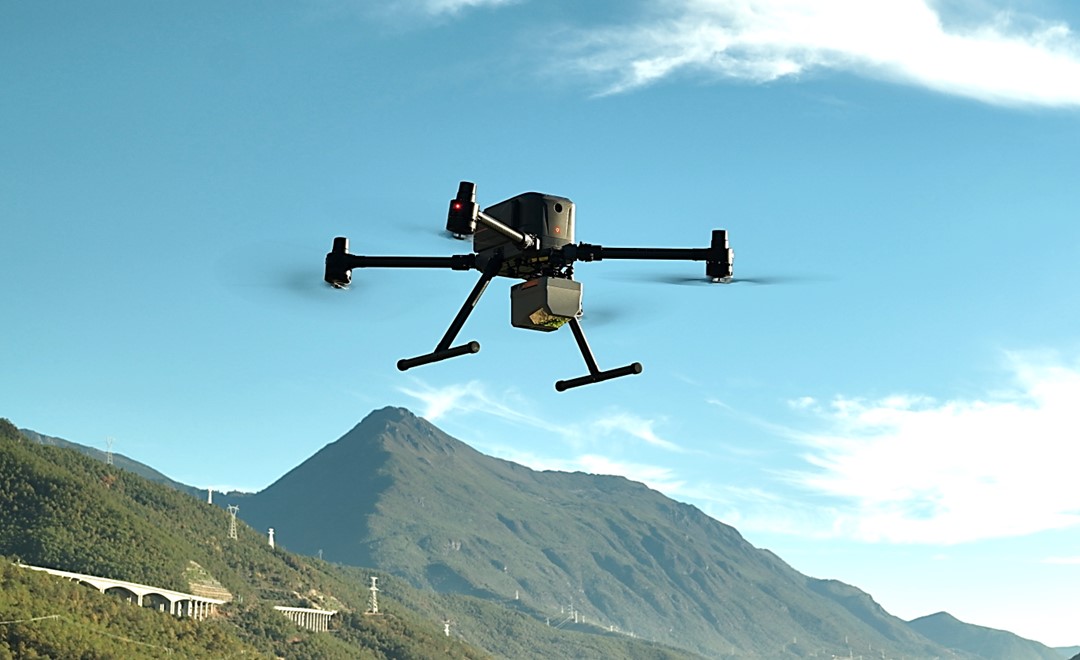
CHC Navigation (CHCNAV) has released the AlphaAir 6, a flagship airborne lidar system designed for UAV-based laser scanning, drone lidar mapping, and aerial surveying in high-relief and complex terrain.
Combining prism scanning technology with a high-grade inertial navigation system (INS), the AlphaAir 6 delivers a maximum ranging capability of up to 2,100 meters and supports efficient data capture at typical flight altitudes of 400 to 600 meters above ground level.
The AlphaAir 6 integrates an upgraded laser engine and a high-grade IMU with 0.3°/h bias stability to improve trajectory accuracy and point cloud quality. This design removes the need for pre-mission IMU calibration and supports stable, efficient data collection for topographic mapping, corridor mapping, and wide-area aerial survey workflows.
The AlphaAir 6 combines fifth-generation real-time waveform processing with advanced multi-period technology to capture richer, denser, and more precise lidar data across complex terrain, vegetation, and built environments. According to CHCNAV, even at an ultra-high pulse repetition rate of 2,000,000 pulses per second, it continues to support real-time point cloud output, giving operators immediate in-flight visibility and a faster path to survey-grade 3D results.
To meet different project requirements, the AlphaAir 6 is available in single-camera and dual-camera configurations. Both options use large-format CMOS sensors to deliver high-resolution imagery, while the dual-camera version adds an ultra-wide field of view to improve image coverage and increase mapping efficiency.
With an integrated design and a weight of 1.35 kg, the AlphaAir 6 reduces payload burden on UAV platforms and helps extend flight endurance. Open interface protocols support integration with mainstream multirotor and fixed-wing UAVs, giving surveying and mapping professionals more flexibility across different mission types.
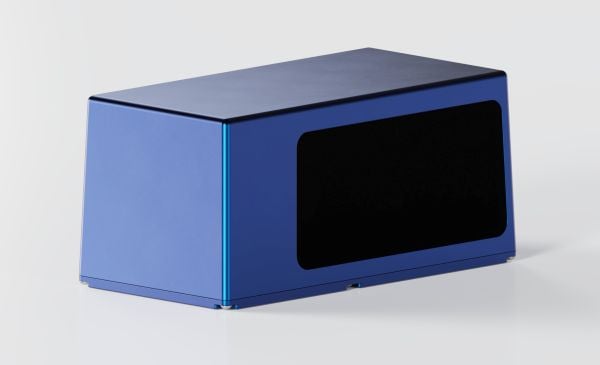
Voyant Photonics is offering new versions of its Carbon lidar platform, adding 32-line and 64-line variants designed to bring the power of frequency modulated continuous wave (FMCW) sensing to more compact, cost-sensitive, and compute-limited systems.
The new models will be on display at the upcoming Consumer Electronics Show (CES 2026) in Las Vegas (LVCC West Hall, Booth #4875). Voyant will demonstrate live FMCW sensing capabilities and provide development kits for qualified partners.
The models complement the existing 128-line configurations, enabling broader choices and customizations from the Voyant portfolio of low-cost, high-performance sensors, and optimized for industrial autonomy, robotics, drones and smart infrastructure applications.
Building on the same efficient semiconductor foundation as Voyant’s flagship Carbon platform, the new versions offer lower data rates and simplified integration without sacrificing core FMCW advantages such as velocity measurement, interference immunity, and high dynamic range.
The Carbon family represents Voyant’s most versatile and scalable lidar product line, designed using Voyant proprietary silicon-photonics architecture that integrates beam steering and coherent detection on a single photonic chip. This integrated technology will unlock mass-production economics, reduced calibration drift, and unmatched consistency from unit to unit, the company said.
The new Carbon variants extend the core Carbon platform’s advantages:
High-precision depth sensing and real time velocity
Exceptional ambient light immunity, ensuring reliability from dim warehouses to direct sunlight
Compact design for demanding industrial and mobile environments
With line resolutions now spanning 32, 64 and 128, OEMs and system integrators can tailor performance, bandwidth and compute load to their specific use cases, from agile robotics and compact AGVs to drones and embedded edge platforms.
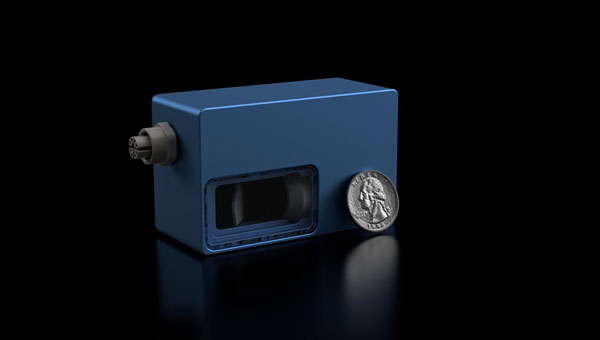
Voyant Photonics has introduced the Carbon frequency modulated continuous wave (FMCW) lidar sensor. It features lidar on a chip with solid-state beam steering integrated into a fingernail-sized silicon photonic chip. The Carbon sensor offers high-resolution imaging with millimeter precision and object detection capabilities up to 200 m.
FMCW technology enables instant velocity measurement at each point, in addition to distance, reflectivity and intensity data. This 4D capability allows for high-fidelity point cloud data generation, providing a real-time view of the environment up to 20 times per second, according to Voyant Photonics.
The sensor’s performance is notable in various environmental conditions. It can operate effectively through dust, fog, rain, and snow and is immune to sunlight interference, particularly during sunrise and sunset. Additionally, it is not affected by highly reflective objects such as street signs, traffic cones and safety vests.
The Carbon sensor seeks to enhance machine perception capabilities across various industries, including industrial automation, robotics and security applications. Its software-defined lidar feature allows users to modify the frame rate and adjust the field of view during operation.
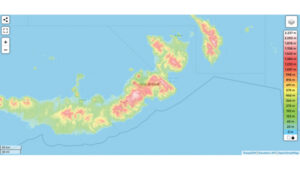
Elevation map of New Britain, Papua New Guinea. (Photo: topographic-map.com)
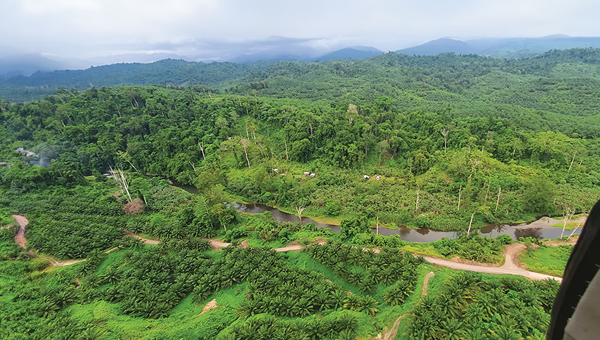
The Discovery Channel’s recently released “Finding Amelia” documentary explores the latest expedition aimed to uncover Amelia Earhart’s mysterious fate, featuring the participation of SPH Engineering. The film investigates the theory that Earhart and her navigator, Fred Noonan, may have crashed in Papua New Guinea during their 1937 attempt to circumnavigate the globe.
SPH Engineering joined the search nearly two years before the expedition, leveraging its experience from successful UAV operations in Greenland. The team’s mission focused on the dense jungles of New Britain, an island in Papua New Guinea, where they employed UAV technology to search for Earhart’s aircraft.
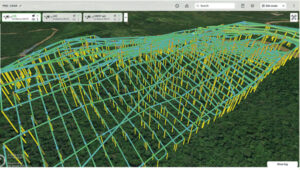
Planned routes for lidar scans in SPH Engineering’s UgCS flight planning software. (Photo: SPH Engineering)
Technology and challenges
The documentary follows the testing for the mission, which began in February 2021. The team conducted experimental detection of aircraft engines using UAV-mounted magnetometers. These experiments led the team to request satellite imagery and elevation maps of where the expedition was planned. This map was essential for studying the terrain and preparing for the mission. According to the analysis, the average expected vegetation height of 10 to 15 m allowed for the detection of aircraft engines using a magnetometer.
The SPH Engineering team arrived on-site with a suite of UAVs equipped with magnetometer, lidar and photogrammetry tools.
During the search, a small UAV equipped with a camera was first used to create precise maps of the search area. These maps were essential for planning subsequent flights. The team then conducted lidar scanning from a safe altitude to build digital surface models (DSM) and digital terrain models (DTM) to plan magnetic surveys.
The next step was to conduct the survey using a UAV-based magnetometer. The team found that while the average height of trees allowed for the detection of aircraft engines using a magnetometer, the presence of extremely tall trees made magnetic flight planning difficult.
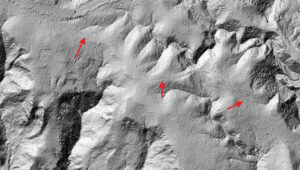
Processed lidar data showing potential Japanese troop trails. (Photo: SPH Engineering)
Janis Kuze, director of special projects for SPH Engineering explains the challenge. “In contrast to what we saw in satellite data available before the expedition, the average height of the trees was a bit greater, but the main problem was real ‘skyscrapers’ towering up to 60 m. These extremely high trees were totally missed in satellite elevation data. Despite the challenges, we had relative success detecting magnetic anomalies over the B-17 bomber crash site.”
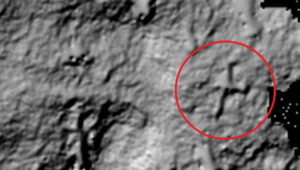
Processed lidar data showing the object resembling the shape and size of Amelia Earhart’s aircraft. (Photo: SPH Engineering)
Operation and results
Due to the high trees and the limited amount of magnetic ferrous metal in airplane engines, reliable detection using magnetometers proved difficult. The team then decided to switch back to lidar. Dozens of low-altitude lidar flights were conducted, using previous scans for flight planning, to build a detailed map of the ground surface beneath the trees.
The results revealed what is believed to be hidden Japanese troop trails and something resembling the shape and size of Amelia Earhart’s aircraft, the Lockheed Electra.
NV5 Geospatial has launched Trim Optimization, a predictive modeling platform that enables electric utilities to enhance vegetation management programs with risk-based assessments.
Using information from existing lidar and historical data, utilities can leverage Trim Optimization to prioritize tree-trimming activities by taking into account the risk posed by individual trees and other operational constraints.
“Trees are to blame for a large percentage of outages, and vegetation management is the single biggest cost for electric utilities. Yet, utilities have only started to look at proactive, risk-based management programs, rather than the traditional cycle-based ones,” said Ian Berdie, vice president of innovation for NV5 Geospatial. “NV5 Geospatial’s Trim Optimization platform will help utilities improve grid reliability through better decision making, while also saving them money through greater efficiency and the ability to target areas that have the most potential for problems.”
Vegetation is one of the largest sources of outages, accounting for more than half, according to a recent survey, “Geospatial Analytics, Resilience and Extreme Weather Readiness.” The majority of respondents also noted that they use data to analyze risk, but budget constraints often prevent them from investing in the data they need.
The trim optimization platform takes a phased approach to identify relative risk to target vegetation management work where it will have the most impact. With extensive expertise, NV5 Geospatial first identifies several attributes associated with vegetation-caused outages that can be modeled from high-density lidar and provide a relative risk score.
Utility-specific data, such as historic tree failures information or other factors, can be analyzed to enhance results further.
The final risk scores will provide a quantitative assessment of combined risk, enabling utilities to develop work plans that prioritize vegetation management mitigation efforts and result in greater operational efficiency.
NV5 is holding a webinar on Trim Optimization on Aug. 25. Register here.
SPH Engineering has updated its UgCS software with a lidar toolset for UAVs. The toolset is designed to unlock the full potential of lidar sensors, making remote sensing more effective without human errors. Key features include precision calibration, flight patterns for route planning, anti-shake turns, and constant line spacing and buffer.
The UgCS lidar toolset allows users to optimize time and cost-effectiveness at all stages of data collection and processing. Time is saved on mission planning with flight patterns and turns designed for lidar surveys. During flight, users can acquire high-quality laser data with preset inertial measurement unit (IMU) initialization patterns and anti-shake lidar turns. During post-flight data analysis, the high accuracy of acquired data ensures users can get the desired results with one trip to the field and quality data analysis.
“We have received various requests from lidar producers and end-users to improve the accuracy of laser data collected with a UAV,” said Alexei Yankelevich, head of software development at SPH Engineering. “We have invested in UgCS R&D to focus mainly on automated IMU calibration commands, automatic calculation of required line spacing and overlap, and prevention of sensor shaking. Trial flights over SPH Engineering’s in-house test range have confirmed UgCS lidar toolset capacity to support main lidar market players.”
Common application areas include power-line inspections, road inspections, construction, mining, archaeology and forestry.
Advances in geospatial technology have opened up many new possibilities in areas such as national security, urban planning and emergency preparedness. When I was embedded with the U.S. Army as a scientist in Afghanistan, I got to experience firsthand the exceptional value of 3D data. The military used nation-scale imagery and lidar to generate 3D maps that then informed their safety-critical operations. However, since lidar—like most three-dimensional unstructured data—contains incredible complexity and detail, it was painfully slow to analyze manually.
As a result, the impact of this technology was severely restricted by speed and cost due to the significant manual effort required to extract actionable insights. As we looked to the future, where lidar would become commonplace in consumer electronics and automobiles, it became clear that there was an opportunity to combine computer vision/AI with large-scale cloud computing to rapidly and automatically generate actionable insights from 3D data.
Screenshot: Enview
After returning from Afghanistan, I reconnected with Krassimir Piperkov, a former colleague from ICON Aircraft, and fellow Stanford alum, to launch Enview. Our objective was to automate 3D geospatial analytics and create a living 3D model of the world to help organizations to protect their critical infrastructure and communities.
Powering geospatial data with AI can take the limits off 3D data analytics, prevent threats from becoming incidents, and protect critical infrastructure. What used to take days or months to process can now be done in minutes, enabling analysts, operators, and decision-makers across the public sector to make timely and accurate decisions. By enhancing our understanding of the physical world, this technology empowers us to tackle pressing challenges like wildfire prevention, humanitarian assistance, disaster response, and more.
Let’s take a look at how AI-powered 3D modeling is being put to use.
Digital twins
A living 3D model of the world, or a digital twin, can be used for many purposes. Enview’s software fuses many different data sets together to create digital twins that are global in scale but have high-resolution to enable local decision-making. These digital twins include 3D terrain, vegetation, buildings, and infrastructure such as power lines, roads, and water works. Enview also fuses real-time and forecasted conditions, such as wind, temperature, humidity, traffic, and IoT (internet of things).
This sort of rich representation of the physical world is an incredibly complex big data challenge. Data comes from radically different sensor modalities, with different resolutions, formats, time-domains, and accuracy. AI plays a critical role in automating the fusion of these datasets, by helping to intelligently align and then fuse them into a cohesive entity. 3D geospatial data is particularly challenging, as it is unstructured data, which requires a new generation of deep learning frameworks whose convolutional kernels are specifically developed from the ground up to work on unstructured data. Further, the datasets are massive in scale. A square-mile of 3D lidar data can have hundreds of millions of points; the magnitude of the data easily passes the petabyte scale when one considers applications that span nation-scale areas. In order to process this volume of data, modern geospatial AI architectures must be containerized and dynamically deployable across cloud compute resources to generate timely insights.
AI is essential to help human experts to extract meaningful insight from this overabundance of data. The application of automated workflows allows experts to look at larger areas, with more speed and higher frequencies. This machine-assisted cognition draws upon the respective strengths of people and computers to do what neither could do on their own.
Humanitarian aid and disaster relief
3D models can be built to monitor hurricane hotspots, such as the Gulf Coast, before major storms strike. By layering in real-time weather information such as rainfall, winds, and flooding, these models can help with planning, emergency response, and relief efforts.
This data also provides life-saving insight that can assess damage to buildings, transportation, and downed power lines, in addition to determining where to send medical and relief supplies, and how to best get them there. 3D data can help to lessen the impact of future weather events by updating the baseline understanding of how storms impact coastal communities so they can plan for the future.
Screenshot: Enview
Infrastructure protection
Inadequate clearances between vegetation and power lines can result in wildfires and unplanned power outages. Many federal, state, and local regulations are in place to mandate clearances, and power line operators monitor their networks continuously to ensure that they abide by these regulations and prevent incidents and outages. However, doing so by walking or flying the lines and judging distances with the human eye is challenging and inaccurate.
The ability to identify the exact location and clearances of high-risk vegetation early, and at scale, lets operators identify, prioritize, and address problem areas proactively. Lidar-driven programs have helped with risk-reduction, but are constrained by the massive levels of manual data manipulation required to derive insights from this 3D data. The automation of 3D geospatial analytics through AI, machine vision, and parallel computing enables the accurate and rapid identification of at-risk areas, protecting critical infrastructure and communities.
Screenshot: Enview
Fighting wildfires
Devastating wildfires resulting in the loss of life and property have become commonplace in the western U.S. and other parts of the world. The tools and methods previously relied on to keep communities and infrastructure safe are now struggling to keep up with this increased threat.
Geospatial information, including 3D data, provides a digital view of the physical world and, when paired with AI, gives stakeholders the informational edge they need to minimize wildfire damage, injuries, and deaths. This technology can be used to automatically build and update real-time, high-resolution wildfire risk maps that give firefighters and communities more notice when threats are imminent, and provide firefighters with real-time situational awareness when they’re fighting the blazes.
Change detection
According to the Pipeline and Hazardous Materials Safety Administration (PHSMA), third-party excavations are one of the leading causes of pipeline incidents in the U.S. These incidents can lead to service disruptions, expensive repairs, and sometimes serious injuries or deaths.
Detecting signs of excavation or earth movement via aerial patrolling is challenging and costly, while resource limitations make it difficult for pipeline operators to continuously monitor remote areas such as farms. AI-powered 3D maps can be used to monitor topography and accurately detect changes that threaten pipelines in real time.
3D data provides remarkable value when it comes to decision-making as it relates to many different applications—from military defense to protecting neighborhoods from wildfires. However, its success hinges on one thing: speed. The ability to process 3D geospatial data rapidly, and at scale, is made possible through advances in AI and cloud computing. In the future, we can expect to see more exciting and innovative use cases for AI-powered geospatial technology.
San Gunawardana is co-founder and CEO of Enview, a geospatial analytics company. After finishing a Ph.D. in aerospace engineering at Stanford, Gunawardana went to Afghanistan, where he combined data analytics and remote sensing to detect threats and prevent incidents. He is excited to apply those insights to help the energy sector solve problems. He has done computer vision at NASA, built imaging satellites with the Air Force, and was an early employee at ICON Aircraft.
RedTail Lidar Systems partnered with an engineering firm to demonstrate the RTL-400 lidar system’s high-resolution, high-accuracy mapping capability.
Cross-section of lidar point cloud (Image: RedTail Lidar Systems)
According to the company, its lidar imagery was used to generate as-built conditions of a steep ravine to aid in long-term monitoring of the slopes under which a natural gas pipeline was buried.
A narrow road traversing the top of the ravine through which the pipeline was installed was of concern since the instability could be dangerous. Loss of vegetation along the buried pipeline’s path also makes the area especially susceptible to slides after heavy rainfall.
Top view of lidar point cloud (Image: RedTail Lidar Systems)
The RTL-400’s high-resolution point cloud data of the 13-acre ravine area was captured in 10 minutes, RedTail Lidar Systems said. The as-built digital elevation model (DEM) created from the lidar point cloud can be compared to future DEMs to determine if any changes have occurred in the slope’s topology, which would serve to identify hazards and provide input for slip mitigation.
RedTail Lidar Systems is a division of 4D Tech Solutions, a company focused on providing innovative technology-based solutions to address government and commercial customer needs.
Application empowers users with expert visualization and analysis of lidar
Enview, a pioneer in the scalable processing of 3D geospatial data, has launched Enview Explore, a powerful web application that leverages artificial intelligence (AI) and cloud computing to automatically process 3D data at a high speed and scale.
Also, Robert Cardillo, former director of the National Geospatial-Intelligence Agency (NGA), has joined the company’s board of directors. Following an oversubscribed round of funding in May, the company continues to experience growth and momentum in the market.
Enview’s technology has been deployed on thousands of square miles worldwide to protect vital infrastructure and support mission-critical operations. Its unique method for classifying 3D data using neural networks and deep learning techniques reduces time to action by focusing on finding meaningful insights in 3D data.
Previously offered as custom services for organizations such as Pacific Gas & Electric and the United States Air Force, this groundbreaking technology is now available for the first time as an easy-to-use, self-service web application.
Screenshot: Enview
“Enview has built the world’s most scalable AI platform for transforming 3D point clouds into insight and action,” said San Gunawardana, Ph.D., co-founder and CEO of Enview. “We are solving one of the hardest problems in machine perception, and applying it to some of the most grounded and impactful challenges facing society. It is our goal to empower people with the confidence to perceive and navigate a rapidly changing world; Enview Explore is the natural next step in this journey and our team is excited to place this groundbreaking capability directly into the hands of operational end-users.”
Key benefits of Enview Explore include:
The power of 3D data. Three-dimensional unstructured data, such as lidar, contains incredible detail but is painfully slow to analyze manually. Enview solves this problem by combining its novel AI with the power of cloud computing to automate 3D classification and segmentation, giving users scalability that can support even nation-sized datasets.
High speed. While current methods can take weeks or more to process data, Enview provides actionable insights in minutes. Enview Explore utilizes a new and innovative approach that applies AI to 3D data, yielding significantly faster results than traditional lidar software.
Total data control. Enview Explore removes the need for outsourcing lidar to a third party by giving users the ability to perform classification, segmentation, terrain modeling, change detection, feature extraction, and intuitive visualization directly inside the application.
Screenshot: Enview
“With this release, we wanted to show the world that you don’t need to be a professional to get expert analysis from lidar,” said Anthony Calamito, VP of Products for Enview. “Lidar and other 3D data hold tremendous value and provide unparalleled insight over 2D data sources. While unlocking that value traditionally has required an in-depth understanding of specialty software, Enview Explore lets anyone create meaningful insight from 3D data with just a few clicks.“
The company also announced that Robert Cardillo has joined its Board of Directors. Cardillo served as the sixth director of the NGA from 2014 through 2019. In that position, he led the NGA under the authorities of the secretary of defense and director of National Intelligence to transform the agency’s future value proposition through innovative partnerships with the growing commercial geospatial industry.
“Mapping the world in 3D opens new possibilities for national security and mission-critical infrastructure, including some of the most important challenges facing our nation today,” said Cardillo. “Enview has completely changed the game when it comes to what’s possible with lidar visualization and analysis, making unstructured data accessible and easy to use: in other words, creating coherence out of chaos. With a shared purpose and commitment, I look forward to working with the Enview team toward the future the world demands and our customers deserve.”
A point cloud is fundamentally a simple construct. It is a collection of points in 3D space, each point being given a coordinate in Cartesian convention. The points can also be given other properties, often these will be indicative of how they were obtained.
Examples might include the time at which they were “seen” by the surveying device that collected the data. The intensity or error in position that the point has might also be included.
Often point clouds will have around 100 million points after conducting a survey. Photography can also be overlaid on point clouds using photogrammetry techniques to essentially build 3D photography.
Image: OxTS
INS survey: point clouds
The principal method of collecting point-cloud data is by using lidar. Lidar technology is akin to radar: light is sent out from the device and bounces back off of objects. The difference is that radio uses large wavelength radio waves and lidar uses small wavelength lasers for high precision.
The time for light to return to the device is used with the speed of light to calculate the distance away. Typically, a lidar device will contain lasers with a fixed vertical angle, but which spin around in the horizontal plane. Internally, the device knows at what angle the laser is pointing vertically and its azimuth angle. This gives the device the position of the point on the object in 3D spherical coordinates.
The lasers inside produce thousands of points per second. Intensity, mentioned above, refers to the intensity of the reflected beam and indicates the reflectivity of the object.
What is a georeferenced point cloud?
Lidar requires navigation data to conduct a survey. We combine the navigation data with the lidar data to create georeferenced point clouds. Lidar devices know where points are in relation to each other, but they need to be told where they are in the world to be able to build a point cloud while moving the lidar.
The navigation data often comes from an inertial navigation system (INS). An INS is a sophisticated combiner of inertial measurement unit (IMU) and GNSS data to get the best navigation data — so a device knows where it is in the world and how it is moving.
The coordinates from the INS are added vectorially to the point coordinates of the lidar to get the final coordinates that would be used in the point cloud. This allows a user to put their lidar device on a vehicle like a van or an unmanned aerial vehicle (UAV) with an INS, to survey large areas efficiently instead of doing multiple static surveys and stitching them together.
Photo: OxTS
What are point clouds used for?
There are a wide range of applications for which point clouds can be used. They are increasingly used in real time for robots and autonomous driving computers to understand their environment and navigate through it. The data in a point clouds is convenient for recognizing and identifying surfaces and objects; for example, other cars, road signs and lane markings.
OxTS has been a global leader in inertial and GNSS technologies since 1998. OxTS is fundamentally involved in helping car manufacturers get the navigation data they require to go with lidar data in autonomous vehicle development, and in point clouds creation for use in surveying.
Distances and volumes are easy to calculate using point-cloud analysis software, and intensity can help identify different materials.
Another feature that lidar offers is multi-returns. This allows a laser pulse (which has a finite cross-section) to bounce back off of multiple surfaces to give multiple points from the same pulse. This is particularly useful for seeing windows and also seeing through them, and also for a myriad of other uses such as seeing the top of a treeline and the ground when flying over with a UAV.
It can also be used to see snow depth. The lidar can see the top layer of snow and also gets another strong return from the ground beneath.
At OxTS, we see lidar point clouds being used for driverless-car and work-vehicle development, coastal and forest management, infrastructure monitoring (signs, drains, bridges, road surfaces, railroads, etc.), creating 3D models of cities, pipeline exploration and more.
The final product is a simple file format, for which the possibilities are almost endless — and we see new applications using point clouds all the time.
This image of Wales is color-coded to show the relative height of the land. (Image: Bluesky)
Aerial mapping company Bluesky International has been awarded a contract by Natural Resources Wales, on behalf of Welsh Government, to capture a high-resolution laser mapped aerial survey of the whole of Wales.
Working alongside Natural Resources Wales and the Welsh government, Bluesky will capture the data at a resolution of 2 points per metre before processing and delivering lidar data for more than 20,000 square kilometers of rural and urban landscapes.
The Bluesky lidar data will be employed in a range of policy areas including flood modeling, forestry management, coastline monitoring, urban planning and archaeological conservation.
In addition to use internally by Welsh Government and Natural Resources Wales, the lidar data will also be made publicly available in due course, via Welsh Government’s Lle Geo-Portal website and Bluesky’s Mapshop.
“Historically, lidar data has been acquired over Wales at various points in time from the 1990s onwards,” said Paul Isaac, project manager at Natural Resources Wales. “However, since these datasets have been collected for different reasons a patchwork of data exists that is inconsistent in terms of capture technology, coverage and resolution. Also, many of the high-altitude, mountainous areas have not been captured at all resulting in key habitats and ecosystems remaining unmapped.”
“This pattern of largely uncoordinated acquisitions would likely have continued with different programmes and projects funded from various sources,” he added. “Therefore, rather than different public sector bodies securing data individually — leading to inefficiencies and discrepancies — Welsh Government proposed to capture one consistent dataset to cover the whole country. A further key driver for the projects is the wider economic benefit as organizations and individuals will no longer have to fund separate data capture.”
Bluesky was awarded the National Lidar for Wales contract following a formal tender process with responses evaluated on technical ability as well as price. All tenders were required to provide a detailed methodology of how they would complete the project to the published specification.
“Bluesky was able to provide evidence that they could provide the required services at a competitive price,” Isaac said. “Bluesky also showed they had extensive experience in this field having successfully delivered a number of related projects.”
“We are delighted to be working with Natural Resources Wales on this nationally significant project,” said Rachel Tidmarsh, managing director of Bluesky International. “As a team, we have great experience delivering large scale projects of this nature to the required specification and timescales.”
Highly accurate, UK city-wide 3D models are now available to view and download from Bluesky’s online Mapshop.
The geographically accurate, photo-realistic MetroVista mesh models are available in a variety of formats ready for use in 3D GIS, CAD and other modelling software as well as visualisation, gaming and Virtual Reality workflows.
Captured using Leica’s large-format imagery and lidar hybrid airborne sensor and generated in Skyline’s PhotoMesh software, the Bluesky MetroVista datasets of major UK cities are available online offering a compelling alternative to traditional photogrammetrically produced models.
Now in America. In December, Bluesky launched its 3D data capture programme in the United States. The MetroVista product suite allows high-resolution imagery, both vertical and oblique, to be captured simultaneously with high-accuracy, wide-scale 3D data using an advanced Leica camera, the CityMapper. Specifically designed for 3D city modeling and urban mapping, the system includes a traditional vertical camera as well as survey-grade oblique cameras.
The CityMapper also includes high-performance lidar technology to accurately collect elevation data — even in shadows that are common in urban environments and can make photo-based collection difficult.
“Since launching in the UK the MetroVista product range has received enormous offline interest from sectors such as infrastructure and building development, risk assessment, telecommunications and environmental mapping,” said Rachel Tidmarsh, managing director of Bluesky. “By making the data easy to access and consume via our online Mapshop, we hope to increase the take up from traditional users of 3D models and encourage applications such as smart city management, autonomous vehicle testing, virtual reality experiences and gaming.”
Two seasons in the UK
Bluesky has been capturing MetroVista data in the UK for two flying seasons. Visitors to Bluesky’s Mapshop will initially be able to select an area and download MetroVista mesh models of London, Birmingham and Cambridge with other UK and U.S. cities coming online in the future.
Data can be supplied in a variety of proprietary and open source formats including OBJ, FBX, I3s and 3DML for use in Skyline’s TerraExplorer product suite.
The Bluesky Mapshop also offers complete nationwide coverage of aerial photography from multiple epochs, 3D models, lidar data, thermal mapping and Bluesky’s National Tree Map. Blueskymapshop.com is easy to use and purchasing of data is simple, straightforward and secure. Account options are also available and data can be purchased with a range of easy to understand licence options, including the option of a Sub Contractor Licence.