Tag: automotive

  • Handling at the Limits: Robotic Racer Offers Help for Ordinary Drivers

    By Tyler Brown

    Learning how to control a car as a race driver does, at its very limits of handling, can ultimately assist ordinary drivers who enter a turn too quickly or are driving on a wet road and don’t realize when they need to brake. DGPS and inertial sensors drive feedback and feedforward speed controllers on a twisting test track to the top of Pikes Peak.

    Stanford professor Chris Gerdes and his Dynamic Design Lab have outfitted and trained a white Audi to roar up the Pikes Peak International Hill Climb, a 12.5-mile racecourse to the top of the 14,110-foot Rocky Mountain summit.

    Without a driver.

    Officially known as the Autonomous Audi TTS Pikes Peak, the car has been nicknamed Shelley by its crew, in honor of Michele Mouton, the first woman to win the Hill Climb, in 1984, also in an Audi.

    The team of graduate and Ph.D. students and Volkswagen’s Palo Alto research lab have spent two years conceptualizing and modifying the car to make the solo climb. They have just returned from tests of the car’s DGPS and other sensors on the course. International [human] racers competed on June 30, with the fastest just missing the course record of 10 minutes, 1.408 seconds, established in 2007, by a mere 10.082 seconds. That’s an average speed of 75 miles per hour over a course with 156 turns, many of them hairpins, an elevation gain of 4,721 feet, and both paved and gravel surfaces. Speeds at the Pikes Peak Hill Climb, often described by drivers as racing against the mountain more than other vehicles, top out around 165 miles per hour.

    Shelley, not specifically built as a racecar, does not have the horsepower to hit that speed, but she aims for respectable rates all the same. “We are ultimately going for the fastest time we can get in a TTS and hope to establish that range in September and shoot for it in 2011,” wrote Gerdes from the mountain.

    Safety the Goal. The team’s work is a variation on one theme: make Shelley drive faster, smarter — and safer.

    “We believe that if we can learn how to control a car at its very limits of handling,” Gerdes said, “then we can also help ordinary drivers who enter a turn too quickly or are driving on a wet road and don’t realize when they need to brake. That’s ultimately where we hope this goes: safety systems.”

    “Average drivers sometimes end up involved in road accidents due to their inability to control a vehicle at its limits,” Gerdes and Krisada “Mick” Kritayakirana wrote in a 2009 paper, from which the following results and figures are drawn, “yet racecar drivers routinely operate a vehicle at its limits without losing control. The difference could come from two key characteristics that racecar drivers have acquired.

    “First, a racecar driver has the ability to estimate the friction between the tire and the road surface. Second, a racecar driver can utilize all of the actuators to control the vehicle at its limits, such as using the throttle and brakes to steer the vehicle, which could be counterintuitive to a typical driver. If a controller could imitate a racecar driver, perhaps this same concept could be applied to a vehicle safety system to assist drivers when they are on the verge of losing control. The controller could utilize every actuator to assist the driver, and real-time friction estimation could help predict the control authority that each actuator has. The goal of this research is to create a controller that captures these two key characteristics of a racecar driver.”

    Feedforward, Feedback. Before entering a corner, a racecar driver anticipates the speed and steering angle that he or she would use. Similarly, in the Gerdes/Kritayakirana research, a feedforward controller is used to predict the speed and steering commands. While cornering, a racecar driver adjusts actuator commands (steering, throttle, and brake) to cope with any disturbances or driver’s perception mismatches (modeling errors). A feedback controller is designed to imitate a racecar driver making corrections during cornering. As a consequence, the desired steering and speed commands are calculated from the sum of feedforward and feedback controllers.


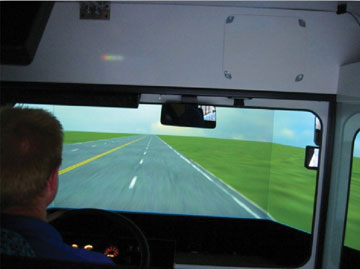
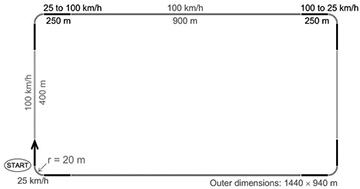
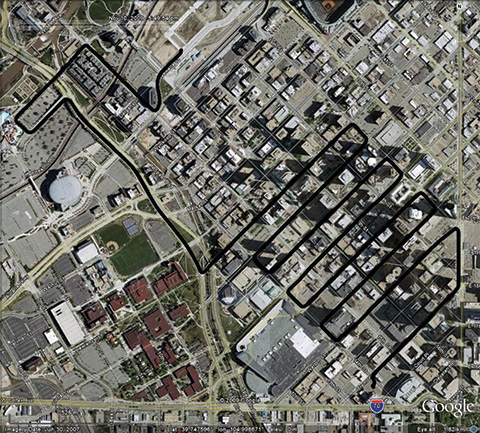
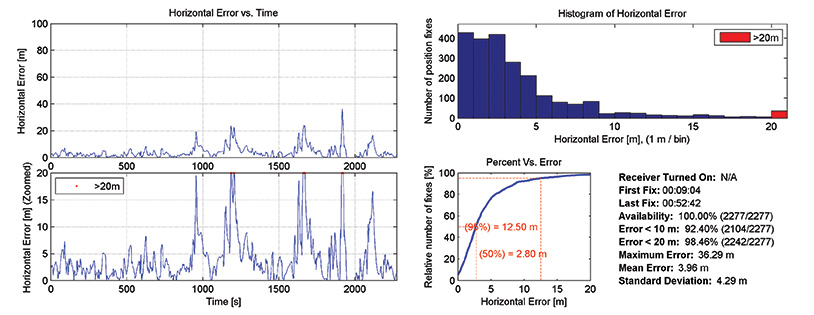
    Robustness Tests. At Stanford, preliminary testing of Shelley’s control systems on the student-built P1 by-wire research vehicle provided a proof of concept. As with Shelley, P1’s DGPS and inertial sensors determine path-tracking errors that can be used to implement the steering feedback controller. A large parking lot with gravel over asphalt provided the ideal proving grounds for these tests. The inconsistent surface provided varying friction in the range of 0.4 to 0.6 and therefore presented a control challenge. The steering control had to be robust enough to ensure that this variation did not result in instability and the vehicle spinning.

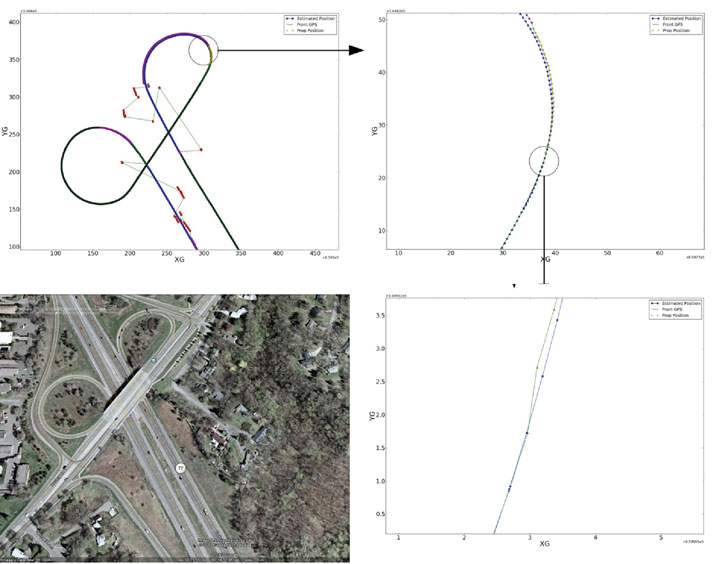
    The vehicle trajectory in Figure 1 shows performance of the steering feedback tested in isolation with an arbitrarily chosen constant accelerator input. Because the vehicle enters the curve much faster than the friction between the tire and the road can support, large deviations from the desired path (in this particular case, a maximum lateral error of 10.7 meters, and maximum heading error of 18.73 degrees) occur.

     Figure 1. Vehicle trajectory with feedback steering only.
    Figure 1. Vehicle trajectory with feedback steering only.

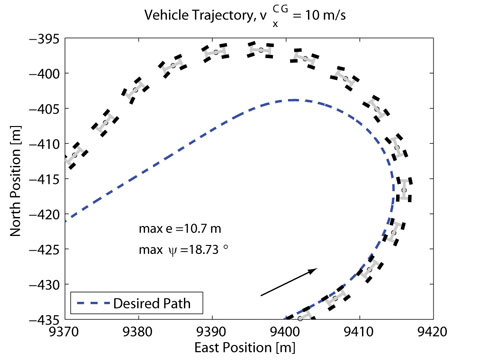
    Although it swings wide of the desired path, P1 remains stable and does not spin out. The ability to maintain control of the car even when there is a misjudgment in the friction conditions is vitally important to both the Pikes Peak climb and future safety systems.

    Demonstrating the robustness of the steering control both analytically and experimentally on P1 gave the team confidence to use it as a central part of Shelley’s control logic.

    Combined Controllers. The current control scheme running on Shelley adds the feedforward steering and both feedforward and feedback speed control elements to the simple steering controller demonstrated in Figure 1.

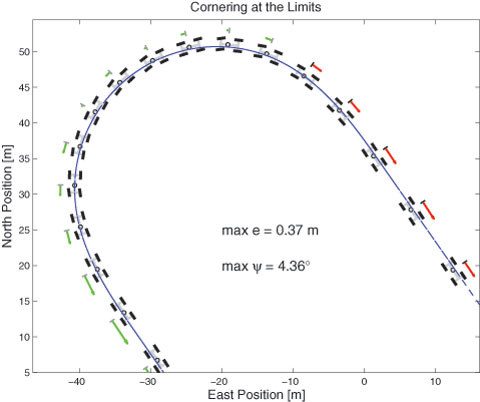
    This combination can track the desired path around the corner quite closely, as shown by the trajectory in Figure 2. This plot shows the performance on a rough dirt track with a friction coefficient again between 0.4 and 0.6 and therefore a maximum possible acceleration of between 4 and 6 meters/second2.

    Figure 2. Latest result of TTS on Santa Clara fairground track; arrows indicate amount of vehicle acceleration (in green) or braking (in red).
    Figure 2. Latest result of TTS on Santa Clara fairground track; arrows indicate amount of vehicle acceleration (in green) or braking (in red).
    Figure 3. g-g diagram plots longitudinal and lateral acceleration, from tests on a different track, with friction on this surface (.65) somewhat higher than discussed in the text (0.4–0.6).
    Figure 3. g-g diagram plots longitudinal and lateral acceleration, from tests on a different track, with friction on this surface (.65) somewhat higher than discussed in the text (0.4–0.6).

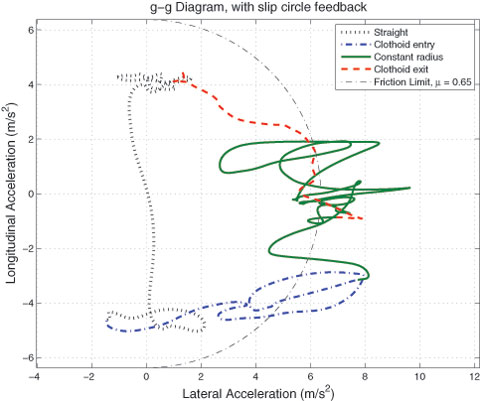
    To demonstrate that Shelley is operating at the limits of friction, a g-g diagram is depicted in Figure 3. These diagrams, which are typically used to evaluate racecar driver performance, plot the longitudinal and lateral acceleration of the vehicle. An expert driver will achieve the maximum possible longitudinal acceleration in braking and the maximum lateral acceleration in cornering.

    In transition between braking and cornering, the best drivers will use all available friction, giving the ideal curve a roughly circular shape. The g-g diagram for this test illustrates that Shelley continually operates at the limits of friction. As a result, the curve bears some resemblance to the behavior of an expert racecar driver. More precise comparisons with expert drivers driving the same course are planned for the future.

     Shelley at rest as crew prepares DGPS base station and checks onboard computer.
    Shelley at rest as crew prepares DGPS base station and checks onboard computer.

    A Rich Legacy

    Shelley follows in the tracks of other Stanford robot cars such Junior, an autonomous Volkswagen Passat. “Junior was a perceptual challenge,” Gerdes recalled. Junior and its predecessor Stanley, under the direction of Stanford professor Sebastian Thrun, were designed to perceive the environments around them, understand signs and recognize the driving situation of nearby vehicles, then logically respond to what they saw. Both competed in the Defense Advanced Research Projects Agency (DARPA) Grand Challenges.

    Stanley and Junior, while possessing a much higher level of autonomy than Shelley and able to handle a range of environments, crept along at speeds well below the average driver’s comfort level, and placed little emphasis on driving dynamics. Shelley is highly focused on the dynamics issue.

    “They’re all autonomous vehicles to some extent, but they have very different scopes, and I guess you could say, very different personalities as well,” Gerdes said.

    “Can we go around turns as fast as possible, brake at the last possible minute, and accelerate out as soon as we’re steering out of a turn?” Gerdes asked. This became the group’s goal for Shelley.

    Rami Hindiyeh had the task of crafting Shelley’s judgment. He writes software designed to mimic a rally car driver’s mind with a series of mathematical analyses that predict how the car should control itself in different situations. He looked at “ways to slide Shelley through turns like a rally car racer would.” Mick Kritayakirana is in charge of the autonomous racing controller to govern Shelley “at the limits, like racecar drivers race on the pavement.”

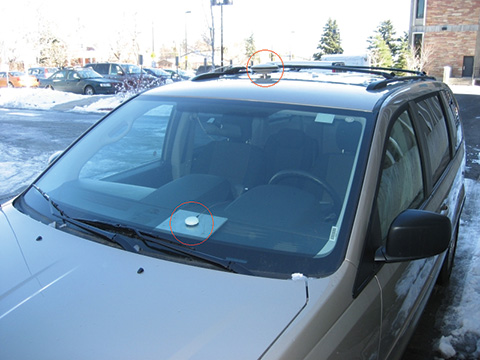
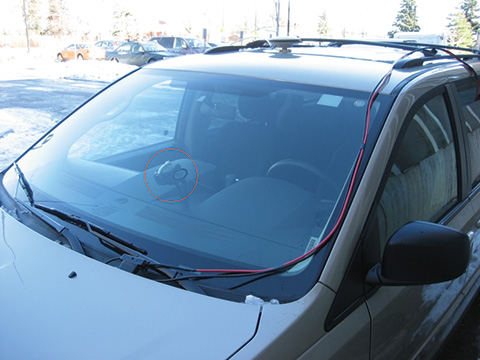
    The Audi TTS’s steering, brakes, gears, and throttle are all controlled electronically, so Shelley required few mechanical modifications to integrate her systems into a controller area network that allows the vehicle’s components to communicate. The network enables the team to individually switch each component from manual to automatic so the team can test its reliability.

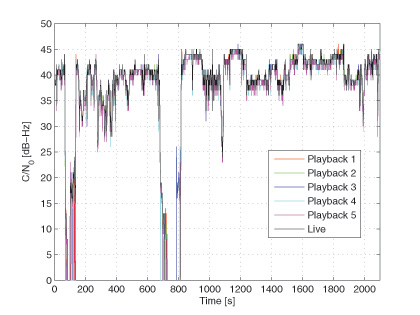
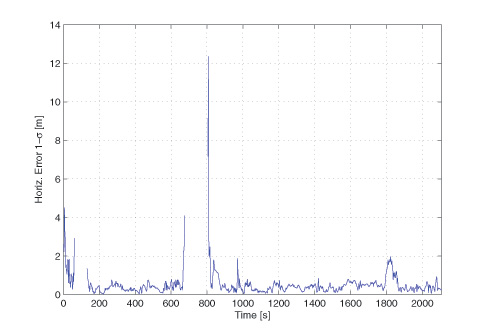
    Shelley’s most critical components are GPS antennas and receivers coupled to an inertial system that determines speed and sideways motion. The INS controls the car’s direction during GPS signal interruptions, giving up to 200Hz updates on car position.

    While the combined effects of Shelley’s systems are complex, the computer in the trunk that processes the data isn’t any faster than one you could buy a decade ago. Most calculations are done separately within the GPS and in the vehicle electronics. “We don’t need a whole lot of computational power to run the driving and racing algorithms,” Gerdes said.

    “We have to spend a lot of time trying to make the car listen to what we command,” Kritayakirana added.

    The Pikes Peak course was plotted on a GPS map for the car to follow, and based on that information and how much friction the computer predicts, it has an idea of how fast it can take turns at different angles and with varying road surfaces. The computer refines its speed and steering with each test turn to figure out what Gerdes calls Shelley’s “braking point.”

    “When a human is driving a car and they see a turn coming up, they can, at a constant rate, so to speak, just try to turn the wheel towards that curve preemptively,” said team member David Hoffert. “And that works because roads are designed with certain mathematical geometric properties that if you do that, [you] follow the path.”

    As the team nears the finish line, members continue to closely collaborate with Volkswagen’s research group. They have weekly meetings “where we talk about our current status and evaluate the hardware and software,” said Marcial Hernandez, senior research engineer at Volkswagen. The team aims to have Shelley back on the mountain in September. “We’d really like to send the car pretty close to its capability, certainly much, much faster than people would be comfortable driving unless they were highly skilled racecar drivers,” Gerdes said.

    Pre-Race Tests

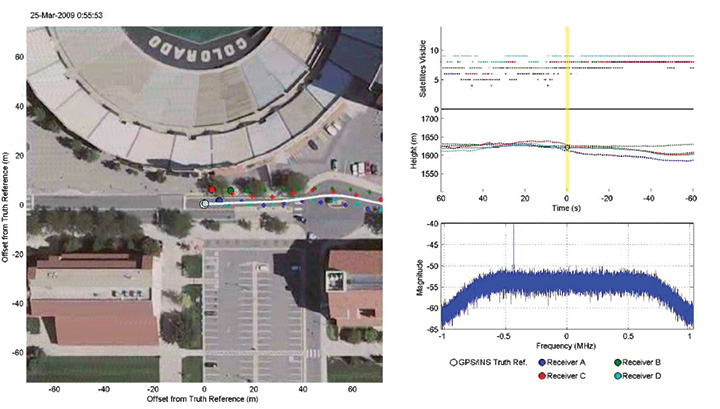
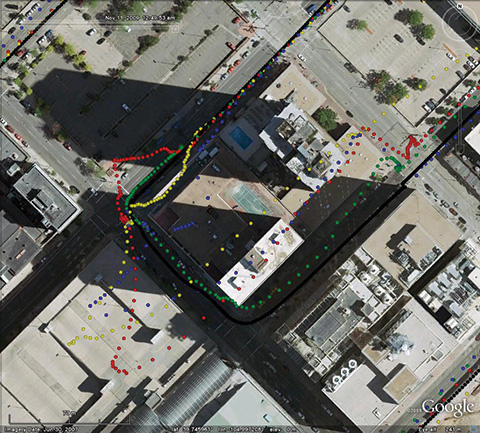
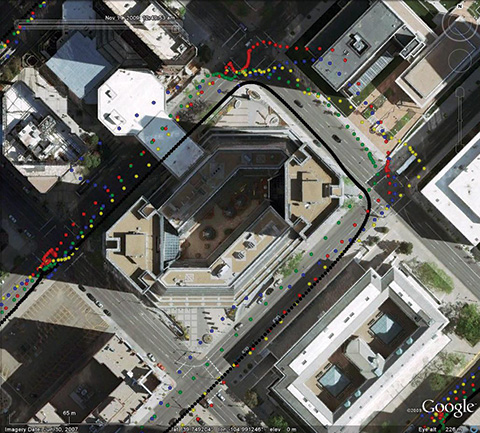
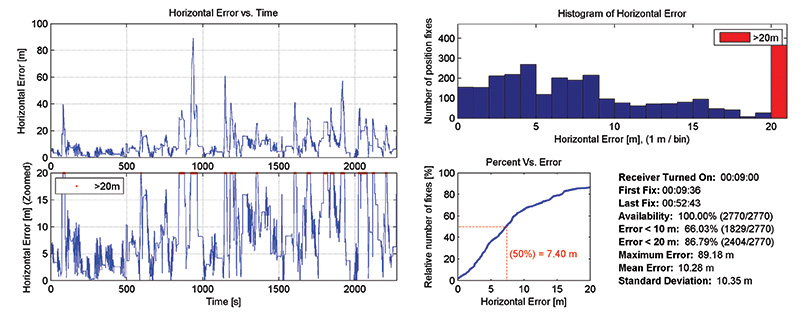
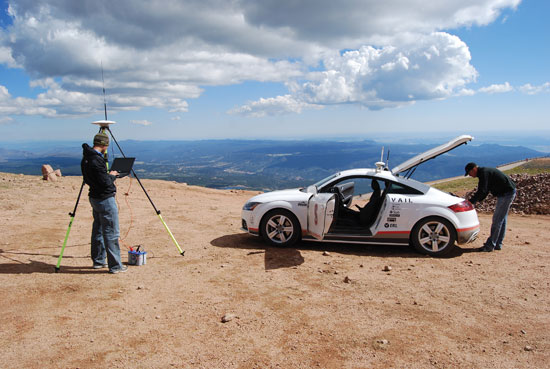
    The team’s trip to Pikes Peak in July enabled the group to experience the International Hill Climb and watch some of the best racers in the world tackle the mountain. Following the hill climb, the project team devoted a couple of days to gathering GPS data on Pikes Peak. This included scouting locations for base stations to broadcast DGPS corrections and determining the availability of corrections at different points along the highway. In addition, the team took measurements of the road boundaries and profiles for developing digital maps of the course.

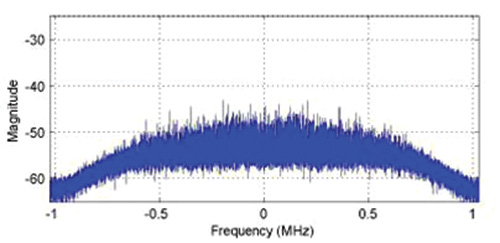
    Line-of-sight issues for the GPS base stations and interference of other voice and DGPS users on the broadcast frequencies used by the team present challenges for racing on the mountain. The group made significant progress on these issues during the June experiments and has scheduled additional GPS testing for July. Travis Wolgram, a test engineer at the Association of American Railroads in Pueblo, Colorado, joined the group to discuss using the High Accuracy National DGPS system in future testing. With a prototype base station now operational at the Federal Railroad Administration’s Transportation Technology Center, 50 miles southeast of Pikes Peak, there is a unique opportunity to harness these corrections for the project.

    Shelley should return to Pikes Peak in September, with the goal of driving the entire course slowly and selected segments at full race speed. With proper analysis of this data during the winter months when snow is on the mountain, the team should be prepared to make a full run at race speed in 2011.

    Manufacturers

    The Autonomous Audi TTS Pikes Peak uses an Applanix POS LV420 GPS and inertial measurement unit, with OmniStar HP service for 10-centimeter or better accuracy, Trimble SPS851 GPS receiver for the base station, two Trimble HPB450 transmitters for RTK signal transmission from the base station, and a Pacific Crest ADL Vantage receiver in the vehicle to receive the RTK corrections.


    Tyler Brown is a Stanford undergraduate. An earlier version of this story appeared in the Stanford Daily; it has been updated and expanded here by the Dynamic Design Lab and GPS World staff.


  • Elbow Room on the Shoulder: DGPS-Based Lane-Keeping Enlists Laser Scanners for Safety and Efficiency

    Elbow Room on the Shoulder: DGPS-Based Lane-Keeping Enlists Laser Scanners for Safety and Efficiency

    A virtual reference station network covering a metropolitan area supplies position corrections to commuter buses equipped with a driver-assist system to enable safe operation, even under harsh weather conditions, along high-volume roadways.

    By Craig Shankwitz

    Bus-only shoulders on major traffic arteries enable a bus to travel on typically unused road right-of-way, bypassing congestion during peak rush hours. As the shoulder is typically only centimeters wider than the bus itself, lane-keeping becomes a key factor, and is accomplished in a pilot Minnesota project using dual-frequency, carrier-phase differential GPS (DGPS) as its primary positioning technology. DGPS provides position estimates accurate to 5–8 centimeters at a rate of 10 Hz, and is used to determine vehicle position and heading. An on-board map database is used to determine the position, orientation, and trajectory of the vehicle relative to the roadway.

    Use of the shoulder as a busway offers several construction and operational advantages:

    • Ease of Implementation. The shoulder exists; there is no need to acquire and develop additional right of way.
    • Low Costs. The cost to strengthen and modify an existing road shoulder is significantly less than constructing a new busway.
    • Routing. Because bus-only shoulders follow existing routes, no changes to bus routes, bus stops, or transit stations are needed to support bus-only shoulder operations.
    • Customer Satisfaction. Transit customers who travel on buses that use a bus-only shoulder perceive a travel-time saving two to three times greater than actually realized. Keeping the bus moving at all times offers a significant psychological advantage.
    • Increased Ridership. A 1997 study of bus-only shoulders in the Twin Cities analyzed more than nine bus-only shoulder routes for two years and found a 9.2-percent increase in ridership along these routes. At the same time, total ridership had decreased by 6.5 percent.

    However, the use of bus-only shoulders imposes additional stress and strain on a driver. The narrow bus-only shoulder leaves a driver very little margin of error. Operating within this small margin is difficult even during the best traffic and weather conditions, and degrades to nearly impossible during heavy traffic and poor weather conditions, which are frequent during Minnesota’s notoriously hard winters.

    During difficult weather and traffic conditions, the use of the bus-only shoulder offers its greatest transit advantage. If a driver is unable to utilize the bus-only shoulder, this advantage is lost. A properly designed and executed driver-assist system (DAS) enables a driver to use the shoulder under all conditions, thereby increasing schedule adherence and, as a result, rider satisfaction.

    Under the U.S. Department of Transportation’s Urban Partnership Agreement, the University of Minnesota’s Intelligent Vehicles Lab (IV Lab) and HumanFIRST program, the Minnesota Valley Transit Authority (MVTA), and Schmitty and Sons Transportation will soon deploy DAS on 10 Gillig low-floor transit buses. These buses will provide express service between Apple Valley and downtown Minneapolis, a 22-mile, one-way trip.

    Driver-Assist History

    The IV Lab has developed and deployed DGPS-based DAS since 1995. The first deployment on public roads occurred in 2001, as part of the DOT’s Intelligent Vehicle Initiative Generation Zero Field Operational Test. The DGPS-based lane-keeping assistance was integrated with forward-looking radar for collision avoidance, enabling safe vehicle operation in zero-visibility conditions.

    Two separate deployments took place in Alaska. The first occurred in 2003 with a snowplow and a snowblower which clear the Thompson Pass on the Richardson Highway. These vehicles are still in use. Because of this success, the State of Alaska installed the DAS in two more vehicles at Deadhorse Airport.

    During the summer of 2010, the two original Thompson Pass systems will be upgraded with new computational hardware, and three new systems will be installed on three new highway maintenance vehicles. The value of the driver-assist system has been proven, and those who use it have grown to rely on its all-weather capabilities. It has functioned reliably for seven years in extremely harsh conditions.

    ÅDAS-EQUIPPEDSNOWPLOWclearingThompsonPass,Alaska.
    DAS-EQUIPPED SNOWPLOW clearing Thompson Pass, Alaska.

    Driver-Assist for Transit

    The DAS provides two primary capabilities for transit applications: lane-keeping and collision awareness. The system provides assistance only; a driver is always responsible for control of the vehicle. Figure 1 shows the components comprising the DAS.

    Figure 1. Complete driver assist system component schematic, showing both infrastructure-based and vehicle-based components.
    Figure 1. Complete driver assist system component schematic, showing both infrastructure-based and vehicle-based components.

    DGPS-Based Lane-Keeping. The primary positioning sensor used aboard the buses is a dual-frequency, carrier-phase GNSS receiver, providing centimeter-accurate position measurements at 10 Hz. With the exception of the DGPS augmentation system described later, all other DAS system processes are synchronized with the arrival of DGPS position updates.

    Realtime CMR+ DGPS corrections are provided over the 3G cellular network from the IV Lab VRS network. The IV Lab VRS network is based on six receivers located around the perimeter of the Twin Cities Metro area. These six receivers are connected via landlines to a server system located in the IV Lab at the University of Minnesota, running GPSnet and RTKnet applications. To ensure GPS correction reliability, an integrity manager software issues alerts for both short-term and long-term aberrations in the data provided by the six base stations. This ensures accurate corrections are sent to the buses using the narrow shoulders.

    The onboard receiver also plays a crucial role in accurately estimating vehicle body heading. In rural applications where GPS augmentation is unnecessary, GPS velocity heading estimates provided directly from a GPS receiver serve as a sufficiently accurate body-heading estimate. However, in GPS-denied environments where an augmentation system is needed to provide accurate position and heading estimates when GPS is lost, velocity heading from an onboard receiver is an insufficiently accurate estimate of vehicle heading. To support such navigation, the IV Lab developed a technique, described later, by which body heading can be estimated with errors less than 0.1 degree.

    IV Lab mapping rig installed in a pickup truck: three dual-frequency, carrier-phase DGPS receivers; two laser scanners, one measuring retroreflectivity, the other road crown and rutting; and forward and sideview cameras, to help analyze anomalous data.
    IV Lab mapping rig installed in a pickup truck: three dual-frequency, carrier-phase DGPS receivers; two laser scanners, one measuring retroreflectivity, the other road crown and rutting; and forward and sideview cameras, to help analyze anomalous data.

    Map Databases

    Lane-keeping uses DGPS with an onboard map database describing the location and type of lane boundaries and other relevant roadway elements to an accuracy of approximately 10 centimeters. These map databases can be constructed in one of three ways:

    • from sufficiently accurate photogrammetric data,
    • by driving centerlines and using known road-construction standards to d
      etermine the location of lane boundaries and other relevant elements relative to the lane centerline, or
    • by using a combination of laser scanners, DGPS receivers, and cameras to determine the global location of the reflective markings that bound lanes and shoulders.

    Lane-keeping information is continuously provided to the driver; lane-departure alerts and warnings use a comparison of vehicle speed and heading to the map database to determine when alerts and warnings should be issued.

    The alerts and warnings are provided via a multi-modal human-machine interface (HMI), illustrated in Figure 2, through three modes:

    • graphically, through a head-up display (HUD) that gives a virtual view out the windshield when environmental conditions limit visibility;
    • haptically, through a torque-actuated steering wheel giving a restorative torque on the steering wheel in the event of lane drift; and
    • tactically, through a seat equipped with actuators that vibrate on the side of the seat to which the lane is being departed.
    Figure 2. Multi-modal driver interfaces. Left: Graphical, haptic, and tactile feedback modes provided to the driver. Upper right: View through the head-up display. Graphical lane departure alert indicated by left shoulder boundary colored red, collision awareness alert (white rectangles), and collision awareness warning (red rectangle). Lower right: Forward, left, and right side collision awareness information presented on the display on the left “A” pillar.
    Figure 2. Multi-modal driver interfaces. Left: Graphical, haptic, and tactile feedback modes provided to the driver. Upper right: View through the head-up display. Graphical lane departure alert indicated by left shoulder boundary colored red, collision awareness alert (white rectangles), and collision awareness warning (red rectangle). Lower right: Forward, left, and right side collision awareness information presented on the display on the left “A” pillar.

    Lane-departure warnings come in stages. As the vehicle-trajectory estimator determines that the likelihood of a lane departure is sufficiently high, a lane-departure warning is issued to the driver through the HUD: a change in lane boundary color from white or yellow to red. Should the driver contact the lane boundary, a seat-based warning is activated; the side of the seat corresponding to the direction of lane departure vibrates, warning the driver. If the driver fails to respond to these two stimuli and continues past the lane boundary, the steering motor torque is applied. This multi-stage approach captures the drivers’ attention, but if they respond in a timely fashion, their annoyance is limited.

    The torque applied by the steering servo motor is limited, and cannot deliver sufficient control action to autonomously steer the vehicle. This is by design; the driver is responsible for operating the bus. The level of torque applied to the steering wheel is analogous to an automotive front-end misalignment; it is sufficient to capture the drivers’ attention, but not to steer a bus off the road.

    Forward-Collision Awareness. Sensing for forward-collision assistance is provided by a front bumper-mounted multi-plane scanning LIDAR sensor. Forward-collision alert and warning information is provided in two stages to the driver through the HUD. As now configured, if the obstacle detected is in the present shoulder of travel, the obstacle is represented as a red, open rectangle, with red indicating a warning status. If an object is located in an adjacent lane, the obstacle is represented as a white, open rectangle, with white indicating an alert status.

    Obstacle-detection processing is enhanced by the presence of the onboard map database used for lane-keeping. Obstacle target information provided by the LIDAR sensor includes range, range rate, and azimuth angle to the target. The bus position and heading is provided by either DGPS or the DGPS augmentation system. Through a coordinate transformation, LIDAR information in the vehicle coordinate frame is transferred to the global coordinate frame. This allows the LIDAR target to be placed on the map database; if the target is in the vehicle lane of travel, it can be considered a threat, but if the LIDAR target is not in the same lane as the bus, then at that time the target is not a threat to the driver.

    Side-Collision Awareness. Side collision awareness is enhanced by multi-plane LIDAR scanners mounted on on the front bumpers on both the left and right sides of the bus, and connected to a pneumatic actuator.

    Side-collision awareness information is provided to the driver via an LCD panel mounted on the left front A-Pillar (see Figure 2). This display is touch-sensitive, and can be used by the driver to log in (only certified, trained drivers can operate the system) to select feedback modalities (choose any or all of the available feedback modes) and to check system status.

    SIDE-MOUNTED LASER SCANNER used for both side-collision awareness and DGPS augmentation. When extended (left), the LIDAR scans 100 degrees of the horizontal plane. One boundary of the scanned plane points behind and runs alongside the bus; the other boundary points forward of the bus by approximately 10 degrees. When retracted (right), the LIDAR points in the direction of the ground, and can be used for curb-following when DGPS is unavailable.
    SIDE-MOUNTED LASER SCANNER used for both side-collision awareness and DGPS augmentation. When extended, the LIDAR scans 100 degrees of the horizontal plane. One boundary of the scanned plane points behind and runs alongside the bus; the other boundary points forward of the bus by approximately 10 degrees.
    Figure_6B
    SIDE-MOUNTED LASER SCANNER used for both side-collision awareness and DGPS augmentation. When retracted (right), the LIDAR points in the direction of the ground, and can be used for curb-following when DGPS is unavailable.

    Suburban and Urban

    Although the rural implementation of the DAS operates in extremely harsh weather conditions, these implementations are technically less problematic than suburban and urban implementations. In rural applications such as the snowplows, DAS-equipped vehicles typically operate with a single occupant in a small geographic area, travel on relatively low traffic-volume roads, and enjoy a clear view of the sky. Suburban and urban applications carry passengers, operate across a wider geographic area, travel on high-volume roads, and suffer from periods where view of GPS satellites is either partially or completely blocked.

    These operational differences require substantial changes to the DAS subsystems for urban/suburban use.

    DGPS Base Stations. In rural areas, DAS-equipped vehicles typically operate over a relatively small geographic area; a single GPS base station will provide adequate coverage as the maximum baseline between rover and the base station remains less than 25 miles. Suburban applications cover a much wider area, and a network of DGPS correction stations is needed to keep baselines low.

    For the UPA project, the IV Lab operates a six-station virtual reference station (VRS) network. This network covers the greater Twin Cities Metropolitan area, and supplies compact measurement record (CMR) corrections to each DAS-equipped bus. Satellite observables are sent from each base station receiver to both the VRS server at the IV Lab and to a VRS server at the Minnesota Department of Transportation.

    Broadcast of DGPS Corrections. In rural areas, the DAS system has served to keep roads passable in inclement weather conditions. This has been viewed as a safety application, and as such either UHF or VHF channels in the public safety bands have been used to broadcast DGPS corrections. In urban areas, no single UHF or VHF frequency is available to cover an entire metropolitan area. Therefore 3G cellular data communications are used to provide DGPS corrections to DAS-equipped vehicles.

    Use of 3G cellular data communications brings the transit customer an added benefit: free Wi-Fi. The provision of DGPS corrections, using the CMR+ correction format, requires approximately 10 Kbit/second. This bandwidth is assigned high priority by the onboard router. The remaining 700 Kbit/s of 3G bandwidth is made available, at a lower priority, to bus passengers. On an express route service, passengers can e-mail and surf the web on their daily commute, making productive use of
    time that might otherwise be lost.

    The VRS server provides a unique correction to each DAS-equipped bus. Communication between the bus and the VRS server is initiated by the bus when it sends its coarse (uncorrected) position to the server. The server replies with a correction optimized for that coarse location. Corrections are sent at one-second intervals. Every two minutes, the bus sends its current position, and the VRS server responds with corrections optimized for that new location. With this scheme, the baseline between the VRS and the roving bus is never more than two miles. The two-mile limit maintains position accuracy without consuming excessive wireless or computational bandwidth.

    DGPS Redundancy. In rural applications, the view of the sky is generally unobstructed, and FCC licenses provide adequate effective radiated power from the DGPS base stations. This assurance of access to both satellite and corrections signals generally suffices to support uninterrupted vehicle positioning. Both base-station and onboard GPS hardware have proven to be robust and reliable. With these local operating conditions, public agencies have found no need to augment DGPS for rural applications.

    Suburban and urban applications, however, require an augmentation system to support DAS operation when DGPS is unavailable due to outages caused by overpasses, overhead road signs, tree canopies, and so on. Passenger safety and the need to provide reliable schedule adherence require that positioning be provided even when DGPS is unavailable, by a vehicle-based DGPS augmentation system.

    Vehicle-Based Augmentation

    The vehicle-based augmentation system (VBAS) uses direct measurements of ground velocity, a measure of vehicle yaw rate, and an accurate estimate of the vehicle position and heading at the time DGPS is lost to estimate vehicle position and heading for the duration of signal loss.

    A commercial off-the-shelf sensor designed for measuring vehicle and/or tire slip measures vehicle 2D velocity. Yaw rate can be measured either with an inertial rotational rate sensor or a second 2D velocity sensor. Yaw rate measured using a pair of these 2D sensors eliminates the rate bias and rate bias drift associated with inertial sensors. Figure 3 shows both configurations.

    FIGURE 3 Two approaches to VBAS to mitigate DGPS outages. The diagram on left shows implementation with two 2D velocity sensors to determine vehicle yaw rate. Computationally, this is attractive as senor drift need not be considered. The diagram on the right shows an implementation with one yaw rate sensor, and one 2D velocity sensor. This is the configuration operating for the UPA; it requires yaw rate sensor drift compensation to provide accurate measures of vehicle yaw rate.
    FIGURE 3 Two approaches to VBAS to mitigate DGPS outages. The diagram on left shows implementation with two 2D velocity sensors to determine vehicle yaw rate. Computationally, this is attractive as senor drift need not be considered. The diagram on the right shows an implementation with one yaw rate sensor, and one 2D velocity sensor. This is the configuration operating for the UPA; it requires yaw rate sensor drift compensation to provide accurate measures of vehicle yaw rate.

    An accurate measure of vehicle heading at the time GPS positioning is lost is critical to the augmentation process. A performance goal of 20 centimeters tolerable error at the end of a 15-second outage for a vehicle traveling at 25 miles per hour (11.2 meters/second) requires a heading estimation error of no more than 0.07 degrees (that assumes the only source of error is attributable to the heading).

    GPS outages (time from loss of position to reacquisition) attributed to passing under overpasses range from 7 seconds (single bridge) to 9 seconds (double bridge). The IV Lab augmentation system reliably provides sufficiently accurate position and heading estimates to carry through these outages. At the present level of performance, should an outage last more than 15 seconds, the accuracy of the augmentation system cannot be guaranteed. In this event, the driver is alerted, and the DAS is deactivated until a DGPS position fix is reacquired. Fortunately, since new receiver firmware was installed, no instances of an outage exceeding 15 seconds have occurred during two months of test, evaluation, and driver training.

    Figure 4 illustrates the accuracy of the VBAS system. At the time the fix solution is reacquired on the exit ramp, the lateral error between the fix solution and the position estimated by the VBAS is approximately 10 centimeters. This accuracy is sufficient to allow a driver to travel on the entrance ramp even during zero-visibility conditions.

    Figure 4. Example of VBAS as a bus operates on the Cedar Avenue/Old Shakopee Road overpass. Bus trajectory is northbound on Cedar, exiting westbound Old Shakopee Road, then entering southbound Cedar Avenue from Old Shakopee Road. Upper left shows northbound trajectory and loss of satellite lock. Upper right shows reacquisition of DGPS, float, and fix states of the DGPS receiver. Lower right shows accuracy of VBAS system compared to DGPS when DGPS reacquires fix. Lateral error of VBAS at at the time the fix is reacquired is approximately 10 centimeters. Lower left shows satellite view of the interchange.
    Figure 4. Example of VBAS as a bus operates on the Cedar Avenue/Old Shakopee Road overpass. Bus trajectory is northbound on Cedar, exiting westbound Old Shakopee Road, then entering southbound Cedar Avenue from Old Shakopee Road. Upper left shows northbound trajectory and loss of satellite lock. Upper right shows reacquisition of DGPS, float, and fix states of the DGPS receiver. Lower right shows accuracy of VBAS system compared to DGPS when DGPS reacquires fix. Lateral error of VBAS at at the time the fix is reacquired is approximately 10 centimeters. Lower left shows satellite view of the interchange.

    Driver Training

    Bus-only shoulder operation has proven itself safe and, in fact, safer than normal transit operations, according to recent data. The goal of driver training is to prepare drivers to use the DAS system to enable them to safely use the bus-only shoulders in conditions under which they normally would not.

    A rigorous training protocol developed in cooperation with the University of Minnesota HumanFIRST program, Schmitty and Sons Transportation driving instructors, and MVTA involves both simulator-based and on-road training.

    Simulator-Based Training

    Beefore using driver assist systems, bus drivers are continually taught that the driver controls the bus and is responsible for both the passengers and vehicle. Drivers take this responsibility seriously, and as such, develop skills and techniques that guarantee safe passage under all conditions, even when running on narrow, bus-only shoulders.

    To best prepare drivers for using the DAS under difficult conditions, a high-fidelity driving simulator was commissioned. A DAS was installed in the simulator, and an interface to the simulator was created. In this context, a driver has the ability to train in normal and abnormal (low to zero visibility) conditions before beginning on-road DAS training and use.

    In the simulator, the driver learns that the system only provides assistance; responsibility for the safety of the bus and passengers still resides with the driver. Experience with Alaskan snowplow operations, where formal training is limited to a few on-road test drives, has shown that a driver may take a few winter seasons to fully accept the system. This delayed acceptance is in part attributable to the fact that for six months per year a driver has no opportunity to train with the system. Acceptance gained over one winter season is lost during the summer.

    The simulator installed at an MVTA bus garage uses a seat-based motion platform to achieve realistic vehicle dynamics. The DAS installed in the simulator allows a driver to train in all weather and traffic conditions on a geospecific roadway before transitioning to a DAS-equipped bus. Geospecificity is achieved through the creation of virtual worlds based on roadway data collected by the mapping vehicle shown earlier.

    Bus-driving simulator at the MVTA bus garage in Burnsville, Minnesota.
    Bus-driving simulator at the MVTA bus garage in Burnsville, Minnesota.
    Bus-driving simulator at the MVTA bus garage in Burnsville, Minnesota.
    Bus-driving simulator at the MVTA bus garage in Burnsville, Minnesota.
    Bus-driving simulator at the MVTA bus garage in Burnsville, Minnesota.
    Bus-driving simulator at the MVTA bus garage in Burnsville, Minnesota.
    Bus-driving simulator at the MVTA bus garage in Burnsville, Minnesota.
    Bus-driving simulator at the MVTA bus garage in Burnsville, Minnesota.

    On-Road Training

    After a driver both demonstrates an
    d acknowledges comfort and competence with the DAS in the simulator, training transitions to the actual route on which the buses will operate. Each of the 10 buses is equipped with a six-camera data-acquisition system. The six cameras capture not only the driver’s actions (hands, face, feet), but also views of the road (front, left, and right sides.)

    Drivers travel with an instructor. The onboard data acquisition system can be used to reconstruct particular scenarios as a means to offer advice as to how the driver and system can better interact in difficult driving and traffic conditions.

    On-road training benefits system developers as well. Training offers a driver an opportunity to test the system in real-time on an actual road. The perspective a driver brings is generally different than that of the developer, and the insights the end user provides typically produce a better system. As an example, driver experience with the system during the initial training period produced the staged approach to lane-departure alerts previously described.

    Conclusion

    The IV Lab, MVTA, and Schmitty and Sons Transportation will soon release 10 DAS-equipped buses into revenue service to support narrow bus-only shoulder service between downtown Minneapolis and Apple Valley, Minnesota. Although the IV Lab has deployed a number of DAS-equipped vehicles, this UPA deployment represents the first time that the system has been used to transport passengers. This deployment should prove that although DGPS systems are susceptible to periodic outages, a properly designed and executed augmentation system will provide a sufficiently robust system that will be accepted by both drivers and passengers. It will also demonstrate to other transit agencies that even narrow rights of way offer significant transit advantages at low cost, and that potential operational difficulties can be overcome through the use of DAS technologies.

    Manufacturers

    The buses carry Trimble R7 receivers and Ibeo Lux multi-plane scanning LIDAR sensors. The IV Lab VRS network is based on six Trimble NetR5 receivers. The server runs Trimble’s GPSnet and RTKnet applications, with the Trimble Integrity Manager.


    Craig Shankwitz is the director of the Intelligent Vehicles Laboratory at the University of Minnesota.

  • On the Edge: Got a Fast Car

    A team will attempt to shatter the world land speed record, with a GPS/GLONASS receiver riding the controls.

    FastCar
    photo: GPS/GLONASS

    In summer 2010, a team of 44 volunteers will attempt to shatter the world land speed record of 763 miles per hour (2 mph faster than sound) by hitting 800 on the speedometer. To 
ensure that the North American Eagle takes it to the limit efficiently and safely, the team captures performance data from 70 sensors, locked to position, 
velocity, and time coordinates  by an onboard GNSS receiver.

    An old Lockheed F-104, a ’60s era Mach II fighter, rescued from a scrap dealer in Maine seemed to have the mark of greatness somehow still on it, amid the fuselage holes and grafitti. A team of volunteers converted the plane into a supersonic car: one expert machined the solid billet aluminum wheels, another rebuilt the General Electric J-79 engine, another devised a magnetic braking system. Over three years, the team replaced 40 percent of the plane’s skin panels, 5,000 rivets, the front suspension, and the steering and hydraulics systems.

    The 56-feet-long, 13,000-pound car features Magna Force Lev-X magnetic brakes, a stock engine that outputs 42,500 horsepower, burning 160 gallons of fuel per minute in afterburner mode, and a backup 52,000-hp engine.

    At supersonic speeds, anticipating and controlling the car’s reactions to physical stresses become critical. explains Steve Wallace, data-acquisition engineer: “Stuff happens when you get up to the speed of sound. Shock waves affect the aerodynamic balance of the vehicle, and when you’re flying six inches from the ground, aerodynamic unbalance becomes very important.” Wallace and the team must ensure that the car does not burrow into the ground or lift any of its wheels while in motion; either would be detrimental to record-setting and driver safety.

    Accelerometers, strain gauges, piezoelectric sensors, inertial gyros, airspeed and air-pressure sensors, and more all generate streams of data, stored on a laptop computer mounted behind the car’s cockpit. Wallace accesses the system in real time via an Ethernet wireless umbrella of routers mounted on 20-foot-tall towers spaced at 2½-mile intervals alongside a 14-mile track at Black Rock Desert, Nevada. After a test run, he downloads the data to his computer, correlates time and location, then exports to a spreadsheet.

    GNSS makes speed measurement more reliable and accurate. “We have a lot of sensors, but one sensor I don’t have is for vehicle speed,” he says. “This is a thrust vehicle; the wheels aren’t driven, so realistically, the wheels are never going as fast as the ground. Measuring airspeed is not a bad way of [measuring vehicle speed], but it’s very noisy. The data are all over the place and you have to do a lot of smoothing and averaging. With GNSS, it’s dead nuts — a great way of getting information I need, fast, without looking at accelerometer data. I can’t think of a more valuable tool to understand what’s happening from a sense of motion of the vehicle in general.

    “If we had a $10 million budget, we could buy a ground-tracking radar unit like the Air Force uses, but that ain’t gonna happen. We can get just as good data with this as with a $10 million system, so why go any further?”

    The project could provide further practical engineering benefits. The team likens this research to that of the 1960s space program, which benefited development of computers, cellular phones, and microwave ovens.

    Manufacturers

    A dual-frequency Topcon PG-A1 antenna and Euro 160T OEM receiver collect GPS/GLONASS signals at 20 Hz. A Euro 160T mobile control board rides in the car’s electronics bay. A GB-1000 receiver collects static reference data.

  • GNSS Receiver Evaluation

    Record-and-Playback Test Methods

    This article addresses how best to quantify “which navigation system performs best” in a realistic testing scenario. The methodology focuses on land vehicles navigating in urban environments, but applies equally well to pedestrian navigation and can be adapted for testing assisted-GNSS implementations. During a drive test, the truth-reference system and RF recording system log samples to disk, with no need for the receivers under test to be included during the actual drive. 

    By Eric Vinande, Brian Weinstein, Tianxing Chu, and Dennis Akos, University of Colorado, Boulder

    FIGURE 1. Traditional in-vehicle receiver testing.
    FIGURE 1. Traditional in-vehicle receiver testing.

    Radio frequency record-and-playback systems (RPS) have recently become commercially available. These systems sample the RF environment and store it to disk during a drive test and can replay it through receivers back in the lab environment. Here we explore the improvements in dynamic testing methodology created by these units.

    RPS test system installation.
    RPS test system installation.

    RPS constitute a stark contrast to more traditional signal simulators that use pre-defined trajectories and mathematical models to determine appropriate RF output. Signal simulators attempt to reproduce environmental error factors such as multipath, inertial aiding system errors, and building and vehicle obstructions. They rely on mathematical models to simulate these various error sources. In some cases they do a reasonable job of reproducing these errors, but the dynamic urban environment is so complex (for example, rapidly varying/fading signal strength(s), multiple multipath signals, short/long duration obstructions of multiple layers) that even a sophisticated mathematical model can not replicate all effects completely. Some simulators include software that enables the user to define a trajectory and a limited amount of urban scenario details. Again, only so much realism can be created in a simulation environment. Existing testing standards are simulator-based, and as such, are circumscribed by the signal simulator limitations in representing a dynamic environment.

    Positioning performance of a satellite navigation receiver under test (RUT) is coupled with its RF front-end system and local oscillator quality. Because of the variation in RF components between RUTs, some likely have superior RF interference (RFI) immunity. RFI can be a serious issue in certain land vehicles due to on-board electrical systems or because of external interference sources.

    This article describes a testing method applicable to all receiver types, and complementary to that described in the December 2009 GPS World article by Mitelman and colleagues, “Testing Software Receivers,” regarding validation testing within a production environment. Added elements include taking into account truth-system uncertainty and a repeatability verification of the RF playback process through non-deterministic hardware receivers.

    We present here the dynamic testing approach currently used at the University of Colorado in Boulder for receiver evaluation and comparison in the urban environment. The approach also includes the ability to assess the effect of sensor augmentations (for example, inertial, environmental) on positioning performance.

    Truth Reference. Comparison with a truth reference system is essential for evaluation of satellite navigation receivers. For dynamic testing, this typically includes a survey-grade receiver coupled with a tactical-grade (or better) inertial measurement unit (IMU) and associated carrier-phase differential post-processing software. This software is filter-based and provides a positioning-error estimate in various components. Truth reference systems provide a continuous position estimate whose quality can vary depending on factors experienced in the urban environment, including length of full/partial satellite signal outage. In this study, we subtracted the 99th-percentile horizontal positioning error estimate of the truth system from the nominal RUT positioning error at each reporting epoch, as shown in Figure 2.

    If the RUT position happens to lie within the truth-system position uncertainty, it is not considered to have any position error.

    We focus here on a method to evaluate and compare mass-market, consumer-grade receivers to survey-grade receivers. One difference between these two receiver types is the way they handle the trade-off between accuracy and availability. Consumer receivers strive to provide the user with the highest availability, whereas survey receivers’ goal is to maximize accuracy. As a result, consumer-grade receivers will produce more regular position updates in harsh signal-tracking conditions, but must sacrifice accuracy to do so.

    FIGURE 2. RUT position error calculation
    FIGURE 2. RUT position error calculation

    Current Testing Standards

    Currently accepted A-GPS standards such as those used by the 3rd Generation Partnership Project (3GPP) provide very limited dynamic testing in simulated urban conditions, being mainly designed to evaluate the first position calculation achieved in a particular simulated scenario. High-sensitivity receivers that pass or greatly exceed the 3GPP tests, in our opinion, are not guaranteed to have superior navigation performance in urban areas. Also, local oscillator performance is not specified. The trajectory dynamics imposed can actually be much smaller than the clock dynamics of a very low-cost local oscillator. A GPS receiver cannot tell the difference between the two and must track the effective Doppler variation.

    The 3GPP defines five independent tests for A-GPS receiver certification. They include tests in the areas of: sensitivity with coarse/fine time assistance, nominal accuracy, dynamic range, multipath performance, and moving scenario/periodic update performance. The last three tests include elements that ostensibly pertain to the urban environment. These tests specify discrete, constant signal power levels for implementation in a hardware signal simulator. The discrepancy between the 3GPP-prescribed signal levels and those observed during actual drive testing is detailed as follows.

    The 3GPP moving scenario/periodic update performance test trajectory is shown in Figure 3.

    FIGURE 3. 3GPP dynamic testing trajectory (van Diggelen, A-GPS: Assisted GPS, GNSS, and SBAS, Artech House)
    FIGURE 3. 3GPP dynamic testing
    trajectory (van Diggelen, A-GPS: Assisted
    GPS, GNSS, and SBAS, Artech House)

    This test profile calls for the simulation of five satellites with a constant signal strength of 2130 dBm while the vehicle travels around the racetrack trajectory. In contrast, during an actual drive test in an urban area, a receiver reported the distribution of carrier-to-noise-density values for all tracked satellites as shown in Figure 4. This more accurately shows the range of signal strengths that should be expected in urban conditions.

    FIGURE 4. Drive-test C/N0 distribution
    FIGURE 4. Drive-test C/N0 distribution

    The 3GPP moving test is considered passed if positions are reported regularly, and 95 percent of them are within 100 meters of the true position. This is not a particularly difficult test for a RUT to retain signal lock through, as the linear acceleration is about 0.15 g and the centripetal acceleration is about 0.25 g.

    It is difficult for independent third parties to carry out a receiver evaluation following 3GPP guidelines as several of the tests require receiver restarts, which in turn requires testing automation. Depending on the receiver-evaluation hardware availability, restart commands may not be available to to an independent evaluator.

    3GPP receiver testing results are quoted as pass or fail over a large number of short evaluations. For the dynamic environment, the system performance over continuous time is required to make a proper comparison between evaluated receivers.

    In general, evaluating the GPS engines embedded within cell phones or other devices is difficult. Most are not made to interface with an external antenna, and the mere act of adding an antenna connection can significantly alter performance. The output format is not always documented, if it is even available to an end user. To allow fair across-the-board comparisons, GPS chipset manufacturers should make available development kits that have external antenna connections and well-documented message output formats.

    Drive-Test Configuration

    Current live dynamic testing requires multiple systems to be operating in a moving vehicle (see opening Figure 1). A truth-reference system, usually a high-grade GPS/INS device along with post-processing, provides the basis to which all other RUT are compared. This system requires a dedicated vehicle rooftop antenna with the best possible sky view, separate from a lower-grade test antenna located within the vehicle. Each RUT is connected to the representative consumer-grade antenna located in the vehicle through a high-isolation splitter that suppresses inter-receiver interference. It is important at this point that the gain be set appropriately for each RUT, depending on the front-end expectations while maintaining an equivalent noise figure across all receivers.

    Visualization Methods

    In addition to quantitative methods, we have created a qualitative visualization to assist with interpretation of the raw data. The same parsed data sets that provide the statistical script input are fed into a viewer script along with the post-processed truth reference data. With the truth-reference system data plotted in the center of the screen, each RUT is then plotted the correct distance and direction away, based on the distance and direction of error compared to truth. The receiver plots are overlaid onto Google Earth images centered on the truth-reference location. Plots of number of satellites utilized (top right of Figure 5) and elevation (middle right) as reported by each receiver and the sampled RF spectrum (lower right) are also included.

    For each reporting epoch, based on the data frequency of the truth-reference system, a frame is generated with the aforementioned characteristics. These frames are gathered and encoded into a movie clip which can then be used as a quick and simple qualitative tool for receiver comparison. Figure 5 shows an individual movie frame. A forward-looking camera capability is also being added to this movie so the test environment can be documented from multiple angles.

    FIGURE 5. Movie visualization screenshot
    FIGURE 5. Movie visualization screenshot

    While observing this movie, variations in the sampled RF spectrum from interference or blockages can be associated with the current landscape. Locations of RFI sources can be identified and avoided (or included) in future testing. These RFI and significant blockage locations are of interest for receiver RF component and navigation filter development. The next three figures show spectrum snapshots during various parts of a drive test. In Figure 6, the cumulative GPS spectra rises above the noise floor and is visible during open sky conditions. While below ground level, Figure 7 shows only the front-end filter shape (and relatively minor RFI). Figure 8 shows an example of severe RFI when near a specific parking garage location.

    FIGURE 6. Open-sky spectrum (centered on 1575.42 MHz)
    FIGURE 6. Open-sky spectrum (centered
    on 1575.42 MHz)
    FIGURE 7. Spectrum while below ground level (centered on 1575.42 MHz).
    FIGURE 7. Spectrum while below ground
    level (centered on 1575.42 MHz).

    FIGURE 8. Spectrum near interference source (centered on 1575.42 MHz).
    FIGURE 8. Spectrum near interference
    source (centered on 1575.42 MHz).

    Record/Playback Concept

    To overcome the limitations of hardware signal simulators and repeated vehicle drive testing, the RF record/playback testing method is utilized at the university. Commercially available equipment, capable of recording and playing back an RF signal, has recently become available. Equipment options exist for between $10,000–100,000, with 1–16 bit sampling and 4–25 MHz front-end bandwidth.

    Figures 9 and 10 show the concept of “record once, playback many times.” During a drive test, the truth-reference system and RF recording system log samples to disk. There is no need for the RUT to be included during the actual drive test.

    FIGURE 9. Recording mode block diagram.
    FIGURE 9. Recording mode block diagram.
    FIGURE 10. Playback mode block diagram
    FIGURE 10. Playback
    mode block diagram

    In the laboratory, the logged RF samples are replayed through a splitter to all RUT. The effect of receiver configuration changes can be evaluated without having to repeat the drive test. At a later time, additional receivers can also be tested using the same stored RF sample file.

    During separate record and playback phases, testing considerations and methods discussed previously are implemented.

    Since the recording process can only obviously capture current conditions, additional drive-test collections are required if different satellite geometry is desired, or if additional representative antennas need to be evaluated.

    Repeatability of RPS Testing

    To validate that the playback signal levels were not significantly different from live signals, we conducted an urban, dynamic evaluation. Figure 11 shows that there is typically not more than a 1 dB difference in reported C/N0 between live and playback modes when testing a receiver that only reported integer values. The two dropout instances were excursions into parking garages.

    FIGURE 11. Live and playback C/N0 values
    FIGURE 11. Live and playback C/N0 values

    Figure 12 compares the navigation statistics between replays, using the same five playbacks as in Figure 11. The playbacks show a 1-sigma horizontal position solution spread under 1 meter for approximately 83 percent of the test.

    FIGURE 12. Playback Horizontal Position Error Spread.
    FIGURE 12. Playback Horizontal Position Error Spread.

    These two figures verify the repeatability of the RPS testing method and solidify it as an alternative to both signal-simulator testing and live testing of satellite navigation receivers.

    Denver Testing Method

    To evaluate the RPS concept, we conducted tests in three locations: Boulder, Denver, and Interstate Highway 70, all in Colorado. The Boulder and Denver locations were urban collections, while the Interstate 70 location was a natural canyon with significant elevation change. The collection at each location was repeated with two different representative antennas (patch and cell phone) at nearly the same sidereal time in order to keep the overhead satellite constellation similar.

    We examine here the November 11 and 16 Denver tests. The November 11 test used a patch antenna that places nearly all its gain in the upward direction, making it more immune to interfering sources below and to its sides. Figure 13 shows the patch antenn
    a location on the van, as well as the truth-system antenna location utilized for testing on both days.

    FIGURE 13. Patch antenna (dashboard) and truth-system antenna (rooftop) locations.
    FIGURE 13. Patch antenna (dashboard) and
    truth-system antenna (rooftop) locations.

    The November 16 test used a cell-phone GPS antenna that does not have a preferential gain direction, making it more susceptible to interfering sources below and to its sides. This antenna type is representative of the typical low-cost antenna (in some cases as simple as a piece of wire) found in consumer cell phones. Figure 14 shows the cell-phone antenna suction-cup mounted to the front window of the testing van. The representative antenna mounting location was chosen to minimize locally-generated RFI effects while also being representative of a typical vehicle-use case.

    FIGURE 14. Cell-phone antenna location.
    FIGURE 14. Cell-phone antenna location.

    The required equipment and connections are minimal when performing RPS drive testing, as no RUTs are included. The inset to Figure 1 at the beginning of this article shows the RPS unit in the rear of the van, mounted on layers of foam to reduce vibration, which, if not properly addressed, can cause errors in mechanical hard drives writing data at high rates. Also visible are the truth receiver on the center of the van floor, and the car batteries for powering it and the IMU. The IMU is mounted to the vehicle frame and is not shown.

    The test drive trajectory through Denver on November 11 and 16 as reported by the truth system is shown in black in Figure 15 and is also repeated in Figures 16 and 17. The test lasted approximately 40 minutes on both days. It started in the upper left part of Figure 15 and continued zig-zagging through downtown to the lower right.

    FIGURE 15. Truth trajectory for November 11 and 16 tests.
    FIGURE 15. Truth trajectory for November 11 and 16 tests.

    Figures 16 and 17 show particularly difficult blocks for the four receivers tested under the replay method. These receivers are denoted A (green), B (blue), C (red), and D (yellow).

    FIGURE 16. Difficult block #1 during November 11 test and truth system antenna (rooftop) locations.
    FIGURE 16. Difficult block #1 during November 11 test and truth
    system antenna (rooftop) locations.

    The horizontal positioning error statistics for two receivers on the November 11 test are shown in Figures 18 and 19. The left side shows horizontal error in two different zoom levels. The right side shows a histogram and cumulative distribution of errors, and several reporting metrics over the entire test. Even though receiver A in general outperformed receiver B, from the error time histories there are noticeable periods where both receivers simultaneously had positioning difficulties.

    FIGURE 17. Difficult block #2 during November 11 test.
    FIGURE 17. Difficult block #2 during November 11 test.

    Table 1 summarizes the horizontal positioning statistics for all receivers during both tests. Positioning accuracy was severely degraded when replaying samples collected with the cell-phone antenna as compared to the patch antenna. Receiver A was the most accurate across both tests, while receiver B was the least accurate. The uncertainty of the truth system was subtracted out when producing the horizontal positioning results for all receivers.

    Table 1
    Table 1

    Conclusions

    The record-and-playback system testing approach, in our opinion, represents the best way to test hardware receivers. It overcomes the fidelity limits of simulator-based testing, especially when considering the difficult-to-model urban environment. During receiver development, it requires only a single drive test for each location, as sampled RF data can be replayed from disk.

    FIGURE 18. Receiver A horizontal positioning error statistics (November 11 test).
    FIGURE 18. Receiver A horizontal positioning error statistics (November 11 test).
    FIGURE 19. Receiver B horizontal positioning error statistics (November 11 test).
    FIGURE 19. Receiver B horizontal positioning error statistics (November 11 test).

    Having demonstrated that RPS testing is repeatable, we have produced a library of RF sample files representing real-world conditions for continued receiver development and testing purposes.

    • Eric Vinande is Ph.D. student at the University of Colorado studying GPS/MEMS inertial sensor integration and urban RFI aspects.
    • Brian Weinstein is a BSEE student participating in the Undergraduate Research Opportunity Program for GNSS receiver testing at the University of Colorado.
    • Tianxing Chu is a visiting researcher at the University of Colorado from Peking University where he is a Ph.D. student.
    • Dennis Akos is an associate professor within the Aerospace Engineering Sciences Department at the University of Colorado with concurrent appointments at Stanford University and Luleå University of Technology.

    Manufacturers

    Development of the methodology described here used two different RPS systems, one from LabSat (RaceLogic) and one from Averna. The test data come from the Averna system.