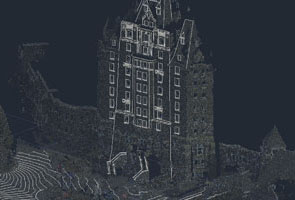
Pointfuse has developed smart software that automates the identification and classification of objects for facilities management applications using data from mobile mapping systems like the new Leica BLK2GO.
Pointfuse software converts the millions of individual measurements captured by laser scanning and photogrammetry into useable 3D mesh models. The unique ability to classify objects within Pointfuse, both automatically and manually, has already had a huge impact on how as-built data is used within design and construction. It can now realize real time records for space utilization and optimization projects, reducing costs and speeding workflows within facilities management.
The Leica BLK2GO. (Photo: Leica Geosystems)
Pointfuse Simple BIM (sBIM) leverages the core functionality of Pointfuse — the segmented mesh model; automatically converting classified mesh models into “family” groups, such as walls, floors, doors, windows, etc. for use with popular downstream BIM and FM software. Pointfuse sBIM data can then be exported as IFC (Industry Foundation Class) parametrized objects and 2D floors plans and space management reports easily derived. Pointfuse sBIM also automatically calculates quantities, areas and dimensions in an easy to read PDF report.
“This ability to convert classified objects into family place holders has a huge impact on how as-built data is used within a Scan2BIM workflow with the potential for a real return on investment for facilities and space management applications,” said Mark Senior, regional sales director at Pointfuse. “The combination of ease and speed of data capture, as offered by modern hand-held indoor mapping systems like the newly launched Leica BLK2GO, with the automation of Pointfuse processing will release the potential of laser scanning across this sector.”
Pointfuse sBIM was developed in response to a large scale client opportunity that saw the scanning of millions of square feet of facilities with the final deployment of data in Archibus facilities management software using Autodesk Revit as a bridge. Early testing identified that 3D was as quick to create as traditional 2D workflows and exported data is in the region of hundreds of Kbs compared to the Gb volumes of the original point cloud. Taking the process one step further Pointfuse provides an accurate record of the as-built scene by allowing users to create Hybrid meshes combining Pointfuse models with the sBIM IFC container.
Pointfuse will be showcasing the sBIM functionality at the Autodesk University (AU) Expo which takes place Nov. 19-21 at the Sand Expo Convention Centre in Las Vegas, Nevada.
MicroSurvey has released MicroSurvey CAD 2020. MicroSurvey CAD is powered by the latest IntelliCAD 9.2 engine, providing users with unencumbered survey drafting and calculation workflows, including COGO, point tools for gridline-based projects, traverse input and adjustment, misclosure reporting, common data collector support, 3D surface representation and computation, corridor design, point cloud management and more.
MicroSurvey CAD is perpetually licensed and is powered by IntelliCAD, which is compatible with AutoCAD drawing files. With five available feature levels — Basic, Standard, Premium, Ultimate and Studio — MicroSurvey CAD gives users the choice between several tiers of features to ensure they are getting precisely the tools and price point they need.
Notable improvements in MicroSurvey CAD 2020 include:
IntelliCAD 9.2 which includes full support for AutoCAD 2018-2020 .dwg files, performance enhancements, new BIM tools, a block editor, start page, drawing cleanup tools, selection cycling, digital signatures, and much more;
Arc Labels have been drastically improved to utilize ArcAlignedText objects, which can be slid along an arc or polyline arc, in/out from the radius point, flipped upside down, and detected in the Lot Closure routine. Text on Arc also utilizes the ArcAlignedText objects to be editable as a single entity;
Upgraded CSMap Library includes over 125 new coordinate systems for Africa, Asia, Europe, Australasia and the U.S.
Details are available in the MicroSurvey CAD 2020 Release Notes.
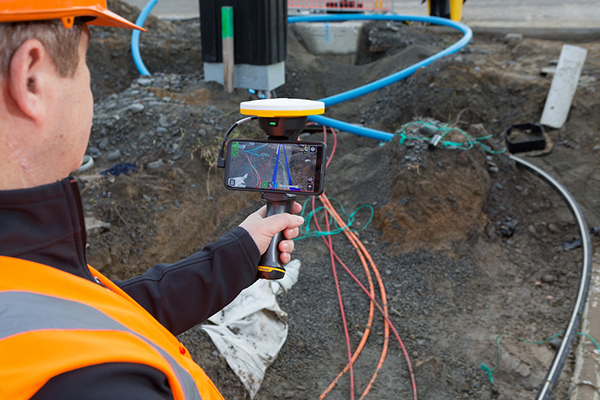
Trimble has introduced its Trimble SiteVision system, an outdoor augmented reality (AR) solution that enables users to visualize 2D and 3D data on virtually any project site with cellular or internet connectivity for easier and more efficient planning, collaboration and reporting.
Combining hardware and software in an integrated, lightweight handheld or pole-mounted solution, users can view 3D models and assets in a real-world environment at a 1:1 scale, from any angle or position.
The system consists of:
Hardware: The Trimble SiteVision integrated positioning system integrates the Trimble Catalyst DA1 antenna, electronic distance measurement (EDM) rangefinder and power management into a lightweight, handheld device that connects to a user-supplied Android mobile phone.
Software Subscription: Available to single users on a monthly or yearly basis. The SiteVision software subscription combines Trimble’s high-accuracy positioning services and cloud-based processing technology to create a centimeter-accurate AR system. The system leverages Trimble cloud-based processing to manage and deliver data and design models.
SiteVision enables users to visualize digital models from a wide range of data collection, design and constructible modeling tools in open industry-standard formats including IFC and LandXML.
For civil projects, SiteVision accurately visualizes data from Trimble’s Quantm, Business Center and Novapoint; design data from Civil 3D and Bentley OpenRoads; and GIS data from Esri ArcGIS software.
Photo: Trimble
SiteVision powers building information modeling (BIM) projects with open data from Trimble’s Constructible BIM solutions including SketchUp and Tekla, and BIM data from Autodesk Revit and AutoCAD software. For utility companies, PLS-CADD power line design, Distribution Design Studio (DDS) and other industry-specific design data is also supported.
Using Trimble Connect cloud-based hosting, SiteVision can access models from all stages of the lifecycle of infrastructure and buildings—from initial concepts of roads or buildings through the operations and maintenance phase of the assets—to increase collaboration, enhance work accuracy and ultimately improve operations and utilization.
SiteVision simplifies complex concepts by allowing users to blend digital content with real-world environments. For example, city planners can visualize a new building design in the exact spot it is to be erected, a work crew could identify the exact position of underground cables or pipes before digging, an electric utility can confirm placement of poles and lines with customers and crews, or a construction supervisor could assess the progress of heavy equipment by visualizing actual work performed against the site plan.
“It’s easier to understand complex ideas when we can see them in a real-world context,” said Mark Nichols, general manager at Trimble. “SiteVision improves our understanding of projects and worksites with a handheld device that is accessible to a wide range of users. Augmented reality is now ready for everyday use in a wide range of applications.”
Trimble SiteVision is available to order now through Trimble’s authorized distribution channels for Civil Engineering and Construction, Geospatial and Buildings.
Topcon Positioning Group will be showcasing its vertical construction, construction management, and structural health and inspection technology at Intergeo 2019. (Photo: Topcon)
Topcon Positioning Group will be demonstrating its technology offerings across vertical construction, construction management, and structural health and inspection at Intergeo 2019.
Topcon will present its new building information modeling (BIM) technology at the show, which includes the Topcon vertical construction workflow. The Topcon vertical construction work flow includes the Laser Scanning Robotic Total Station GTL-1000, MAGNET Collage and ClearEdge3D Verity software.
According to the company, the full workflow is designed to offer a powerful instrument for single-operator layout and scan on a single set up. It will also be releasing new innovative digital layout solutions alongside the GTL-1000 to enhance the VC portfolio and widen the options available to customers for this critical task.
Topcon will also be showcasing its inspection, assessment and monitoring solutions, which are designed to keep infrastructure assets in operation by providing reporting tools for site engineers and monitoring structural health.
Topcon added that it will be demonstrating its GTL-1000 and accompanying software MAGNET and ClearEdge3D Verity at the show. Its booth will also feature interactive displays that will provide virtual looks at job sites.
“Productivity is a huge talking point in our industry, so this year at Intergeo we’re proving that Topcon is always one step ahead, working in partnership with the construction and infrastructure sectors to provide solutions and products to address the big issues,” said Ian Stilgoe, vice president of Geopositioning Europe at Topcon Positioning Group. “Whether it’s quicker, simpler verification, or smart inspection and monitoring of aging assets, the need for digital innovation is greater than ever.”
Topcon’s demonstrations will be taking place at its booth, F3.013, in hall 3.
Written by William Tewelow, GISP and Co-written by Jon Gustafson, GISP
Significant focus on infrastructure asset delivery and lifecycle must become a priority so that architects, engineers and construction (AEC) can leverage BIM systems for design, construction and management solutions.
Innovations in BIM applied to infrastructure construction projects will enable “smart” solutions. This article explores BIM for infrastructure insights and brings attention to closing the BIM divide between the vertical (buildings) and the horizontal (linear) infrastructure industries, such as roads, bridges and pipelines.
For smart systems to be applied to infrastructure, CAD needs to evolve to the point where those multi-dimensional models can integrate with geographic information systems (GIS). The larger the project, the more necessary it is for a seamless data transition from the local engineering scale to the municipal, regional or national reference systems.
Autodesk defines building information modeling (BIM) as an intelligent 3D model-based process that gives architecture, engineering and construction (AEC) professionals the insight and tools to more efficiently plan, design, construct and manage buildings and infrastructure.
It is like a GIS in many respects, but applied locally to a structure. It is able to do many common geospatial calculations. It is still an evolving technology, but it is clear that soon it will do for AEC and facilities management what GIS did for surveying and cartography.
A smart move
Systems have evolved augmenting our abilities with built-in applications that can integrate connected data and systems to enhance and extend our capabilities. These systems are termed smart, which has become the newest marketing buzzword.
Everything is getting the smart label. Along with the label is an expectation that the lines between the physical and the digital worlds are blurring as we slip ever nearer the veil wherein we will simultaneously co-exist in both worlds.
Smart also infers it is connected to the digital cloud, that seemingly infinite expanse measured by petaflops, into which artificial intelligent algorithms augment everything with contextually aware information overlaid atop our own experience of the world.
Of course, this view has its pitfalls and cautionary tales, and every step we take into the future we lose some connection with the past. For example, everyone can use a calculator, but are times tables even taught anymore? Automation leads to complacency.
When CAD was unimaginable
Let’s take a brief look backward. The year was 1978, my second year of high school. I took drafting class as an elective and would end up doing so for the rest of the time I was in high school, accumulating enough credit hours to graduate with a vocational degree equivalent in architectural design. Those were the days of drafting tables, slide rules, French curves, triangles, keen eyes and steady hands.
The last year of school, there was talk of something called computer-aided drafting or design (CAD) that would make all we were doing obsolete. It seemed impossible at the time. Especially after I took a brand-new summer course called computer programming. Computers were large, heavy, clunky things that had limited abilities. They were basically responsive text machines. Program something in BASIC, save it, and then from the DOS command window, run it over and over again.
I remember reams and reams of green and white paper two foot wide fed by geared teeth, and pages of pages of our coded programs that we would have to pour over looking for the mistake in the line of code. And, this long and lengthy code was merely to archive and sort information or make the computer draw a cat or some other object using “X”.
We would all stand around the dot matrix printer as line by line the image took shape on the printed page. There was that wondrous feeling of success creating something having first conceived it in the mind then, like digital-smiths, forging it in a non-physical space and holding it in our hands. But I could not understand how that blinking white cursor on a black screen could ever replace the rich colors and smoothed lines of the beautiful architectural drawings I had spent years learning.
I felt confident the stories of our trade being overtaken by CAD were greatly exaggerated. That lesson taught me that change is inevitable and far beyond our rational ability to comprehend what is possible based on our current understanding. I watched as computer-aided design did take over, giving engineering and architectural drawings multidimensional context.
Horizontal lags behind
Now, let’s jump back into the present. The horizontal industry is behind the vertical industry with respect to project management deliverables. In part, this disparity will be aided by the Geospatial Data Act which was passed into law on Oct. 5, 2018.
The linear model is approximately 10 years behind the vertical model, especially for above-ground assets and facilities. However, recent technology advancements — augmented reality (AR), unmanned aircraft systems (UAS), indoor lidar and modeling software — and influential advocacy initiatives (such as public agency innovation programs like smart cities) are starting to enable digitally integrated management of asset information more holistically. Indeed, there is urgency for these linear systems to be adequately captured.
The Feb. 6 explosion from a ruptured gas line in San Francisco showed the dangers of not having an adequate map of the subsurface infrastructure. Fortunately, no one was injured, but damage from subsurface infrastructures can be deadly like the San Bruno disaster in 2010.
Gas line explosion damage in San Bruno, California. (Image: U.S. Department of Transportation)
The “Call Before You Dig” law was enacted for this very reason. At the very least, problems with linear infrastructure can negatively impact a city’s quality of life and budget such as a water main break or a broken sewer line.
Looking ahead 5-10 years, horizontal infrastructure designers and installation companies will use 3D modeling tools as standard practice in an open data sharing environment allowing other networks to access the information and add it to their own projects.
Imagine a county’s 811 system, the universal number to call before you dig, and instead of calling, it is an app on a users’ phone. A requester submits a short form and receives a text when the application is approved, usually within minutes, and is then able to view an augmented reality overlay of the subsurface infrastructure in the vicinity beneath the ground where the requester’s project is taking place.
This approach has economic benefits, providing faster turn-around times, increasing citizen engagement and improving the safety of communities. Over time, it is a “collect once and use many times” system — it will reduce demand on city staff and billable hours, saving cities money.
The same technology is also available for construction projects, providing schematics to see pipes, ducts and wires in walls, floors and ceilings. This is not science fiction. Existing condition data is already being collected in 3D, so it is logical to anticipate engineering design will be prompted to support ongoing 3D collection efforts and begin doing work in 3D.
Using BIM from the outset of a project builds this into a system that can be accessed later. However, the use of these advanced augmented reality technologies are limited to certain geographic areas with enough funding and technical capabilities. This is primarily in large urban areas, new growth areas, and redeveloping areas of a city; however, large infrastructure projects such as pipelines, railroads, highways, bridges and hyperloops will have to develop high-resolution models that will capture some of the surrounding areas and benefit all communities along the routes helping to bridge the disparity of the BIM divide.
In time, as costs come down and the technology improves and becomes easier to use, all communities will benefit from and incorporate this emerging technology.
Photo: Krauchanka Henadz/Shutterstock.com
BIM for intelligent infrastructure: sensors and structures
Critical to BIM for smart infrastructure is the fusion of sensors, data and infrastructure. Sensors will be embedded within and affixed to physical assets for the purposes of collecting data and self-monitoring for machine learning, maintenance and repair. Networking internet-enabled devices that actively and passively sense is at the core of the internet of things (IoT). Data from these IoT devices will improve physical asset management, creating unique opportunities for agencies, especially when considering how machine learning can discern patterns in data to detect anomalies, and improve safety such as self-aware systems that can heat road surfaces when precipitation is detected in below-freezing temperatures.
The digitizing of the physical world will take place with greater demand for higher resolution capabilities. Physical structures will require an exact computerized replica, referred to as a Digital Twin. An effort is underway by the Open AR Cloud Organization (OARC) to create an open standard for this digital twin of the world, so that applications and innovation will not be hampered by proprietary systems.
Yohan Baillot, CEO of ARcortex and founder of the Open AR Cloud, explained if there is no open standard, something developed in one system may not align with applications viewed in another system. This could be costly and disastrous for transportation and construction projects. Point in case would be the above example of Call Before You Dig,if a gas pipeline is incorrectly depicted and a work crew ruptured it.
This Digital Twin is both a high-resolution GIS and a basemap for both vertical and linear BIMs to connect into. Knowing the location of subsurface assets is foundational to the increasing investment into smart cities, which is forecast to become a $3.5 trillion industry within the next seven years.
David Rouse (2017) defines smart cities as cities that use information and communication technologies to increase operational efficiency, share information with the public, and improve both the quality of government services and public well-being. Using smart devices, communication among the devices and with the entities managing those devices provide deeper insight on device behavior and the ability to develop algorithms to change device parameters using other sensors in close proximity.
All of this data can be used to optimize asset performance over time. In the U.S., San Francisco, New York, Chicago, Los Angeles, Boston and San Jose all have active smart city projects advancing connectivity (Nominet 2018).
Intelligent infrastructure augments users’ abilities by the multiplicity of sensor arrays (self-monitoring devices, RFID, Wi-Fi, GPS receivers, cameras, etc.) communicating with decision-support systems as well as other sensors — the internet of things (IoT). For instance, high mast cameras combined with artificial intelligence algorithms for object recognition deployed along a stretch of highway allows stakeholders to extract important insights of that physical asset (such as surface condition, traffic flows and vehicle counts) and provide that information in real time to emergency response crews, police and security, maintenance vehicles, network-connected vehicles and others.
Digital integrations
Intelligent transportation systems are entering the next generation enabling vehicle-to-infrastructure (V2I) interactions. The U.S. Department of Transportation (2018) website states,
V2I technologies capture vehicle-generated traffic data, wirelessly providing information such as advisories from the infrastructure to the vehicle that inform the driver of safety, mobility or environment-related conditions. State and local agencies are likely to install V2I infrastructure alongside or integrated with existing ITS equipment.
The Open Connectivity Foundation (OCF) endeavors to provide open standards and certification to make connectivity easier, more reliable and more secure by bridging IoT ecosystems.
Specifically, OCF specifications can be used to develop vehicle data model translators that enable remote fleet management for autonomous vehicles, OBD device interactions (vehicle performance monitoring) and crowdsourcing of data models for continued development (Open Connectivity Foundation 2018). Currently, many transit agencies are seeing growth in equipping rolling stock with IoT devices including GPS, Wi-Fi and traffic light preemption, which improves fleet optimization and data accessibility, and enables better congestion management as well as increased system performance (American Public Transportation Association 2018).
Crowdsourcing data from web-based and mobile applications is a popular public engagement mechanism. Crowdsourcing at its most basic level is the aggregation of (big) data from a large group of people. From an asset management perspective, leveraging the general public’s direct and indirect collection of data brings deep insight into asset performance and condition.
The data collected provides the ability to better plan transportation systems with demand modeling, predictive analytics, event response times to identify those impacted and determine where additional capacity is needed, and to provide personalized services (such as through email and text) including weather-related events impacting the commute.
Applications such as Waze empowered the public with the ability to report hazards, construction zones and other concerns on the road and shoulder that DOTs can use to dispatch resources to address the situation/issues quickly. Furthermore, Alavi and Buttlar (2019) identified sensing capabilities of smartphones and their crowdsourcing power for monitoring several distinct civil infrastructure systems such as pavement.
Conclusion
In summary, BIM for infrastructure overlaying a robust GIS plays a critical role for supporting advanced technologies for integrating dynamic IoT and crowdsourced data.
Infrastructure asset owners are encouraged to recognize the importance of BIM-oriented policy and practices and invest in required initiatives that make incremental progress towards a smart infrastructure vision.
BIM is the foundation of intelligent infrastructure and defines the backbone of smart cities.
References
Alavi, Amir H., and William G. Buttlar. 2019. “An overview of smartphone technology for citizen-centered, real-time and scalable civil infrastructure monitoring.” Future Generation Computer Systems 93: 651-672. https://doi.org/10.1016/j.future.2018.10.059.
Jon Gustafson, PS, CFedS, PMP, GISP is a management consultant with one of the world’s largest professional services companies, WSP (https://www.wsp.com). He is an accomplished business-oriented technical professional consistently recognized as an industry leader in multi-jurisdictional land surveying practice, geospatial policy development and program/project management. He helps his clients address infrastructure technology deployment challenges by developing effective recommendations/guidelines focused on advancing civil integrated management practices and innovations. Some recent projects include developing data governance strategies for major infrastructure programs, conducting applied research on digital project delivery initiatives, advancing UAS integration, and formulating geospatial technology strategies for a public agency.
Upgrade to MAGNET Collage Web includes with new deliverable options.
Topcon Positioning Group has upgraded its MAGNET Collage Web, a web-based service enabling the sharing and collaboration of UAV and scanning data sets.
MAGNET Collage Web version 1.3 allow operators to work with more types of data with greater flexibility, including the ability to import BIM models, as well as CAD and GIS data.
MAGNET Collage Web and MAGNET Collage desktop software meet the demands of a diverse user-group. The latest update is designed to address an increasing need from the vertical building construction market segment to work in a single-software environment with BIM, scanning and UAV datasets.
“Now operators can view and publish BIM models, along with other data types, directly through the web browser to be sharable with more versatility,” said Alok Srivastava, director of product management. “MAGNET Collage Web can be used to overlay as-built laser scans and design data to visualize proposed changes and detect construction issues. The software supports OBJ, FBX and 3DS formats.”
The upgrade to MAGNET Collage Web also includes new direct publishing functionality for CAD and GIS data files through the browser.
“Operators can now overlay 3D point clouds and reality models with CAD and GIS design data, including support for DXF, SHP, KML, GML and GeoJSON formats,” said Srivastava.
The upgrade to MAGNET Collage Web also introduces advanced sharing controls including the ability to fully customize layer visibility, appearance, window layout, feature selection and camera position.
“The updated customization controls allow operators to share and present their projects exactly the way they mean to with a multitude of viewing options, allowing specific features to be highlighted as necessary,” said Srivastava.
Additionally, MAGNET Collage Web can now be accessed through the Topcon “Blue Bar” that allows direct access to the service from any Topcon website. The universal account and application management toolbar is embedded at the top of Topcon web pages.
Open-source JavaScript library for creating immersive connections to infrastructure digital twins.
Bentley Systems has released its iModel.js library, an open-source initiative designed to improve the accessibility, for both visualization and analytical visibility, of infrastructure digital twins.
iModel.js can be used by developers and IT professionals to quickly and easily create immersive applications that connect their infrastructure digital twins with the rest of their digital world, the company said.
iModel.js is the cornerstone of Bentley’s new iTwin Services that combine iModelHub, reality modeling and web-enabling software technologies within a Connected Data Environment for infrastructure engineering.
iModelHub manages an iModel as a distributed database with an intrinsic ledger of changes — enabling alignment, accountability and accessibility of its digital components — to form the backbone of an infrastructure digital twin.
The iModel.js library is a comprehensive collection of JavaScript packages that build on the most open, popular and flexible standards for modern cloud and web development. It is written in TypeScript and leverages open technologies including SQLite, Node.js, NPM, WebGL, Electron, Docker, Kubernetes, and HTML5 and CSS. The same codebase can produce cloud services and web, mobile and desktop applications. The source code is hosted on GitHub and is distributed under the MIT license.
With iModel.js, it is simple to create a web-based experience that shows interactive “nD” views (1D, 2D, 3D, 4D, etc.) of iModels that are assembled and synchronized from BIM files and other digital engineering models, as well as from data created directly with iModel.js.
Those same views can also include digital (reality) context, real-time sensor data, and other data from enterprise sources and analytics. Since the iModel is synchronized by iModelHub, it always reflects the most recent updates from all project participants, who are thus able to visualize and analyze changes between points in time or between versions. Importantly, only users and applications authorized by the iModel owner, through iModelHub, are granted access through iModel.js.
“iModel.js gives Hatch the ability to implement a stakeholder engagement technology that extends the iModelHub visionary technology,” said Johan Palm, program manager of digital project delivery at Hatch. “We can expose complex project information to a level that is accessible, consumable and extendable via the cloud and in context to the 3D model. Most importantly we can do so in a manner that embraces change as the project progresses. iModel.js aligns with Hatch’s internal development strategies as it is built on modern, highly portable web technology. Bentley is a key software technology partner on Hatch projects globally where our main objective is to provide a positive impact to our client’s assets and operations.”
“The digital twin powered by iModelHub is efficiently improving project management, substantially reducing the waste of resources caused by site problems and will achieve digital handover after completion of the project for visual operations and maintenance,” said Cai Chengguo, chair and general manager at Shenzhen Expressway Consulting Group.
“We firmly believe that iModel.js, and of course the foundation upon which it is built, is the most open, productive, intuitive and powerful development environment for capital projects and infrastructure assets, ever,” said Keith Bentley, Bentley Systems’ founder and CTO. “We’re excited to work with user organizations, strategic partners and third-party developers to build an open ecosystem around iModels to tap the vast potential of infrastructure digital twins. With iModel.js, the well-refined techniques of mainstream cloud and web development can leverage the physical and virtual reality in digital twins with near-zero impedance. By open-sourcing the libraries we use to create our iTwin cloud services, we expect to foster a substantial and vibrant ecosystem of innovation.”
GIS is growing in importance to urban development, whether for environmental impact studies, geofencing or building information modeling (BIM). Sharing GIS data with developers is critical to a coordinated approach to smart city growth.
By Christine Easterfield, Principal Analyst, Cambashi
Just over half the world’s 7 billion population lives in cities. In Europe, this rises to three quarters, and 30 cities worldwide have populations of more than 10 million — the majority in India, China and South America.
This trend will continue. It is projected that the global population will reach almost 10 billion by 2050, which means cities will need to cope with increasing demands on housing, transport and communications.
Growing urban populations place considerable stress on housing stock. Cities need to provide scope to build new, but also to look at best use of existing properties.
In the growing urban population, there will always be a proportion that needs more support as employment rates shift and wages do not always keep up with city expenses. Social housing projects need to keep pace, and making the most of city resources opens opportunities for smart buildings.
The role of GIS
Proposed Indianapolis zoning map. (Image: City of Indianapolis)
Coordinating new build and refurbishment plans across a city requires planning and organization, and a set of tools to support planners and designers. The layout of city-planning zones is the starting point for many new developments — sharing data about these areas is typically achieved using a GIS (geographic information system).
The standard city map with records of roads, emergency routes, bike routes, key buildings, new development zones, existing housing stock, utility services and street lighting are a central resource for most cities.
Sharing data between these city maps and developers’ plans is critical to a coordinated approach to city growth.
Environmental impact
The early stages for many developments involve an environmental impact study. How will the new development fit into the existing landscape? What restrictions are imposed because of the conditions of the site or the current demands on local resources? What options are there for addressing these constraints?
This last point is important for acceptance of the development. Being able to show a level of flexibility to accommodate local concerns and developers’ challenges will build a cooperative relationship. The ability to easily integrate building plans with the city map means that confidence is quickly built into the new plans.
Combining the geography of the city view with the building model destined for development provides a perfect foundation for an integrated GIS/BIM model to take the development from drawing board to handover.
Maintaining a digital twin of a development, in the form of a BIM, provides a rich source of information about the as-built building — exact measurements, materials used, changes from the original design and more. Integrating this with the city maps held in GIS means a continuous dataset can be formed.
Tools for construction site inspection and reporting
Photo: Alen Ajan/Fotolia.com
Developing building information models (BIMs) requires monitoring the build activity and accurate recording of the construction. The best way to do this is as it happens.
Simple-to-use tools that are robust enough to cope with a construction site are becoming more available from software providers. These support gathering data by construction teams and contractors as the work is completed.
As well as recording data, these tools are also useful in registering the progress and completion of tasks. Many enable interaction with central systems that can send changes and updates directly to the site for immediate action.
The same tools can register the location of the user, enabling safer working practices to be enforced.
The practice of geofencing to monitor or even restrict access to parts of a construction site, by registering the location of a device against a predefined region on a map of the site, can track critical activities and react with the most appropriate action if an incident is reported.
Remote site inspection and reporting
The Aeryon SkyRanger. (Photo: Aeryon Labs)
The safest inspections don’t involve human intervention at all. Sending an unmanned aerial vehicle, UAV or drone, to fly over your site removes risk to staff when viewing hazardous environments.
Photographic imagery collected by drone can be loaded into GIS tools and accurately registered against the map of the area to provide a seamless view of the site.
Data integration is key
The range of data that can be accurately gathered and viewed together now covers original 3D designs, 2D construction plans, inspection photo-imagery and as-built updates.
Integration of BIM and GIS tools means that these different data types can be viewed together and in the same spatial context.
Support for building operation, management and maintenance in the wider context of a smart city
On-the-spot data capture of accurate as-built building information models that can seamlessly integrate with existing city plans leads to a data resource that cities can build on to improve safety, security and facilities for their citizens.
So what should the smart city planner be looking for?
Existing geospatial and data management tools already address many of these challenges, and when an opportunity for a technology refresh is presented, the approach to smart city support should be a big part of the mix.
Christine Easterfield
Christine Easterfield is principal analyst for Cambashi. She has more than 20 years’ experience in the software business. Her experience has covered geospatial asset management for the utility industry: assessing market needs and opportunities, managing customer requirements, liaising with development teams and running global product introduction programs.
Previous roles include programming, training, consultancy and product marketing management.
She has worked for a range of companies from multinationals to small start-ups, resulting in an understanding of how different sized organisations operate, grow and manage change. Christine has a BSc in Computational Sciences and an MA in English Literature.
Bentley Systems, a global provider of comprehensive software solutions for advancing infrastructure, has acquired Plaxis, provider of geotechnical software, based in Delft, Netherlands.
Bentley has also agreed to acquire soil engineering software provider SoilVision, based in Saskatchewan, Canada.
The acquisitions, with Bentley’s market-leading borehole reporting and data management software gINT, serve to make Bentley a complete digital source for geotechnical professionals.
With the acquisitions, building information modeling (BIM) advancements can be extended to the essential subsurface engineering of every infrastructure project.
Projects necessarily begin with geotechnical surveys and sampling, captured with gINT for versatile documentation and reporting.
Next, professionals perform engineering related to soil properties, soil behavior, and groundwater flow using SoilVision’s SVOFFICE applications, supplemented by Plaxis’ offerings.
Then, soil-structure interaction is analyzed through Plaxis’ design, simulation, and engineering software (for example, PLAXIS 2D, PLAXIS 3D).
The new opportunity, by way of digital workflows enabled through Bentley’s comprehensive modeling environment, is for geotechnical applications to be integrated with Bentley’s structural applications (such as STAAD, RAM and SACS) for unprecedented geo-structural engineering performance.
As changes may occur in owner requirements, structural strategies or site conditions (continuously surveyed through UAVs and Bentley’s ContextCapture for reality modeling), geotechnical analysis could be continuously applied for improved outcomes, as managed through ProjectWise collaboration services.
For today’s infrastructure demands, geotechnical considerations are coming to the fore.
Urbanization, for instance, drives growth both vertically and underground, with emphasis on the capacity of foundations and tunnels. And new infrastructure projects of every type depend upon constructed dams, embankments, dikes, levees and reservoirs to improve their resilience.
Moreover, new asset types such as offshore wind turbine structures require new geotechnical analysis capabilities, in this case to be accomplished with Plaxis’ forthcoming MoDeTo software.
Because infrastructure assets are crucially linked to subsurface environs, they are vulnerable to geo-environmental risks including seismic activity, subsidence and weather impacts. Leveraging new digital workflows which incorporate real-time monitoring and analytics during infrastructure operations, geotechnical professionals can play the increasingly valuable role they deserve in achieving geo-environmental resilience.
“My colleagues and I welcome our new teams from Plaxis and SoilVision, which have in common a zeal for applying science for better engineering practice,” said Greg Bentley, Bentley Systems CEO. “Dr. Ronald Brinkgreve from Plaxis and Dr. Murray Fredlund, founder of SoilVision, exemplify this. I believe that every geotechnical engineer has benefitted from Plaxis’ continuous advancement, in scope and quality, of tools for their discipline to add value. With a professional and dedicated management team led by Jan-Willem Koutstaal, Plaxis has become one of the most successful software businesses I have ever seen.”
Bentley added, “While most infrastructure engineering disciplines converged around intuitive 3D models, geotechnical applications seem to have followed a less graphically intensive development path, and so have remained isolated from cross-discipline workflows. This ‘disconnected’ mindset prevailed even while Plaxis, SoilVision, and gINT mainstreamed 3D innovations. Our BIM platform’s comprehensive modeling environment will finally embrace the geotechnical profession in digital workflows for every infrastructure project and asset.”
Tony O’Brien, global practice leader for geotechnics for Mott MacDonald, said, “PLAXIS is one of our core analysis tools being used across our global geotechnics practice. When used by experienced specialists, PLAXIS can analyze many of our most complex ground-structure interaction problems. In Bentley’s hands, we have high expectations that we can accomplish more through digital workflows made possible through integration of PLAXIS technology with Bentley’s comprehensive modeling environment—workflows that are compatible with Mott MacDonald’s commitment to connected thinking and solving complex infrastructure challenges.”
NavVis, a global leader in mobile indoor mapping, visualization, and navigation, announces a new add-in for Autodesk Revit.
The add-in lets Revit users connect their BIM models to 360-degree immersive imagery and point clouds captured by the NavVis mobile mapping system. The add-in simplifies the process of creating and updating outdated BIM models to reflect the current state of the building.
NavVis technology is an all-in-one reality capture solution that has made it possible to quickly scan the current state of large industrial and commercial properties and stream the data on any device.
The data is captured by the NavVis M6 mobile mapping system, an innovative mobile mapping system that can scan indoor environments at the speed of walking. The data is then visualized in the NavVis IndoorViewer, which is browser-based software that streams the immersive panoramic images and point clouds.
With the Revit add-in, the NavVis IndoorViewer can now easily be integrated with Revit BIM models. Integrating Revit and IndoorViewer allows for a side-by-side comparison of the BIM model and the scanned state of the building, remotely from a desktop. This lets users quickly spot the changes that have been made since the model was created and the current state was captured, helping to speed up the process of updating BIM models. Integrating BIM and IndoorViewer also overcomes data silos and reduces planning errors that occur as a result of outdated information.
Revit users who install the add-in will be able to access the added value of the NavVis IndoorViewer, which includes adding and searching for information and mark-ups, taking measurements, route finding and online collaboration with stakeholders.
NavVis IndoorViewer Add-In visualizes buildings in Autodesk Revit.
Mapping company NavVis has launched the M6, a next-generation indoor mobile-mapping system that the company says can overcome the scalability and data quality constraints of reality capture technology.
Surveyors and architecture, engineering and construction (AEC) professionals can now use reality-capture technology for large-scale indoor mapping projects. The M6 can be used for factory planning and creating and updating as-built BIM (building information modeling) models and construction monitoring.
The NavVis M6 is an all-in-one system that captures 360-degree immersive imagery, photorealistic point clouds, Bluetooth beacons, Wi-Fi signals and magnetic field data.
The NavVis M6 features a mobile lidar system that lets it scan up to 30 times faster than stationary devices, letting users capture up to 30,000 square meters in a day.
Cutting-edge 6D simultaneous localization and mapping (SLAM) technology significantly improves the quality of data captured. Thanks to 6D SLAM, M6 continuously scans even complex indoor environments, including uneven surfaces or changing elevations such as ramps, open spaces or long corridors without compromising the quality of the data.
M6’s innovative software is complemented by hardware features designed to improve the quality of data and ease of capture: four laser scanners with a range of up to 100 meters are arranged to maximize scan coverage, while six cameras automatically take high-resolution images during mapping. The innovative design of the M6 includes camera placement that keeps the operator in a blind spot.
NavVis IndoorViewer software gives stakeholders access to the scanned environment through an interactive virtual building in their browser.
“The NavVis M6 marks a quantum leap in indoor mobile mapping,” Felix Reinshagen, CEO of NavVis. “Anyone who needs to scan large properties, run repeated scans or would like to move into the field of reality capture will profit from the groundbreaking data quality.
“With M6, users can now quickly capture large, complex indoor environments for typical tasks such as updating floorplans, documenting construction progress or creating as-built BIM models. At the same time, M6 captures the data needed to provide customers with additional deliverables such as browser-based immersive walkthroughs and indoor navigation,” Reinshagen said.
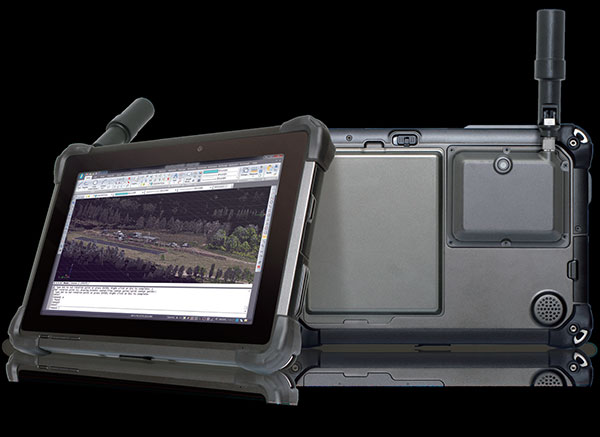
DT Research has released the DT301T rugged RTK tablet (DT301T-RTK), a lightweight military-grade tablet purpose-built for GIS mapping applications. It features real-time kinematic (RTK) satellite navigation to enhance the precision of GNSS position data.
The tablet enables 3D point cloud creation with centimeter-level accuracy, meeting the high standards required for scientific-grade evidence in court.
The DT301T-RTK is a rugged tablet with scientific-grade GNSS. (Photo: DT Research)
The DT301T Rugged RTK tablet is military-grade with an IP65 rating. Because it’s lightweight, the DT301T can be used in the field, office and vehicles, the company said.
A dual-frequency GNSS module is built into the tablet, which uses real-time reference points within 1–2-centimeter accuracy to position 3D point clouds created from aerial photogrammetry, using GPS, GLONASS and Galileo receivers. Users can measure with the RTK GNSS positioning directly using a foldable antenna or connect to an external antenna for more robust receiving and survey-grade precision.
“We’ve seen a dramatic uptick in the need for rugged tablets to be purpose-built for a range of mapping uses across industries,” said Daw Tsai Sc.D., president of DT Research. “In designing the DT301T with RTK satellite navigation, we also took into consideration the other features and capabilities necessary within a rugged tablet to quickly and easily conduct forensic mapping, land surveying, e-construction, building information modeling (BIM) and other mapping scenarios.”
The DT301T is compatible with existing GIS software for mapping applications and brings together the advanced workflow for GIS data capture, accurate positioning and data transmitting.
Uses
According to DT Research, the tablet can be used in a variety of scenarios.
Forensic mapping. Public safety teams, investigators and crash reconstructionists can use the DT301T Rugged RTK tablet to accurately collect measurements that are scientifically defensible by using the real-time centimeter reference points to position 3D point clouds created from aerial photogrammetry or take stand-alone measurements.
DT301T-RTK tablet during forensic mapping training. (Photo: DT Research)
The results will have the precision necessary to stand up as evidence in court, said Andrew S. Klane, a former Massachusetts State Police Lieutenant who teaches Forensic Mapping and is now the chief operating officer at Forensic Mapping Solutions Inc.
“As more drones are being used for mapping, there is a growing need for ground-control positioning devices,” Klane said. “By using a DT301T Rugged RTK Tablet in combination with a drone, users can more quickly and cost-effectively create a 3D model to deliver an accurate representation of the scene with scientific-grade tolerance that will hold up in a court of law.”
It could also help clear crash scenes faster, restoring the normal flow of traffic on congested roadways, reducing secondary crashes and lowering the chance of first responders and other workers getting hurt while clearing the scene.
Land surveying. Surveyors can use the DT301T tablet to measure the altitudes, angles and distances on the land surface so that they can be accurately plotted on a map to determine property boundaries, construction layout and mapmaking.
E-construction. Construction workers can manage the collection, review, approval and distribution of highway construction contract documents in a paperless environment using the DT301 tablet.
Building information modeling (BIM). Architecture, engineering, and construction (AEC) professionals can use the tablet to create 3D models to efficiently plan, design, construct and manage buildings and infrastructure.
FEATURES
The DT301T Rugged RTK tablet has been purpose-built for precision mapping in a variety of environments and includes the following features and capabilities:
Dual-frequency GNSS module: GNSS L1 and L2 RTK that receives GPS, GLONASS and Galileo signals up to 372 channels with RMS 10 mm + 1 ppm accuracy.
High-performance CPU and Windows OS: Intel 6th-generation core i5 or i7 processor with Microsoft Windows 7 Professional or Windows 10 IoT Enterprise. Units come with either 8 GB or 16 GB of RAM.
Sunlight-readable display: A 10.1 inch LED-backlight, sunlight-readable screen with capacitive touch and 1920 x 1200 resolution.
Wireless connectivity: Long-range Class 1 Bluetooth powers connectivity up to 1,000 feet and 4G mobile broadband for LTE, HESPA+, GMS/GPRS/EDGE, EV-DO, Rev A and 1xRTT.
Storage: For field data collecting, the tablet can store up to 1 terabyte of data.
Military standards: The tablet is fully ruggedized to meet the highest durability standards with an IP65 rating, MIL-STD-810G for vibration and shock resistance, and MIL-STD-461F for EMI and EMC tolerance.
Battery pack: High-capacity hot-swappable battery pack delivers 60 or 90 watts for up to 15 hours of continuous mobile communications.
Accessories: Those available include external antennas, pole mount cradles, detachable keyboards, battery charging kits and digital pens.