China has launched a short messaging service leveraging BeiDou (BDS) to provide reliable communication during emergencies when ground-based mobile networks are unavailable, reports Xinhua.
The service was introduced by China Space-Time Information Co. Ltd., the national operator of BeiDou services, in collaboration with major domestic telecom carriers.
The service is be a supplement to terrestrial mobile networks, expected to enhance safety and communication reliability for users across scenarios such as hiking in remote mountains, working at sea, and disaster relief and emergency coordination.
It marks a significant step toward bringing satellite communication technology to the public, integrating BeiDou’s capabilities into daily life and offering tangible technological protection.
The service uses the short-message communication capability built into the BeiDou system, enabling users with compatible smartphones to send and receive text messages directly via BeiDou satellites in areas without cellular coverage.
China’s three primary telecom operators — China Mobile, China Telecom and China Unicom — have all integrated the service. Subscribers can activate the service without changing their SIM cards or phone numbers, according to the company. Nearly 60 smartphone models from leading Chinese brands already support the functionality.
China Space-Time Information specializes in satellite navigation and communications, big data services, artificial intelligence development, and geospatial remote sensing.
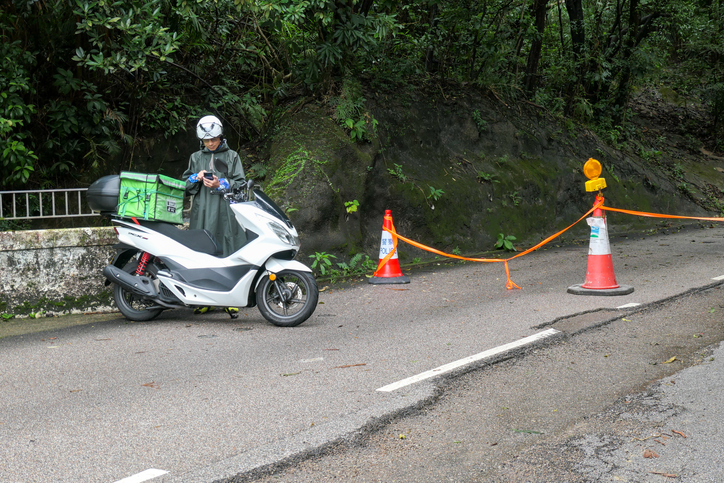
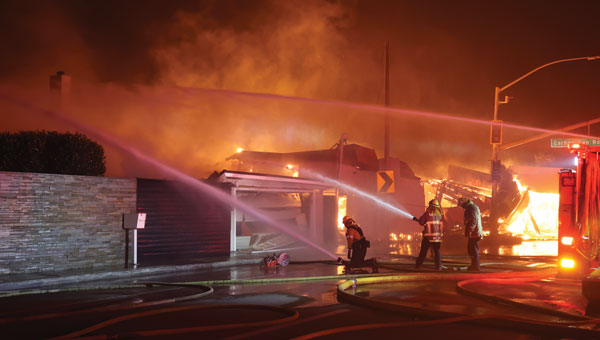
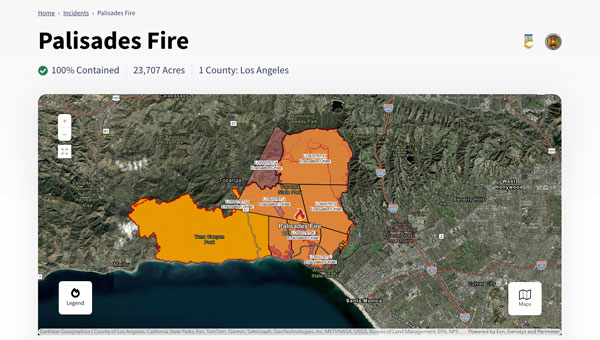
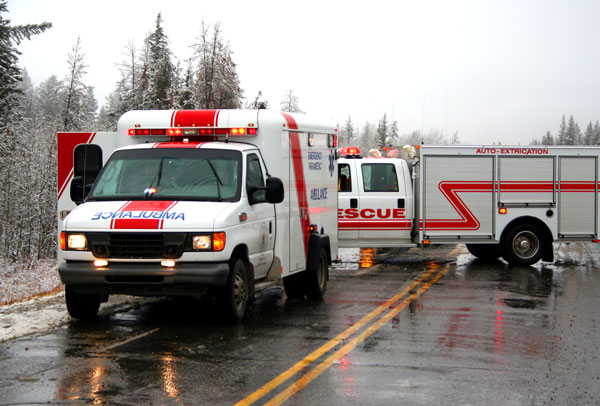
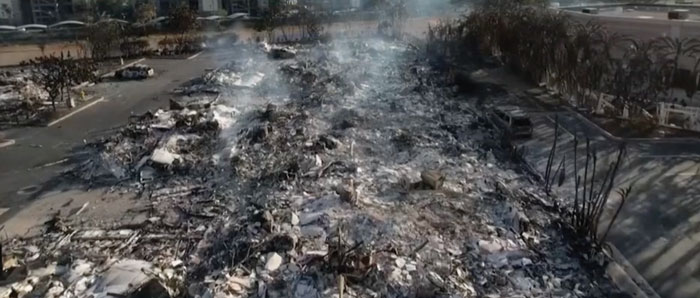
The Palisades and Eaton fires devastated parts of Los Angeles in January 2025 and are largely contained as of Jan. 20. Fueled by extreme Santa Ana winds and dry conditions, these fires have left a mark on the region’s landscape and community.
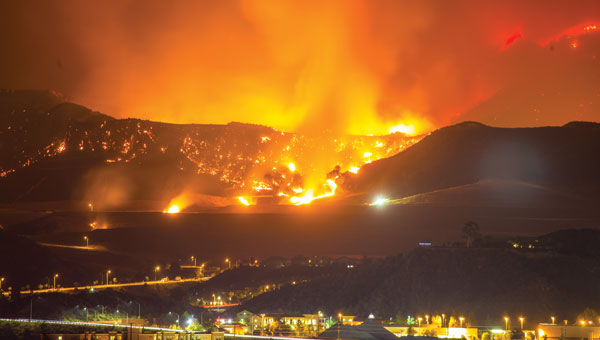
The Palisades Fire, which originated in the Pacific Palisades on Jan. 7, ultimately burned 23,448 acres, resulted in 12 confirmed fatalities and destroyed or damaged more than 6,800 structures, according to the California Department of Forestry and Fire Protection, known as CAL FIRE. The fire’s rapid expansion was particularly alarming, growing from a small brush fire to a massive conflagration within an hour.
Simultaneously, the Eaton Fire, which began near Altadena and Pasadena, consumed 14,117 acres. This fire proved even more deadly, with 17 confirmed fatalities and significant damage to more than 10,000 structures, according to CAL FIRE. Both the Palisades and Eaton fires have now been classified among the most destructive wildfires in California’s history.
During times of emergency, geographic information systems (GIS) specialists come together to create real-time mapping tools to provide critical support to first responders and keep communities well-informed. These tools have become indispensable in modern disaster management, particularly in wildfire response.
Interactive 3D Maps
Firefighters and other specialists from federal, state, and local agencies work together to fight wildfires. GIS specialists develop interactive 3D maps to display fire perimeters, evacuation zones and other critical data. The geospatial data serves as the foundation for effective communication and decision-making, allowing firefighters and incident management teams to access information in near real-time to make informed decisions.
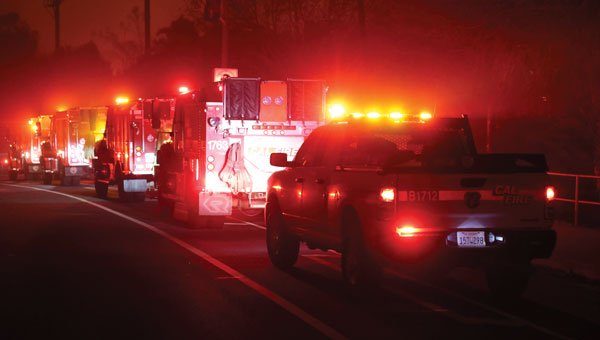
Fire GIS specialists Peter Rowland, Brett Adler and Dawn Hutchinson shared insights into their teams’ strategies for wildfire management. They emphasize the crucial role of geospatial tools in disaster response by delivering actionable intelligence. GPS World interviewed them during the California wildfires. Rowland and Adler were based at the Palisades fire, while Hutchinson, who is a member of a California Interagency Incident Management Team (CIIMT), was located near the Eaton fire.
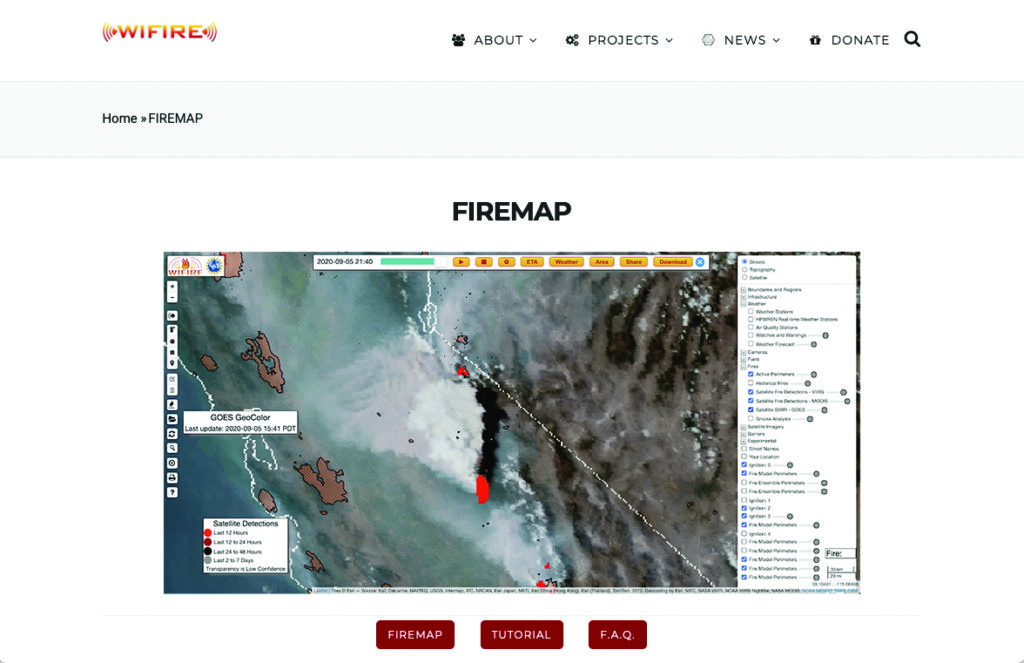
Interagency GIS teams use the Fire Integrated Real-Time Intelligence System (FIRIS) to watch for fire starts and then receive alerts from dispatch centers and satellite imagery. After locating the point of ignition, they create fire behavior models using a program called WIFIRE from UC San Diego. This tool allows them to predict the fire’s probable trajectory and size.
Photo: CAL FIRE
The team will alert the state if the data shows the fire is likely to spread. Hutchinson explains that, within minutes of the start of the Eaton fire, her team produced a fire behavior model that illustrated where the fire was most likely to go and how big it would likely get within the next three hours.
Photo: CAL FIRE
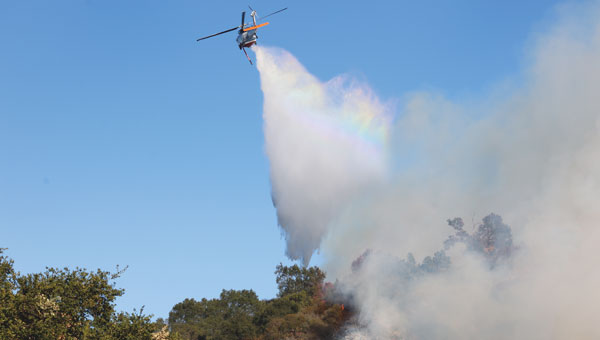
The frequency of IR flights depends on the fire’s size and intensity. Occurring anywhere from once to three times daily, including nighttime, these flights comprehensively map the landscape based on the fire’s specific traits. The decision on how often to fly the planes and collect the IR data depends on the fire’s behavior and potential threat level.
Field observers are also deployed daily to collect data down to the debris. They walk the fire’s edge and move along specific paths created for wildfire management and containment. Once a fire is contained, GIS specialists try to verify ground truth for the perimeter of the entire fire.
GIS specialists constantly update fire perimeters as they get data from the field and the planes. Once a fire is contained, they create final maps to hand over to the local agencies or the Forest Service.
Photo: CAL FIRE
Most of the data that GIS specialists use to map fires comes from field observers and infrared (IR) thermal imagery. The data is collected by third-party contractors, by CAL FIRE’s Intel shift team, or by the FIRIS program by flying manned aircraft.
IR data and information collected by field observers are then uploaded into the National Incident Feature Service (NIFS) for GIS specialists to use to map fires.
Field observers download the maps onto their devices, go out into the field, and ground truth — physically walking the perimeter of the fire and using GPS on their devices to map the fire boundaries accurately.
Photo: CAL FIRE
Paper maps are good to have “just to get everybody on the same page without having to worry about battery life or the glare while you’re working out in the field,” said Rowland.
Along with online maps, the Interagency GIS teams print PDF maps for fire personnel in the field. The field observers use Esri ArcGIS Field Maps to record their tracks. They pair their mobile devices with Avenza or other geolocating applications.
Using ArcGIS Pro, GIS specialists create online maps and dashboards, which are then distributed in print and/or digitally to the agencies that need them, such as sheriff and police departments and departments of public works. The Interagency GIS teams create different map products for different end users. For example, it works with law enforcement to create evacuation maps and zones. Local public information officers also can distribute these maps or post them on their websites.
Photo: CAL FIRE
Crews also have online access to the maps through wildfire FTP (ftp.wildfire.gov). Crews load data and maps there that contain public information. Many agencies plug into the National Interagency Fire Center (NIFC), where the CAL FIRE team edits and analyzes mobile data.
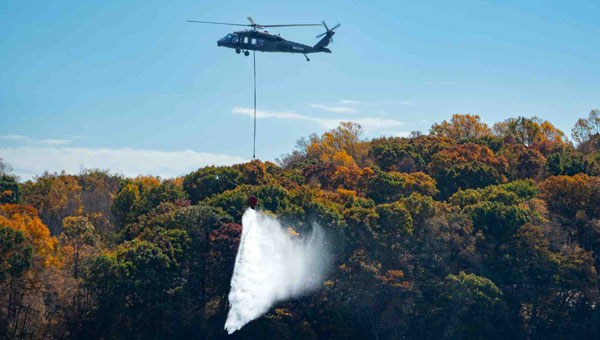
Sikorsky, a Lockheed Martin company, and Rain, a provider of autonomous aerial wildfire containment technology, successfully demonstrated how an autonomous Black Hawk helicopter can be commanded to take off, identify the location and size of a small fire and then accurately drop water to suppress the flames.
At Sikorsky headquarters in Stratford, Connecticut, the Rapid Wildfire Response Demonstration showcased the integration of Sikorsky’s MATRIX flight autonomy with Rain’s wildfire mission autonomy system to suppress a fire in its early stages.
Representatives from NASA, the Federal Emergency Management Agency (FEMA), the Defense Advanced Research Projects Agency (DARPA), the Los Angeles County Fire Department, the Orange County Fire Authority and the philanthropic and impact investment community witnessed the demonstration as part of a two-day wildlands firefighting meeting to discuss autonomy.
During the 30-minute flight demonstration, guests used a tablet to command the Black Hawk aircraft to take off, search for and find the fire and then drop water from a Bambi Bucket slung 60 ft beneath the aircraft. Each of three successive water drops extinguished a 12-inch-diameter propane-fueled fire ring emitting a 3-to-6-inch-tall flame, demonstrating the precision of the Rain fire perception and targeting capability. The Rain system also rapidly adjusted the flight path to account for an 8-to-10-knot crosswind during each water drop. Sikorsky safety pilots in the Black Hawk cockpit monitored the flight controls but were hands-off until the aircraft landed.
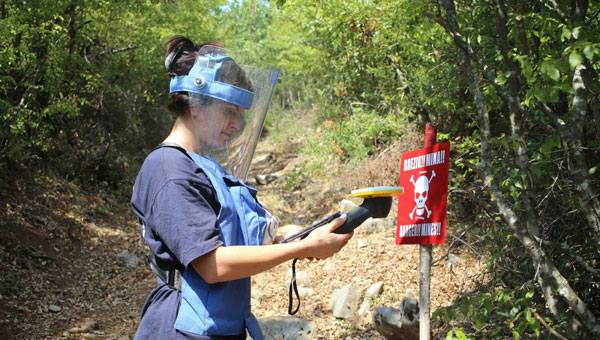
Trimble has expanded support for The HALO Trust, the world’s largest humanitarian landmine-clearance nonprofit organization. Trimble is donating an additional 175 Trimble Catalyst GNSS systems, including Trimble DA2 GNSS receivers, to help The HALO Trust further its demining operations worldwide.
Building on the impact of the ongoing collaboration, Trimble’s latest donation will support the expansion and productivity of The HALO Trust’s mine clearance teams. The Catalyst GNSS system provides The HALO Trust with a solution for deploying precise mapping capabilities to large field teams across broad geographic areas. More field teams can now be equipped with the necessary tools to safely and efficiently clear landmines, thereby accelerating the pace of landmine clearance globally.
Since receiving Trimble’s product donations and the Trimble Foundation Fund-directed grant, The HALO Trust has made significant progress in landmine and unexploded ordnance (UXO) clearance. From January to September 2024 alone, The HALO Trust cleared 802 minefields and battlefields, covering a total area of 10,400 acres across 12 war-torn countries. During this period, 31,209 landmines and other Explosive Remnants of War (ERW) were safely destroyed — all accurately mapped using the Trimble Catalyst GNSS system. The HALO Trust’s use of Trimble technology has significantly improved operational efficiency and provided essential data for safe land reclamation and development. According to The HALO Trust, the accuracy and reliability of Trimble’s technology have been crucial in ensuring the safety and success of demining operations in areas severely affected by conflict, such as Ukraine, Angola and Sri Lanka.
Hurricane Helene has caused widespread devastation across the southeastern United States, leaving a trail of destruction more than 500 miles long from Florida to the Carolinas. The storm made landfall at the Big Bend of Florida, on Sept. 26, 2024, as a Category 4 hurricane with sustained winds of 140 mph.
The death toll has risen to at least 215 across six states, with hundreds more still unaccounted for, reported ABC News. More than 4.5 million people initially lost power due to the hurricane, with more than two million residents still without electricity days after the storm. Utility companies face significant challenges in restoring power due to blocked and damaged roads. The storm’s destruction has rendered many essential roads and bridges impassable, complicating recovery efforts.
Role of GNSS in Recovery
GNSS plays a crucial role in disaster recovery operations. These systems provide essential positioning, navigation and timing (PNT) services critical for search and rescue efforts such as flood monitoring. GNSS technology enhances emergency services by enabling synchronized communication networks, providing precise location information and allowing for faster response times. With cell towers and electrical services down, GNSS empowers virtually all disaster recovery efforts.
Over the years, our reliance on GNSS has increased into an aspect of life we often overlook. Its importance is emphasized in times of disaster, PNT is critical.
A recent public safety announcement issued by the Space Force highlights that a critical component of any successful rescue operation is time. Knowing the precise location of landmarks, streets, buildings, emergency service resources and disaster relief sites reduces the time it takes to navigate challenging terrains to save lives. This information is critical to disaster relief teams and public safety personnel in order to protect life and reduce property loss. GPS serves as the fundamental technology in addressing these needs.
The United States Geological Survey (USGS) is also collecting flood data and repairing damaged streamgages to monitor water levels after Hurricane Helene.
USGS Mapping the Aftermath
As of Oct. 7, USGS provisional streamgage data indicates that at least 34 new flood records were set across the southeast from flooding caused by Helene. Eighteen of these provisional records were set in North Carolina, with six in Tennessee, six in South Carolina, three in Florida and one in Georgia.
In Newport, Tennessee, USGS field crews were able to measure high-water marks left behind by flood waters and determined the Pigeon River reached a provisional peak water level of 29.72 ft. The previous record on this river was 21.40 ft, set in 1902.
As communities begin the long process of rebuilding, they face numerous challenges, including limited resources, prolonged power outages and disrupted communication systems. However, GPS serves as a backbone in the recovery process, highlighting its significance in times of disaster. The full extent of Hurricane Helene’s impact is still being assessed, with authorities warning the death toll may continue to rise as search and rescue efforts progress.
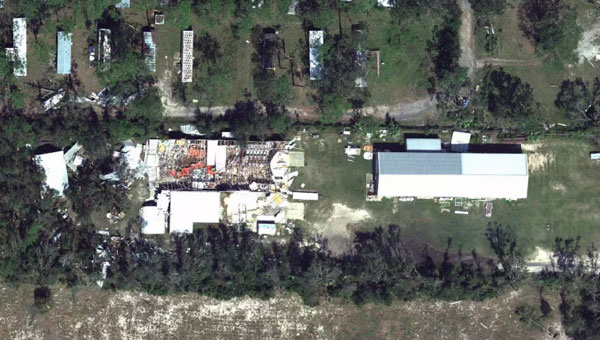
The National Oceanic and Atmospheric Administration (NOAA) has entered into a three-year Cooperative Research and Development Agreement (CRADA) with Verizon Frontline to refine the use of uncrewed aircraft systems (UAS) for assessing storm damage. This initiative aims to provide rapid and accurate damage assessments following severe weather events such as tornadoes and hurricanes.
Verizon Frontline will deploy its UAV technology to capture high-resolution imagery of areas affected by storms, providing crucial data to NOAA’s National Weather Service (NWS) and the National Severe Storms Laboratory. This imagery will assist in post-storm damage assessments and contribute to research aimed at understanding tornado behavior and improving severe weather warnings.
“Following a crisis, the initial imagery available is often from satellites, which may not offer the best resolution. Our goal with NOAA is to provide high-resolution imagery much faster, enhancing the support to emergency management and public safety agencies,” said Verizon Frontline Crisis Response Team member, Chris Sanders.
The collaboration represents a step forward in integrating modern technology into traditional environmental and emergency management practices, aiming to improve outcomes after natural disasters.
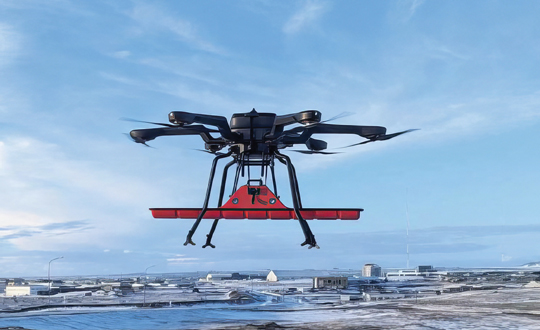
The Icelandic Road and Coastal Administration (IRCA) has commissioned the Dutch UAV manufacturer Acecore to map the extent and aftermath of the Eldvörp-Svartsengi volcanic system eruption using its high-end UAV solutions. Grindavík, a fishing village on the Reykjanes Peninsula in southwestern Iceland, has only recently welcomed residents home following a series of earthquakes. However, the area is still not completely at ease, with the latest reports saying that a nearby magma chamber could again erupt near the village.
Acecore’s new hybrid drone model. (Photo: Acecore)
“Acecore drones are particularly suitable for use under tough circumstances,” said Jorrit Linders, founder and CEO of Acecore, on the Dutch public-service radio station NPO Radio 1. “The drones can operate in severe weather conditions, such as wind force 7 or 8, temperatures well below zero and hail and snow showers. This is due to their robust frame, their strong design and the right components. The robust construction is produced entirely in the Netherlands. This, combined with a continuous flight time of 2.5 hours, is essential for projects such as the volcanic eruption in Iceland.”
Acecore has been mapping in the region near Grindavík for four weeks as of March 2024. The surveys were done not without challenges and risks, as they involved operating in areas that had not yet been declared safe. The high workload and poor weather conditions forced the on-site team to rotate every five to six days. Linders was able to train both Acecore employees and pilots working for The Icelandic authorities on how to properly conduct aerial surveys to collect the relevant data effectively.
Lava flowing down the main road toward Grindavík. (Photo: Acecore)
Acecore developed and deployed a hybrid version of its Noa UAV, which already was used by the Icelandic authorities. The gas-electric platform was able to achieve flight times of 132 minutes with the Radarteam Cobra ground penetrating radar (GPR) of 5.2kg. The Noa Hybrid UAV has liquid heat management for its gasoline boxer engine, making it highly capable of dealing with Icelandic temperatures of up to -12°C. It uses a dual antenna and dual-band GNSS high-precision receiver to accurately measure yaw using GPS, so as not to be affected by electromagnetic interference from power lines and metal structures while mapping the village.
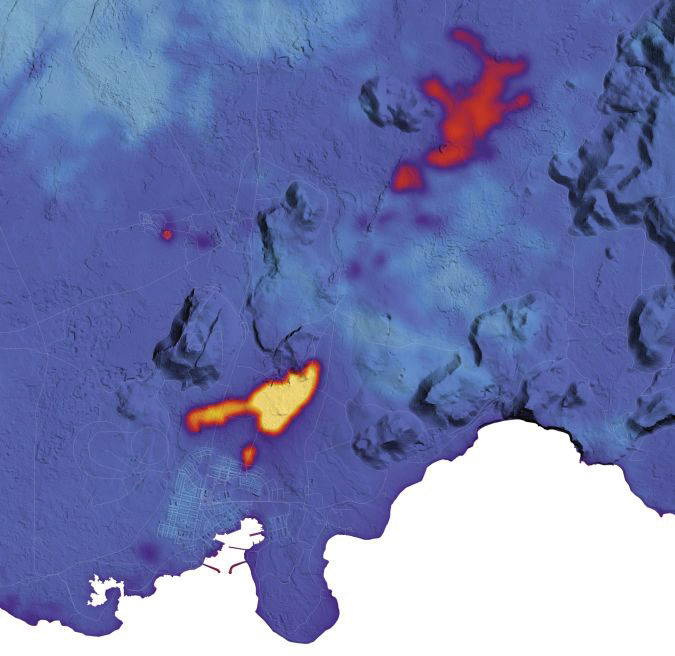
This map indicates the location and extent of recent activity using data acquired on January 16, 2024, by the TIRS-2 (Thermal Infrared Sensor 2) on the Landsat 9 satellite. The data is overlaid on a digital elevation model of the area. (Photo: NASA Earth Observatory/Lauren Dauphin, contains Landsat data from the USGS)
The UAV flights take off from fixed locations to perform their automated missions: scanning the affected area to collect all data needed by the Icelandic authorities. This involves data generated by a GPR sensor mounted under the UAV.
“We take a kind of X-ray of the ground as the basis for accurately mapping the subsidence and cracks,” explained Linders. “This then allows the Icelandic scientists to do a careful analysis of the area.” The GPR technology allows cracks to be scanned and underground fissures and shifts to be identified so scientists can predict where more eruptions are likely to occur and assess the safety of the location.”
The GPR technology allows cracks to be scanned and underground fissures and shifts to be identified so scientists can predict where more eruptions are likely to occur and assess the safety of the location.
The ongoing efforts in Iceland are a testament to Acecore Technologies’ dedication to pushing the boundaries of what is possible with UAVs. As they continue to map the area around Grindavik, their expertise and technology are not just tools for assessment but also a sign of hope for a community looking toward recovery. There is more work to be done, said Acecore’s Youri van Helden, “We haven’t put our snow boots in storage yet.”
Hexagon’s Safety, Infrastructure & Geospatial division has partnered with Pitkin County Regional Emergency Dispatch Center to upgrade its digital mapping and response for 911 calls in Colorado’s premier mountain tourist destination. The partnership aims to make the county safer for residents and visitors.
By using HxGN Connect software, Pitkin County can bring modern mapping capabilities to its computer-aided dispatch (CAD) system, as well as incorporate Smart Advisor, Hexagon’s assistive artificial intelligence solution.
Pitkin County, home of Aspen and its four major ski areas, hosts 1.5 million tourists per year. The upgrades will improve emergency response capabilities for major events such as the X Games and JAS Aspen music festival, the company says.
The cloud-based solution, hosted in Microsoft Azure, is designed to map 911 calls and conduct long-term resource planning. Smart Advisor will work in the background to help dispatchers and first responders connect related incidents and provide geofencing to concentrate resources on large events. Officials plan to expand the system to take advantage of its cross-organization collaboration capabilities by potentially linking the county’s CAD system with the fire department’s network of mountaintop smoke detectors and the Department of Public Works’ snowplows.
Pitkin County dispatchers will use HxGN Connect for digital mapping within its CAD system in the mountainous tourist destination.
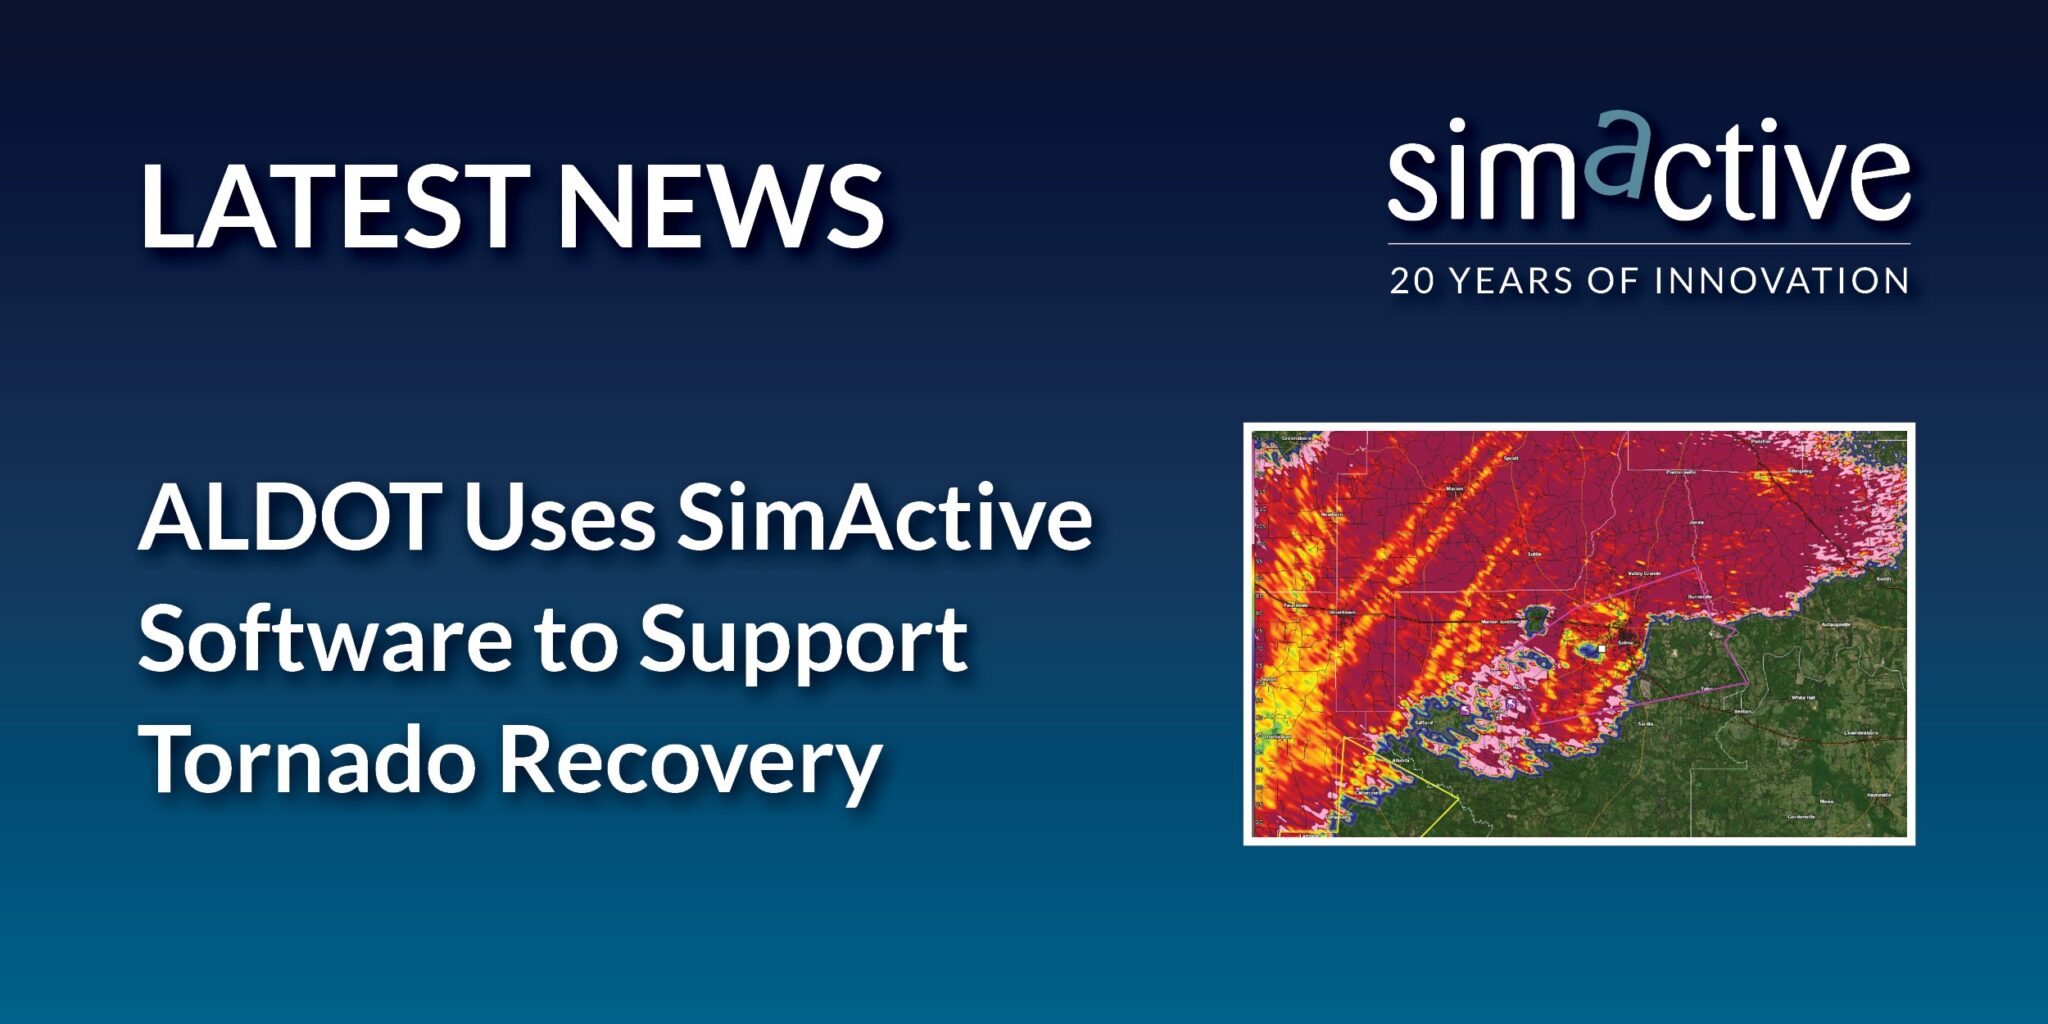
SimActive Inc., a developer of photogrammetry software, and the Alabama Department of Transportation (ALDOT) have partnered to use SimActive’s Correlator3D software to process UAV imagery for damage assessment.
In early 2023, a powerful tornado ripped through the southwest portion of the city of Selma, Alabama. ALDOT quickly collected more than 18,000 images of the area. The SimActive software allowed the team to process the data within 24 hours and deliver digital surface models and orthomosaics.
Correlator3D is an end-to-end photogrammetry solution designed to generate high-quality geospatial data from satellite and aerial imagery, including UAVs. The software performs aerial triangulation (AT) and produces dense digital surface models (DSM), digital terrain models (DTM), point clouds, orthomosaics, 3D models and vectorized 3D features.
Powered by graphics processing unit (GPU) technology and multi-core central processing units (CPU), Correlator3D offers enhanced processing speed to support the quick and efficient production of large datasets.
It is no secret that the world has been burning for months. Devastating wildfires have encompassed Greece, Canada, the United States, and other parts of the world. These wildfires have incinerated entire communities, taken lives, and has had disastrous environmental effects. This wildfire outbreak can be attributed to several factors, but mainly the global climate crisis.
Why are these wildfires a monumental problem?
Widespread wildfires displace of thousands of people from their homes, raze entire communities and cities, wipe out farmland and other essential resources, create horrific air pollution — that causes inflammation of lung tissue and increases vulnerability to infections — and many other devastating effects.
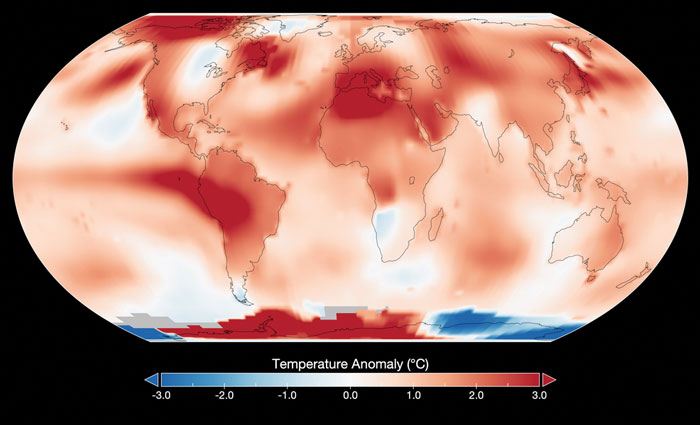
Image: NASA
As reported by NASA, July has been the hottest month on record since the 1880’s. This has caused extreme dry conditions that are ideal for wildfire outbreaks, among other natural disasters.
Image: NASA
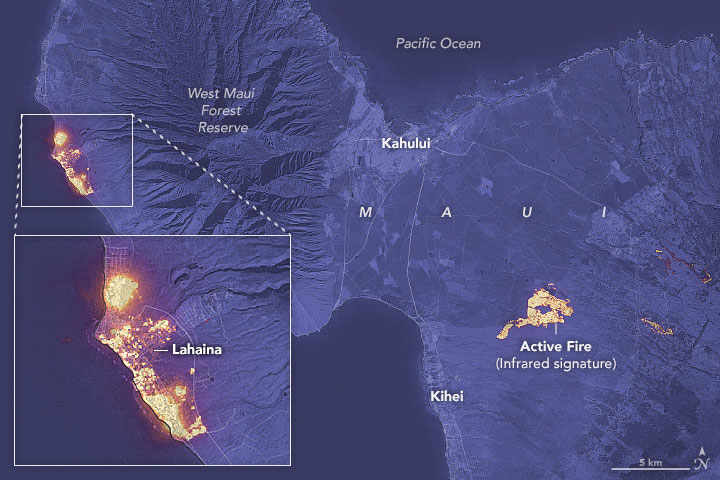
Flames engulfed parts of Hawaii the morning of Wednesday, August 9, which destroyed a centuries-old town and killing at least 106 people as of August 16. The wildfires took natives and tourists on the island by surprise. Residents and tourists were forced to evacuate the area – including some who reportedly jumped into the ocean to escape the flames. The National Weather Service stated the combination of high winds and low humidity is what caused the dangerous fire conditions across the island. The devastating fire left behind burned-out cars on once busy streets and smoking piles of debris where historic buildings once stood.
Image: Screenshot of BBC video
The Greece wildfires swept across the island of Rhodes, Corfu and Evia in July, creating thick clouds of smoke and forcing thousands of people the evacuate. These fires were caused by several human imposed factors such as campfires, arson and sheer negligence. However, the deadly heatwave that scorched Europe this summer — caused by carbon emissions — has not helped prevent the start and spread of these wildfires.
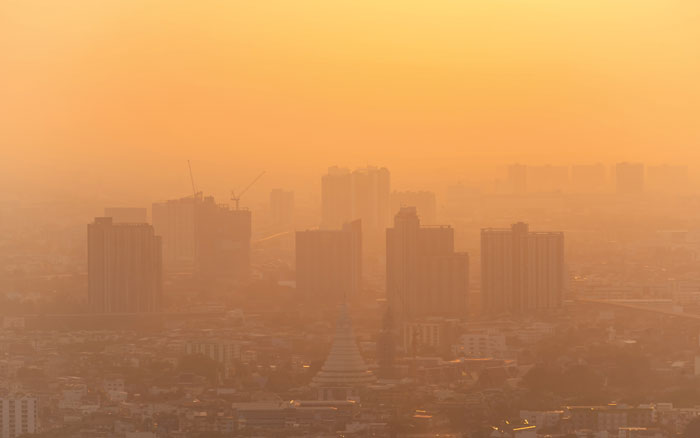
The Air Quality Index (AQI) measures the density of five pollutants: ground-level ozone, particulates, carbon monoxide, nitrogen dioxide, and sulfur dioxide. It was originally established by the Environmental Protection Agency to communicate the cleanliness of the air Americans are breathing every day. The index runs from zero to 500 — the higher the number the more polluted the air is. Effects of air pollution can range from mild symptoms, such as eye and throat irritation, to serious ones such as heart and respiratory issues. Pollution can cause inflammation of the lung tissue and increase the vulnerability to infections.
During wildfires, fine particles in the soot, ash and dust can fill the air.The AQI identifies the concentration of particles smaller in diameter than 2.5 μM. When these particles are inhaled, the tiny specks can increase the risk of heart attacks, cancer, and respiratory infections — especially in children and older adults.
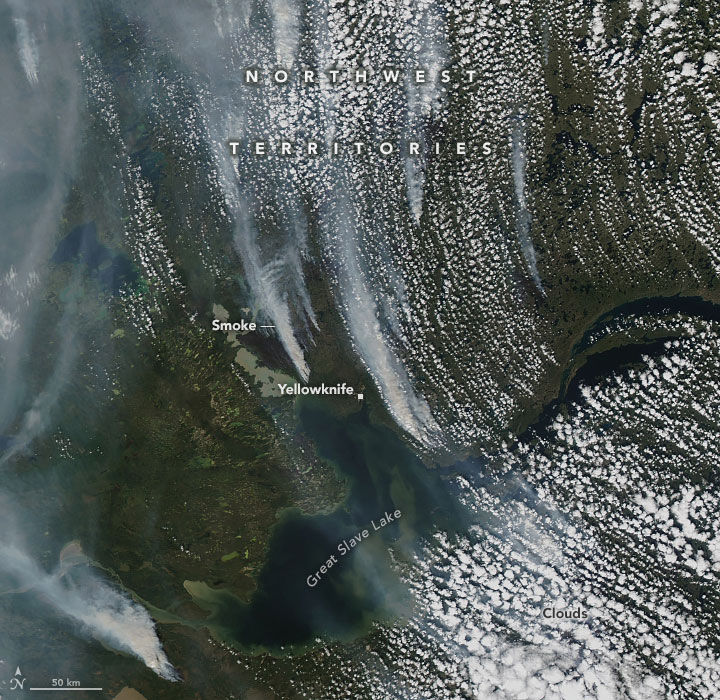
Image: NASA
Based on data from the Canadian Interagency Forest Fire Centre, there are 1037 active fires in Canada: 652 are out of control, 161 are being held in place, and 224 are under control as of August 23. Many of these fires were caused by lightning; however, with above-average temperatures this year and dry conditions, wildfires have been breaking out in Canada since May.
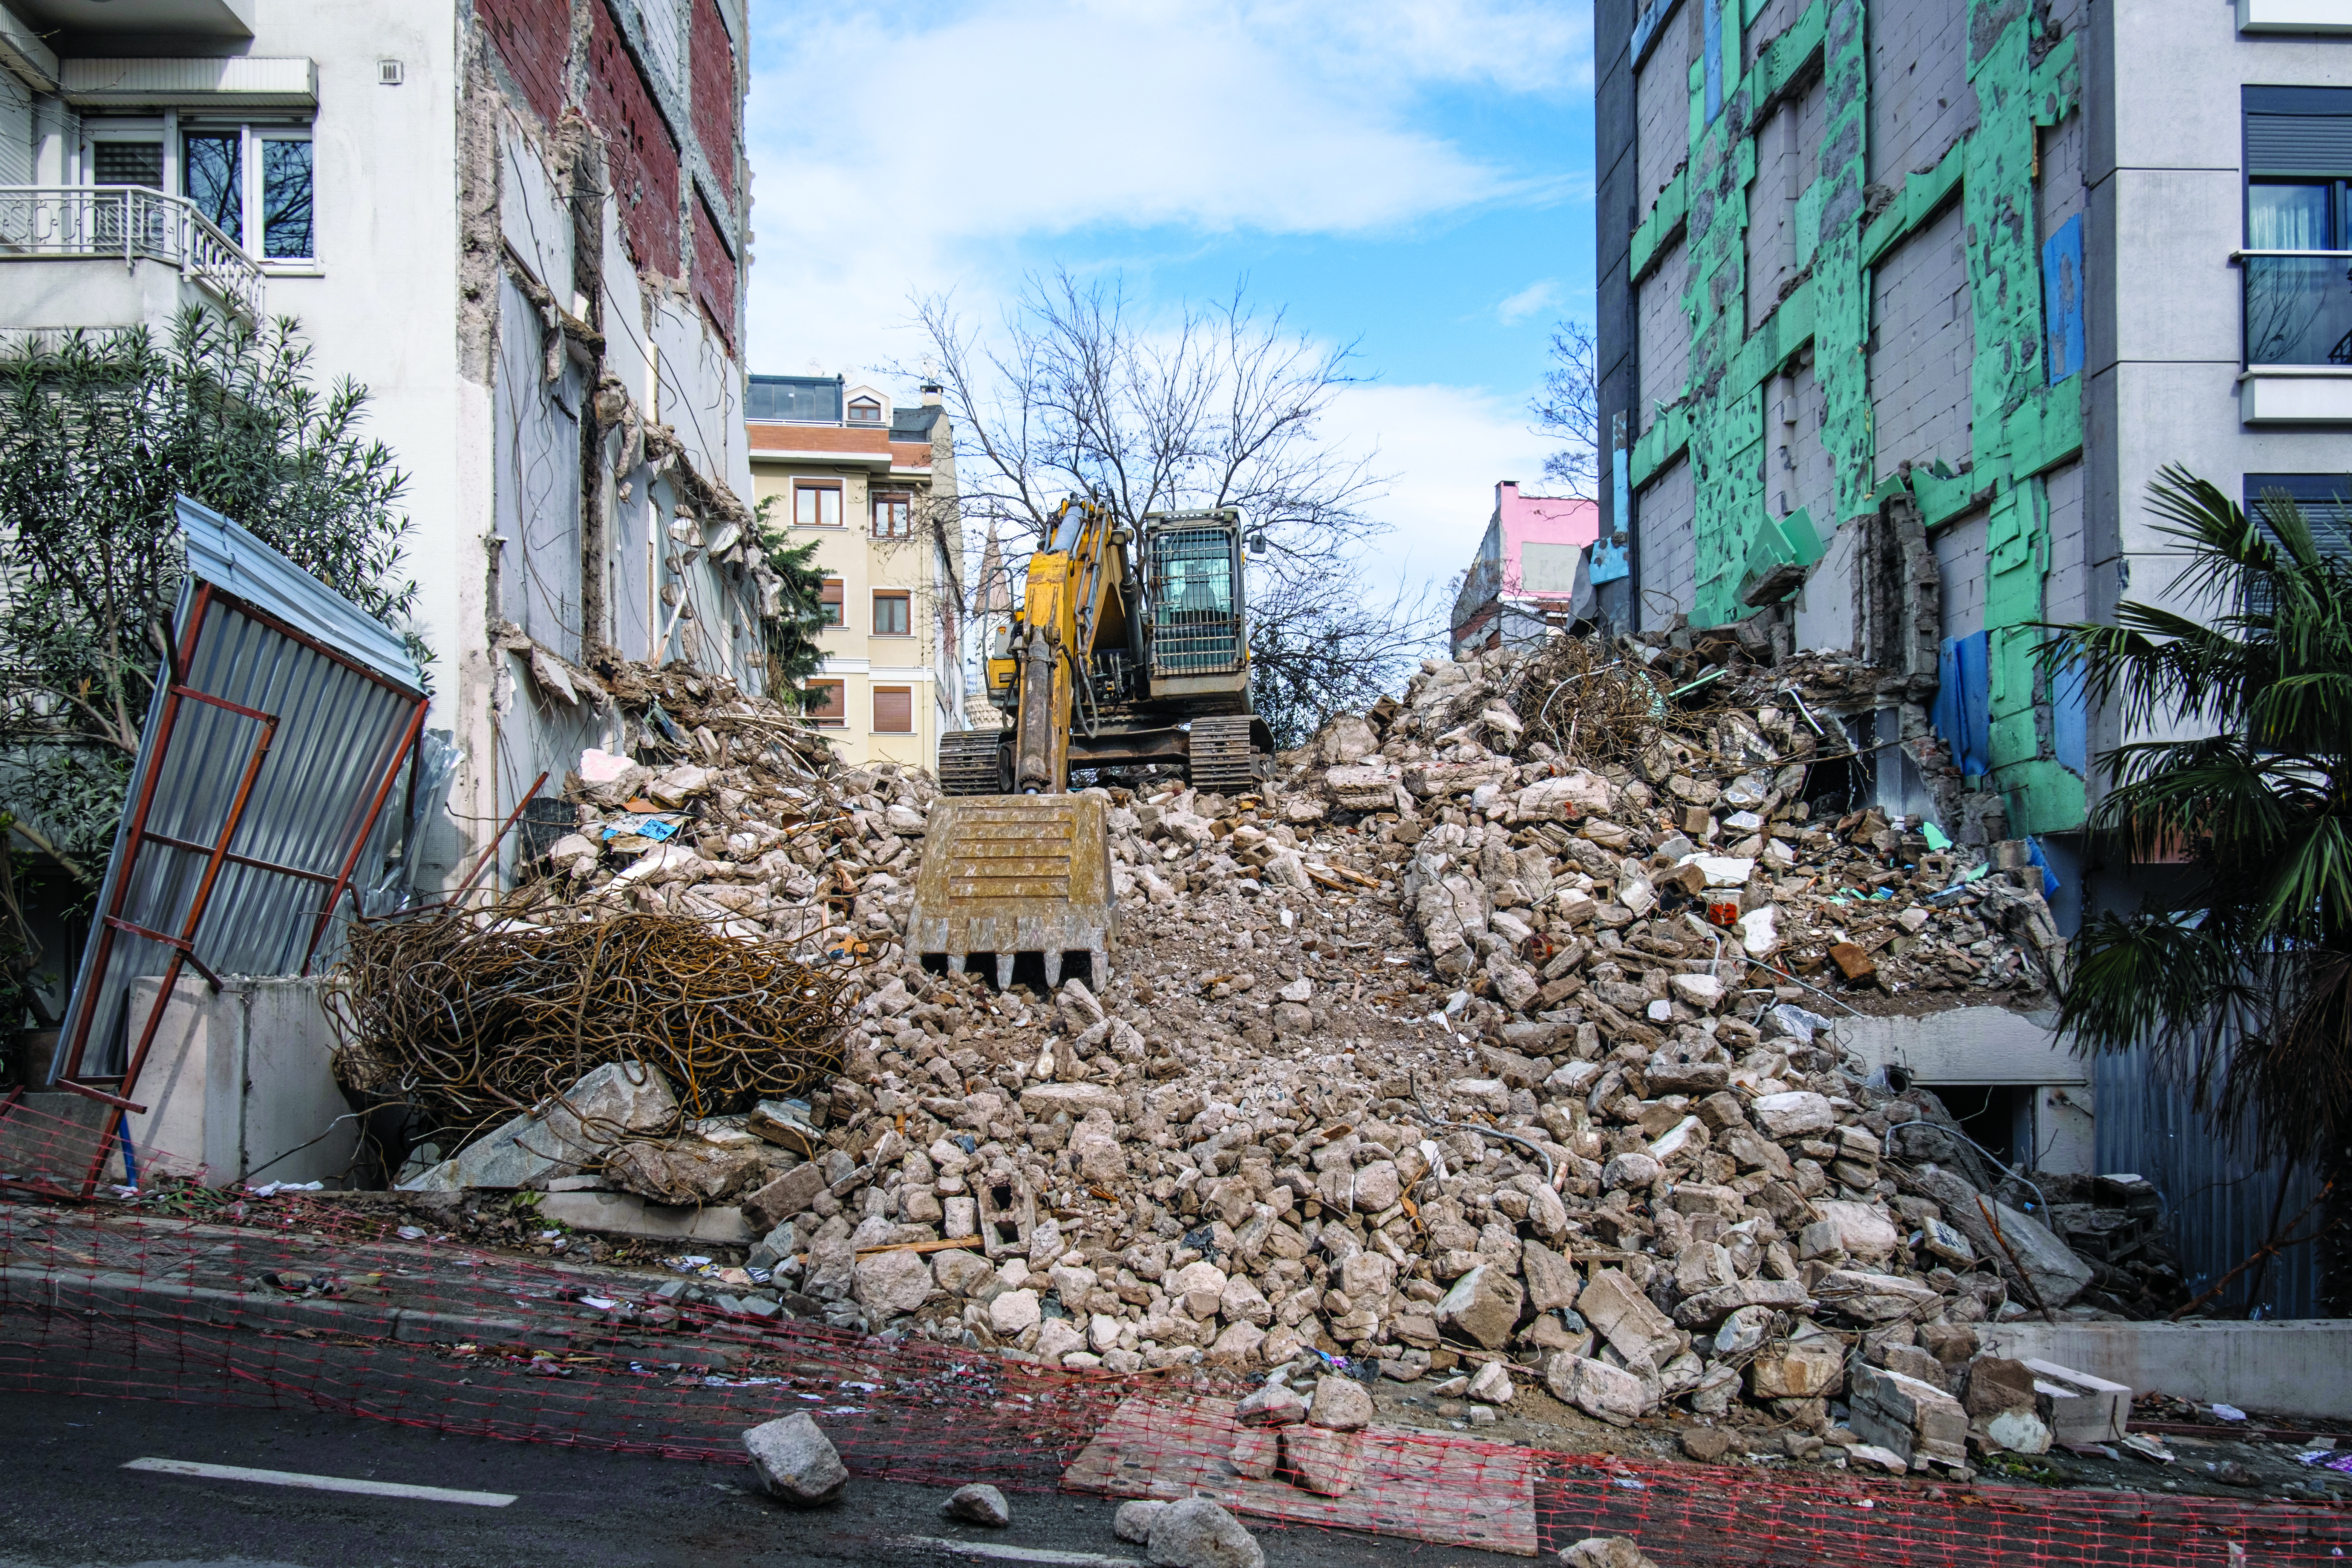
On Feb. 6, a magnitude 7.8 earthquake struck Turkiye and northern Syria creating enormous damage throughout both countries. (Image: mustafaoncul/iStock /Getty Images Plus/Getty Images)
Geographical information of urban areas is critical because it forms the basis for planning, intelligent urban modeling and disaster mapping and management. For many decades, ground surveys and aerial photographs were used as the primary tools for collecting this data. Starting in the 1990s, these methods were replaced by such advanced remote-sensing technologies as synthetic aperture radar (SAR) and ground-based interferometric radar (GBIR).
This article explores the use of software-defined radio (SDR) platforms for acquiring high-resolution SAR/GBIR images, including:
How low-cost commercial-off-the-shelf SDR platforms can be used to realize complex systems for acquiring images and processing measurements.
How different specifications of SDRs make them suitable for use in SAR applications.
Hazard Monitoring in Urban Areas
Many urban areas and critical infrastructure are in regions highly prone to natural disasters such as volcano eruptions, earthquakes, avalanches and landslides, or near man-made systems such as dams and quarries. Monitoring of surface changes and structures is integral to the mitigation of risk and ensuring public safety. Modern remote-monitoring systems allow surface displacements to be monitored without the need to access a location. With these systems, several square kilometers of Earth’s surface can be monitored at once and with high accuracy. The sub-millimeter accuracy of modern remote-monitoring technologies enables accurate measurements to be collected with impressive precision, including in rainy and foggy conditions.
Remote-monitoring systems are autonomous and can operate for a long time without human intervention. Their real-time feedback makes them suitable for use as early-warning systems. In addition, these monitoring systems can be integrated into a wide range of sub-systems, such as decision support systems that assist decision makers in assessing emergency plans and selecting the best options.
Using Radar to Measure
Details of the surface observed by a SAR satellite are encoded in the amplitude and phase of a SAR image. The amplitude component contains information about the surface roughness and terrain slope of the target area, while the phase component contains information about the elevation of the satellite.
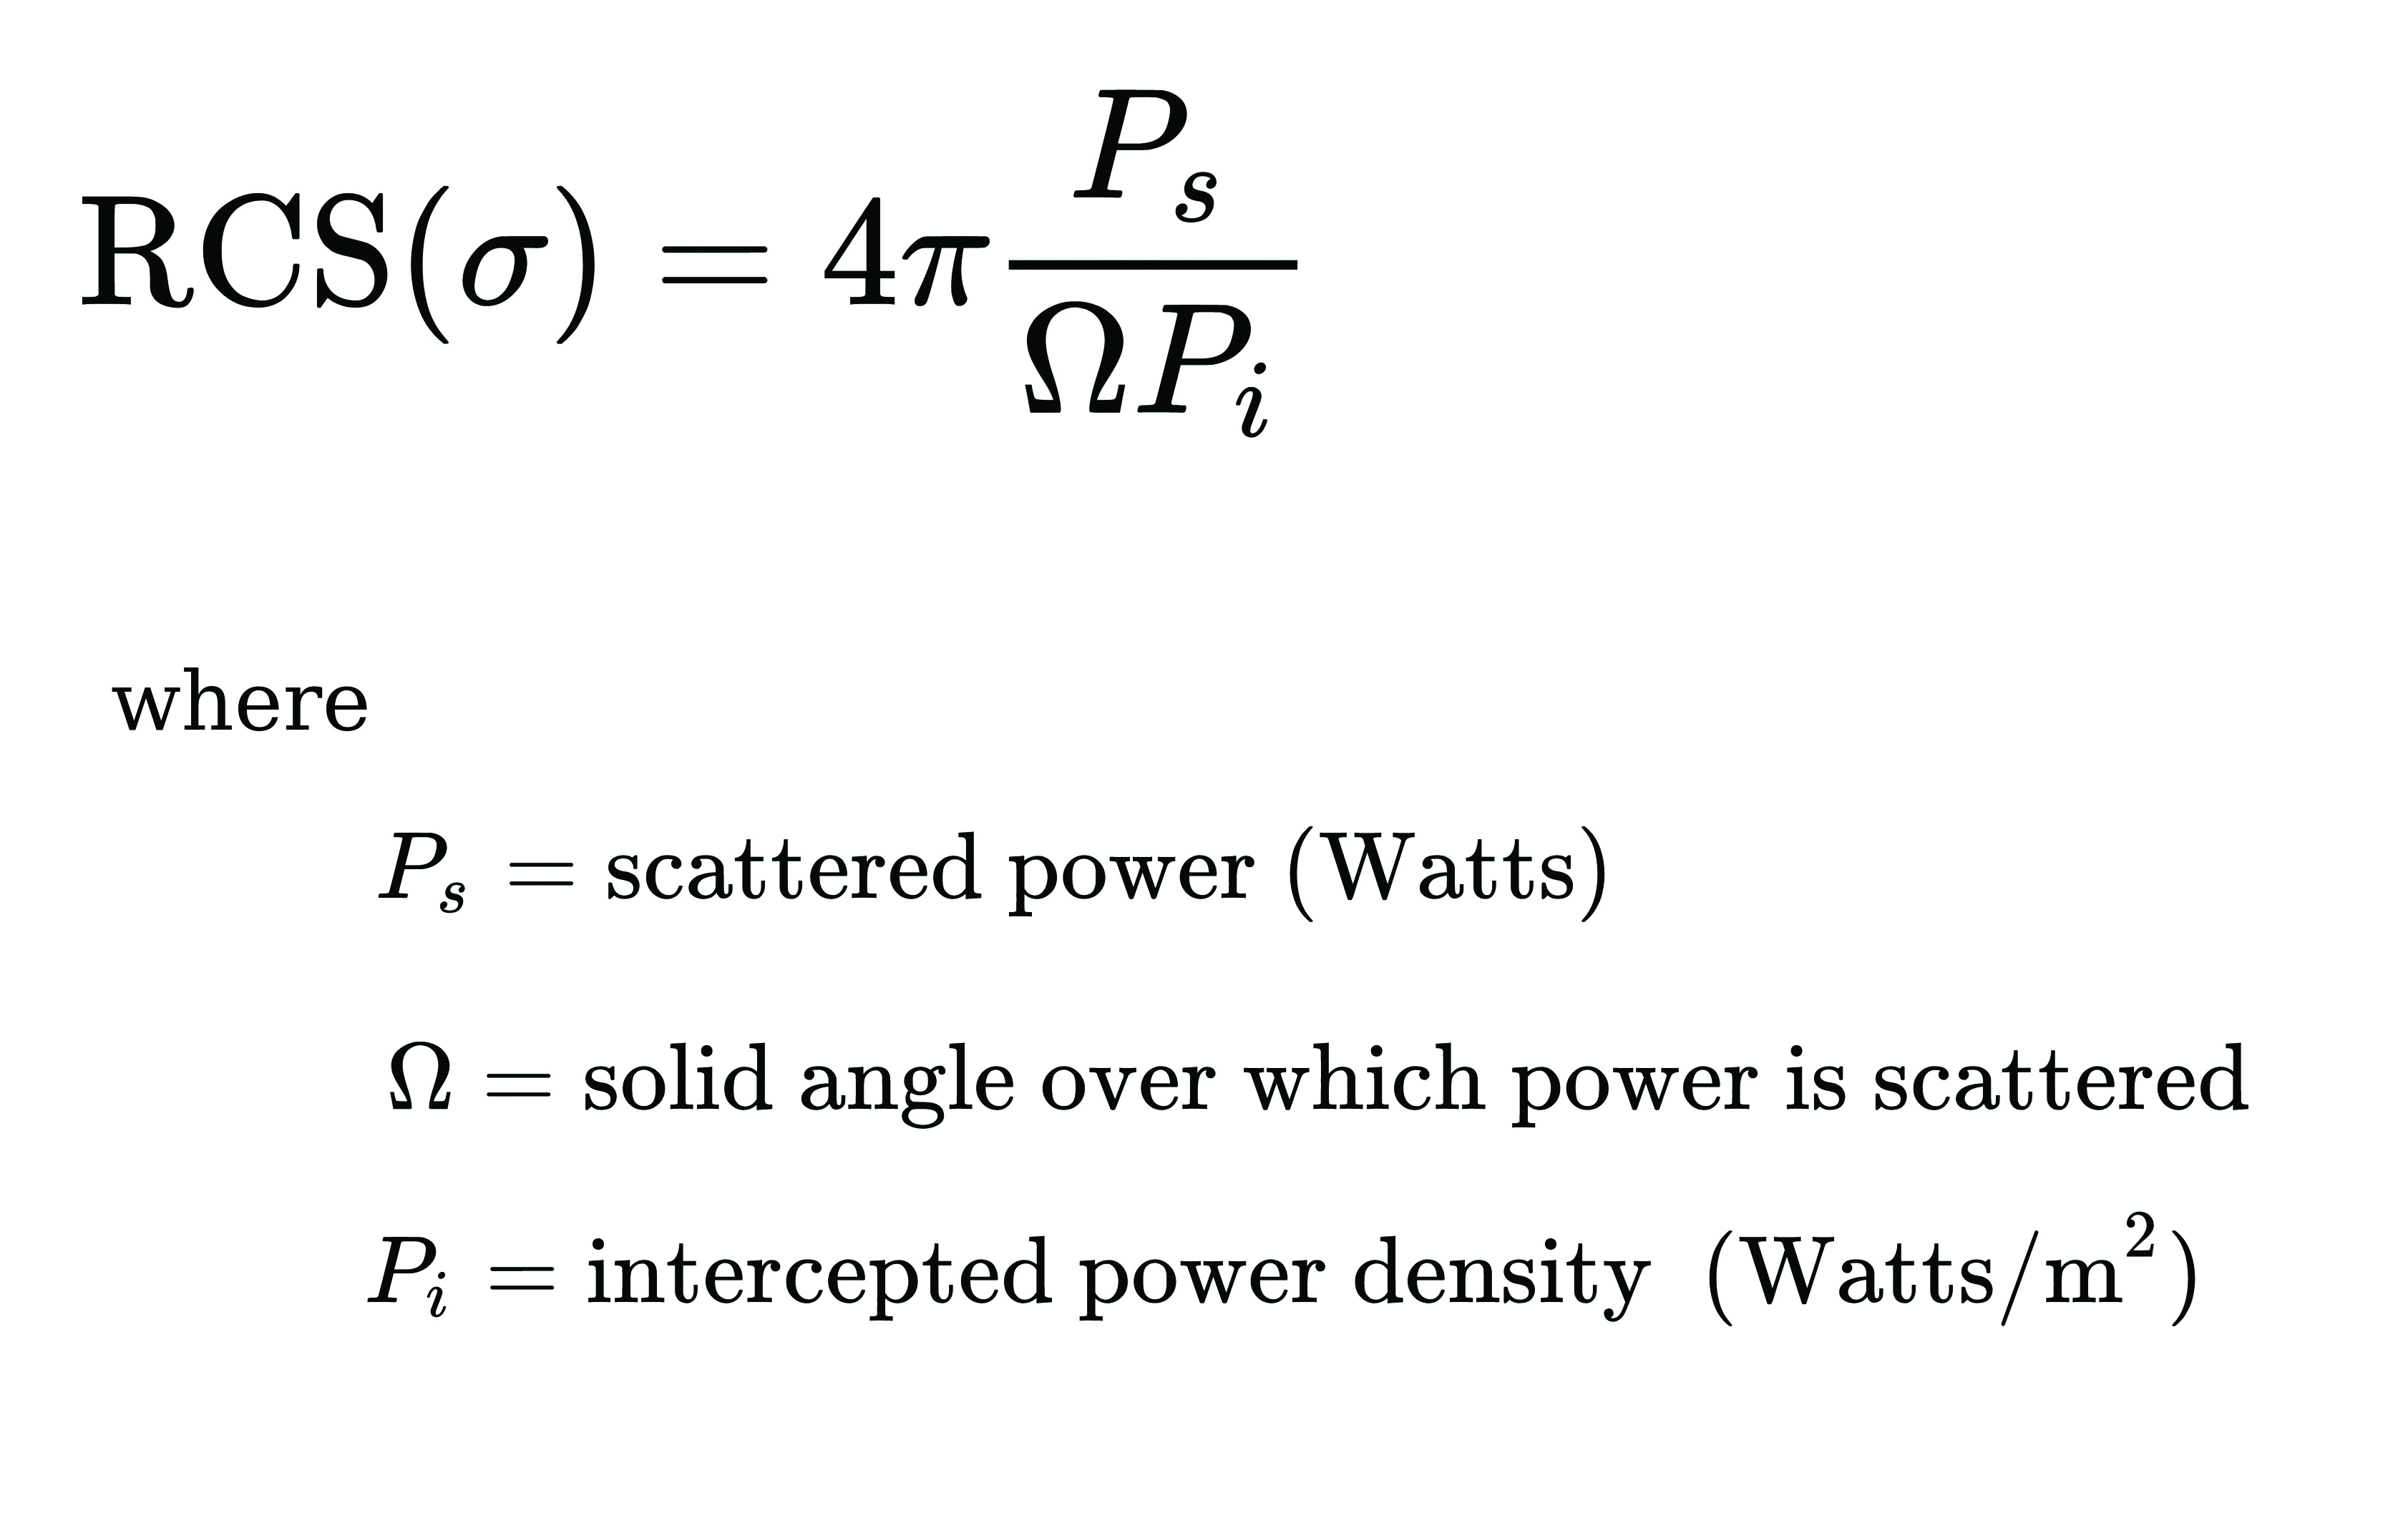
A typical SAR satellite transmits microwave signals toward a target area at an oblique angle and measures the backscattered signal. The intensity of the reflected signal is mainly determined by the roughness and the structure of the target, and the distance between the satellite and the target. This measurement is usually described in terms of the radar cross-section (RCS) parameter, which is obtained by calculating the ratio of the scattered to the intercepted signals as shown in this equation:
The RCS parameter is mainly dependent on the surface roughness and the dielectric properties of the target object.
The interferometric SAR (InSAR) technique allows surface movements to be identified. These observations also can be used to measure and monitor changes associated with volcanic eruptions, tectonic activity and other geophysical processes. To identify crustal changes using this geodetic technique, at least two SAR images are required.
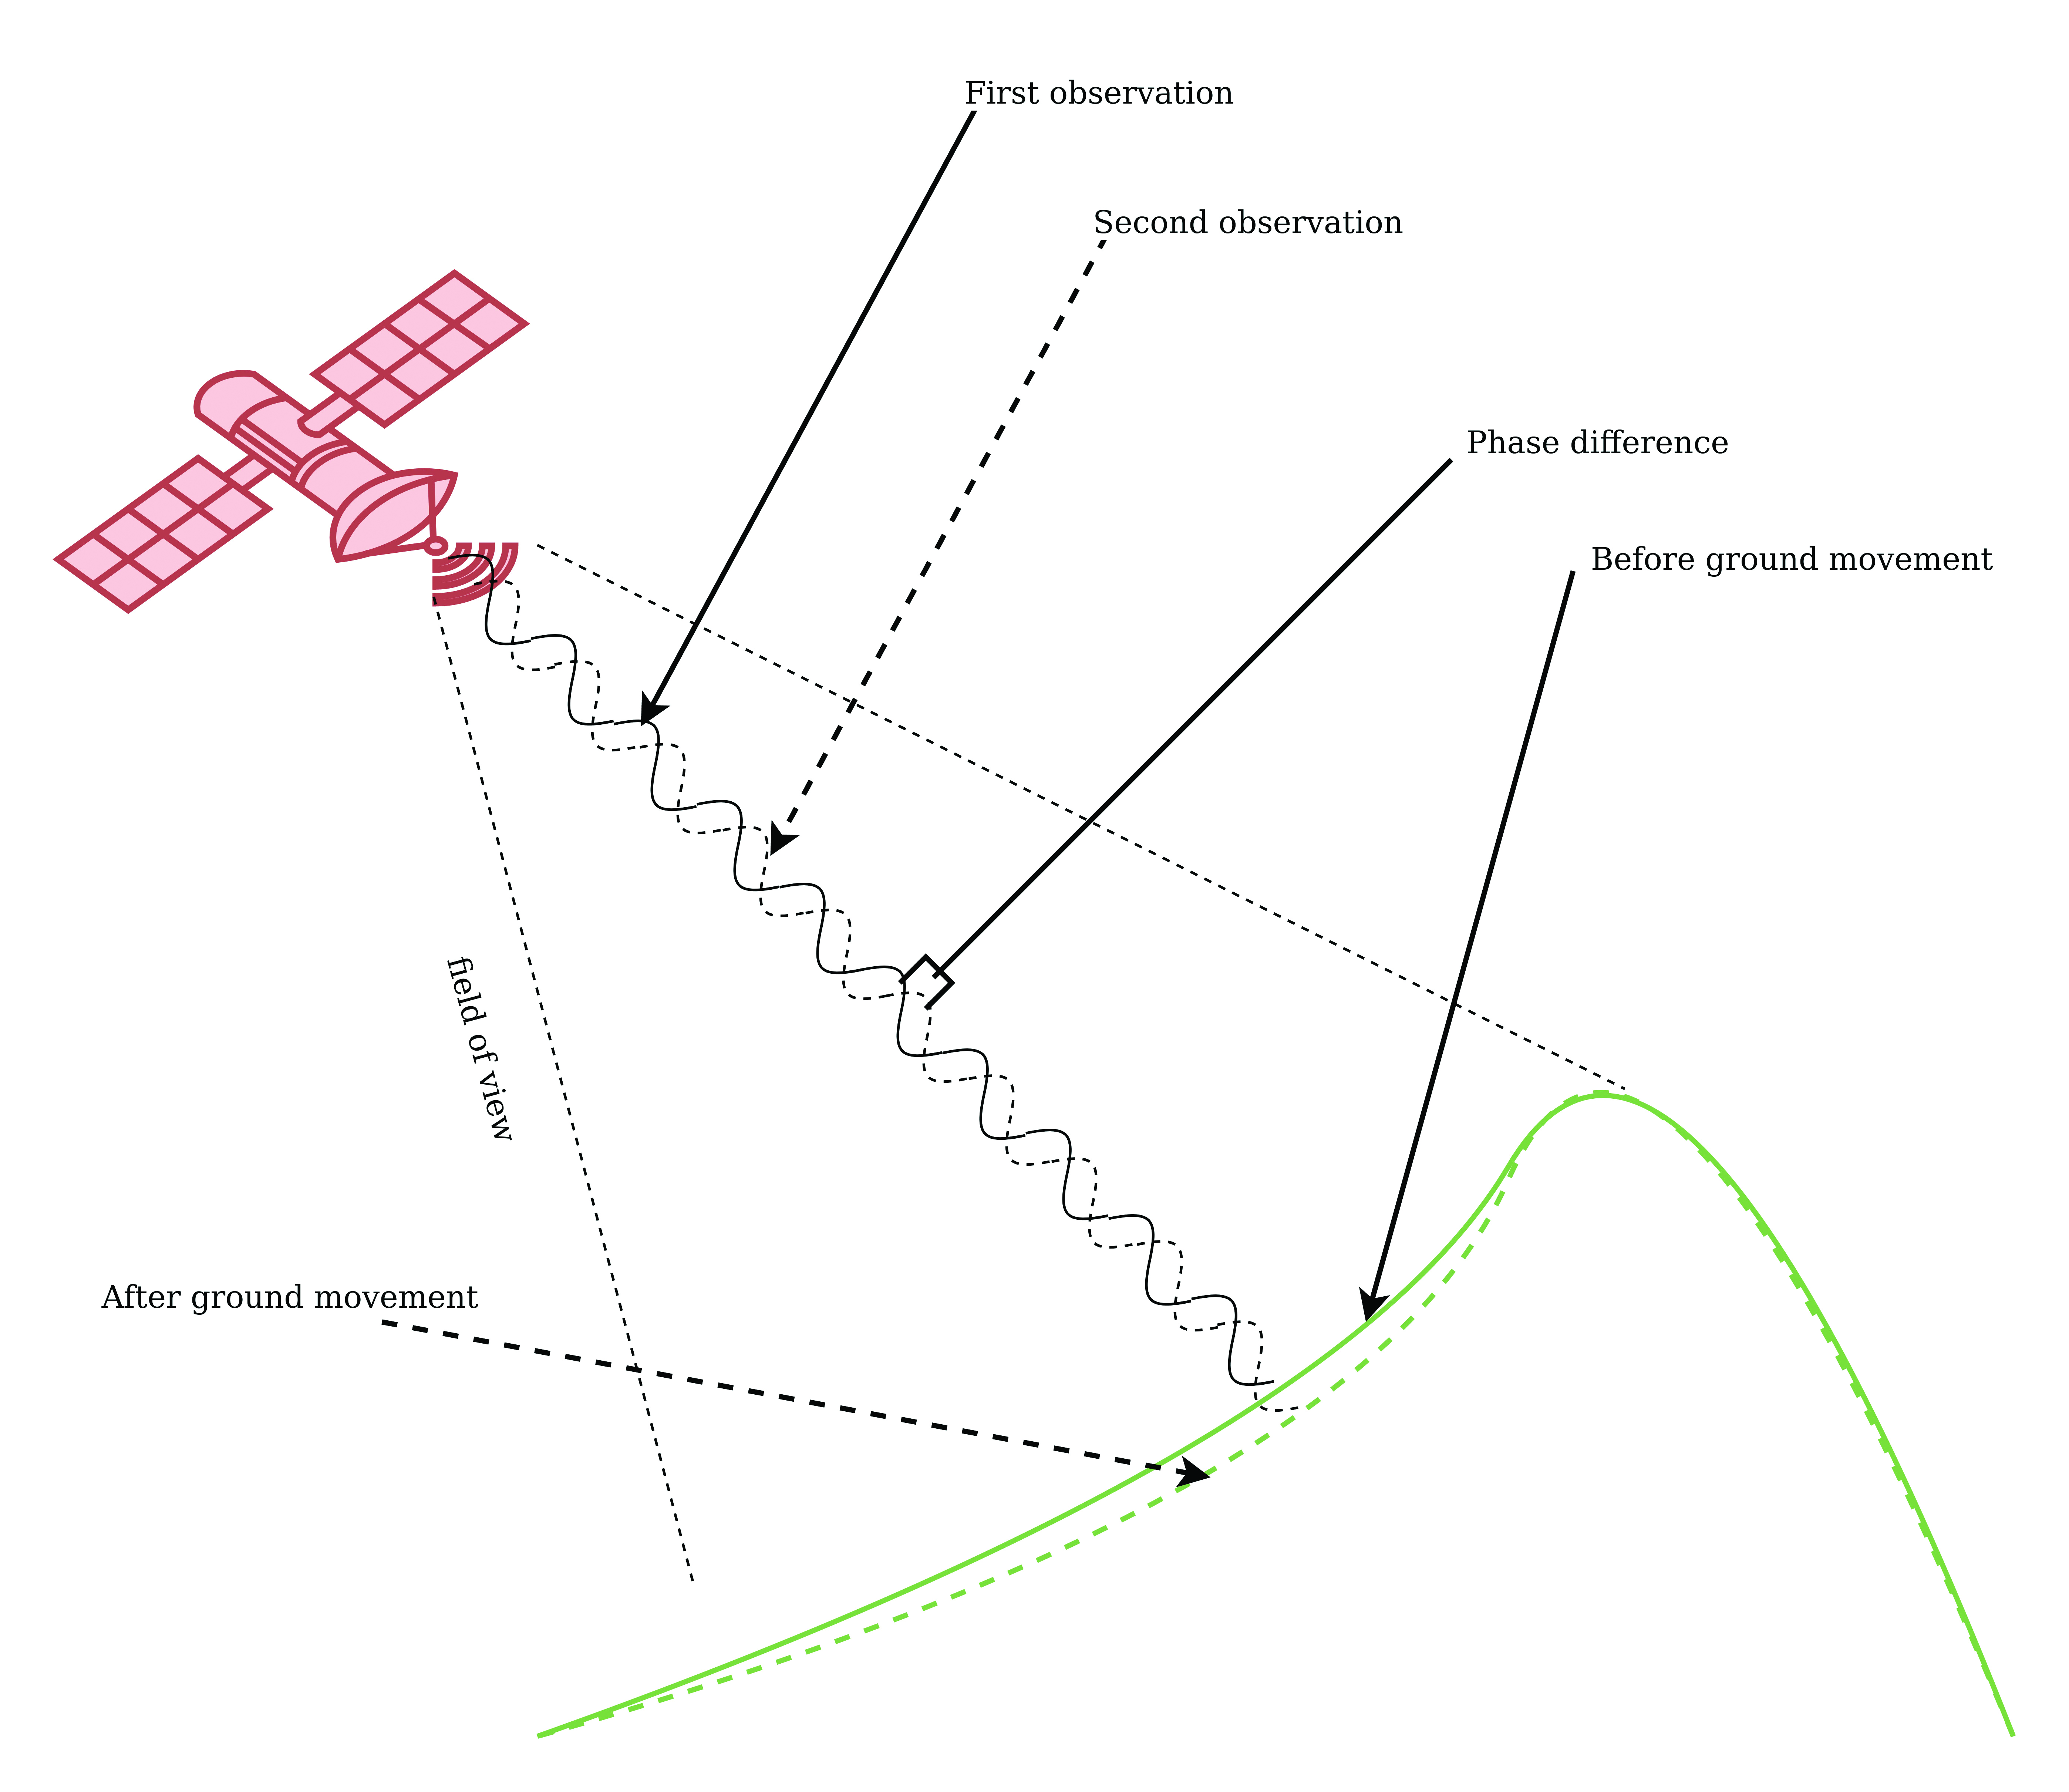
Figure 1. Phase shift in InSAR observations due to ground movement. (Image: Simon Ndiritu)
In differential InSAR, two images of the same location that are recorded at different times are used. If a surface movement has occurred between the first and the second acquisition, a phase shift is observed (Figure 1). The presence of interference fringes on an interferogram is an indicator of a phase shift and these fringes are summed during processing to provide a relative value of the phase change.
Ground-based SAR (GBSAR) employs the synthetic aperture radar technique to capture high-resolution images of the electromagnetic reflectivity of a target. This remote-sensing system is commonly used for monitoring civil infrastructure, buildings, mines, landslides, glaciers and more. While spaceborne SAR is capable of surveying large areas and records data over long periods of time, usually several weeks or months, GBSAR is suitable for monitoring small areas and has short sampling periods, usually a few minutes. In most surveying applications, the two remote-monitoring techniques are used together in a complementary fashion to enhance the overall performance.
The all-weather monitoring capability of satellite-based SAR makes it a popular tool for natural disaster management. Since the launch of the first SAR satellite in 1991, this technology has provided many emergency response teams with important insights on manmade and natural hazards. SAR data can be used to study different aspects of long-term behaviors of slow-moving surfaces, which is critical for planning emergency response to natural hazards such as volcanic eruptions, landslides and avalanches. SAR satellites orbit Earth at altitudes of between 500 km and 800 km and operate in the C-band (5 GHz to 6 GHz), X-band (8 GHz to 12 GHz) and L-band (1 GHz to 2 GHz). The temporal resolution of these satellites is mainly determined by their revisit periods.
Software-Defined Radio Platforms
A typical SDR platform features a radio front end (RFE) and a digital back end, with the RFE performing receive (Rx) and transmit (Tx) functions and offering a wide tuning range, typically 0 GHz to 18 GHz. This range is acceptable for widely used bands in SAR applications, including L-band, C-band and X-band.
The digital back end of a high-performance SDR system features a field programmable gate array (FPGA). This FPGA offers a variety of digital signal processing (DSP) capabilities, including upconverting, downconverting, modulation and demodulation. In addition, an SDR platform offers multiple transmit and receive channels, making it suitable for implementing multi-in multi-out (MIMO) radar systems.
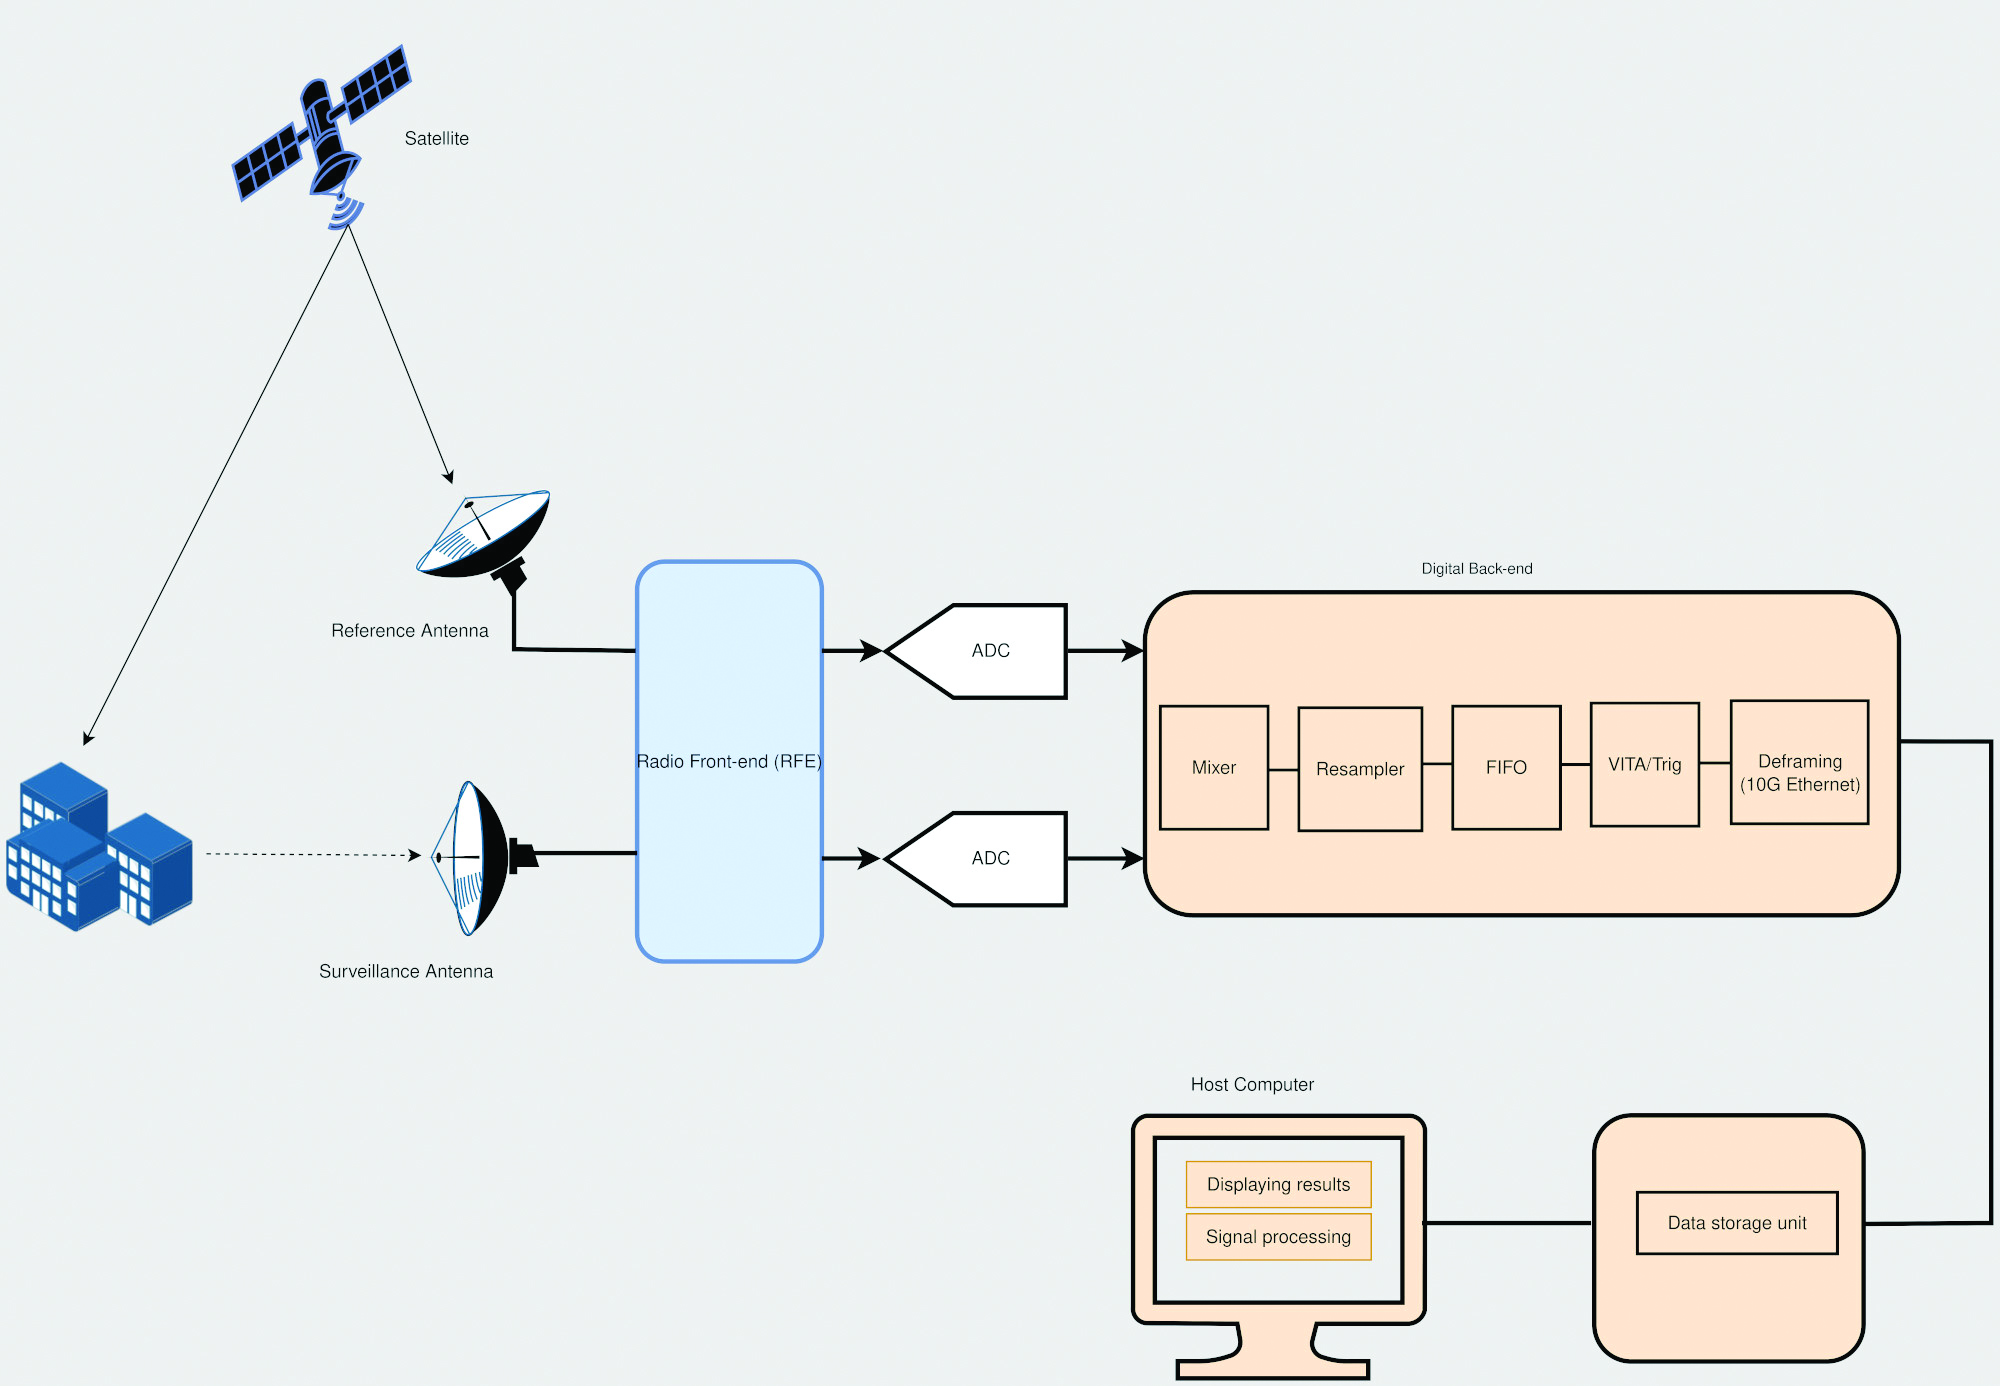
The architecture of SDR platforms allows them to integrate easily with a wide range of complex systems, such as SAR systems. The reconfigurability of SDRs allows upgrades and updates to be implemented without modifying the existing hardware, and can be designed to meet the size, weight and power (SWaP) requirements of an application. These features make SDRs suitable for implementing custom SAR monitoring solutions in small and large ground stations (Figure 2).
Figure 2. A simplified diagram of an SDR-based SAR system is shown, which employs a mobile-transmitter fixed-receiver passive bistatic SAR (MF-PB-SAR) architecture. (Image: Simon Ndiritu)
Integrating SDRs with SAR
A software-defined radar (SDRadar) is an SDR-based radar system that offers high flexibility and robustness. Compared to conventional radar, SDRadar offers many benefits, including the opportunity to reuse hardware, develop multi-function radar solutions, achieve faster development cycles, and have easier implementation of updates and new algorithms.
Tests with prototype SDR-based GBSAR systems have revealed the strong potential of SDR-based implementations. The MIMO architecture of an SDR platform allows realization of complex multi-frequency GBSAR systems uniquely suited for measuring displacement and other geophysical characteristics of landforms. SDR-based GBSAR systems can operate in different frequency bands and offer unmatched flexibility when it comes to signal generation and digital signal processing.
Many prototypes of airborne/satellite SAR systems based on SDR platforms have been implemented and their performance evaluated. Results have shown that they can offer better performance compared to conventional implementations. The use of multiple independent channels by SDR platforms allows the realization of compact and power-efficient multimode SAR systems, while the architecture of an SDR platform allows complex signal processing techniques such as digital beamforming (DBF), null steering and direction of arrival estimation to be implemented on FPGA.
Benefits of Integrating SDRs with SAR Solutions
Integrating SDRs into SAR systems provides many benefits. The MIMO architecture of SDR systems provides more channels than are required for SAR functions. The extra channels can be used for other applications such as satellite communications during emergencies. The wide frequency-tuning range of an SDR system allows the realization of a multi-function system with applications using different frequency bands. The reconfigurability of SDR platforms allows them to be repurposed for other applications. In addition, this reconfigurability enhances reusability, scalability and power efficiency. The low-latency FPGAs in high-performance SDR systems allow the realization of ultra-high-speed DSP algorithms for use in image processing and DBF.
Conclusion
The reconfigurability and impressive performance features of SDR platforms make them ideal for implementing scalable and flexible SAR monitoring systems for measuring land changes. The wide tuning range and MIMO architecture of SDR devices allows realization of a multi-function and multi-frequency system using a single device. In addition, the reconfigurability of SDR devices allows hardware reuse and low-cost implementation of updates and new algorithms.
Brendon McHugh is the field application engineer and technical writer at Per Vices. He possesses a degree in theoretical and mathematical physics from the University of Toronto.
Simon Ndiritu is an independent technical writer for Per Vices with a background in electrical and electronic engineer with a wealth of experience in designing hardware and firmware. He also has a passion for writing.
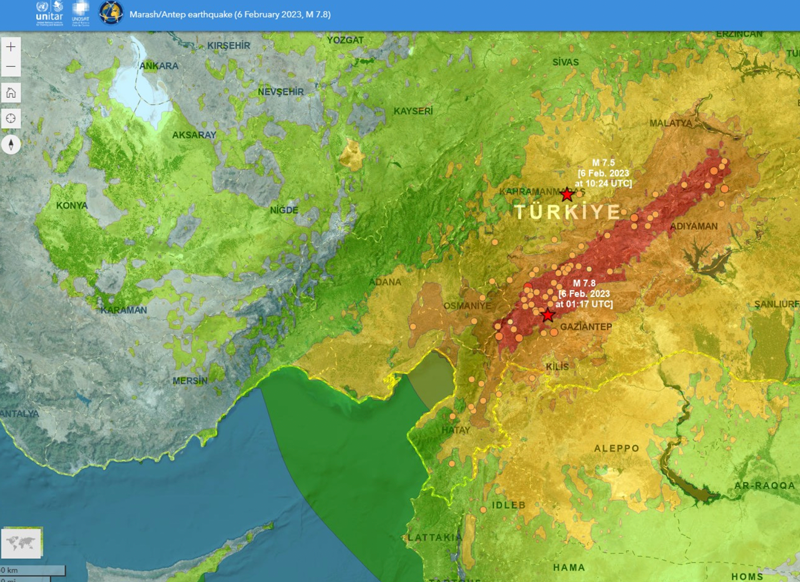
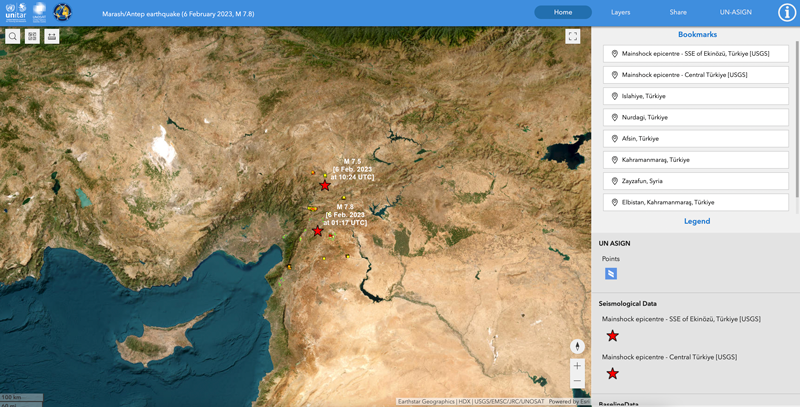
On Feb. 6, the United Nations Satellite Center (UNOSAT) announced via Twitter that it had activated emergency mapping services of Turkiye and northern Syria after the magnitude 7.8 earthquake hit earlier that day. The satellite images provide an overview of the damage, which can be used for humanitarian efforts and disaster relief, reported Space.com.
UNOSAT provides emergency mapping services, upon request, to provide satellite imagery analysis during emergencies and disasters. The maps show infrastructure that has been damaged during an emergency, which can then be used to provide relief by disaster response groups.
The impact of the earthquakes was significant and ranks in the red for economic losses and orange for fatalities, according to the U.S. Geological Survey (USGS). (Image: UNOSAT)
The earthquake caused massive destruction throughout Turkiye and Northern Syria, causing an estimated death toll of more than 19,000 as of Feb. 9. Several historical structures dating back thousands of years have also been severely damaged.
UNOSAT started in 2001 and is hosted by the European Organization for Nuclear Research. It does not operate its own satellites, but coordinates with United Nations member states to gather imagery from government agencies and privately owned satellites. United Nations offices, government agencies and relief organizations can request access to imagery collected by UNOSAT.
The USGS reports the earthquake resulted from strike-slip faulting at shallow depths. It appears to be associated with either the East Anatolia fault zone or the Dead Sea transform fault zone. (Image: UNOSAT)
All maps of Turkey and northern Syria from UNOSAT can be found here. A live interactive map can be found here.