This digital elevation model (DEM) indicates the type of data currently being acquired across Florida. (Photo: Dewberry)
High-resolution airborne lidar data to be acquired over 34,000 square miles for disaster response and recovery.
Under an active Geospatial Products and Services contract, the U.S. Geological Survey (USGS) has selected Dewberry, a privately held professional services firm, to complete a statewide lidar mapping project for Florida. The project is funded by the Florida Division of Emergency Management and USGS as part of Hurricane Irma Disaster Recovery, Response and Preparedness measures being conducted by the state and federal agencies.
The approximately $20 million project includes airborne lidar data acquisition, ground survey and preparation of bare earth point cloud and digital elevation model products for various applications to support response, recovery, and preparation for future storm events.
The resulting quality level 1 data will be primarily used for hydrologic and hydraulic modeling and many engineering applications by the water management districts to mitigate the impacts of flooding caused by these storms.
USGS and the Federal Emergency Management Agency (FEMA) will also utilize these data for various flood studies. The project encompasses an area of more than 34,000 square miles.
Photo: Dewberry
Dewberry has acquired and processed nearly 22,000 square miles of lidar data for various local, state, and federal agencies in Florida within the past three years.
“As we continue to map the state of Florida, we’re looking forward to using the best technology and personnel to complete such a vast undertaking,” said Dewberry Vice President and Director of Remote Sensing Amar Nayegandhi, CP, CMS, GISP. “Once these data are acquired and analyzed, they will be able to support USGS, FEMA, the Natural Resources Conservation Service, the Florida water management districts, and several other state and local agencies in their mission to better prepare for natural disasters and minimize loss of life and property; and use these scientific data to enhance and protect our quality of life.”
Dewberry will serve as prime contractor for this project and will perform the majority of the data production. The firm is teaming with seven other partner firms including Woolpert Inc., Quantum Spatial Inc. and Digital Aerial Solutions, Inc, which will acquire and process data to support the project.
Dewberry’s other subcontractors will be tasked with acquiring airborne lidar data.
“We have 11 aircraft with top-of-the-line airborne lidar sensors being deployed for data acquisition starting in early December,” said Dewberry Senior Project Manager Elise MacPherson, PMP. “I’m excited to manage this project and support the needs of USGS, their partner federal agencies and the many stakeholders in Florida.”
DigitalGlobe has released pre- and post-event satellite imagery of the areas in India affected by heavy flooding.
According to the company, massive flooding devastated the Kerala state of India in late May and early August. At least 164 people were killed and more than 223,000 were displayed from their homes and are living in relief camps. In addition, Kerala has seen 40 percent more rainfall than normal since June, which has triggered landscapes in several districts.
In an effort to support disaster response and as a part of its Open Data Program, DigitalGlobe decided to publicly release the satellite images. According to the company, its Open Data Program supports the humanitarian community by providing critical and actionable information to assist response efforts.
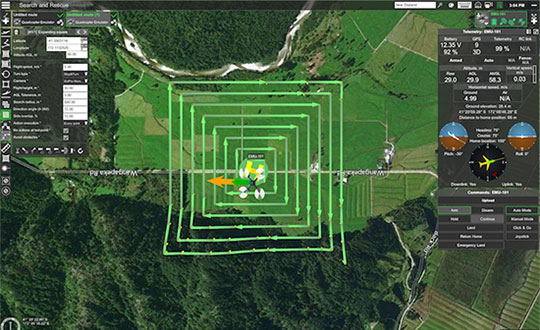
UgCS, a provider of mission planning software for unmanned aircraft systems (UAS), and public safety and disaster response UAS expert Airborne Response have developed a comprehensive search capability for drones that will allow remote pilots to more effectively conduct search-and-rescue operations using the UgCS platform.
The software enhancements will provide users with customizable search patterns such as the “expanding square” and “creeping line” that can be easily deployed in emergency and non-emergency situations.
Based on the flight altitude input by the operator, the UgCS software will automatically calculate key variables such as the course heading and track spacing necessary to provide the prescribed coverage area for a search target.
Tom “Oaty” Oatmeyer is an air rescue expert with 28 years of experience piloting helicopters for both the U.S. Air Force and the Miami-Dade Fire Rescue department. As an aircraft commander, Oatmeyer is credited with saving more than 150 lives during emergency and disaster response operations.
Oatmeyer worked directly with the UgCS development team to bring the new features to fruition.
“As first responders, we are trained to develop an emergency search plan using time-tested and proven tactics,” said Oatmeyer, chief pilot, Airborne Response. “The new enhancements to the UgCS mission planning software will allow remote pilots at every skill level to quickly plan and implement a professional search mission with a UAS.”
Airborne Response and UgCS will be hosting a joint web conference on Thursday, Aug. 16, at 2 p.m. ET to officially unveil the new search features of the UgCS mission planning software. Register here.
Also, Airborne Response and UgCS have reached an agreement for Airborne Response to offer the UgCS mission planning software and associated training to public safety and emergency response professionals throughout the U.S.
“When lives are on the line, every second counts,” Oatmeyer said. “UgCS now represents another valuable link in the UAS technology chain to enhance the public safety mission.”
“The new UgCS search feature is designed to make searching for a target with a drone as simple and reliable as possible,” said Janis Kuze, sales director at SPH Engineering. “We look forward to continue working with the Airborne Response team to further enhance the software capabilities and implement additional search pattern features.”
The Open Geospatial Consortium (OGC) is hosting the second Disasters Concept Development Study Workshop July 24-25 at the NOAA Auditorium in Silver Spring, Maryland.
Organized by OGC, the workshop is sponsored by the Department of Homeland Security, the Federal Geographic Data Committee, the U.S. Geological Survey (USGS) and other government agencies.
The workshop is part of the OGC’s Disaster Concept Development Study, and will shape future activities to be led by OGC regarding disaster preparedness and response, and to inform development of potential disaster spatial data infrastructures (SDI).
According to NOAA, in 2017 in the United States there were 16 major natural disasters with costs that exceeded 306 billion dollars, shattering previous annual records.
The workshop asks whether more lives can be saved and damages reduced by providing better discovery and access to data that will improve mitigation, preparedness, response and recovery from disasters.
The ability to effectively share, use and reuse geospatial information and applications across and between governments and non-government organizations in support of disaster response and resilience depends on having a spatial data infrastructure in place when disaster strikes.
The OGC is bringing together key stakeholders in the natural hazards disaster communities to advance the emerging Disaster SDI by conducting a study and developing a set of pilots over the coming years. OGC’s Disasters Interoperability Concept Development Study (CDS) will assess the current state of data and product exchange technologies as used in disaster planning, response, and recovery. The information gained in the CDS will aid in developing a series of future pilots that will in turn advance the state of SDIs that support disaster risk reduction across the globe.
For more information on the Disasters CDS Workshop, including the agenda and how to register, visit the event page on the OGC website. Registration for the workshop is free but mandatory.
TCarta, a global provider of marine geospatial products, has delivered pre- and post-disaster surface models for the Caribbean islands of Antigua and Barbuda for use in Hurricane Irma recovery efforts.
The satellite-derived surface models contain seamless datasets of onshore elevation and offshore water-depth measurements for each island.
The United Kingdom government commissioned the Hurricane Irma disaster mapping for Antigua and Barbuda as part of the Commonwealth Marine Economies Programme. TCarta won a competitive tender, which specifically requested end products derived from satellite imagery.
“By specifying satellite-derived data as the deliverable in its tender, the U.K. government acknowledged the speed and cost advantages this technology offers compared with traditional shipborne surveying or airborne lidar collection,” said TCarta CEO David Critchley.
Hurricane Irma devastated the Caribbean in September 2017. The governments of Antigua and Barbuda requested accurate data for onshore land elevations and offshore water depths from before and after the storm hit.
The datasets will be used in digital change detection analyses to determine how Irma altered the surfaces of the land and seafloor. This will be vital information in repairing onshore drainage systems and updating coastal navigation charts.
“A seamless onshore-offshore dataset is crucial for the hydrographic computer modeling to accurately visualize the integrated nature of the dynamic terrestrial and near-shore environments,” Critchley said.
For the seafloor dataset, the TCarta team generated satellite-derived bathymetry products by extracting accurate water-depth measurements from high-resolution multispectral imagery acquired by the DigitalGlobe WorldView satellites. In the clear Caribbean waters around Antigua and Barbuda, bathymetric points were delivered on a 2-meter spacing to deeper than 20 meters.
The TCarta team created digital surface models of the terrain on Antigua and Barbuda, using a technique to derive surface elevations at 0.5-meter point spacing from multiple WorldView images captured over the islands. Vegetation was then removed from surface models to yield bare-Earth elevation models.
TCarta delivered the high-quality before-and-after datasets to the UK government which in turn distributed them to scientists on Antigua and Barbuda for damage assessment and planning for the coming hurricane season.
By Simon Batzdorfer, Markus Bobbe, Martin Becker and Ulf Bestmann, Technische Universitaet Braunschweig
All images courtesy of the authors.
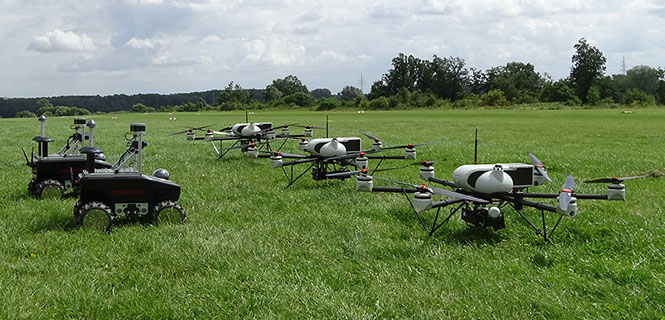
Autonomous vehicles equipped with different environmental sensors, such as optical or thermal camera or a lidar, performed a team survey controlled by a central ground station. The ground station serves as a user interface to define missions and tasks and also to visualize exploration task results online. 2D stitched orthophoto or lidar point clouds are transmitted for display and processing into 3D photogrammetry. Georeferencing data is gathered by an integrated GNSS/IMU positioning system.
In disaster scenarios such as fires, floods or search-and-rescue tasks, good situational awareness is indispensable for responders coping with a complex and often chaotic environment. In most cases, a prior known map data are outdated, and an efficient situational proceeding such as path planning or creation of a search pattern cannot be performed. This information can often only be gathered by manned exploration using ground or airborne systems, with limits on availability.
The research project Automated Navigation and Communication for Exploration (ANKommEn) seeks to create an automated unmanned system to close this gap by providing up-to-date scenario information while increasing the safety of human resources, using unmanned aerial (UAV) and ground-based (UGV) vehicles.
To provide up-to-date information of the desired destination area, all vehicles are equipped with identical positioning and communication hardware complemented by diverse sensors (RGB camera, infrared [IR] camera, lidar) for visual exploration. The visual sensor information is transmitted to a central ground station for visualization and/or analysis. To increase the advantages of the system, the unmanned systems should have a high grade of automation to reduce the workload of the operator so that only basic inputs have to be done by the operator. For example, just by marking a destination area and choosing a predefined task, the mission will be planned automatically, and after the corresponding waypoint-list has been transmitted to the vehicles, the mission will start.
Automated procedures of a UAV in particular require valid position information related to accuracy, availability and continuity. In exploration areas where the UAV operates in low altitude or using a UGV, the reception of the GNSS signal can be degraded by the topology (buildings and such). Using more than one GNSS can increase the availability of position information. Vehicle control, georeferencing environmental sensor data and exploration results all require high-frequency absolute position and attitude and heading information. This data is gathered by fusing GNSS and inertial measurment unit (IMU) data.
OVERALL SYSTEM DESIGN
The overall system consists of three UAVs, two UGVs (Opening photo) and a central ground control station. The latter serves as a central human-machine interface to monitor and manage cooperative operation of the UAVs/UGVs by an operator. Based on a priori known map data, exploration areas and tasks are defined and assigned to the UAVs/UGVs and will be updated with actual information of the visual sensors while performing a mission.
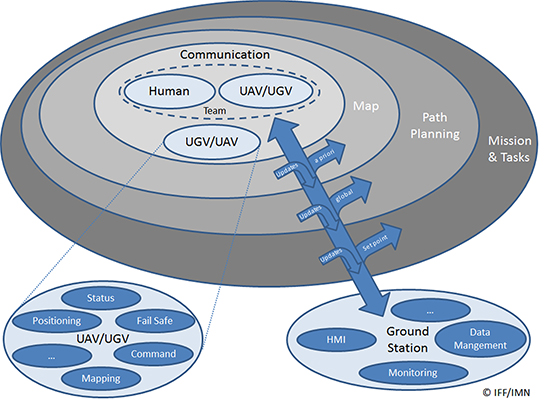
Figure 1 shows the interaction and information exchange between the different vehicles and sensors.
Figure 1. Diagram of interaction and information exchange.
All UAVs/UGVs are equipped with a navigation and communication unit (NAV/COM) and an environmental sensor payload (ENV) unit, including an RGB camera, thermal camera or a lidar respectively.
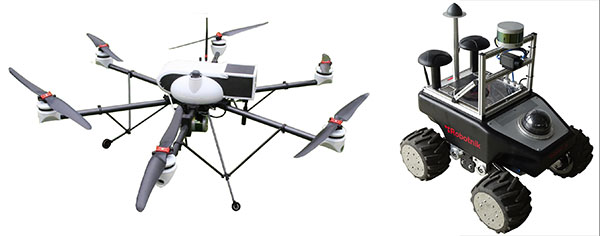
UAV/UGV and Sensor Hardware. The UAVs carry a payload of 2.7 kg (NAV/COM unit, mounted in the upper compartment, and ENV unit mounted under the UAV) and a flight time of up to 30 minutes (Figure 2, left). The payload sensors are carried and stabilized by a two-axis-gimbal. The environmental sensor payload unit is based on three different types of sensors, which are interchangeable between the different UAVs: RGB camera, lidar and IR camera.
For ground-based exploration, two four-wheel-drive UGVs carry a pan-tilt-zoom (PTZ) camera at the top of front chassis (Figure 2, right), and are equipped with a lidar and a thermal camera, or a stereo RGB camera, respectively.
Figure 2. UAV carrying a lidar (left) and UGV carrying lidar and IR camera (right).
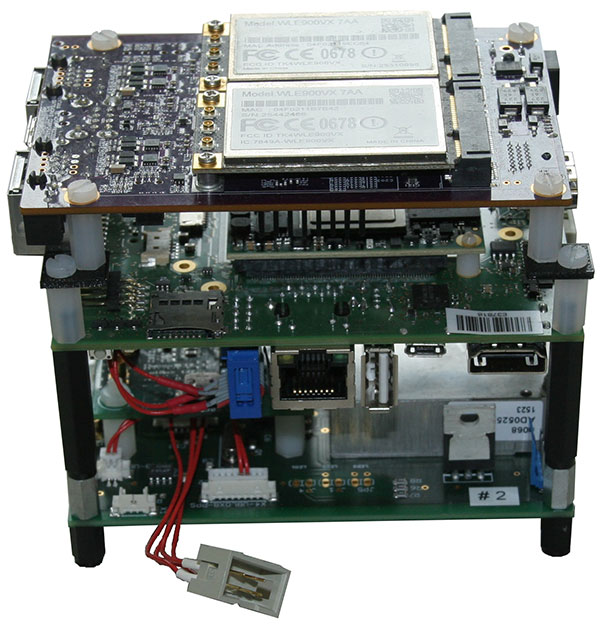
The navigation and communication unit mounted as a stack includes a network processor board for communication and data exchange between the UAV/UGV and the central ground and control station. An embedded processing board provides position calculation and GNSS-NTP-based time server. Data for the position calculation is provided by a custom-designed break-out-board (Figure 3).
Figure 3. Navigation and communication unit.
Data traced by these sensors cannot be sent directly to the ground station because of the huge data amount and the limited bandwidth of the communication link. Therefore, data from the sensors are preprocessed or compressed on a small form-factor personal computer and then transmitted to the ground station.
Ground Station. The ground station is the central device for command, control and visualization of the total system. It provides several options to display the data from the sensors and vehicles and a combination of them, and also provides automated path planning and calculation of the 3D reconstruction (photogrammetry) and online 2D stitched orthophoto.
Software Frameworks. The basic software for determining the vehicle’s state in 3D position, velocity, attitude and heading is established within a modular navigation software framework, with the option to process data of different sensors in real time as well as post-processing for data evaluation and development purposes. Several algorithms for sensor data fusion are implemented. The algorithm for IMU/GNSS fusion is based on an extended Kalman filter and also provides an IMU data-based state vector, stabilized by GNSS information, for the visual sensors. This state vector is published by using the robot operating system (ROS), a framework for inter-process communication based on a TCP or UDP publisher/subscriber concept. The visual sensors and embedded PCs subscribe to different ROS messages, for example, the state-vector-message or information of other sensors.
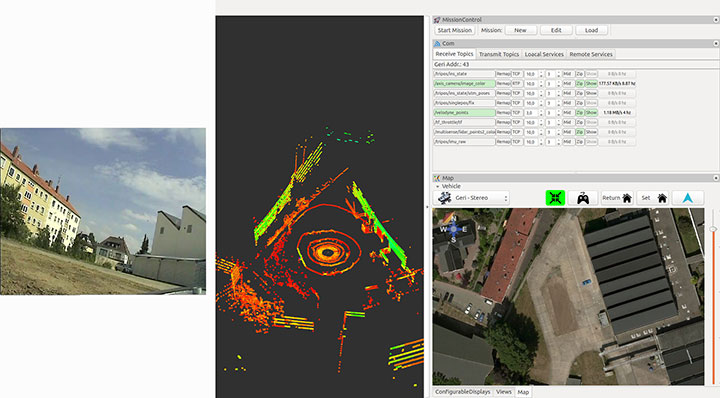
Figure 4 shows examples of the actual camera view from the UGV, and point cloulds and map generated by the UAV. The software layout can be customized by the user.
Figure 4. From left to right: the actual view by the PTZ camera onboard the UGV, the point cloud gathered by the UAV’s lidar, and the mission parameters and map of an aerial view.
POSITIONING OF UAV AND UGV
Automated operation of UGVs and UAVs requires valid position as well as attitude and heading information. In the case of using only one GNSS, signal quality and availability can be degraded by the environment (buildings) and can result in less precise or even a lack of position information.
GNSS Multi-Constellation. To overcome the risk of poor availability of GNSS-based position information, parallel usage of different GNSS can raise the number of received satellite signals: GPS, GLONASS, the evolving Galileo and BeiDou. When using a multi-constellation approach for positioning, one has to take care of several differing aspects between the GNSS. Each system uses a different geodetic reference frame and time basis. Measurements gathered from another GNSS system must be transformed into the reference frame of the desired system. The geometric distribution of the satellites is improved by using more than one GNSS constellation, indicated by a lower dilution-of-precision value.
The navigation software framework is designed for real-time computation and also for post-processing. In post-processing, the recorded sensor data is streamed to the software framework with the option of changing several parameters and settings for calculation. One option is to exclude satellites at low elevation from position calculation by changing the cut-off elevation for these satellites. This parameter will be changed to simulate environmental conditions that block receiving GNSS signals, like buildings within urban scenarios, to compare the availability of received GNSS signals for single- and multi-constellation-based position calculation.
Recorded data of a real-world test serves as the database for the post-processing with different cut-off elevation parameters. At the beginning of the field test, there was a short initialization period to boot the OS and to start basic processes for positioning. After that, a predefined mission was flown and the GNSS measurements have been saved for the described post-processing.
Post-processing has been performed with different cut-off elevation parameters of 5° up to 35°. In the case of 35°, the number of GPS satellites is reduced to the minimum for position calculation of four, in contrast to 5–7 available satellites for a multi-constellation based solution.
GNSS/IMU Fusion. Using the GNSS multi-constellation approach can increase availability of position information. For attitude and heading determination, an IMU is nevertheless indispensable. Additionally, the frequency of the pure GNSS-based positioning information is usually between 1 Hz to 5 Hz within the described hardware setup. Meaningful georeferencing of the environmental sensors requires much higher frequency position and attitude information.
The IMU provides high-frequency 3D measurements of accelerations and angular rates. Using common strapdown algorithm processing, high-frequency position, velocity, attitude and heading information is provided in real time. Due to the short time stability of pure inertial navigation, the GNSS positioning results are used for aiding purposes within the Kalman filter’s update step. To overcome the absence of GNSS aiding information even when using multi-constellations, there are mainly two options. First, a short coasting period is possible after the data fusion has reached a steady state.
Second, due to the highly modularly design of the navigation software framework, it is possible to use position or attitude increments from environmental sensor data processing for aiding the IMU.
The vehicle’s state vector is then distributed with high frequency within the system for georeferencing measurements of the environmental sensors, especially the RGB camera and the lidar for photogrammetry and simultaneous location and mapping (SLAM) applications.
PHOTOGRAMMETRY AND SLAM
In major fire scenarios, maps can be out of date. Therefore, techniques have been developed to gather a 2D overview based on several single RGB pictures taken and processed on board a UAV and transmitted to the ground station via data links. Additional processing of a 3D reconstruction of the scenario is an integrated feature within the ground station. Both approaches were implemented to get an automated rapid aerial mapping solution.
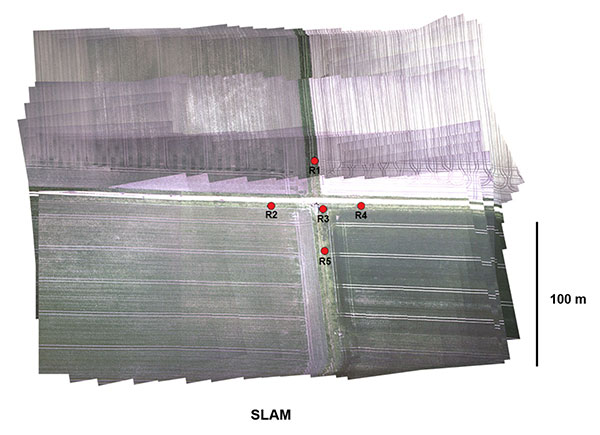
In the case of the 2D overview, SLAM algorithms, often used in robotic research, are adapted for this specific use case. These algorithms provide good results for a rapid aerial mapping solution to get an overview of the scenario, because the map is updated incrementally with every new image, but they are less precise, which can be compensated for by using the photogrammetric 3D reconstruction. The live mapping (SLAM) approach is based on the ORB-SLAM algorithm, and the photogrammetry-based approach uses commercially available photogrammetry software.
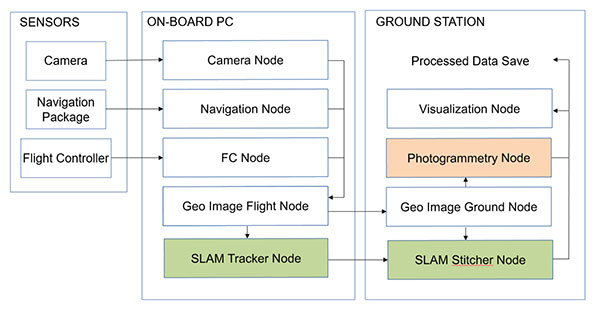
The systems, on the UAV for 2D and for 3D on the ground station, use the ROS framework for processing the visual sensor data and the described techniques for positioning, georeferencing and attitude determination. For data exchange between these frameworks, several software interfaces have been implemented. Figure 5 displays a flowchart of the implemented workflow.
The sensor/input data is received by corresponding nodes on the aerial vehicle. After adding the camera pose information to the image in the geo-image flight node, the image is sent to the geo-image ground node on the ground station. The SLAM process is separated into two parts. The SLAM tracker node calculates the transformation between images, and the SLAM stitcher node applies the transformations. The transformed images are displayed by the visualization node. The photogrammetry node receives the georeferenced images, stores the data, and initiates the photogrammetric processing once the survey is finished. The results can also be displayed by the visualization node and exported in a desired format.
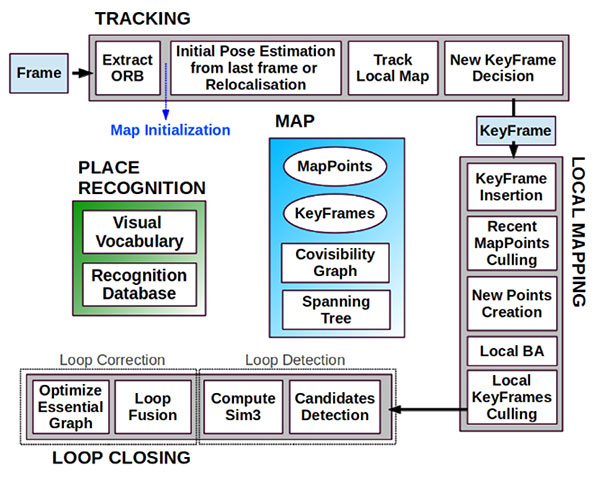
Visual SLAM. Computer vision-based algorithms have developed rapidly over the last few years. One method estimates a pose by using monocular image processing, known as parallel tracking and mapping (PTAM). This integrates a bundle adjustment and separates the tracking and the mapping procedure into different threads, leading to a real-time capable framework. These basic PTAM principles have been integrated into a robust loop-closing and another method of relocalization, known as Oriented FAST and Rotated BRIEF (ORB SLAM), shown in Figure 6. Here, tracking, local mapping and loop closing are separated into different threads (gray boxes), with the main map and place recognition in the middle.
Figure 6. ORB SLAM system overview [Mur-Artal, 2015].The tracking thread predicts the current pose from the last known position and movement by using a constant velocity model and performs a guided search of map points. If these points are found near the estimated position, the velocity model is valid and the tracking procedure continues. Otherwise, the tracking is lost and a relocalization in the global map starts by using a subset of features, which are increased after detection of corresponding features in other keyframes to optimize the camera pose and, finally, the tracking procedure continues. The last step of this procedure is to decide whether the current frame contains enough information to be inserted as a new keyframe for further calculations.
To mark a frame as a new keyframe, the frame must fulfill all of the following conditions:
More than minimum number of frames has passed.
Local mapping is on idle or condition 1 fulfilled.
A minimum number of 50 points is observed.
A maximum of 90% of the features is already observed by the other frames.
When a new keyframe is passed to the local mapping procedure and inserted as a node into a co-visibility graph structure, new correspondences are searched in the connected keyframes to triangulate new points. Based on the information accumulated during the tracking, a point culling keeps only high-quality points in the map as well as a culling of redundant keyframes.
Then a loop closing is performed. This is one of the main improvements compared to PTAM. If a loop is detected, the drift accumulated in the loop is computed, and both sides of the loop are aligned and visible points are fused. In a final step, a pose graph optimization is done to achieve global consistency.
This information of the 3D camera pose is used to generate a 2D orthophoto in real time while the vehicle is flying. To create a 2D orthophoto, a common reference frame is approximated, which is orthogonal to all camera measurements. The projection is performed by using a projection model based on a pinhole camera.
After the compensation and distortion, the whole image can be stitched to the current global map.
Photogrammetry. This approach uses off-the-shelf photogrammetric processing software. The processing is triggered automatically when the survey is completed and all images are transferred to the ground station via data link. For georeferencing of the images, the camera location and the inner camera geometry were written to the EXIF file of each image by the geo-image ground node (Figure 5). To ensure an acceptable compromise between orthophoto quality and the required processing time, an analysis regarding the impact of the most relevant processing parameters has been performed.
Figure 5. ROS node layout with SLAM (green) and photogrammetry workflow (red).
The photogrammetry process consists of four steps:
camera alignment (optimizing the homographic equation)
mesh creation by generated tie points
orthophoto creation (dense cloud or digital elevation model)
export.
Analyses and Evaluation. To evaluate the correct workflow of both approaches of 2D live-stitching and the 3D photogrammetry, a real-world flight test above agricultural cropland has been performed. The results of both approaches are shown in Figure 7 and Figure 8. Generally, agricultural cropland and its mean textured surface pose a challenge for mapping processes because of the limited number of trackable features.
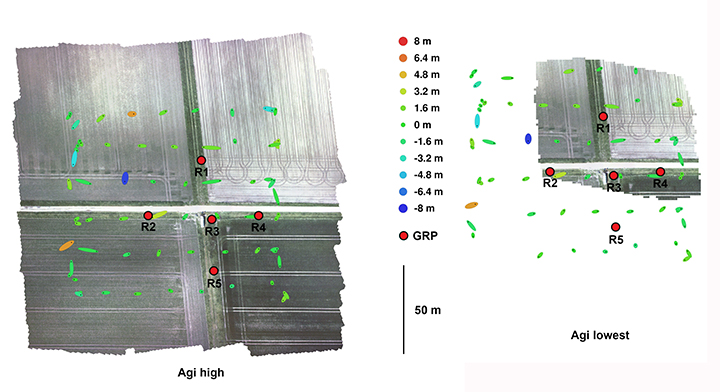
Figure 7. Orthophotos created with the profiles high and lowest (including ground reference points).Figure 8. Orthophotos created with 2D live stitching approach of cropland.
Four predefined profiles were used to cover the requirement of compromise between processing duration and quality of the generated orthophoto. Each profile level generates a corresponding level of alignment accuracy and mesh face count: lowest, low, medium and high.
To estimate the accuracy of the created maps by the different profiles, five ground reference points (GRPs) were distributed over the mission area. The location of the GRPs was determined using a RTK-GNSS system leading to a horizontal RMSE below 2 cm. To enable robust processing for this scenario, the overlap and the sidelap was chosen to be 70%. A ground-sampling distance (GSD) of 2 cm was needed to identify the GRPs. This resulted in a mission consisting of six times 100-meter (m) lines with a distance of 25 m in an altitude of 60 m over ground. During the flight time of 4.5 minutes, 271 images were taken.
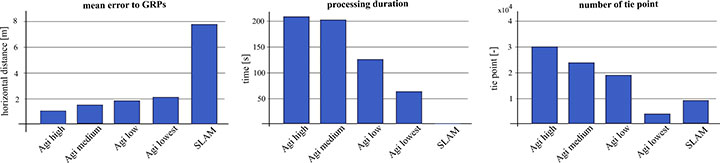
To compare the profiles, they were triggered one after another with the same set of images. The created results are shown in Figure 7. All profiles resulted in consistent solutions and were successfully georeferenced. The map based on the lowest profile could not recreate the complete area (Figure 7, right). The remaining profiles led to similar results without notable differences to visual inspection. The processing time varied between 1.2 and 3.6 minutes. A comparison of this and other criteria is given in Figure 9.
Figure 9. Evaluation and comparison of defined software profiles and visual SLAM.
The created final image of the SLAM pipeline is shown in Figure 8. The image was updated with every new image and was therefore finished before the UAV landed. The mean location error measured using the reference points was about 8 m, significantly larger than the errors observed in the photogrammetry results. In Figure 9 the results are contrasted to the results of the photogrammetry approach.
While the mean error in the low profile is half as high as in the lowest profile, the calculated errors using the medium and high profiles are not enhanced significantly. The number of tie points created by the lowest profile is an order a magnitude lower compared to the other three profiles.
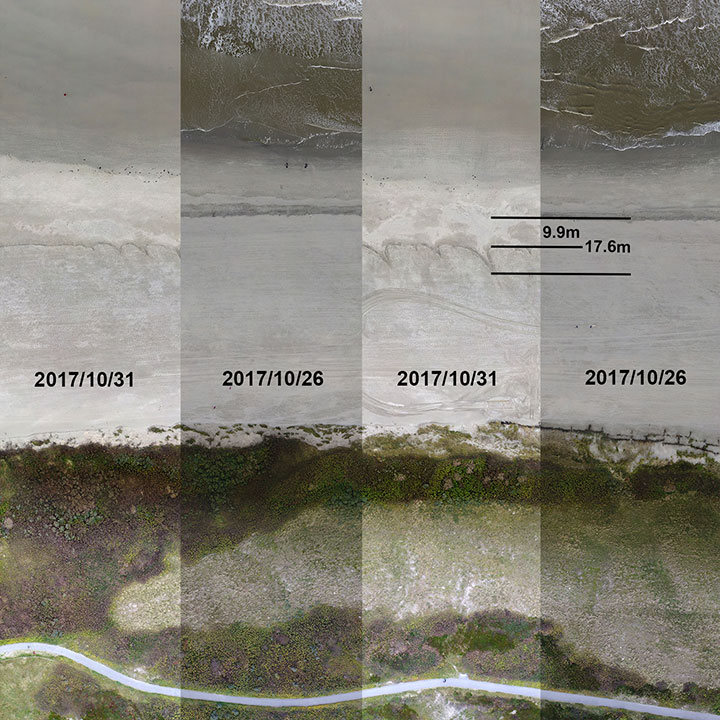
We conducted flight tests on Langeoog island in the North Sea, to gather information on efforts to protect the island’s coastline from water erosion. For this reason, sand was selectively washed up to the coastline by dredgers at the beginning of October 2017. Between Oct. 26 and 31, due to severe weather with a storm flood, a huge erosion of the washed up sand occurred, and the result is shown in Figure 10. The level of erosion was determined by comparison of the orthophoto of the same area. The dislocation averaged out to 9.9 m with some peaks up to 17.6 m.
Figure 10. Evaluation of erosion.
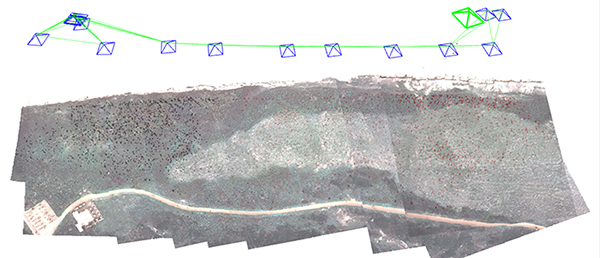
The 3D photogrammetry provides a more detailed image compared to the image of the 2D-live-stitching approach (Figure 11), but both approaches can provide the desired information of the area.
Figure 11. Result of the SLAM approach with camera poses and tracked features.
Both implemented approaches were successfully integrated to get the desired fully automated rapid aerial mapping solution. This also includes the basic tasks of the automated mission planning, camera control, image transport to ground station, automated processing and the visualization of the results.
CONCLUSION
The benefits of multi-constellation GNSS positioning have been demonstrated with a focus on UAVs and UGVs operating in catastrophic scenarios, especially where GNSS signal reception might be blocked. This position information is also used for georeferencing of images and visual reconstruction of the area. The overall system has demonstrated the capability of an automated orthophoto generation. Both implemented mapping methods — a 2D live stitching and a 3D photogrammetry — provided results that fulfill the requirements to get an instantaneous 2D overview and a contemporary 3D reconstruction of the area.
ACKNOWLEDGMENTS
This work was done within the joint research project ANKommEn, funded by the German Federal Ministry of Economic Affairs and Energy, administered by the Space Administration of the DLR (funding code: 50NA1518). Project partners are the Institute of Flight Guidance (IFF), the Institute of Mobile Machines and Commercial Vehicles (IMN) — both part of Technische Universität Braunschweig — and AirRobot GmbH & Co. KG, a German manufacturer of multirotor UAVs. The professional fire brigade of Braunschweig and the Lower Saxony Water Management, Coastal Defense and Nature Conservation Agency also participate as associated project partners.
SIMON BATZDORFER holds a Dipl.-Ing. in mechanical engineering and is a research engineer at the Technische Universitaet Braunschweig, Institute of Flight Guidance (IFF).
MARKUS BOBBE holds a M.Sc. in aerospace engineering and is a research engineer at the Braunschweig IFF.
MARTIN BECKER holds a Dipl.-Ing. in aerospace engineering and is a research engineer at the Braunschweig IFF.
ULF BESTMANN received his Dr.-Ing. in mechanical engineering from TU Braunschweig. He is head of the navigation department of the IFF. He co-founded the company messWERK GmbH, a service provider in flight testing and certification.
Whether you are on the helping end of a disaster aiding in the rescue and recovery, or on the receiving end being aided, GIS is supercharging the rescue efforts.
How can I help you if I don’t know where you are?
Hurricane Harvey hits. The storm was worsening. Winds were sustained at over 120 mph. Landfall of Hurricane Harvey was expected in 48 hours. Worse, the storm was forecast to stall once overland creating the single worst rain event in United States history.
Texas Governor Greg Abbott encouraged people to evacuate, especially those in low lying areas. Mayor Turner had only hours to decide the possible fate of millions. Making the call not to evacuate a category 4 hurricane approaching the city could be political suicide. Consider the fallout after Hurricane Katrina. The models clearly showed the extent of flooding and how many people would be trapped in their cars on flooded roads.
“You cannot put 6.5 million people on the road,” said Houston Mayor Sylvester Turner. The mayor’s ultimate decision not to issue an evacuation declaration was based on geospatial models, and as devastating as they were, it showed a better outcome if everyone stocked up, stayed put, and helped each other out after the storm. At least by staying home we will know where people are after the storm.
Gov. Abbott fully mobilized the National Guard and another 30 state agencies responded to the crisis. U.S. Federal Emergency Management Agency (FEMA) calls to action went out to the Coast Guard and volunteer organizations. Small boats, raised axel trucks and Vietnam-era looking personnel carriers were brought in for support, along with helicopters, drones and search and rescue airplanes.
First responders were issued full body waders and foul weather gear. Thousands of hypothermia blankets were stockpiled and cargo trucks carrying food, water and cots headed south. Volunteers from the Cajun Navy, Team Rubicon, the Red Cross, Open Street Maps, Samaritan’s Purse and others positioned their able-bodied forces along the periphery of the storm’s path ready to move in as soon as given the word.
Thursday afternoon the winds and rains began getting increasingly worse. Darkness fell and by 10 p.m. the eye of the storm had made landfall. Rivers and streams began overflowing due in part to the storm surge moving waters upstream. Streets no longer drained the waters. The flooding continued to rise.
Tremendous thermodynamic forces. Hurricanes aren’t a single, solid storm, though they may look like it from satellite imagery. They are enormous atmospheric depressions like a hole formed in the sky and air masses from thousands of miles around rush in to fill the void. These converging air masses create immense thermodynamic forces extending outward from a central vortex in long sweeping radial bands like blades of an enormous turbine.
A hurricane is the cumulative fury of these destructive forces storm after storm after in rapid succession. Winds increase and decrease as the radial bands pass overhead becoming stronger and more constant as the eye approaches. Every plank, nail and screw is tested. Immense gusts like giant hammers breaks away loose thing. Strains of timber and steel shriek in the wind. In seconds sounds of groaning trees and the air fills with flying debris. Rain comes down in torrents.
But in between these spiral bands it slows, sometimes stopping all together, even sunshine or moonlight might break through, but to believe the storm is over would be wrong — maybe dead wrong. Another band will sweep in with gusting, howling wind, thick, heavy clouds and dark skies, and rain, more and more rain, and the rising waters turning into gushing floods. Moments of endless terror turn into hours, the waters rising higher ever higher.
Finally, 49 inches of rain and three days later the storm ended moving offshore. Its destruction shut down the fourth largest city in the United States.
“…Texans have suffered a great hardship, their warmth and resiliency is truly inspiring,” said Gov. Abbott. The overwhelming willingness of people and organizations to help once the storm passed brought its own challenges. A convergence of rescue and recovery teams began.
Leaders needed. It was obvious a coordinated effort needed to happen. Volunteers and organizations needed to work in unison. FEMA had to establish that order. The coordination center was formed, not unlike other disasters, but this time another dimension was added to it. FEMA was aware of social media’s ability to positively impact rescue operations tapping into briefly during Superstorm Sandy, the last large scale disaster to hit the United States, but FEMA lacked the necessary skills and expertise to capitalize on the technology.
It is times like these that the greatest of all resources is realized. When asked what is the greatest asset, the answers most often given are manpower, money, equipment or supplies; however, even if there are plenty of the above, it is quickly realized the greatest resource is leadership. In times of crises, normal authority is laid aside and given to those who can bring order to the chaos.
Christopher Vaughn, the geospatial information officer for FEMA, and Adrian Gardner, the chief information officer for FEMA, were those individuals stepping up to the task at hand. They understood getting better data faster and putting it into geospatial context held the answer. Once done that would be the foundational layer. All the other elements could then be added, like imagery, lots and lots of imagery, both before and after; and then overlay crowdsourced data.
Vaughn, working with his counterparts in the Department of Homeland Security, brought in Homeland Infrastructure Foundation Level Data (HIFLD) layers, along with the Civil Air Patrol and DigitalGlobe’s Open Data Program. Launched in 2017, the program provides before and after imagery. Vaughn understood that the citizen-as-a-censor model provided raw, real-time and relevant information. It had to be tapped into to get control of the rescue operations.
Sophia Liu, Ph.D., an Innovation Specialist and expert in crowdsource efforts was brought in from the United States Geographic Survey (USGS). Liu was the key to unlocking the crowd. She shared her greatest challenge was the misconceptions around the use of social media and an apprehension to using it without proper approvals from public relations. It took some convincing to change these mindsets.
What helped tip the scales in her favor was Hurricane Irma coming right on the heels of Hurricane Harvey and then Hurricane Maria. The disasters were coming in way too fast and the detractors were drowned out by the need for information. Once they saw the value of crowdsourcing, there was little resistance.
Challenges in Puerto Rico. The results spoke for themselves. In Puerto Rico, within only a few weeks of Hurricane Maria’s devastation, 1.4 million homes were analyzed for damage and 24,000 miles of roads were digitized through volunteer groups like GIS Corps and OpenStreetMaps.
One of the greatest challenges in Puerto Rico was the lack of street addresses. That is more common than one might realize. In many parts of the world there is no established address system and locations are more or less oriented to significant landmarks. It is difficult for Americans to understand, but in other cultures generations of families grow up in the same neighborhoods. Everyone knows everyone else. Location is personal. In the case of disasters this poses a huge challenge, especially when roads and landmarks are destroyed, and people have evacuated.
The company What3Words (W3W) is tackling this issue. W3W works uses a pixelated Earth system of 3 meter by 3 meter squares. Each grid can be defined by a set of three words. As I write this I am sitting in bump.cans.dome.
W3W does away with traditional numerical latitude and longitude. It works in any language, in fact, eight countries have partnered with W3W as either the nation’s official addressing system or an alternate system, and the United Nations has it among their disaster reporting tools. Art Kalinski, the former writer of this column wrote an article last year about W3W, what3words: The geospatial advancement of the year?
In Puerto Rico, since there aren’t addresses except in urban areas, the remainder of the island had to be geospatially configured to communicate “where” something was located. Digitizing Puerto Rico is a huge geospatial effort that would take years through normal government protocols and cost millions of dollars.
Instead, by enlisting the support of the crowd, it was accomplished in weeks, proving the power if crowdsourcing operations.
Crowdsourcing to the rescue. The power of the crowd was unlocked even more by using geoforms for filling out damage reports like bridge assessments, damaged roads, debris removal, etc. This allowed navigation apps to route around impassable areas saving time and ultimately lives. No more sending a rescue vehicle out only to find it can’t access the area because a tree is down, a bridge is collapsed, or flood waters are too high. Those delivering food could do so to where the people were.
Interactive, real-time, geospatial, command and control forever changed dispatching. Instead of waiting for teams to return before retasking them with new assignments dispatching could be of done on the fly as survivors were identified. The nearest rescue craft with available space could be routed to the exact location.
GIS allowed dispatchers to see where all the rescue teams were and how many survivors they had onboard and how many more they could take on. Data about each survivor was recorded allowing preparations for the arrival of anyone with special needs and the person’s information could immediately show up on a notification board that they had been found and rescued, important for family and friends to know.
The information also helps with forecasting needs of shelters and the reporting of numbers to those in operational authority.
Daily coordination calls were conducted over a variety of platforms with all interested and active participants. Important information was posted on a shared cloud drive. Slack, the peer to peer online collaboration platform was used so FEMA and the various groups were able to collaborate and keep the three different hurricane rescue operations segregated.
Recovery continues. The recovery efforts continue in Houston, Florida, Puerto Rico and the Virgin Islands. In efforts to increase the attention GIS played in mitigating damage from these disasters and the value of crowdsourced information FEMA hosted several events. The final event was held on Saturday, October 21, 2017. It was information about the situation on the ground in the multiple locations and the ongoing operations. It was also a celebration of the successes achieved during these crises; and, a tinge of sadness marked the event bringing to a close to some great working relationships.
If you are interested, there are still ways to get involved no matter what your skillset or expertise. If you have a desire to help, there are opportunities either on scene in the theater of operation, or remotely working from your computer at home. Check with the organizations mentioned below. Even a couple hours of your time can help.
What GIS offers next. GIS in the future of disaster response will make greater use of emerging technologies. Drones will fly preprogrammed paths ahead of a disaster if given enough time, and the imagery and the drone’s flight path will be stored. Then, immediately after the event passes drones will fly the same programmed path capturing imagery with the exact oblique and nadir angles as the original dataset.
Change detection analysis can then be used to find the exact locations of change. This method will become increasingly valuable using high resolution 3D imagery point clouds and used in a change detection system.
Geospatial artificial intelligence systems will identify the areas of greatest damage and assist by directing other resources such as mobile data signals to direct rescue operations towards possible survivors even using the last reported mobile data signal. It can direct human analysts to those specific areas that are inconclusive or require manual verification. This will increase analysis from several weeks to several days.
That is in the future, the near future, perhaps next year’s hurricane season, or tornado season, or snowstorms this winter.
This year, in total, there were 10 Atlantic hurricanes resulting in 431 deaths and an estimated $3.17 billion in damage; which by comparison, is 1/10th the number of casualties from Hurricane Katrina yet nearly twice the level of damage. It just so happens, I went through Hurricane Katrina living along the coast in Bay Saint Louis, Missouri, at the time where the eye the storm passed over. I tried to evacuate but being caught in a 13 hour traffic jam I was unable to outrun the storm. I personally experienced a category 4 hurricane. You may have picked that up in the opening of this article. Those experiences were very real. You might have also picked up my meteorological background from my days in the U.S Navy as a weather analyst.
By the end of 2017, more than hurricanes had inflicted damage. Wildfires in the western U.S. killed another 36 people and destroyed 6,000 buildings. Now, with winter upon us, there will be snowstorms, and GIS will help with those recovery efforts as well.
We are lucky to live in this day and age. Whether you are on the helping end of a disaster aiding in rescue and recovery, or on the receiving end being aided, GIS is supercharging the rescue efforts.
Using live data from USGS and Waze, a new Esri interactive map visualizes active wildfire locations and traffic alerts for Northern California.
The map incorporates a new mapping technique to group traffic alerts at locations where there is a high density of alerts. This method enables faster and more effective visual analysis in areas where there are many alerts that would normally overlap.
Active fire data displays the locations of large fire incidents in Northern California. Data is provided by the U.S. Department of Agriculture Forest Service and The Geospatial Multi-Agency Coordination Group, and is intended to give near real-time understanding of the situation on the ground.
Location and status of active fires is updated throughout the day as new information is gathered by first responders.
Data from Waze is reported by users of Waze and updated every two minutes. This data, provided by Waze through the Connected Citizens Program, contains filtered data for affected area including system-generated traffic jams and user-reported traffic incidents (including jams, accidents, hazards, construction, potholes, roadkill, stopped vehicles, objects on road, and missing signs).
DigitalGlobe releases images of Northern California wildfires
DigitalGlobe has released high-resolution satellite images of the wildfires burning in Northern California. These wildfires have killed at least 21 people, destroyed at least 3,500 structures, and burned more than 115,000 acres.
The Oct. 10 images were collected using the Shortwave Infrared (SWIR) sensor on DigitalGlobe’s WorldView-3 satellite, which is uniquely able to pierce through the wildfire smoke to see where the fires are burning on the ground. For comparison, the ground and the fire line are completely obstructed by smoke in the natural color image of the same area (see the larger overview image on the first slide).
The Oct. 11 images were taken by DigitalGlobe’s GeoEye-1 satellite. Some of these are natural color, while others are shown in the Very Near Infrared (VNIR), where burned areas appear gray and black and healthy vegetation is red.
Additionally, DigitalGlobe has activated its Open Data Program, which provides imagery to support recovery efforts in the wake of large-scale natural disasters. Pre- and post-wildfire imagery of the affected areas are available to emergency responders on the Santa Rosa wildfires page.
Using live data from USGS and Waze, a new Esri interactive map visualizes active wildfire locations and traffic alerts for Northern California.
The map incorporates a new mapping technique to group traffic alerts at locations where there is a high density of alerts. This method enables faster and more effective visual analysis in areas where there are many alerts that would normally overlap. Zoom in on the map to reveal the latest individual traffic alerts.
Active fire data displays the locations of large fire incidents in Northern California. Data is provided by the U.S. Department of Agriculture Forest Service and The Geospatial Multi-Agency Coordination Group, and is intended to give near real-time understanding of the situation on the ground.
Location and status of active fires is updated throughout the day as new information is gathered by first responders.
Data from Waze is reported by users of Waze and updated every 2 minutes. This data, provided by Waze through the Connected Citizens Program, contains filtered data for affected area including system-generated traffic jams and user-reported traffic incidents (including jams, accidents, hazards, construction, potholes, roadkill, stopped vehicles, objects on road, and missing signs).
EagleView Technologies is actively flying to acquire post-storm imagery in Florida following Hurricane Irma. With more than 20 planes staged or in the air, EagleView is continuously capturing high-resolution aerial imagery to enable rapid assessment and response to Hurricane Irma relief efforts.
EagleView is a provider of aerial imagery and property analytics for the government, insurance and commercial sectors.
Using both fixed-wing aircraft and drones, EagleView imagery supports post-hurricane insurance claims adjusting, property assessment, public safety and land surveying professionals.
“With these hurricanes affecting so many Americans, we’re putting our planes in the air as soon as possible to begin the image capture process,” said EagleView President Rishi Daga. “From our unique high-resolution post-event imagery to our industry-leading machine learning capabilities, EagleView’s technology can massively accelerate recovery efforts and because of this, we find it crucial to take flight immediately once permitted into the airspace.”
EagleView’s historical image library, dating back to 2002 in Florida, offers insurance carriers, first responders, non-profit organizations and local government agencies the ability to analyze the impact of the storm on homes, commercial buildings and infrastructure by comparing previously captured imagery with the latest post-event images.
Image capture and processing post-Hurricane Irma will take place continuously over several weeks, with EagleView making constant updates to its nearly four-petabyte imagery and data library.
“We have access to an impressive amount of resources in Florida and the surrounding areas, allowing us to provide the largest post-storm image capture capabilities to our clients,” said Jay Martin, senior vice president of operations for EagleView. “Our team is working around the clock to deliver imagery to those who need it most following these devastating weather events.”
EagleView is capturing varying types of aerial imagery throughout Florida. This includes its ultra-high-resolution (UHR) imagery, also known as Reveal imagery, which is the highest resolution aerial imagery available on the market today.
To assist with Hurricane Harvey and Irma emergency response and damage assessments efforts, Remote GeoSystems is donating LineVision software licenses to official agency, volunteer and non-profit drone operators.
In addition to supporting a Texas A&M team responding to Harvey, LineVision is being pre-deployed to volunteers organized by Florida State University’s Emergency Management and Homeland Security Program to help with the Hurricane Irma search and rescue and damage assessment.
Any other volunteer teams, first responders and non-profit organizations providing essential response and recovery services are encouraged to complete the contact form to request free copies of LineVision software for disaster relief efforts.
LineVision lets emergency response teams easily map drone video of Hurricane Harvey damage assessments. (Image: Remote Geosystems)
The LineVision solution is a commercial software suite for UAV, airborne and terrestrial mobile inspection and survey projects requiring geo-referenced video playback, analysis, collaboration and reporting using standard Esri maps and data, Esri ArcMap and Google Earth GIS applications.
Using the software, anyone with a GPS-enabled video camera, drone or geospatial DVR that can geotag video in the proper format can immediately load their videos and photos to Esri ArcGIS and Google Earth along with compatible geospatial data.
As the video plays, a position marker moves along an aerial or terrestrial GPS track positioned on a map, continuously indicating where the current frames were recorded. Users may also geospatially “navigate” a video recording by simply clicking a single point along an aerial or terrestrial GPS track.
The video then automatically advances to that point in the recording so that users can visually interpret what was recorded at that specific place and time. If something of interest is detected in the video, users may also “snap” an image from the video, which is geotagged and saved for future analysis.
In addition to video, users can import photos and documents from disaster survey and assessment projects. All these imported data types can be saved in a Remote GeoSystems “geoProject” file for data portability, reporting and future analysis in other versions of LineVision desktop, cloud and server applications.
Help with Harvey
Remote GeoSystems was contacted by the Texas A&M Engineering Experiment Station Center for Robot-Assisted Search and Rescue (CRASAR), who was deployed with the Fort Bend County Office of Emergency Management.
All parties involved moved quickly, and within a few hours after being contacted, drone video data collection teams were using various versions of the company’s donated LineVision video and photo mapping software to map and view interactive UAV flight tracks with corresponding videos in Esri ArcGIS and Google Earth GIS software.
The software is being used to help visualize, distribute and share the data available from a record 119 UAS flights that CRASAR conducted over 11 days, including 61 flights on a single day.
“We first learned about Remote GeoSystems’ LineVision software for mapping geotagged video from drones about a year ago, and at that time even did a proof of concept demo for the USCG and first responders,” said Justin Adams, Air Operations Branch Director for Fort Bend County Manned/Unmanned Ops and CRASAR director of operations for Harvey. “Now with the Texas Gulf Coast facing a long and difficult assessment and recovery process and Hurricane Irma bearing down on Florida, it became clear now was the time to deploy this valuable UAV solution to operators and volunteers working the affected areas.
“I have been involved in manned and unmanned aviation for the better part of two decades and Remote Geo offers not only the simplest, but most complete solution for rapid geospatial aerial and ground-based disaster assessment and reporting in the industry.”
Key Features of LineVision
Play videos from single and multi-camera data collection platforms
“Click-on-Map” video navigation
Set a custom geo-fence around the moving position marker
Load Esri ArcGIS or Google Earth-compatible geospatial data files
Save video and photo work as geoProjects for simple project reporting, archive and search
Esri has published a Hurricane Irma Resource Catalog in advance of the Category 4 hurricane cutting through the Caribbean islands on its path toward Florida.
The catalog features read-to-use applications compiled by the Esri Disaster Response Program (EDRP). EDRP is an around-the-clock service that helps with monitoring events online, discovering useful content, augmenting software and obtaining assistance from Esri experts.
To see the track of the hurricane, Esri provides its hurricane map.
Resources include:
Hurricane Public Information Map (PIM)
Hurricane Impact Summary
Hurricane Force Wind Impact Summary
Storm Surge and Flooding
Storm Surge Inundation
Hurricane Evacuation Zones
Waze Alerts – Hurricane Irma
Florida 511 – Real-Time Traffic Information
Hurricane Irma Photo Story Map
Airport and Port Status
NOAA Real-Time Coastal Observations
Florida Division of Emergency Management Open Data
Waze alerts light up Florida highways as people evacuate. (Image: Esri)


 The workshop is part of the OGC’s