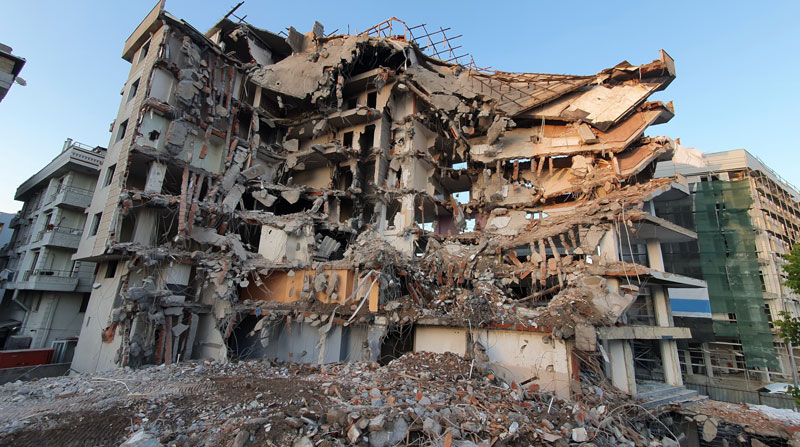
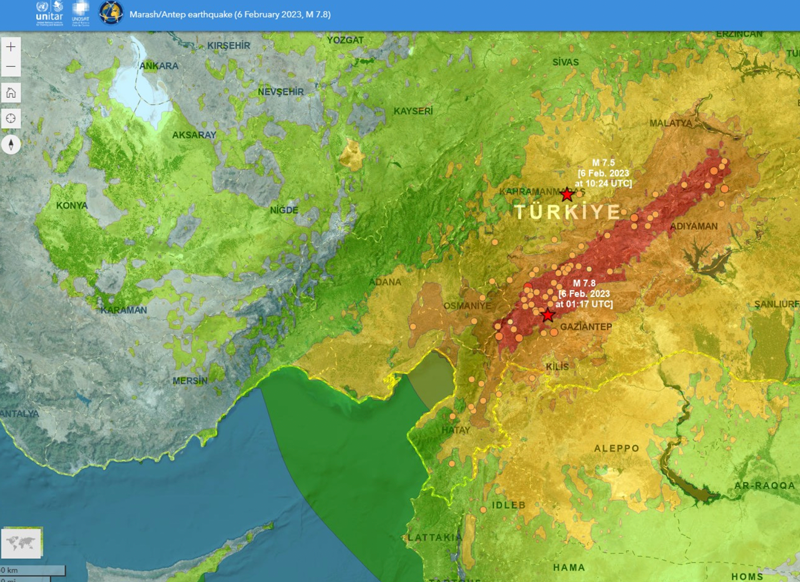
Türkiye is no stranger to earthquakes. In February 2023, a devastating 7.8-magnitude earthquake struck near the Türkiye-Syria border, followed by another nearly as strong.
Six Turkish universities have launched a real-time geodetic monitoring network to track earthquake-related ground deformation across Thrace and the Southern Marmara region, reports Hürriyet Daily News.
TR-TRAK-GNSS will monitor seismic and tectonic activity using 28 GNSS stations. The system is designed to evolve into a major scientific and early-warning infrastructure capable of detecting tectonic deformation in real time and identifying structural movements in buildings across cities and university campuses.
Once fully deployed, the network will form a continuous monitoring ring encircling Thrace and Southern Marmara.
The project will be financed through each participating university’s Scientific Research Projects resources, with institutions covering the installation costs of GNSS stations within their own areas of responsibility.
“Seen & Heard” is a monthly feature of GPS World magazine, traveling the world to capture interesting and unusual news stories involving the GNSS/PNT industry.
Image: Dennis Laughlin/iStock/Getty Images Plus/Getty Images
GNSS records Alaska earthquake data
Researchers in Alaska were able to compare the quality of GNSS and seismic station data when assessing the magnitude 8.2 Chignik earthquake near Dillingham, Alaska. Research recorded by Revathy Parameswaran and colleagues at the University of Alaska, Fairbanks, shows that GNSS and acceleration seismic data can be used interchangeably or in tandem to estimate rapid magnitude or ground motion. The research showed the Chignik earthquake velocity records were almost identical at co-located GNSS and seismic stations for observations at frequencies of less than 0.25 Hz.
No more high-speed chases
Image: Screenshot from CBS New York video
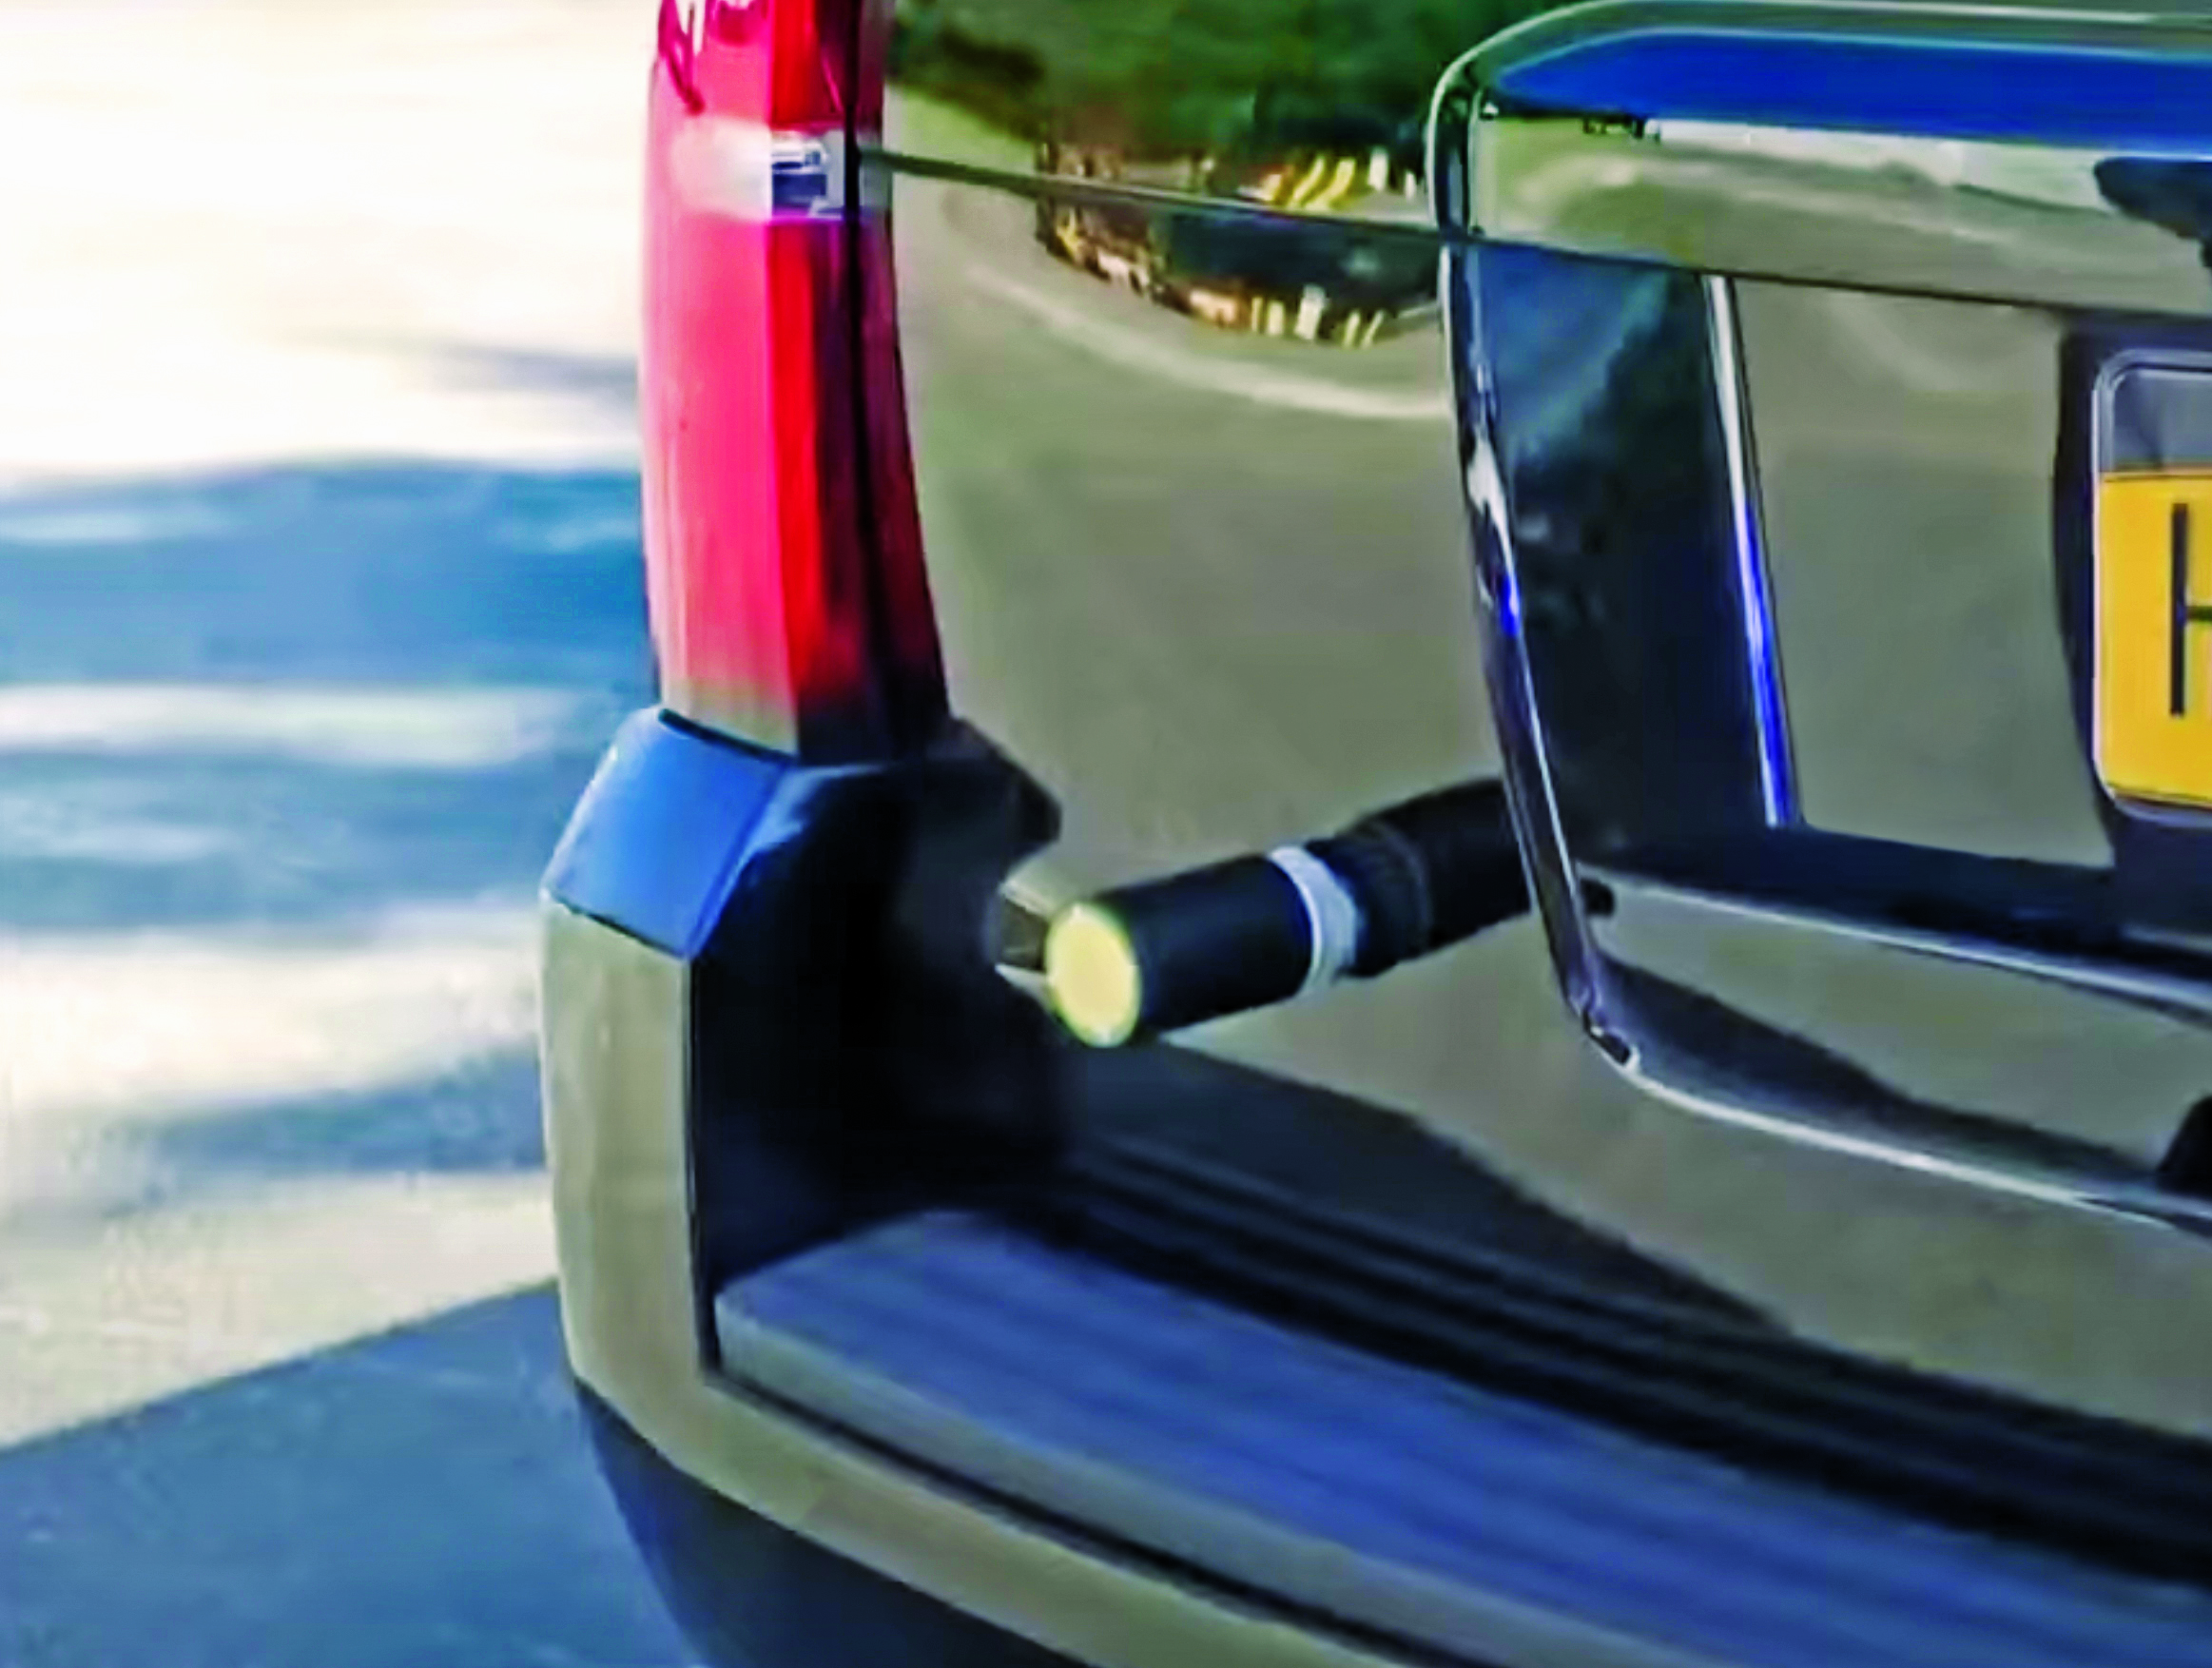
The Old Westbury Police Department of Long Island, New York, has chosen a high-speed pursuit alternative — GPS-equipped darts that relay the current location of suspects, reported CBS New York. It took $36,000 to equip six patrol cars with the air-powered dart launcher, called StarChase, which can be activated from inside the patrol car. When the launcher is activated, it shoots onto the suspect’s vehicle a dart with a GPS receiver inside and an adhesive exterior. It is considered a safe alternative to high-speed chases and safe to use around pedestrians.
Shou Zi Chew, CEO of the popular app TikTok, testified before Congress that TikTok does not collect precise location data from its users. During the hearing, which lasted for more than five hours, Chew assured committee members the app does not collect nor distribute location data. TikTok is under fire as a bipartisan Senate proposal is aimed at banning the social media app, arguing it poses cybersecurity risks. The House Committee interrogated Chew regarding the app’s algorithmic feed, policies for young users and — given TikTok’s Chinese ownership — the amount of access the Chinese government has to user data.
Just some water, please
Image: Bob Douglas/iStock/Getty Images Plus/Getty Images
Satellite mapping data analyzed at Graz University of Technology’s Institute of Geodesy has revealed long-term drought conditions in Europe, reported GIM International. The data confirmed groundwater levels have been low consistently since 2018. The drought situation was originally published by Eva Boergens in “Geophysical Research Letters” in 2020 when she noted there was a severe water shortage in Central Europe during the summers of 2018 and 2019. There has been no significant rise in groundwater levels since then, and groundwater levels have stayed constantly low.
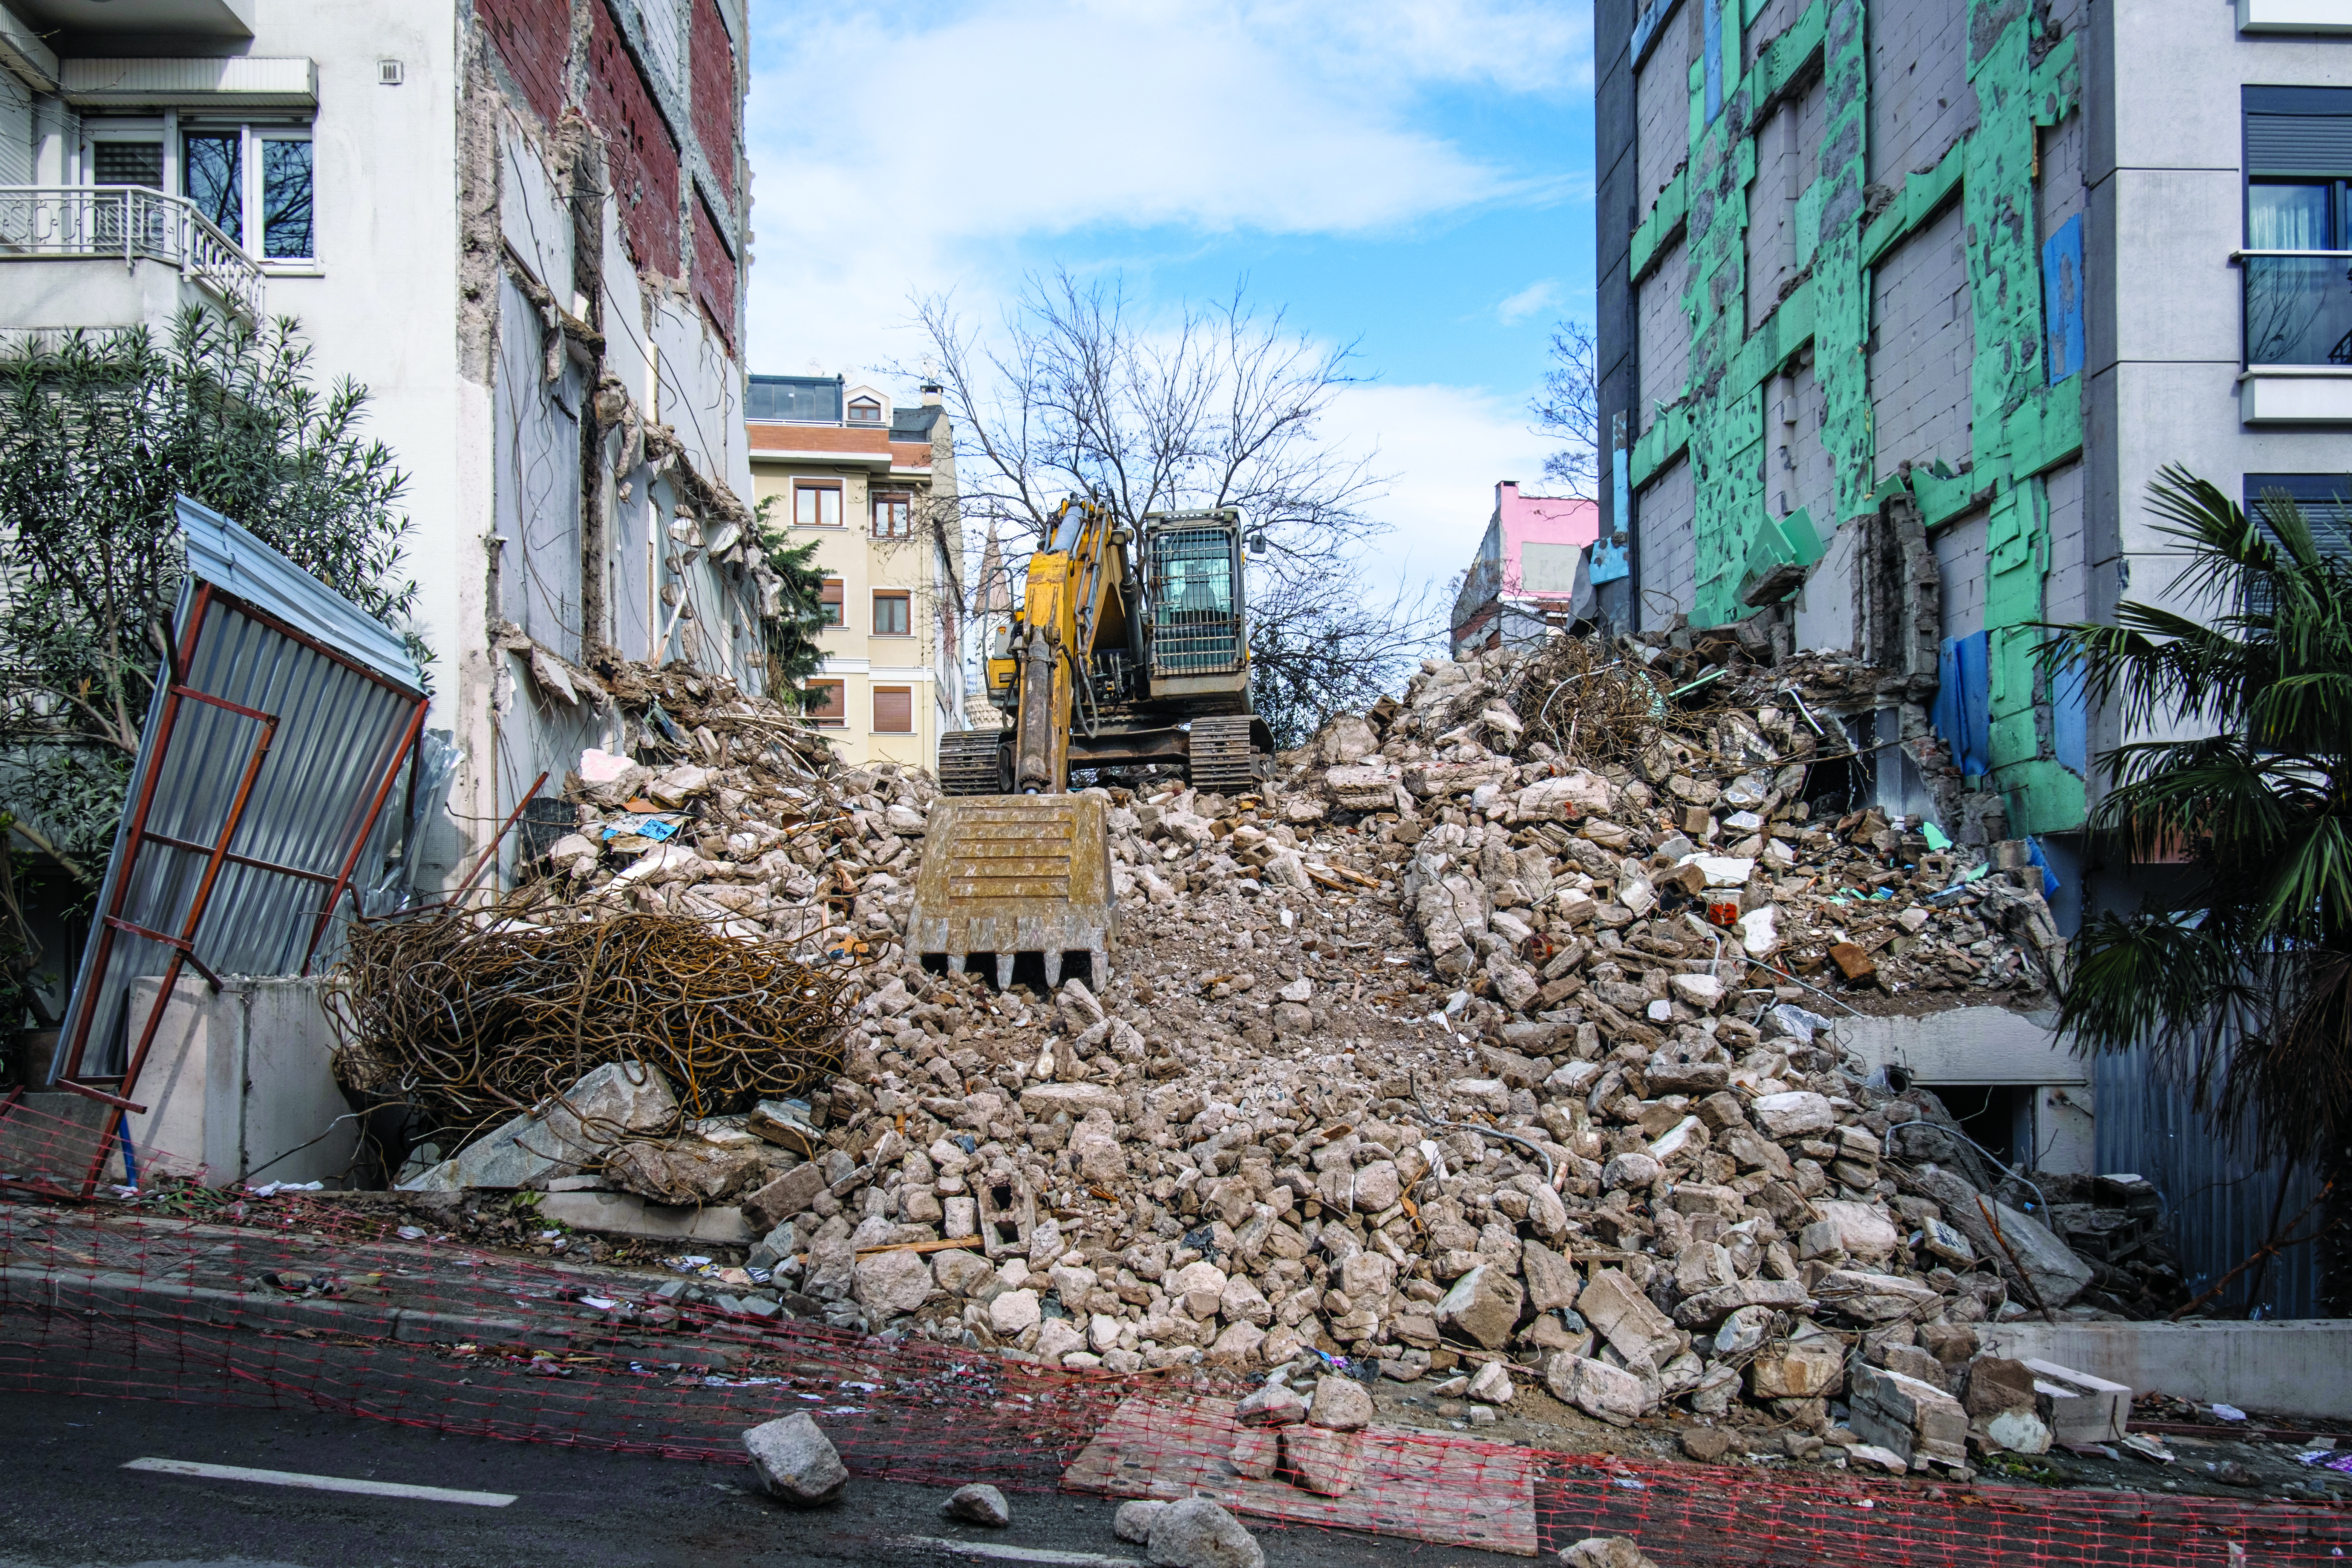
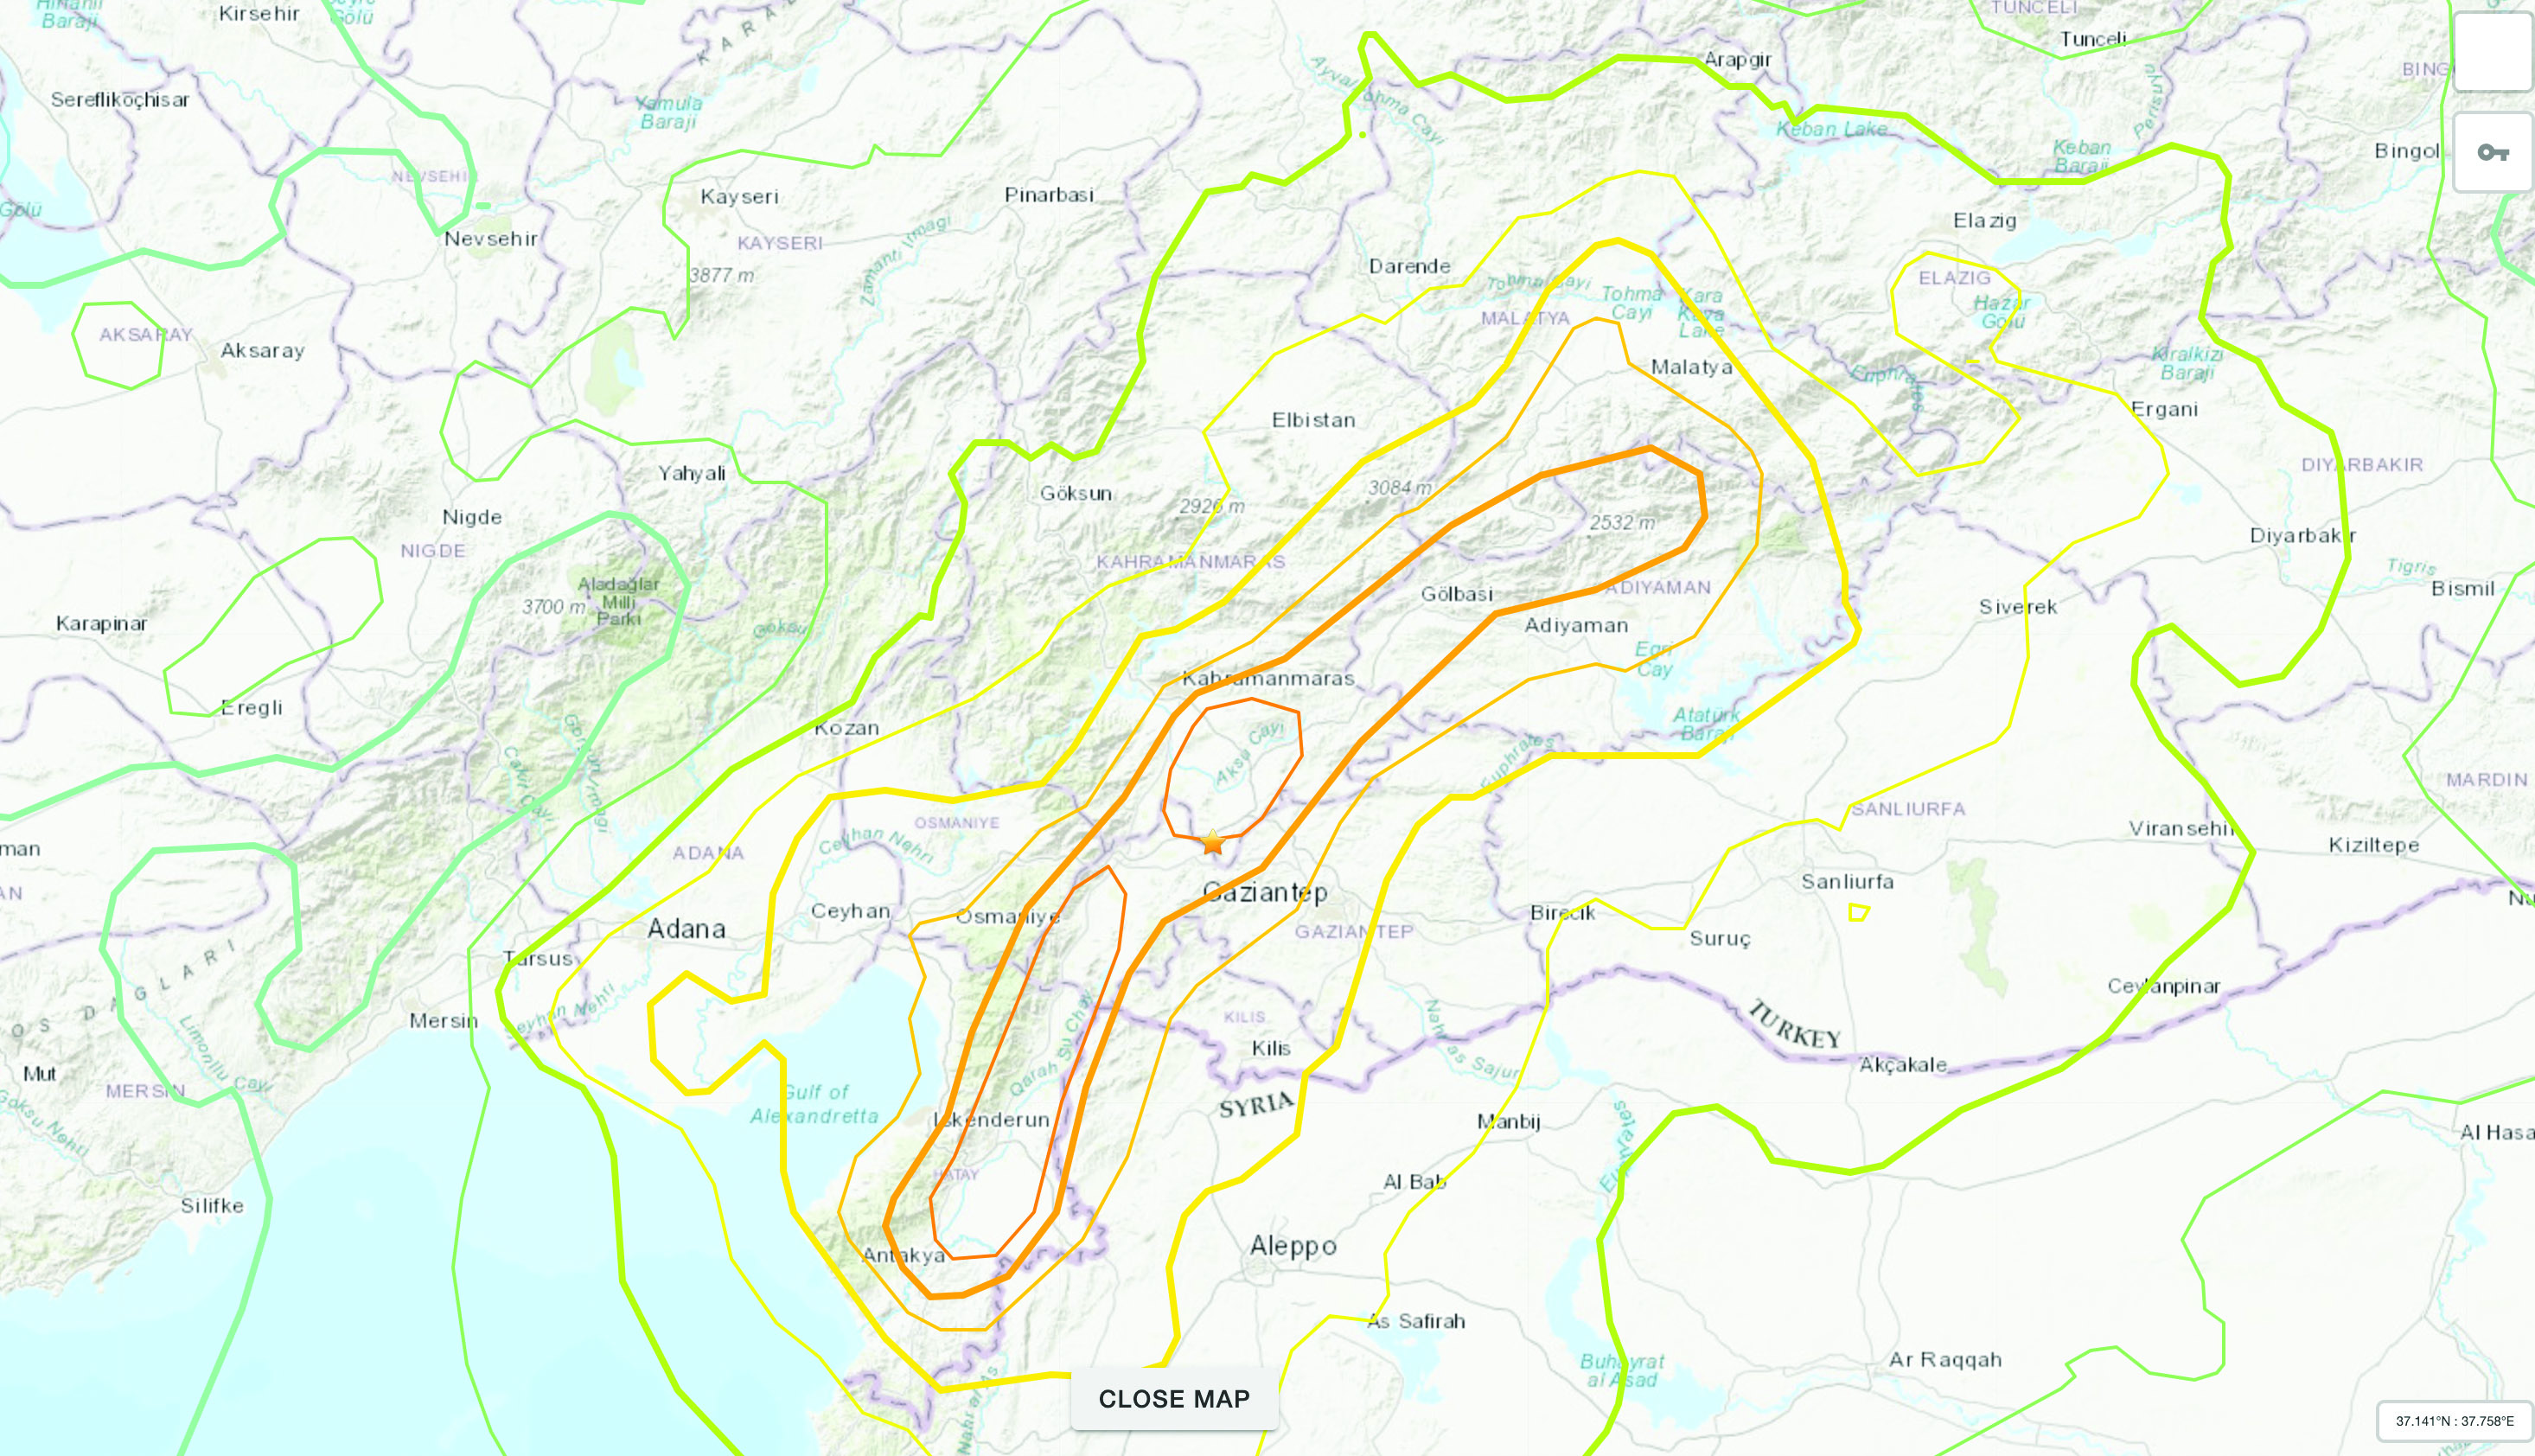
The Mw 7.8 and Mw 7.5 Kahramanmaraş Earthquake Sequence struck near Nurdağı, Türkiye, on Feb. 6. It collapsed several buildings and has claimed more than 50,000 lives. The impact of the initial earthquakes was very severe, but to make matters worse, later in February, a Mw 6.4 tremor struck near Antakya, a city near Türkiye’s border with Syria. This created further damage to infrastructure and claimed more victims.
Image: Screenshot of video from NBC News
The Specifics
The United States Geological Survey reports that the earthquake resulted from strike-slip faulting at shallow depths. The earthquake sequence displaced numerous fault segments within the East Anatolian Fault zone. Early estimates indicate about 185 miles of fault length ruptured. Parts of the North Anatolian Fault shifted 10 feet, while segments of the East Anatolian Fault slid more than 30 feet.
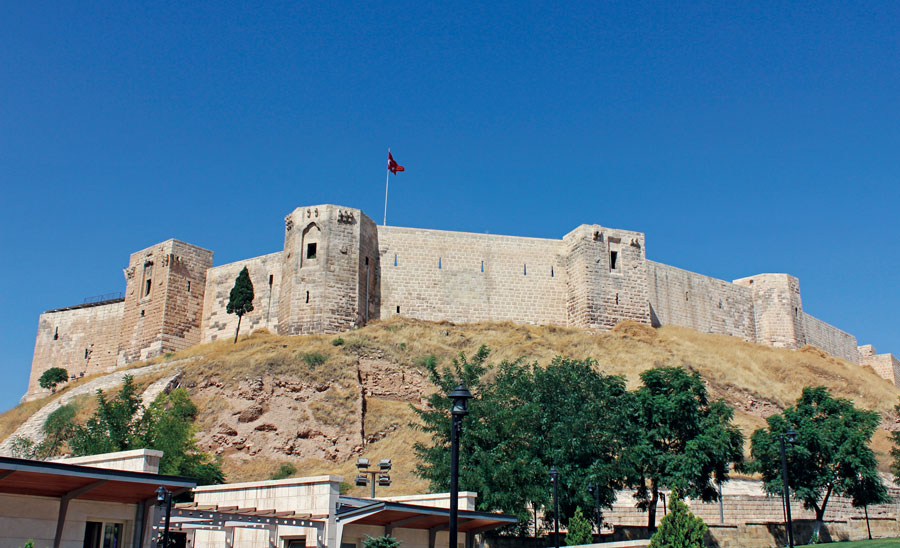
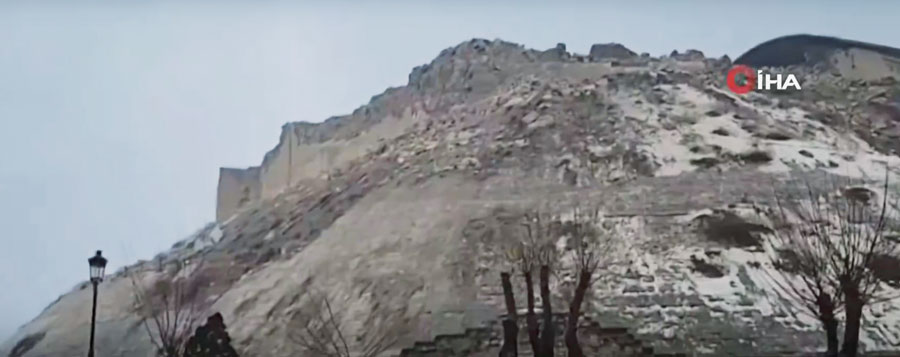
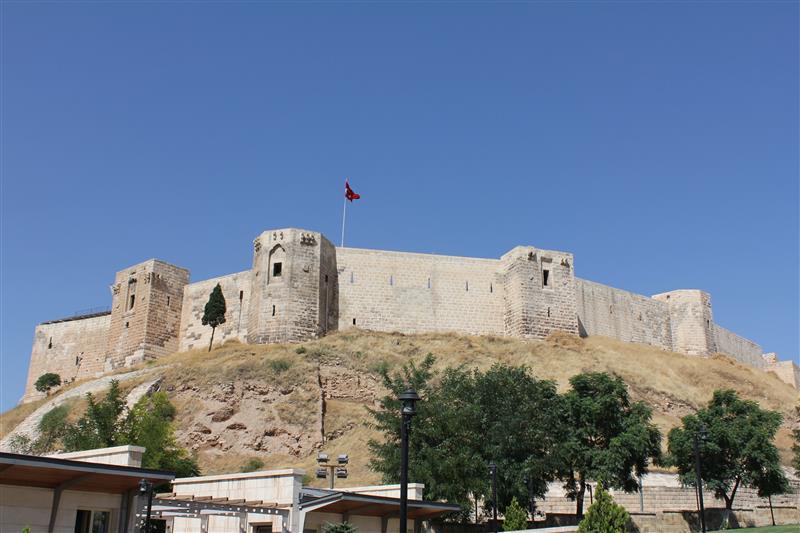
Historic Site Suffers
Gaziantep Castle dates back to the second millennium B.C. It has been used in many capacities throughout history, and more recently, stood as a museum for visitors to learn about its rich history. The castle was reduced to rubble in the earthquake. Other historical sites that sustained damage include the Yeni Mosque and the ancient city of Aleppo in Syria.
Image: Screenshot of CNN video
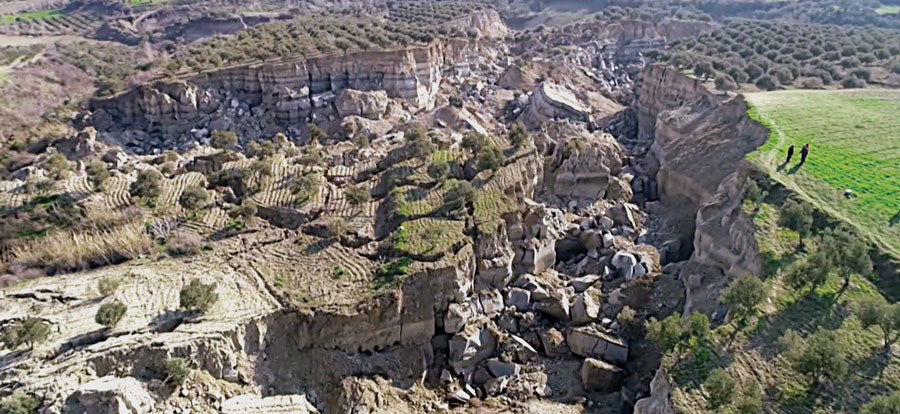
Earth Opens Up
The earthquake destroyed cities all over Türkiye and northern Syria, but they are not the only areas that suffered dramatic effects. A verdant olive grove in Tepehan, Hatay Province, Türkiye, was completely divided when the ground split, creating a 984-foot-long valley in the middle of the grove. The valley is more than 130 feet deep and has created issues for the 7,000 people that inhabit the area.
On Feb. 6, a magnitude 7.8 earthquake struck Turkiye and northern Syria creating enormous damage throughout both countries. (Image: mustafaoncul/iStock /Getty Images Plus/Getty Images)
Geographical information of urban areas is critical because it forms the basis for planning, intelligent urban modeling and disaster mapping and management. For many decades, ground surveys and aerial photographs were used as the primary tools for collecting this data. Starting in the 1990s, these methods were replaced by such advanced remote-sensing technologies as synthetic aperture radar (SAR) and ground-based interferometric radar (GBIR).
This article explores the use of software-defined radio (SDR) platforms for acquiring high-resolution SAR/GBIR images, including:
How low-cost commercial-off-the-shelf SDR platforms can be used to realize complex systems for acquiring images and processing measurements.
How different specifications of SDRs make them suitable for use in SAR applications.
Hazard Monitoring in Urban Areas
Many urban areas and critical infrastructure are in regions highly prone to natural disasters such as volcano eruptions, earthquakes, avalanches and landslides, or near man-made systems such as dams and quarries. Monitoring of surface changes and structures is integral to the mitigation of risk and ensuring public safety. Modern remote-monitoring systems allow surface displacements to be monitored without the need to access a location. With these systems, several square kilometers of Earth’s surface can be monitored at once and with high accuracy. The sub-millimeter accuracy of modern remote-monitoring technologies enables accurate measurements to be collected with impressive precision, including in rainy and foggy conditions.
Remote-monitoring systems are autonomous and can operate for a long time without human intervention. Their real-time feedback makes them suitable for use as early-warning systems. In addition, these monitoring systems can be integrated into a wide range of sub-systems, such as decision support systems that assist decision makers in assessing emergency plans and selecting the best options.
Using Radar to Measure
Details of the surface observed by a SAR satellite are encoded in the amplitude and phase of a SAR image. The amplitude component contains information about the surface roughness and terrain slope of the target area, while the phase component contains information about the elevation of the satellite.
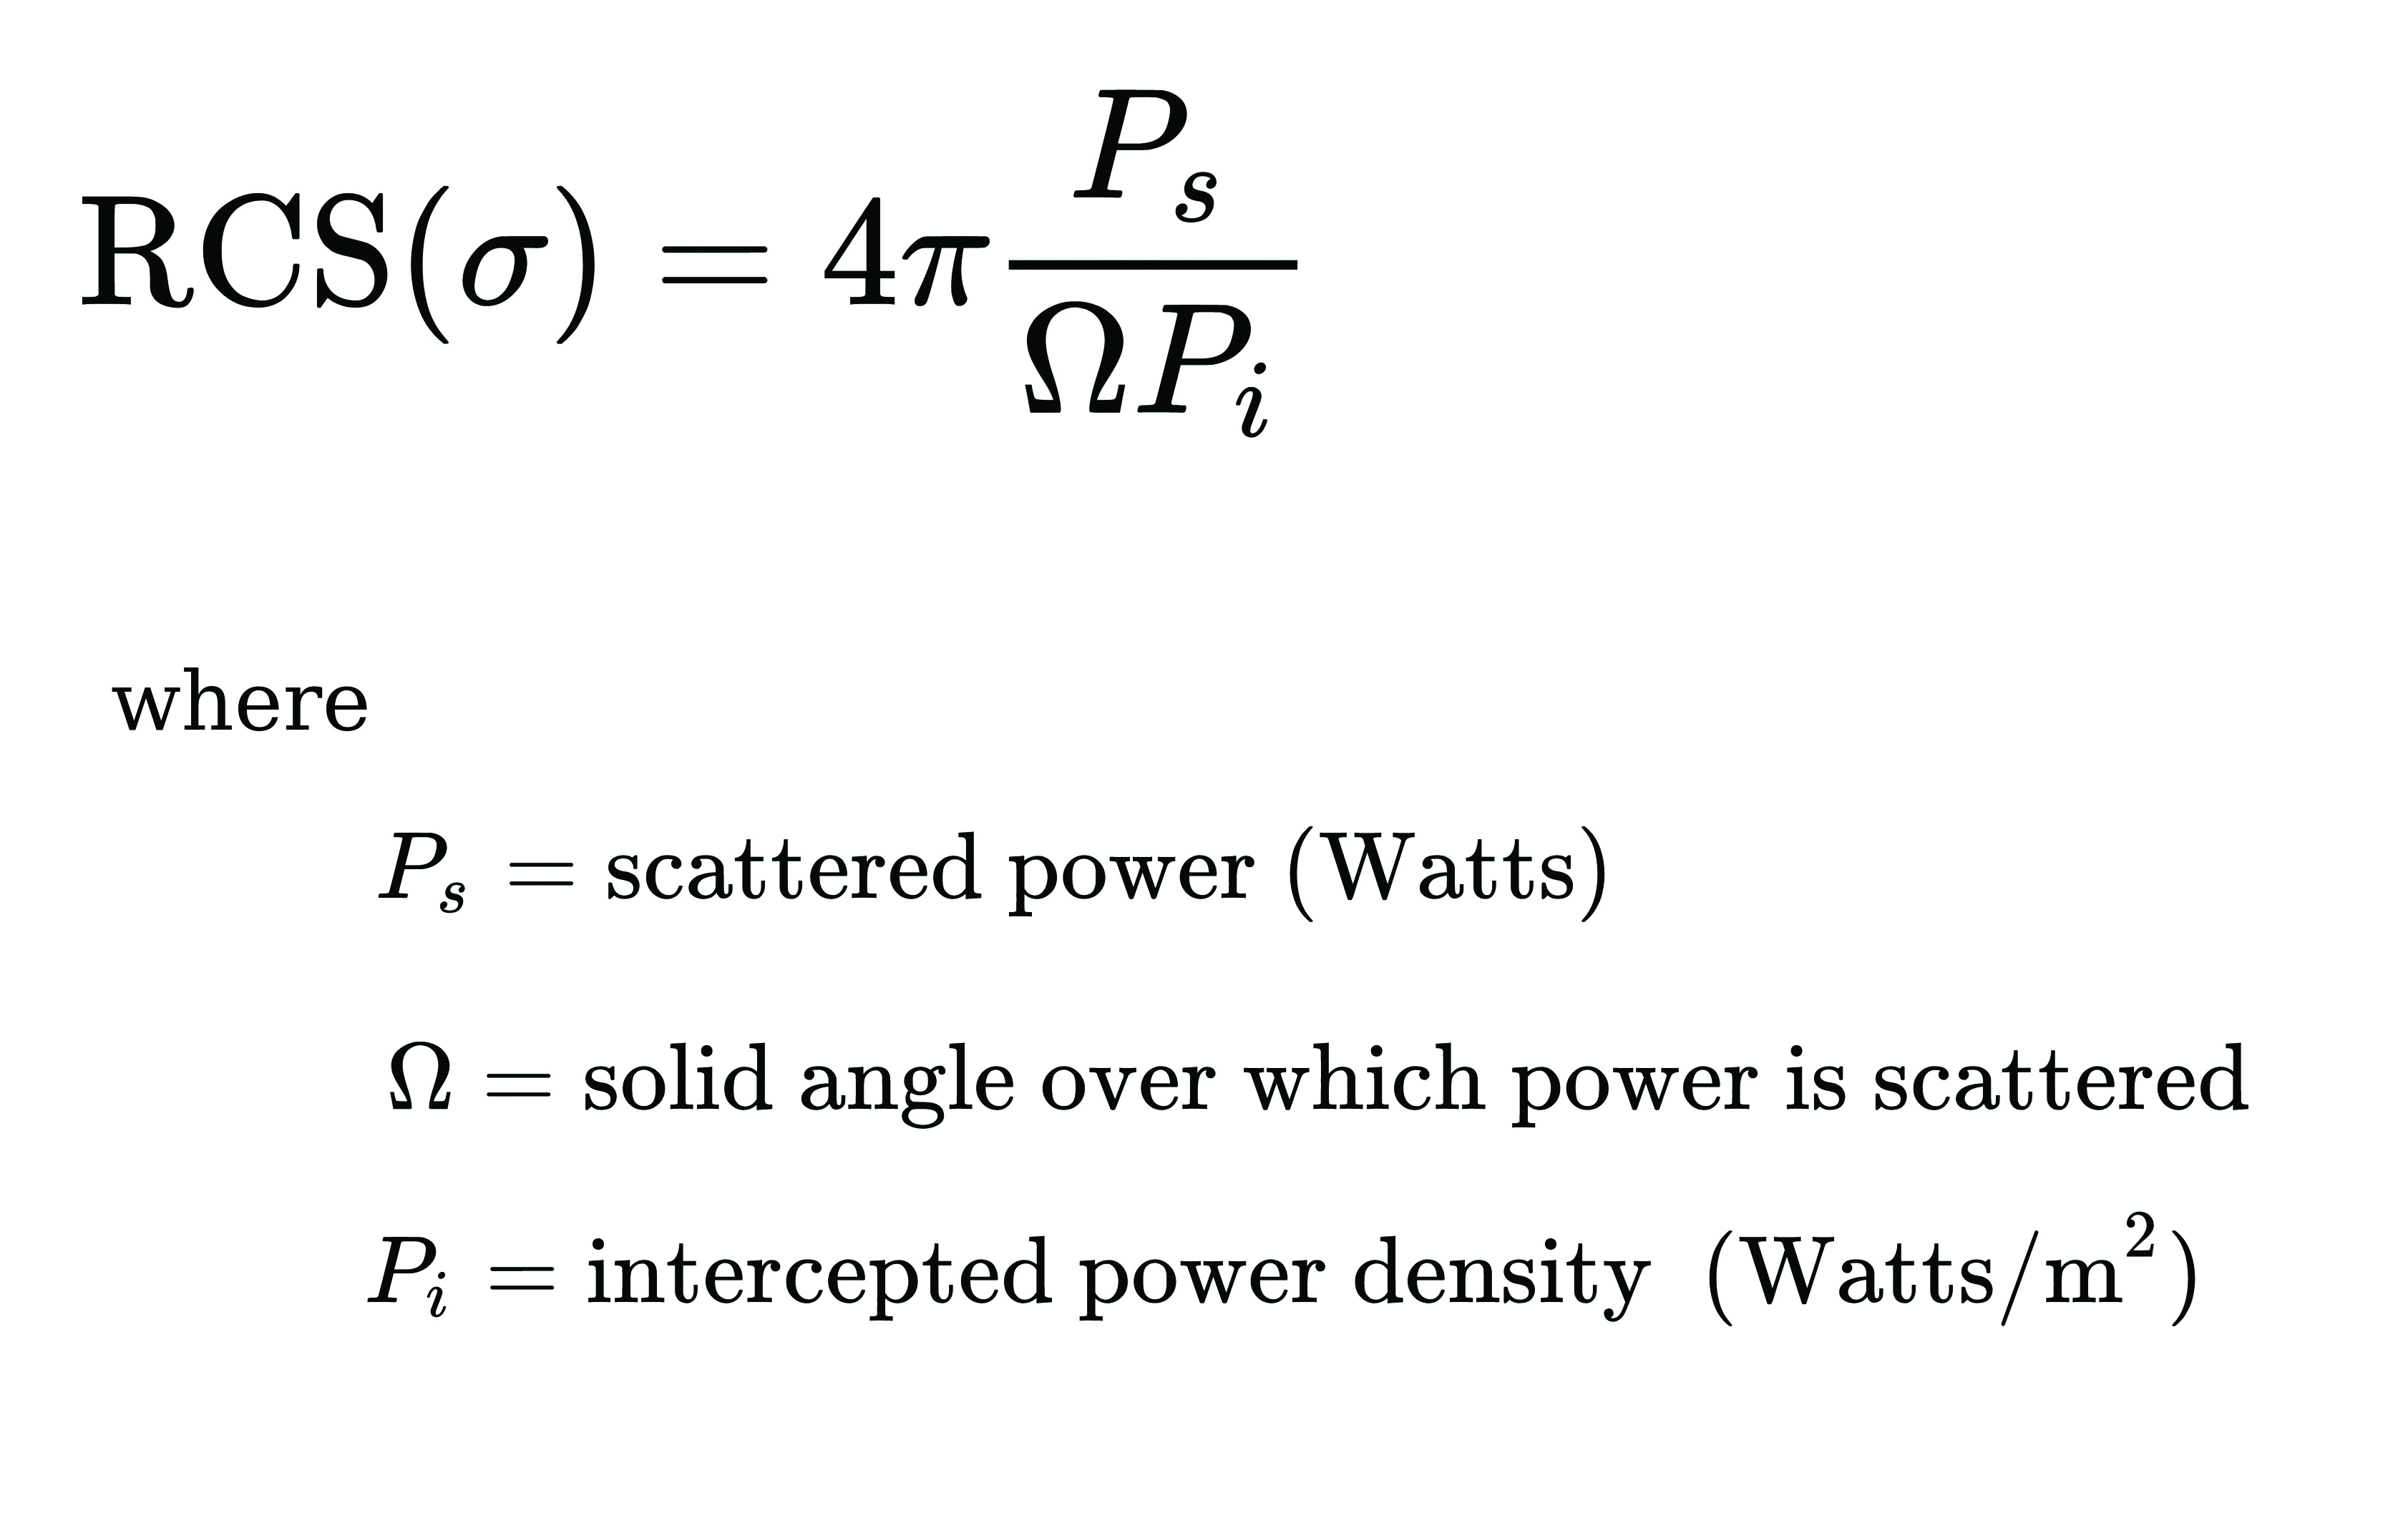
A typical SAR satellite transmits microwave signals toward a target area at an oblique angle and measures the backscattered signal. The intensity of the reflected signal is mainly determined by the roughness and the structure of the target, and the distance between the satellite and the target. This measurement is usually described in terms of the radar cross-section (RCS) parameter, which is obtained by calculating the ratio of the scattered to the intercepted signals as shown in this equation:
The RCS parameter is mainly dependent on the surface roughness and the dielectric properties of the target object.
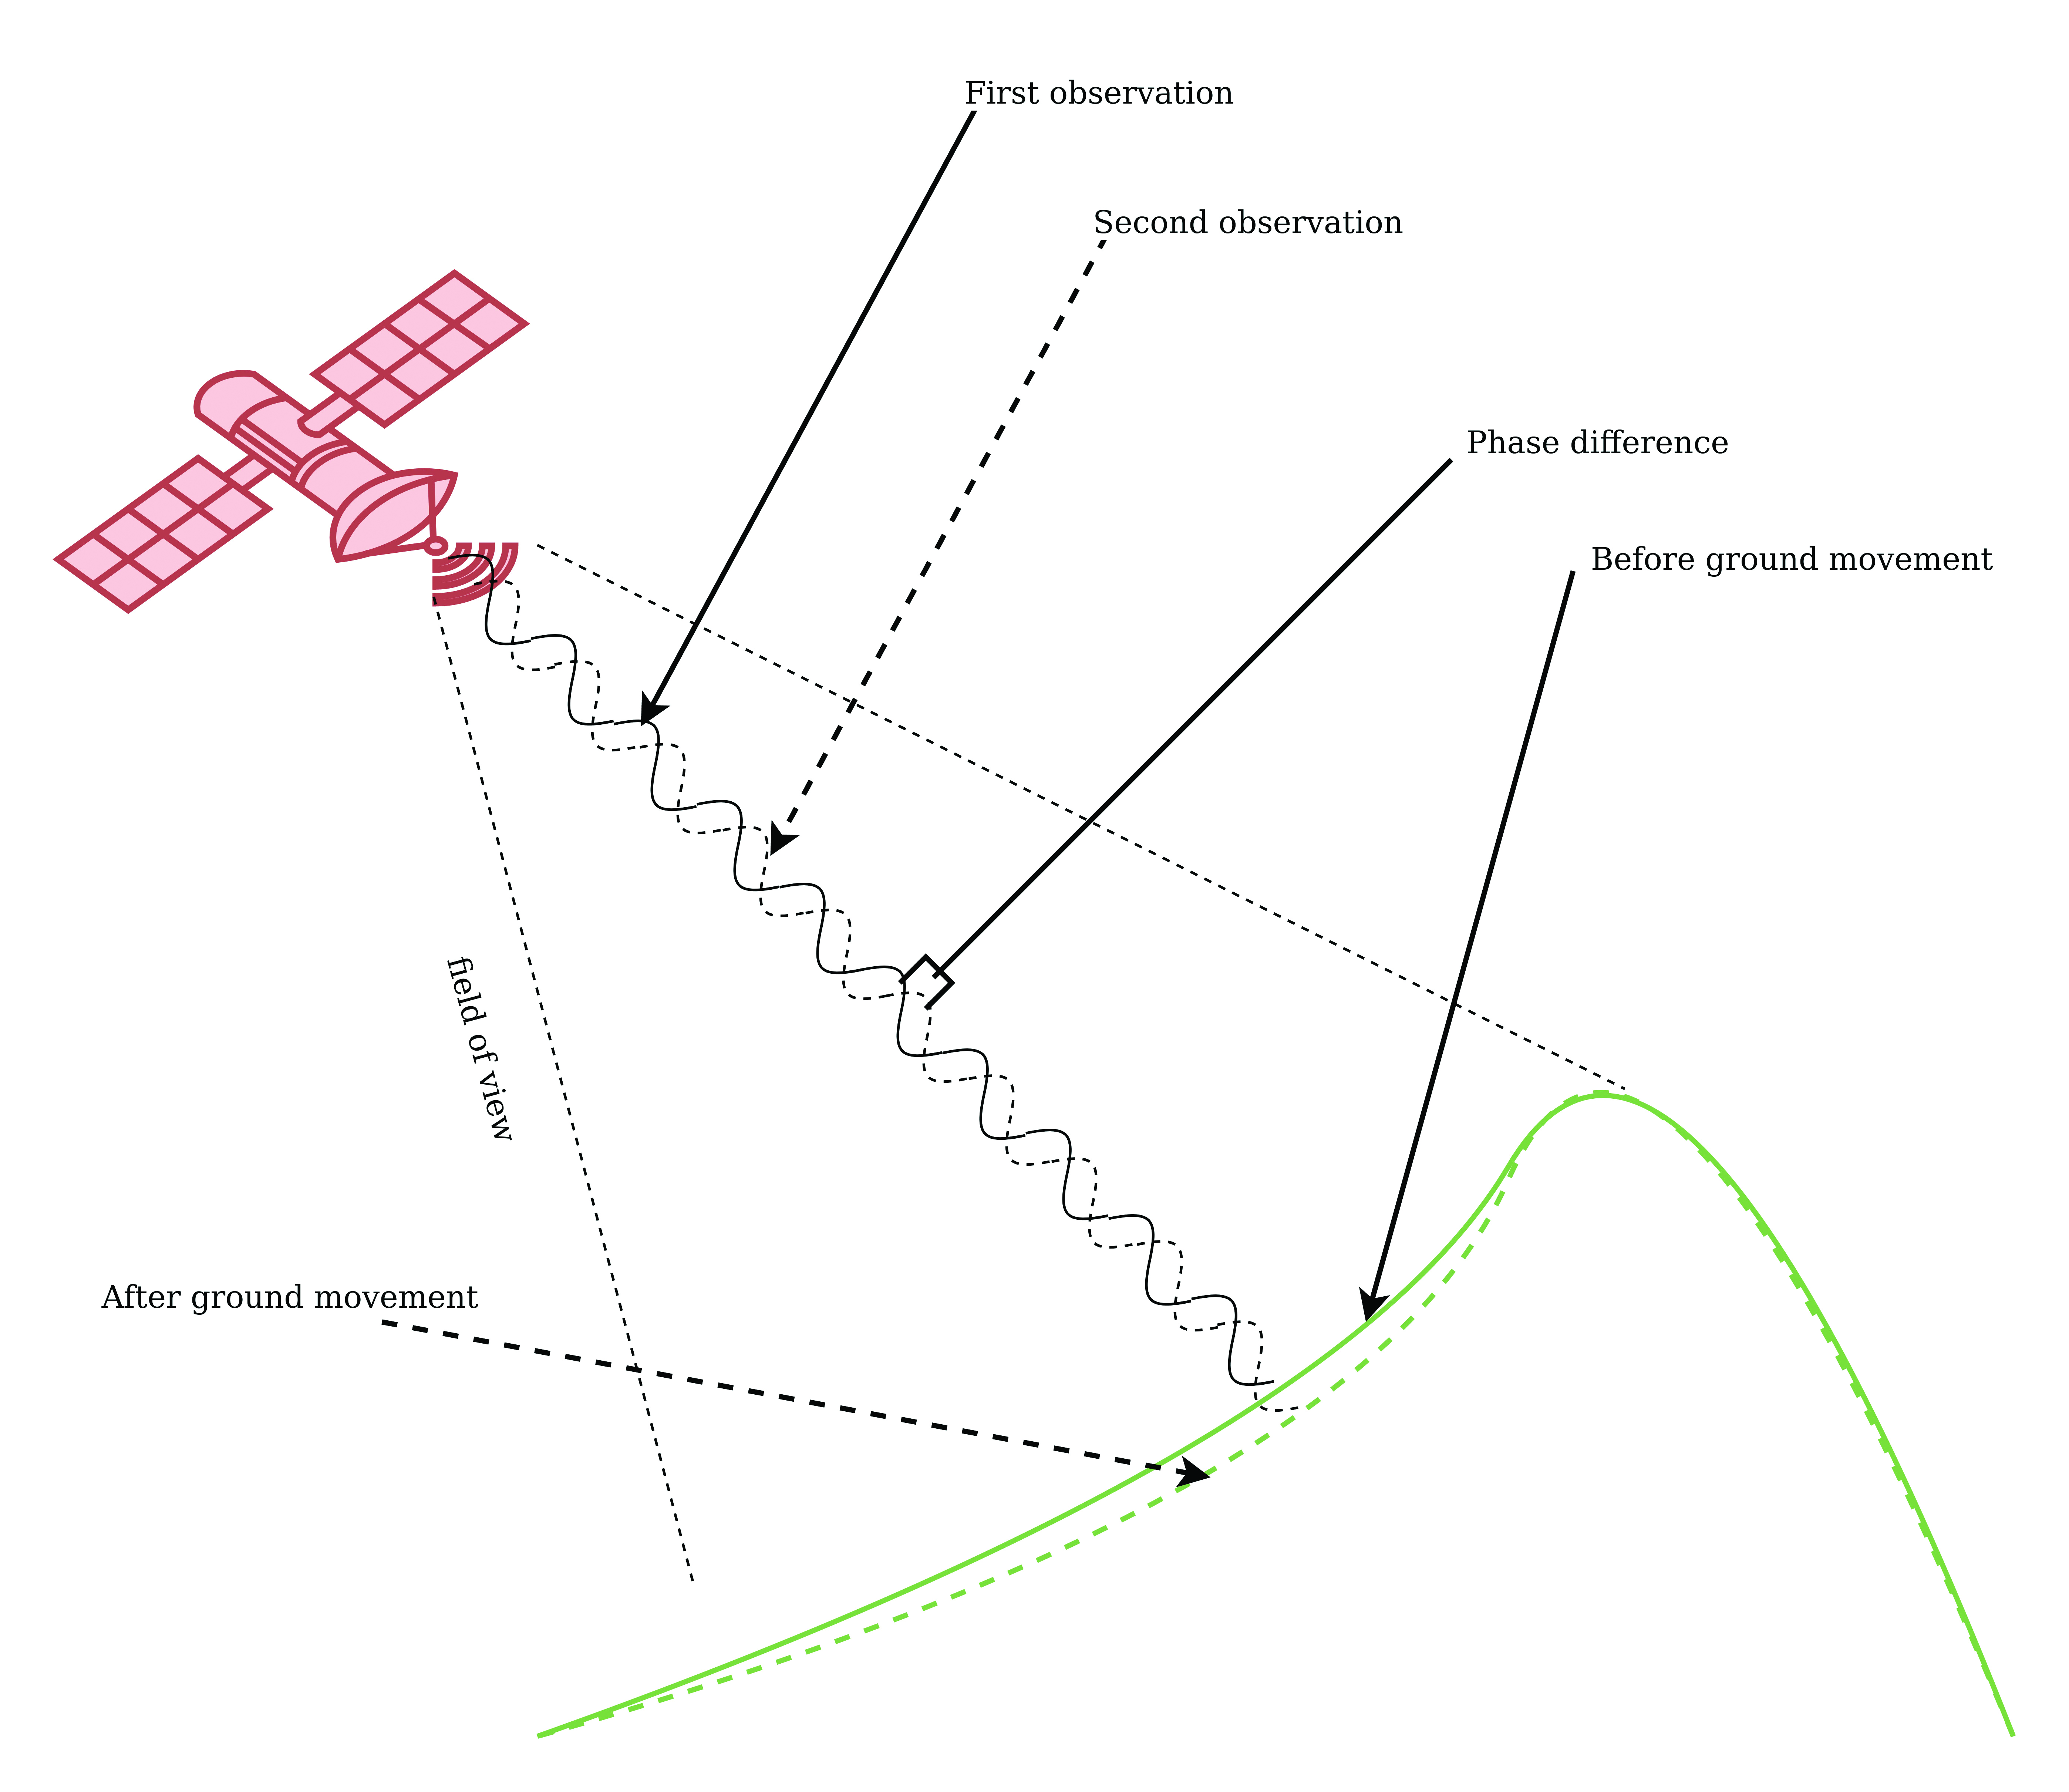
The interferometric SAR (InSAR) technique allows surface movements to be identified. These observations also can be used to measure and monitor changes associated with volcanic eruptions, tectonic activity and other geophysical processes. To identify crustal changes using this geodetic technique, at least two SAR images are required.
Figure 1. Phase shift in InSAR observations due to ground movement. (Image: Simon Ndiritu)
In differential InSAR, two images of the same location that are recorded at different times are used. If a surface movement has occurred between the first and the second acquisition, a phase shift is observed (Figure 1). The presence of interference fringes on an interferogram is an indicator of a phase shift and these fringes are summed during processing to provide a relative value of the phase change.
Ground-based SAR (GBSAR) employs the synthetic aperture radar technique to capture high-resolution images of the electromagnetic reflectivity of a target. This remote-sensing system is commonly used for monitoring civil infrastructure, buildings, mines, landslides, glaciers and more. While spaceborne SAR is capable of surveying large areas and records data over long periods of time, usually several weeks or months, GBSAR is suitable for monitoring small areas and has short sampling periods, usually a few minutes. In most surveying applications, the two remote-monitoring techniques are used together in a complementary fashion to enhance the overall performance.
The all-weather monitoring capability of satellite-based SAR makes it a popular tool for natural disaster management. Since the launch of the first SAR satellite in 1991, this technology has provided many emergency response teams with important insights on manmade and natural hazards. SAR data can be used to study different aspects of long-term behaviors of slow-moving surfaces, which is critical for planning emergency response to natural hazards such as volcanic eruptions, landslides and avalanches. SAR satellites orbit Earth at altitudes of between 500 km and 800 km and operate in the C-band (5 GHz to 6 GHz), X-band (8 GHz to 12 GHz) and L-band (1 GHz to 2 GHz). The temporal resolution of these satellites is mainly determined by their revisit periods.
Software-Defined Radio Platforms
A typical SDR platform features a radio front end (RFE) and a digital back end, with the RFE performing receive (Rx) and transmit (Tx) functions and offering a wide tuning range, typically 0 GHz to 18 GHz. This range is acceptable for widely used bands in SAR applications, including L-band, C-band and X-band.
The digital back end of a high-performance SDR system features a field programmable gate array (FPGA). This FPGA offers a variety of digital signal processing (DSP) capabilities, including upconverting, downconverting, modulation and demodulation. In addition, an SDR platform offers multiple transmit and receive channels, making it suitable for implementing multi-in multi-out (MIMO) radar systems.
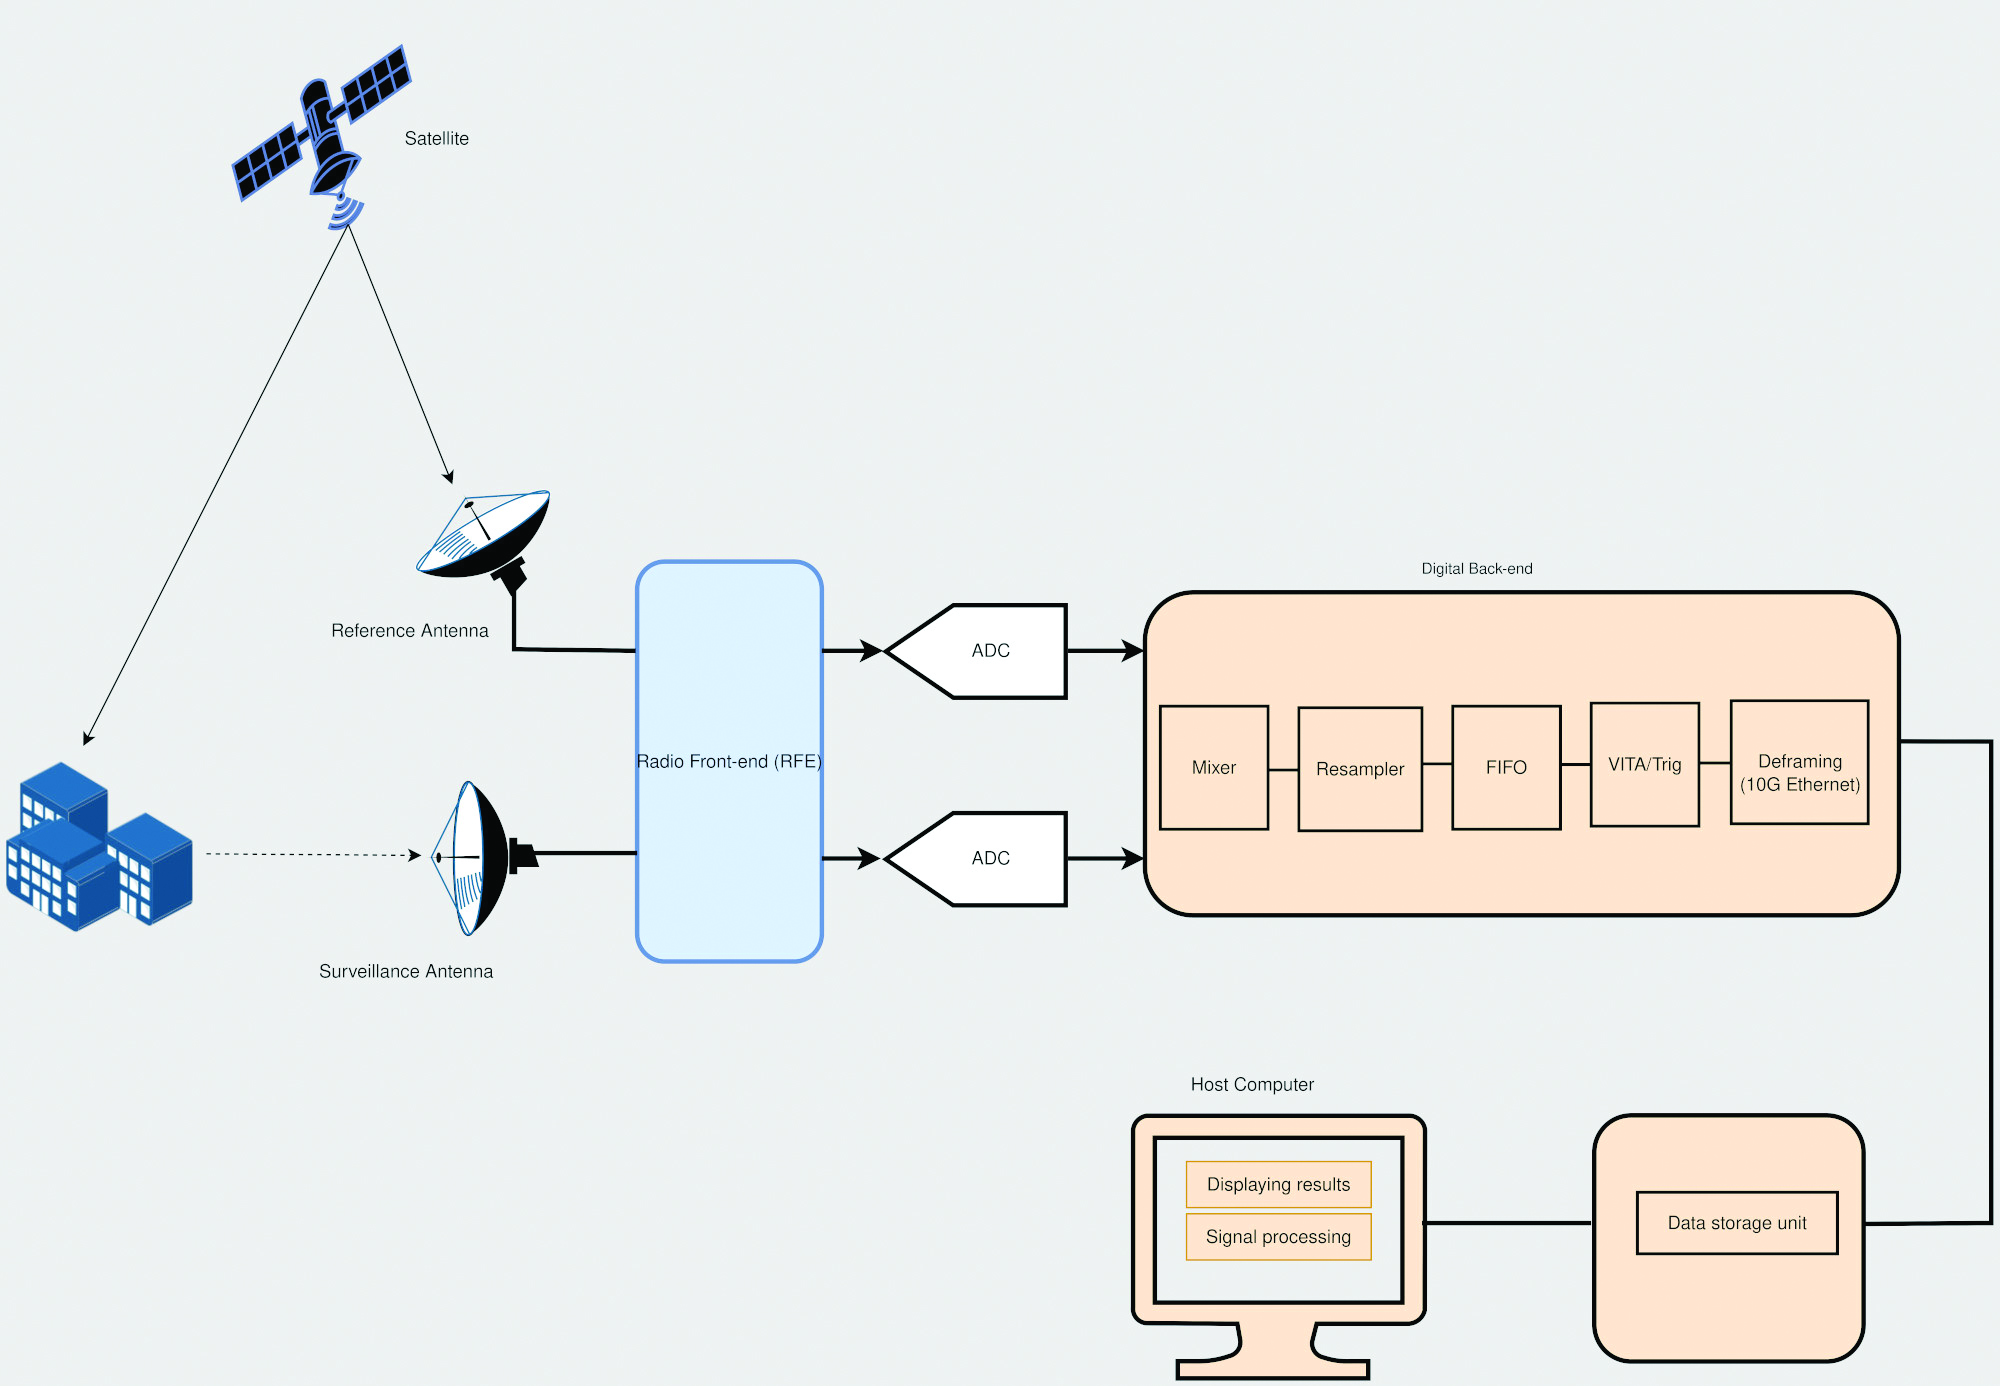
The architecture of SDR platforms allows them to integrate easily with a wide range of complex systems, such as SAR systems. The reconfigurability of SDRs allows upgrades and updates to be implemented without modifying the existing hardware, and can be designed to meet the size, weight and power (SWaP) requirements of an application. These features make SDRs suitable for implementing custom SAR monitoring solutions in small and large ground stations (Figure 2).
Figure 2. A simplified diagram of an SDR-based SAR system is shown, which employs a mobile-transmitter fixed-receiver passive bistatic SAR (MF-PB-SAR) architecture. (Image: Simon Ndiritu)
Integrating SDRs with SAR
A software-defined radar (SDRadar) is an SDR-based radar system that offers high flexibility and robustness. Compared to conventional radar, SDRadar offers many benefits, including the opportunity to reuse hardware, develop multi-function radar solutions, achieve faster development cycles, and have easier implementation of updates and new algorithms.
Tests with prototype SDR-based GBSAR systems have revealed the strong potential of SDR-based implementations. The MIMO architecture of an SDR platform allows realization of complex multi-frequency GBSAR systems uniquely suited for measuring displacement and other geophysical characteristics of landforms. SDR-based GBSAR systems can operate in different frequency bands and offer unmatched flexibility when it comes to signal generation and digital signal processing.
Many prototypes of airborne/satellite SAR systems based on SDR platforms have been implemented and their performance evaluated. Results have shown that they can offer better performance compared to conventional implementations. The use of multiple independent channels by SDR platforms allows the realization of compact and power-efficient multimode SAR systems, while the architecture of an SDR platform allows complex signal processing techniques such as digital beamforming (DBF), null steering and direction of arrival estimation to be implemented on FPGA.
Benefits of Integrating SDRs with SAR Solutions
Integrating SDRs into SAR systems provides many benefits. The MIMO architecture of SDR systems provides more channels than are required for SAR functions. The extra channels can be used for other applications such as satellite communications during emergencies. The wide frequency-tuning range of an SDR system allows the realization of a multi-function system with applications using different frequency bands. The reconfigurability of SDR platforms allows them to be repurposed for other applications. In addition, this reconfigurability enhances reusability, scalability and power efficiency. The low-latency FPGAs in high-performance SDR systems allow the realization of ultra-high-speed DSP algorithms for use in image processing and DBF.
Conclusion
The reconfigurability and impressive performance features of SDR platforms make them ideal for implementing scalable and flexible SAR monitoring systems for measuring land changes. The wide tuning range and MIMO architecture of SDR devices allows realization of a multi-function and multi-frequency system using a single device. In addition, the reconfigurability of SDR devices allows hardware reuse and low-cost implementation of updates and new algorithms.
Brendon McHugh is the field application engineer and technical writer at Per Vices. He possesses a degree in theoretical and mathematical physics from the University of Toronto.
Simon Ndiritu is an independent technical writer for Per Vices with a background in electrical and electronic engineer with a wealth of experience in designing hardware and firmware. He also has a passion for writing.
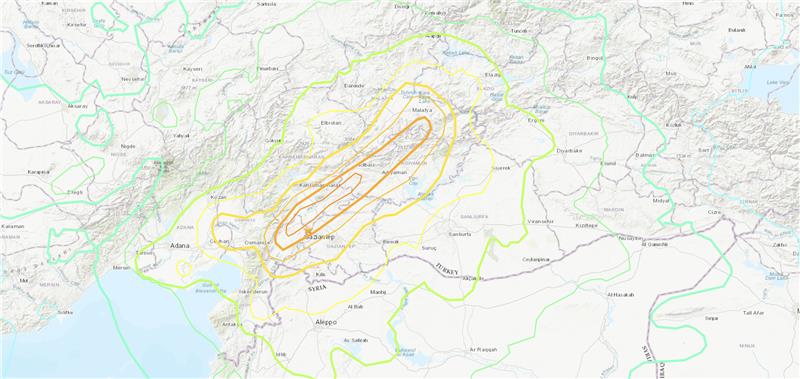
GMV is using high-resolution optical imagery as a part of emergency management efforts, to map the population and infrastructure of several cities in Turkiye after the 7.8 magnitude earthquake. The imagery of the aftermath is thanks to Europe’s Copernicus program, which keeps satellites and Earth observation services operational to support management and decision-making in different areas, particularly in the field of emergency management.
The satellite images show the challenge faced by rescue teams and reveal the massive amounts of destruction caused in cities across Turkiye and northern Syria. (Image: GMV)
GMV is one of the suppliers of Copernicus program infrastructure. GMV monitors the database architecture and ensures its integrity, analyzes the data required by the service chains, and identifies the most suitable technologies to keep the entire program operational.
GMV is working with the EU Civil Protection Mechanism’s Emergency Response Coordination Center to keep them updated on the ongoing emergency situation.
For more on the emergency satellite mapping, visit the Copernicus website.
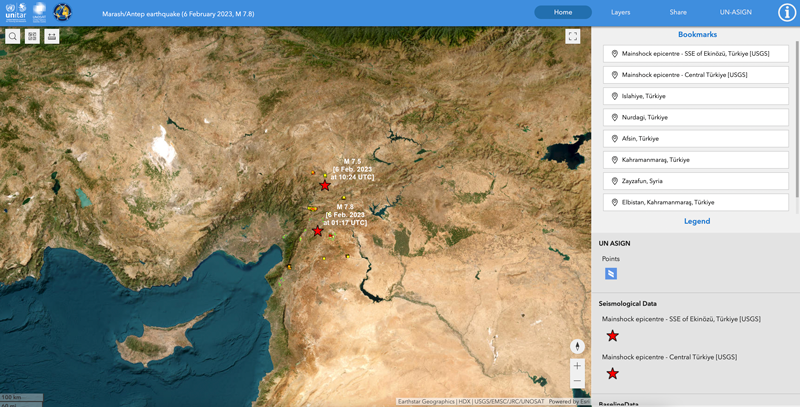
On Feb. 6, the United Nations Satellite Center (UNOSAT) announced via Twitter that it had activated emergency mapping services of Turkiye and northern Syria after the magnitude 7.8 earthquake hit earlier that day. The satellite images provide an overview of the damage, which can be used for humanitarian efforts and disaster relief, reported Space.com.
UNOSAT provides emergency mapping services, upon request, to provide satellite imagery analysis during emergencies and disasters. The maps show infrastructure that has been damaged during an emergency, which can then be used to provide relief by disaster response groups.
The impact of the earthquakes was significant and ranks in the red for economic losses and orange for fatalities, according to the U.S. Geological Survey (USGS). (Image: UNOSAT)
The earthquake caused massive destruction throughout Turkiye and Northern Syria, causing an estimated death toll of more than 19,000 as of Feb. 9. Several historical structures dating back thousands of years have also been severely damaged.
UNOSAT started in 2001 and is hosted by the European Organization for Nuclear Research. It does not operate its own satellites, but coordinates with United Nations member states to gather imagery from government agencies and privately owned satellites. United Nations offices, government agencies and relief organizations can request access to imagery collected by UNOSAT.
The USGS reports the earthquake resulted from strike-slip faulting at shallow depths. It appears to be associated with either the East Anatolia fault zone or the Dead Sea transform fault zone. (Image: UNOSAT)
All maps of Turkey and northern Syria from UNOSAT can be found here. A live interactive map can be found here.
Three earthquakes of magnitude 6 or larger have occurred in Turkiye and northern Syria since 1970. The largest was a magnitude 6.7 earthquake in January 2020. (Credit: USGS)
On Feb. 6, a magnitude 7.8 earthquake struck Turkiye and northern Syria collapsing buildings and killing more than 2,000 people, followed by magnitude 6.7 aftershocks. The impact of the earthquakes was significant and ranks in the red for economic losses and orange for fatalities, according to the United States Geological Survey (USGS).
The USGS reports the earthquake resulted from strike-slip faulting at shallow depths. It appears to be associated with either the East Anatolia fault zone or the Dead Sea transform fault zone.
Historical buildings throughout Turkey have been severely damaged, including the Yeni Mosque and the Gaziantep Castle, which date back thousands of years.
War-torn Syria — specifically Aleppo, Hama and Latakia — have also sustained severe damage to infrastructure that was already fragile.
The effects of this earthquake were felt as far as Lebanon and Israel.
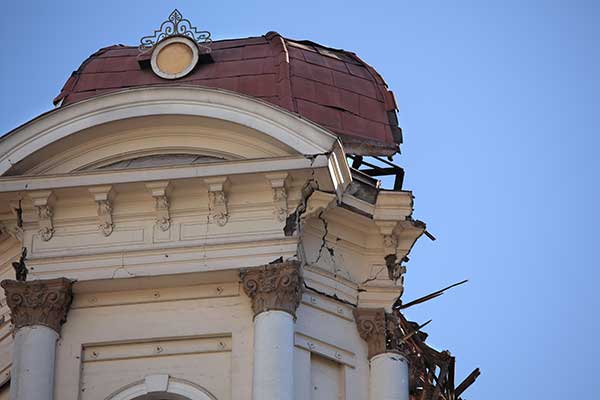
Parts of the historic Gaziantep Castle collapsed, as it lies close to epicenter of the magnitude 7.8 earthquake. (Image: JudyDillon/ iStock / Getty Images Plus/Getty Images)
Historical Gaziantep Castle’s east, south and southeast bastions collapse, leaving debris scattered on the road after major 7.4-magnitude earthquake struck Türkiye’s southeasthttps://t.co/5j2soYI6hCpic.twitter.com/1n6whCr2gY
My April column addressed the vertical movement at the NOAA CORS Network (NCN). The values at the sites indicate the potential movement of marks in the area of the CORS. The rates are based on GNSS data and have an estimate of error associated with them.
As I mentioned in my previous column, I’m not sure how the National Geodetic Survey (NGS) will address the vertical movement effects in the new, modernized National Spatial Reference System (NSRS). That said, NGS will be monitoring the CORS and looking for trends to help describe the vertical movement at the CORS. These trends are an indication of what may be happening in that area.
As stated in previous columns, orthometric heights in NAPGD2022 will be defined through ellipsoid heights and a geoid model, for example GEOID2022. In addition to the movement of individual marks due to crustal movement, there are geophysical reasons for changes in the geoid that affect the orthometric height of a mark. Therefore, changes in the geoid model will be very important to users estimating orthometric heights using GNSS.
As stated in the NOS NGS 64 report, NGS has set a goal of maintaining geoid accuracy at 1 centimeter (1 standard deviation) in both absolute and differential geoid undulations. The box titled “Figure 13 from NOS NGS 64 Report” depicts an estimate of the secular change in the geoid. As indicated in the plot, the changes are very small, ranging from -1.25 mm/year to 1.5 mm/year.
What I find interesting is the small negative change in the southeastern United States. There are other drivers for geoid changes. This column will address some of these changes and what they mean to users.
Secular geoid change
Figure 13 from NOS NGS 64 Report (Image: NGS)
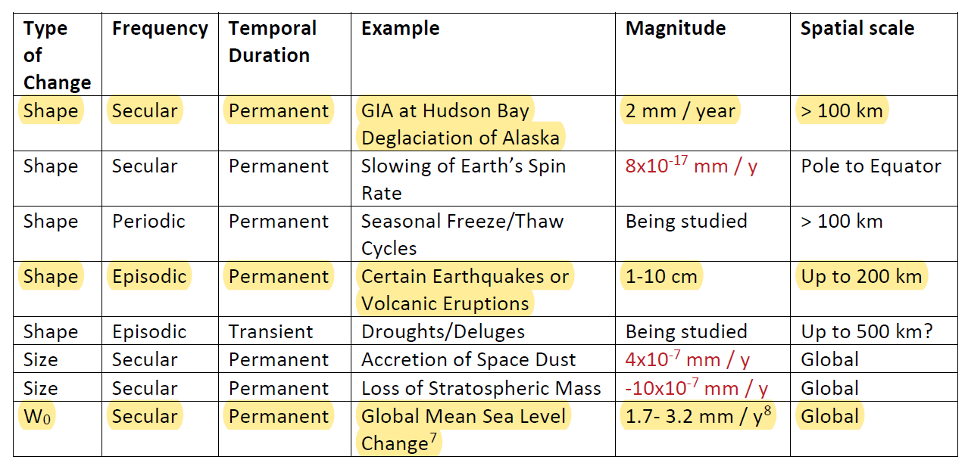
As mentioned in many of my articles, the new, modernized NSRS has a time-dependent component. This includes the geoid model. Table 5-1 from NOS NGS 64 report are examples of some of the physical processes being investigated by NGS to account for changes in the geoid. (See the box titled “Some of the geophysical drivers of geoid change.”)As mentioned in the NOS NGS 64 report, the magnitudes in red have already been determined to be too small for NGS to model. The examples highlighted in yellow have magnitudes that are significant and NGS will attempt to account for these changes to the geoid.
Table 5-1: Some of the geophysical drivers of geoid change
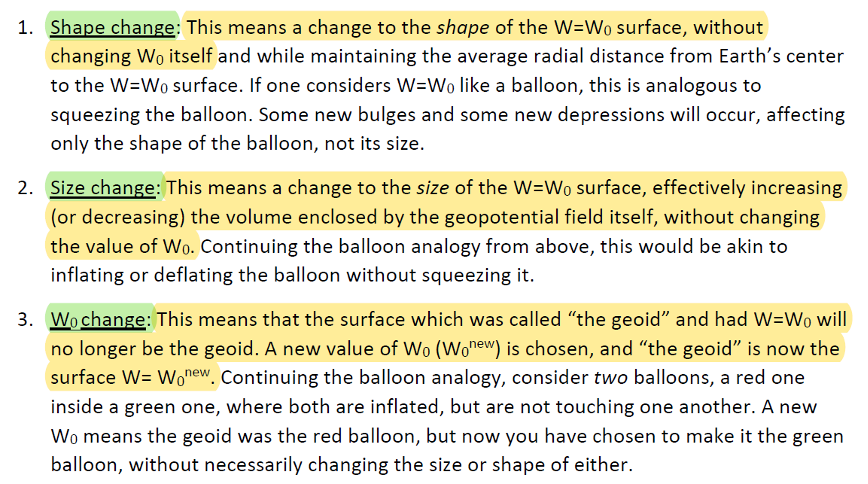
NGS classifies the changes in the geoid in three different groups: Shape Change, Size Change, and W0 Change. The box titled “The Groups of Geoid Change” provides NGS’s definition and explanation of the terms.
The groups of geoid change
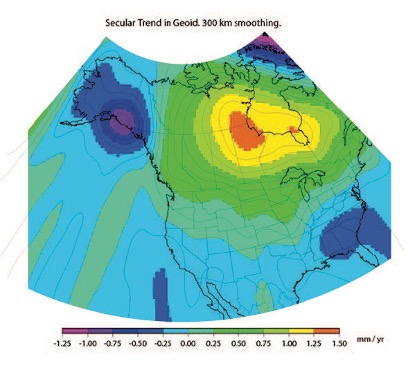
NGS’s report on their Geoid Monitoring Service (GeMS) program provides figures that depict an estimate of the secular geoid rate trend based on the NASA GSFC mascon model. See the boxes titled “Estimate of Geoid Rate Over CONUS” and “Estimate of Geoid Rate Over Alaska.” For more details on GeMS, download the report NOAA Technical Report NOS NGS 69: A Preliminary Investigation of the NGS’s Geoid Monitoring Service (GeMS), and read my December 2019 Survey Scene column. The secular geoid rate trend is an example of the geoid changing its shape, but not the W0 value. What this means is that the local geoid undulations will change, but the overall size of the geoid will not.
Estimate of geoid rate over CONUS
Figure 32: Geoid rate over CONUS based on the GSFC mascon model [mm/yr] (Image: NOAA)Estimate of geoid rate over Alaska
Figure 33: Geoid rate over Alaska from GSFC mascon model [mm/yr] (Image: NOAA)These changes in the geoid are fairly small values (+/- 1.3 mm/year), but they will accumulate over a decade. As previously stated, NGS’s goal is to maintain geoid accuracy at the centimeter level (1 standard deviation) in both absolute and differential geoid undulations. In my February 2022 column, I discussed how coordinates change because Earth’s surface is moving due to the movement of major tectonic plates. It’s fairly obvious how the tectonic shift affects horizontal coordinates, but earthquakes and volcanic eruptions can also cause large shifts in vertical coordinates.
In recent history, on May 18, 1980, geologists watched in awe as Mount St. Helens erupted in a gigantic explosion. After the eruption, the volcanic cone of Mount St. Helens had been completely blasted away; the peak, which was at an elevation of 9,677 feet (2,950meters) was changed to a horseshoe-shaped crater with an elevation of 8,363 feet (2,549 meters). Extreme crustal movements such as the Mount St. Helens eruption can change the shape of the geoid. As explained in my April 2022 newsletter, NGS understands this and is attempting to manage the changing coordinates by providing a time-dependent component to a mark’s ellipsoid height, but there is also a time-dependent component to the geoid that affects the mark’s orthometric height.
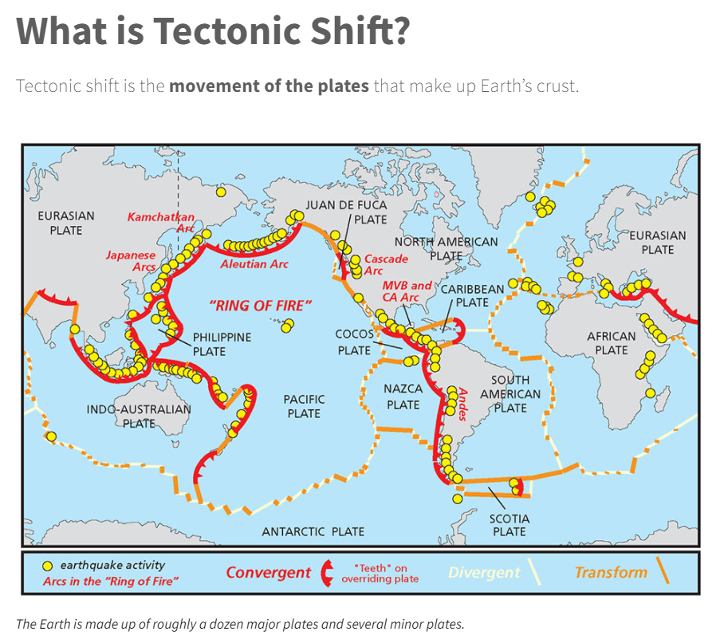
Ring of Fire
Image: National Ocean Service
The “Ring of Fire” map highlights earthquake activities around the world. As indicated in Table 5.1, earthquake or volcanic eruptions can change the shape of the geoid. Of course, they also can change the height of a mark due to crustal movement, which would typically be larger than the change in the geoid height. The amount of movement would be due to the size and magnitude of the event, but even small earthquakes could cause a change in the height of a mark located near the event. Earthquakes are occurring all over the world every day.
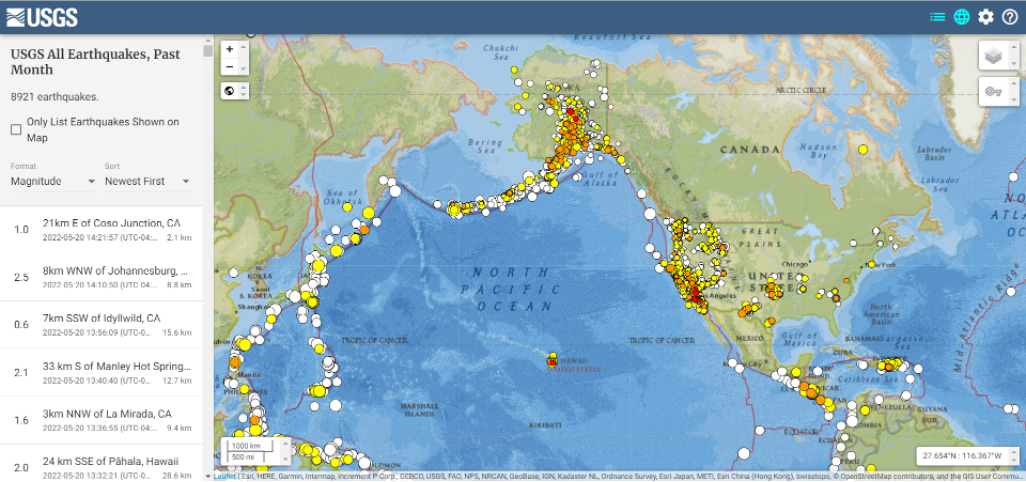
Earthquakes with large magnitudes are highlighted by news media outlets, but ones with smaller magnitude typically are not highlighted. The four figures below provide examples of earthquakes that have occurred over 30 days. This information can be obtained from the United States Geological Survey (USGS).
Earthquakes during the past 30 Days Date: May 20, 2022
Image: USGS
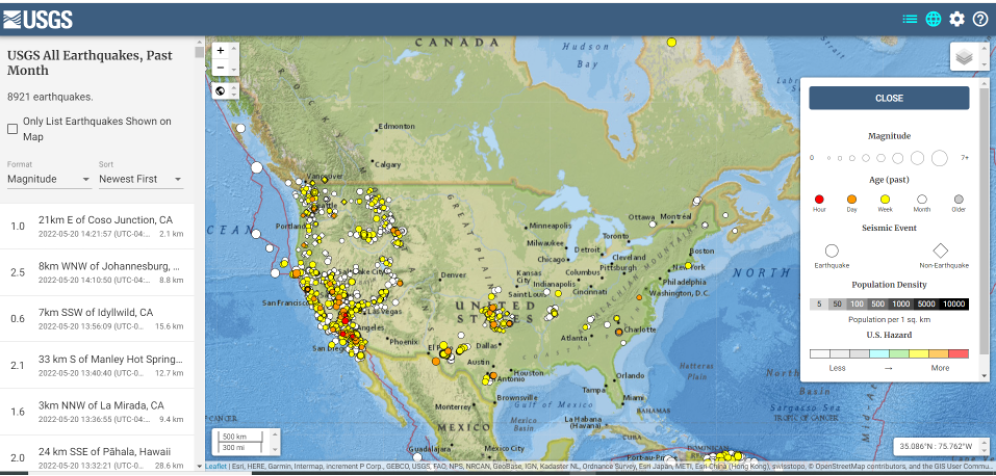
Earthquakes in the lower 48 during the past 30 days Date: May 20, 2022
Image: USGS
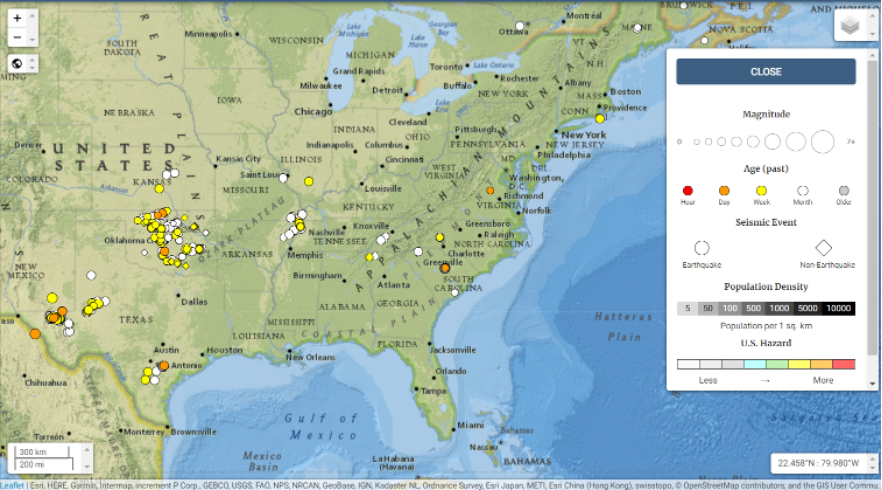
Earthquakes in eastern United States in the past 30 days Date: May 20, 2022
Image: USGS
I found the large number of earthquakes that occurred in Oklahoma in just 30 days to be very interesting. This isn’t something that I thought occurred in the eastern region of the United States.
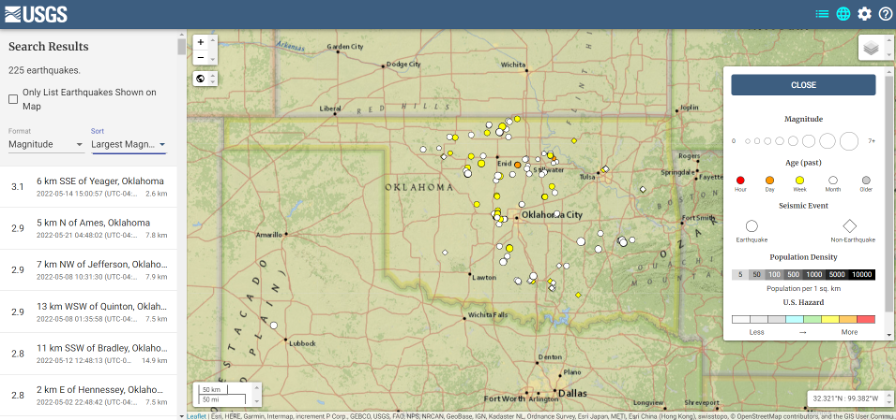
Earthquakes in Oklahoma during the past 30 days
Date: May 20, 2022
Image: USGS
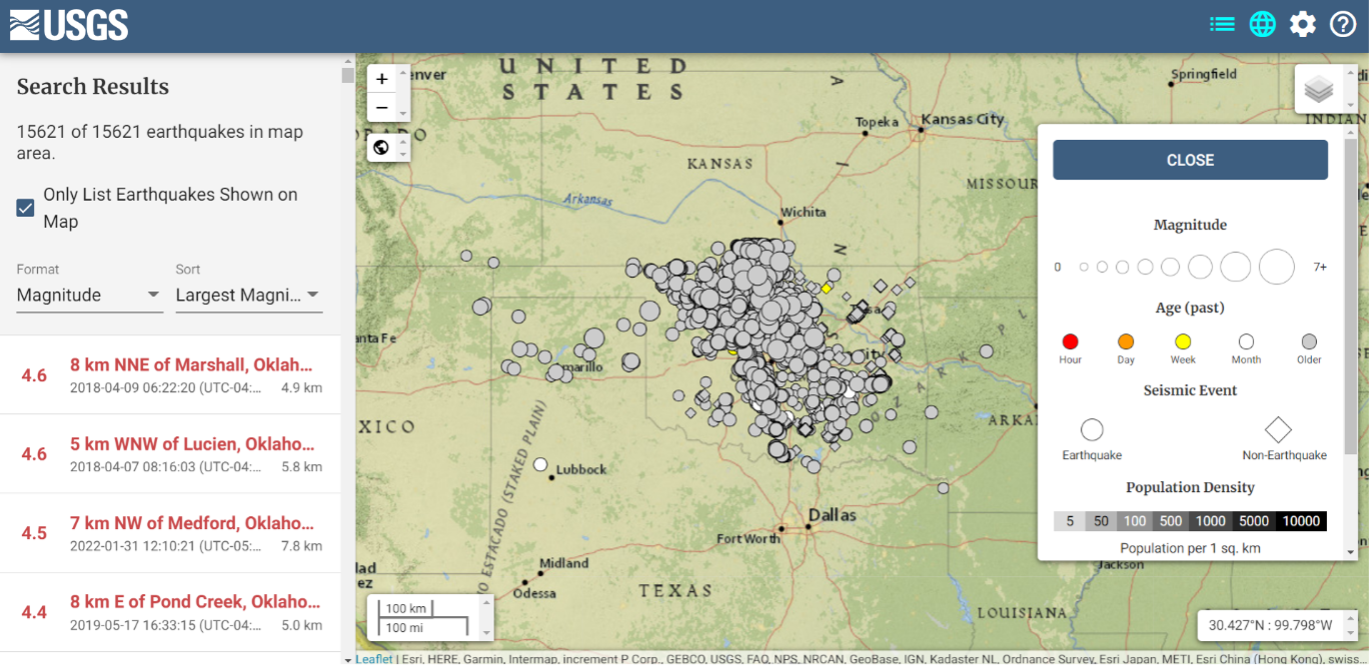
The image below depicts earthquakes that have occurred in Oklahoma in the past five years. They are fairly small in magnitude, but what is the cumulative effect on the geoid in the region, as well as changes to the orthometric heights of marks due to crustal moment in the region? This is why it is important for the new, modernized NSRS toimplement time-dependent coordinates.
Earthquakes in Oklahoma in the last 5 years Dates: 2017 to 2022
Image: USGS
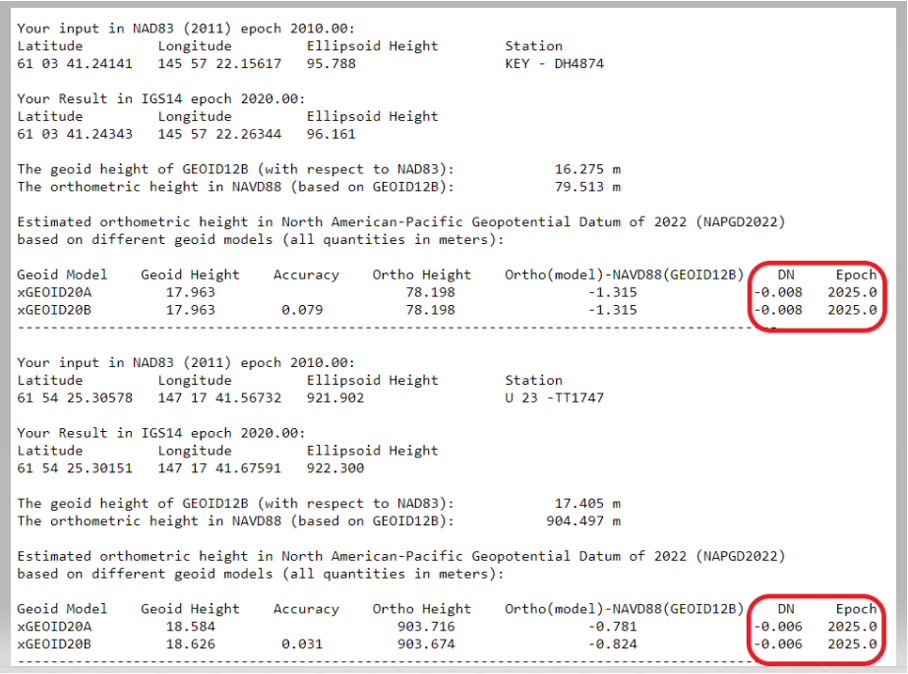
To better understand the changes to the geoid, NGS performed a survey in Alaska to obtain geodetic data as part of its GeMS program. On May 12, 2022, Kevin Ahlgren, a geodesist at NGS, described in a webinar the observations collected and some of the results.
The presentation provided an overview of a field campaign performed in support of the GeMS program and a time-dependent geoid model. The campaign included static GNSS, relative gravity, and deflection of the vertical techniques on 50 stations in Alaska. The webinar was can be downloaded.
I encourage everyone to download the presentation. The change in the geoid due to geophysical drivers is small, but if the new, modernized NSRS is going to include time-dependent coordinates, then changes in the geoid must be accounted for. For demonstration purposes, NGS provides an example of the time-dependent geoid change in the xGEOID20 webtool. The box below, “xGEOID20 interactive computation output,” is an example of using this tool. The two stations are located in Alaska. As indicated in the output from the tool, the change in the geoid is 8 mm in five years. Again, NGS’s goal is to maintain geoid accuracy at the centimeter level (1 standard deviation) in both absolute and differential geoid undulations. These small changes can become significant over time.
xGEOID20 interactive computation output
Note: DN is the time-dependent geoid change computed between user inputted epoch (t) and t. (Image: NGS)
The last geoid change group that I’ll highlight has to do with the change in the gravity potential (W0) value that defines the model. The NOS NGS 64 Report states that the standing definition of the geoid, as adopted and used at NGS, is the following:
The geoid is the equipotential surface of the Earth’s gravity field which best fits, in a least squares sense, global mean sea level.
As stated in the NOS NGS 64 report, over a century of sea-level measurements imply that global mean sea level (GMSL) was rising at a rate of approximately 1.7 millimeters per year and was rising at a rate of 3.2 millimeters per year between 1993 and 2010 (IPCC, 2014). If NGS is going to define the geoid as theequipotential surface of the Earth’s gravity field that best fits, in a least squares sense, global mean sea level, then the geoid in the new, modernized NSRS must change when the GMSL exceeds a certain threshold.
Again, NGS’ goal is to maintain geoid accuracy at the centimeter level (1 standard deviation) in both absolute and differential geoid undulations. What this means is that as GMSL rises, the value of gravity potential which best fits to GMSL (called W0) will also change. In other words, the surface which was called “the geoid” and had W=W0in 2022 will no longer be the geoid. A new value of W0 (W0new) is chosen, and “the geoid” would now be the surface W=W0new.
So, what does this really mean to users? The NOS NGS 64 Report states on page 37:
“NGS and the Canadian Geodetic Survey have jointly adopted the value of 2.0 m^2/s^2 as the replacement threshold for a new geoid model (and new geopotential datum). This represents approximately 20 centimeters of GMSL (and thus geoid) rise. At the current rate of sea-level change of about +3 millimeters per year (IPCC, 2014), this means NGS expects to replace NAPGD2022 in approximately 60 to 70 years.”
Therefore, this should not be a major concern of users for a long time.
This column highlighted that orthometric heights in NAPGD2022 will be defined through ellipsoid heights and a geoid model, for instance GEOID2022; and therefore, changes in the geoid model will be very important to users estimating orthometric heights using GNSS. It briefly described the geophysical reasons for changes in the geoid that affect the orthometric height of a mark.
If NGS is going to meet the goal of maintaining geoid accuracy at 1 centimeter (1 standard deviation) in both absolute and differential geoid undulations, they will have to address changes in the geoid. The secular changes in the geoid, as indicated in Figure 13 in the NOS NGS 64 report, are very small, ranging from -1.25 mm/year to 1.5 mm/year. Once again, these are small changes to the geoid, but they will accumulate over time, and that is why NGS is including time-dependent coordinates in the new, modernized NSRS.
“Seen & Heard” is a monthly feature of GPS World magazine, traveling the world to capture interesting and unusual news stories involving the GNSS/PNT industry.
Photo: Anton Rodionov/iStock/Getty Images Plus
UNWANTED HITCHHIKERS
Antarctica’s pristine marine ecosystem, isolated for 15–30 million years, could be threatened by species such as mussels, barnacles, crabs and algae arriving on ships from 1,500 ports worldwide. A research team from the British Antarctic Survey and the University of Cambridge used automatic identification system (AIS) data, which relies on GNSS navigation data, and shipping databases to determine traffic to the Antarctic. The study is published in the Proceedings of the National Academy of Sciences, January 2022.
Photo: FrankRamspott/iStock/Getty Images Plus
QUAKE PREDICTION
Within the next 30 years, a highly destructive Nankai Trough megathrust earthquake is predicted to hit southwest Japan. Understanding long-term slow slip events under the Bungo Channel is essential for pinpointing when such an earthquake will happen. Kobe University’s Yoshioka Shoichi and Seshimo Yukinari analyzed the 2018–2019 Bungo Channel slow-slip event using longitudinal GNSS data provided by the Geospatial Information Authority of Japan. The data revealed that even though the 2018–2019 event was shorter than others, it was bigger in terms of slippage and slip velocity, as well as magnitude. Results appear in Scientific Reports, Jan. 10, 2022.
Photo: Bluesky
SUPPORTING SOLAR
British aerial mapping company Bluesky is helping Derby Homes roll out integrated solar photovoltaic systems across its housing stock. A project to identify suitable roof coverings assessed more than 8,000 addresses for size, pitch, aspect, existing structures and infringing vegetation. Using its ultra-high-resolution imagery, Bluesky determined the solar suitability of each property, the number of panels needed, and their potential output. Derby Homes recently installed its first integrated solar array on an initial batch of trial properties identified by Bluesky.
Photo: JohnCarnemolla/iStock/Getty Images Plus
TAKING MOM TIME
CQUniversity’s precision livestock management research team is using GNSS to detect calving events in extensive grazing herds. The discovery could provide beef producers in Australia with a way to remotely monitor their cattle and improve calf survival rates, one of their biggest challenges. The research project used GNSS collars with motion-detecting accelerometers on 30 cows in a 28-hectare paddock over an eight-week period at Belmont Research Station. The collars captured the animals’ location information every 10 minutes. Because the distance between mother and herd increases during calving, the data helped predict calving events, which were then visually confirmed by the research team.
The surveying profession has experienced a plethora of advancing technology over the past two decades and it does not look like there will be a slowdown any time soon. From robotic total stations to laser scanning to the use of multiple GNSS constellations, the profession is constantly adapting these emerging technologies into a useful tool for daily applications. For most practicing surveyors, it is a challenge to keep up with not just the hardware of these advancements, but also with software, which is being developed in parallel. Have you tried to open and draw a simple figure in any of the industry standard CAD programs lately?
The complexity of these programs, while advancing the capability of many technical professions, forces even the casual user to maintain a regular habit of software education and training. While it may seem primitive to say that a practitioner is a “practicing” surveyor, on-the-job training never stops. Just when the profession thinks there are no more significant advancements, something comes out of left field that truly blindsides us. (See the adoption of UAVS by the surveying profession compared to the public sector…) What do I think will be one of the next “big things” to revolutionize surveying? The technology is already here, and we need to seriously get on board with adoption before we miss another opportunity to highlight the expertise of the profession.
VIRTUAL REALITY and AUGMENTED REALITY (VR & AR)
First, we need to know that virtual reality (VR) and augmented reality (AR) are different, even though many people use these terms interchangeably. The differences are as follows:
Virtual Reality (VR)
VR is a virtual world generated by computers and programming.
VR is a closed environment that is fully immersive.
VR requires a device (specialized glasses and/or a headset).
Users in the VR experience are limited by the programming and their computer’s abilities.
The VR experience may be based upon real-world conditions but is a fictional setting.
Users of VR can travel and experience conditions in real and fictitious places.
VR can allow users to have experiences that are not physically possible in the real world.
VR is 75% virtual + 25% real (industry “rule of thumb”)
Augmented Reality (AR)
AR is typically based on actual physical places.
AR is an open environment that is partly immersive.
In AR, the user controls the environment.
AR combines virtual elements and experiences with real world conditions.
Experiences in AR can be accessed by computer, tablet, and smartphones.
AR is useful for product visualization and evaluation.
AR is 75% real + 25% virtual (industry “rule of thumb”)
It is important to know these difference between the two technologies in order to implement the correct one for the task at hand. However, both will play an important in surveying for generations to come.
One of the surveyor’s biggest responsibilities is to complete an accurate site conditions model by topographic methods. Once the topographic survey is completed, site designers will utilize this information to create a unique project that works with the existing site conditions. Advances in CAD software and technology allow engineers and architects to design in 3D and blend the new site with the existing conditions, drainage, and utilities. These designs can be further refined into virtual reality models to give the project’s stakeholders a better indication of what the final product will be when construction is completed.
The key takeaway here is that the surveyor is responsible for delivering the existing conditions model. A model that accurately represents the subject site but in digital form enables the design of the project to be more efficient and realistic to meet the client’s expectation. Surveyers, however, will not use virtual reality as much as augmented reality, for many good reasons.
USES OF AUGMENTED REALITY TECHNOLOGY FOR SURVEYING
AR is still in its infancy. Because surveyors have an interest in the existing and proposed conditions of sites, the use of AR becomes an important tool for the future. Merging proposed information with existing site conditions can become the norm, but like many emerging technologies, the profession will need to learn how to embrace it.
To get a better idea of how the technology works and why surveyors need to consider using it, let us look at an application that showcases AR: Pokémon Go. Yes, the smartphone game app that took the world by storm in 2016 and captivated many “trainers” to search the streets for Ultra Balls and characters. (There are still more than 100 million active players worldwide.) Players of all ages have continued to search for elusive items and characters in a high-tech scavenger hunt that is constantly changing, and all based upon the real world around us. By merging a real-time view with game entities at random geographic locations, players move about our world using one of the best examples of AR.
How does this apply to the surveying profession? Surveyors could utilize AR in everyday tasks but that would require having a fully developed 3D design model that could merge with the existing conditions in their visual device. There are a variety of devices for utilizing AR, including smartphones and tablets. Many of the new data collectors running Windows and Android operating systems can also be used for incorporating AR into the field operation. Here are some examples of AR how can be utilized for surveying tasks:
While construction staking, AR can be used to assist with structure and improvement location. A quick visual check can help confirm staking calculations are consistent with engineering design.
Use AR to visually check installed improvements, including curbs, utility structures, and paving. Any deviation from the proposed design should be quite evident.
When establishing property corners, AR will help the field crew quickly determine whether the calculated location is accessible. This can be used for staking out pre-calculated boundary points and/or proposed lot corners in a new subdivision.
Here are a few ideas as to how surveyors could utilize AR in everyday tasks in the future:
As public utilities are becoming more available within GIS shape files with geographic locations, they could be utilized with AR to help visually establish locations in the field. Mainline utilities and service lines would become easier to physically verify using AR.
Another GIS shapefile entity, the parcel line layer, could be used to help the surveyor understand where the property owner believes the line(s) to be as opposed to the actual monumented location.
All reference monuments and benchmarks established by public agencies using geographic location information could enhance the “treasure hunt” of confirming local datum points.
SURVEYING USING AR TO PROTECT THE PUBLIC
Geospatial information has revolutionized our world, so using AR to help when trouble strikes can potentially be a lifesaver. Recently, an oceanfront condominium in Florida collapsed due to structural failure. While the age of the structure precluded it from having any digital geographic location data, any new similar development could be measured and recorded to assist with future emergency needs. Almost all new development has digital surveying, engineering, and architecture and must use local horizontal and vertical datums. Using the proposed information and verifying with post-construction record drawings, the digital record can be created.
It doesn’t take a design flaw to create a public hazard. For instance, a gas leak could render any building, such as the Florida condo, susceptible to catastrophic damage. By having a digital model of the underground structure, emergency crews could use AR to help locate potential open spaces in the building. As is the case with installing fire suppression systems and emergency exits, the cost to create a digital model of a completed building will be well worth it to save lives.
Underground utility corridors within cities, campuses, or manufacturing facilities could also utilize geospatial locations to establish a digital map for future use with AR. It will take time and significant cost to map existing facilities, yet it should be required for new sites to provide this information for emergencies and for use when designing expansions within the site. Having this utility information to use with AR during the design phase could lead to identifying potential problems before construction starts.
Haiti after an earthquake. (Photo: 1001nights/E+/Getty Images)
Another reason to plan for future safety is how much uncertainty we face in today’s society. At press time, we are coming up on the 20th anniversary of 9/11. We also just watched Haiti suffer another devastating earthquake. The 2021 hurricane season has also been very active, so that danger looms large, too. Disasters happen all the time with little to no warning. Our world is much more advanced than we were at the turn of the century, so we can use these advancements to map our infrastructure. Let us hope we never need to use the digital information for another disaster akin of 9/11. Instead, let us use it to ensure that we can get to someone in a remote spot if necessary.
THE ROAD TO FUTURE MAPPING AND AUTOMATION
As previously discussed, establishing a digital twin of our world could help provide a better map for establishing parcel ownership, reducing construction conflicts, and offering better planning tools for future expansion. Will it be completed within my lifetime? No, and I doubt it will be done within the next couple of generations after me.
We can, however, get a significant start on capturing the necessary information to begin the process of digitization. Technology has exceeded my expectations just within the past decade, so I can only hope that more advancements will help with building this digital beast. More architects and engineers are utilizing BIM (building information modeling) for 3D design and collaboration. Most municipalities and counties have built some form of GIS that uses one of the standard geographic datums. Surveyors have fully embraced GNSS technology so state plane and national geographic coordinate systems have become the norm. In addition, we are seeing a wide number of consultants use autonomous vehicles (aerial, hydro, and terrestrial) with photogrammetry, LiDAR, and SLAM remote sensing. Another bit of good news is that computing power is higher than ever and that storage space is cheap for all this data. We should also include how 5G has expanded our reach and, with cloud storage, we can work from just about anywhere. We can do so much more than most of us ever dreamed of, so we need to leverage that into creating a digital entity that can be helpful.
Photo: RyanJLane/E+/Getty Images
HOW TO IMPLEMENT THE LATEST TECHNOLOGY
Augmented reality is one of many new technologies surveyors need to introduce into their toolbox. Many of you may be asking where to begin; my answer, depending on your age, may offend you.
Hire a Gen Zer. Really.
As a Gen Xer, I have come to realize my limitations on technology and being able to fully implement it. The Z generation, while lacking the experience of us wily old guys, see things much differently. The smartphone/tablet/computer, and even the latest data collectors, are designed with them in mind. They grew up playing computer games based in virtual reality, developed excellent hand-eye coordination, and find efficient ways of getting things done. Our surveying world is almost completely digital (when is the last time a client only wanted paper copies of a plat?), so now is the time to make the leap and ditch the drafting table. We have as much to learn from them as they do from us. Together, we can get the surveying profession ready for the next generations. It has been a great profession for us, so let us hand it off to the Z generation. They will (eventually) be glad we did.
After 15 years of planning and development, the ShakeAlert earthquake early warning system is now available to more than 50 million people in California, Oregon and Washington, the most earthquake-prone region in the conterminous U.S.
ShakeAlert provides alerts to the general public through public alert systems such as TV, radio and mobile phones. It also slows down trains, opens firehouse doors, closing water and gas valves and
May’s addition of Washington State to the system completes the U.S. Geological Survey and partners’ West Coast rollout of ShakeAlert.
ShakeAlert first launched in California in 2019 and expanded to Oregon in March of this year. People in all three states can now receive alerts from FEMA’s Wireless Emergency Alert system, third-party phone apps, and other technologies.
The ShakeAlert system relies on sensor data from the USGS Advanced National Seismic System. ANSS is a USGS-facilitated collection of regional earthquake monitoring networks operated by partner universities and state geological surveys on the West Coast and throughout the nation.
Part of that data comes from GPS, which the USGS uses to measure crustal deformations over time. The USGS measures the precise position (within 5 mm or less) of GNSS stations near active faults relative to each other.
USGS works closely with ANSS partners and state emergency management agencies on the system’s development as well as public communication, education and outreach. “USGS science is the backbone of hazard assessment, notification, and response capabilities for communities nationwide so they can plan for, and bounce back from, natural disasters,” said David Applegate, associate director for Natural Hazards Exercising the Delegated Authority of the USGS Director.
“Systems powered by ShakeAlert can turn mere seconds into opportunities for people to take life-saving protective actions or for applications to trigger automated actions that protect critical infrastructure,” Applegate said. “An effort like this takes the dedication, ingenuity and hard work of dozens of partners with the same vision, and the USGS is proud to have been part of a collaborative team that made this robust public safety system available for millions of citizens on the West Coast.”
The ShakeAlert earthquake early warning system can save lives and reduce injuries by giving people time to take protective actions like drop, cover and hold on before potentially dangerous earthquake shaking arrives at their location.
In addition to supporting public alerts to mobile phones, ShakeAlert system data has, since late 2018, been used to develop applications that trigger automated actions. Automatic actions can be used to slow down trains to prevent derailments, open firehouse doors so they don’t jam shut and close valves to protect water and gas systems.
The technology will continue to improve over time with the addition of more seismometers to the network, by expanding alert delivery area and by improving messaging speeds.
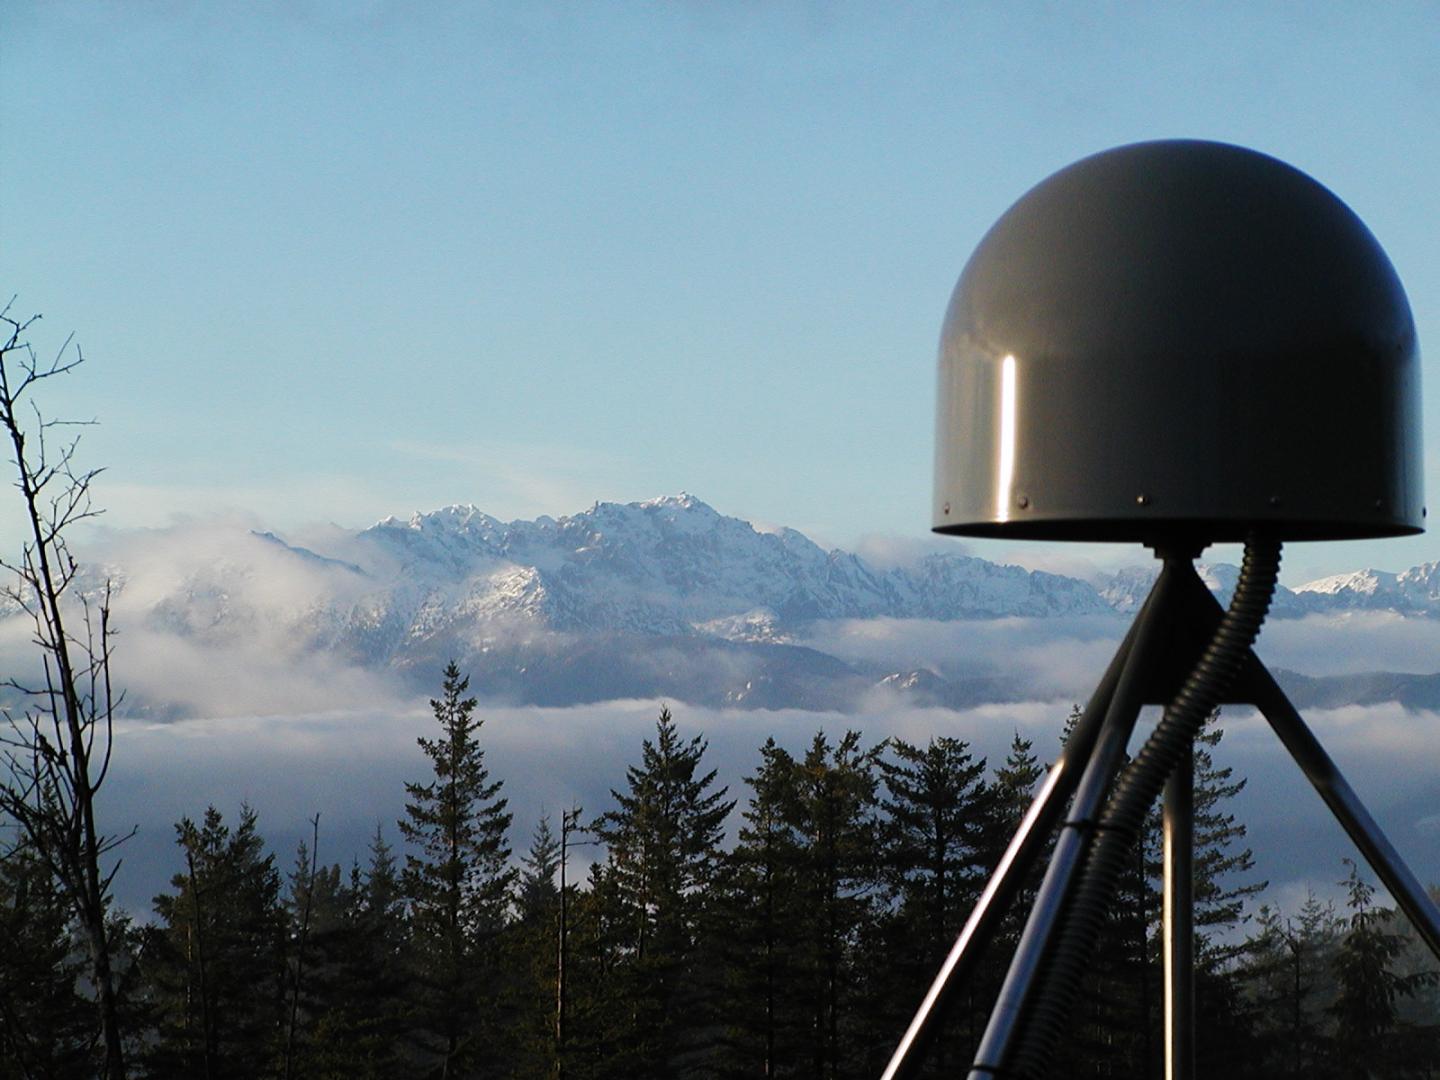
A GNSS station in the Pacific Northwest geodetic array. (Photo: Central Washington University)
“Seen & Heard” is a monthly feature of GPS World magazine, traveling the world to capture interesting and unusual news stories involving the GNSS/PNT industry.
Photo: Mt. Qomolangma/miljko /E+/Getty Images
Chinese surveyors take BeiDou to the top
On May 6, more than 30 Chinese surveyors left base camp to summit Mount Qomolangma — known in the west as Mount Everest. The team is using both traditional and modern surveying and mapping technologies, and China’s BeiDou Navigation Satellite System (BDS) will be applied to the elevation survey for the first time. The previous survey in 2005 used GPS to measure the height (found to be 8,844.43 meters); this year’s survey uses all four GNSS, with BDS data as the main reference.
Image: BlackJack3D/E+/Getty Images
Quantum entanglement
In a paper published April 20 in Physical Review Letters, University of Arizona engineering and optical sciences researchers, in collaboration with engineers from General Dynamics Mission Systems, demonstrate how a combination of two techniques — radio frequency photonics sensing and quantum metrology — can give sensor networks a previously unheard-of level of precision. The work involves transferring information from electrons to photons, then using quantum entanglement to increase the photons’ sensing capabilities. The quantum-sensing paradigm could create opportunities to improve GPS receivers, astronomy laboratories and biomedical imaging capabilities, as well as improve the performance of any application that requires a network of sensors.
Researchers evaluating movement of GNSS ground stations have discovered large-scale, back-and-forth ground movement preceding the 2010 seaquake off of Chile and the 2011 Tohoku-oki seaquake off of Japan. Researchers from the Geoforschungszentrum Potsdam (GFZ) with collaborators from Chile and the United States say both quakes showed multiple strange reversals of ground motion — an extremely slow “wobbling” of the continental plate — over a period of five months (for Japan) and seven months (for Chile). The discovery was made possible by the amount of data collected by the GNSS stations in both countries.
Dogbot on patrol
A robot dog from U.S.-based Boston Dynamics reminded visitors to Bishan-Ang Mo Kio Park in Singapore to maintain social distancing due to the coronavirus pandemic, reported the BBC in May. The dogbot is fitted with lidar to monitor how busy the park becomes. It also carried a loudspeaker to broadcast social-distancing messages.


![Figure 32: Geoid rate over CONUS based on the GSFC mascon model [mm/yr] (Image: NOAA)](https://stage.globalpositioningnews.com/wp-content/uploads/2022/05/Geoid-rate-CONUS.jpg)
![Figure 33: Geoid rate over Alaska from GSFC mascon model [mm/yr] (Image: NOAA)](https://stage.globalpositioningnews.com/wp-content/uploads/2022/05/geoid-rate-alaska.jpg)