Following Nepal’s devastating magnitude 7.8 earthquake on Saturday, Airbus Defence and Space has acquired Pléiades satellites imagery to support the International Charter and Copernicus Emergency Management Service. The data acquired will assist in assessing the damage and help rescue organizations in the delivery of humanitarian aid.
The before and after Pléiades images over Kathmandu (full image can be downloaded here) show the devastation caused by the earthquake. The below “before” Pléiades image was acquired on Nov. 29, 2014, and the “after” Pléiades image was acquired on April 27, 2015, two days after the earthquake.
Kathmandu, viewed by Pléiades satellites, before and after the earthquake. (Image: Airbus Defence and Space)
The Airbus Pléiades 1A and Pléiades 1B satellites operate as a constellation in the same orbit, phased 180 degrees apart. The identical twin satellites deliver high-resolution optical data products and can revisit any point on the globe, according to Airbus.
UPDATE:
Esri has created a Nepal Earthquake Swipe Map, which allows users to compare the pre- and post-earthquake images from Airbus Defence & Space to explore damage around Nepal. This map includes several bookmarks to help users navigate around key points of interest and landmarks that were damaged or destroyed.
In response to the devastating 7.8-magnitude earthquake that struck central Nepal on April 25, DigitalGlobe has made high-resolution satellite imagery of the affected areas freely available online to all groups involved in the response and recovery effort through the company’s FirstLook initiative.
The below before and after images show the destruction of the nine-storey Dharahara Tower, which was built in 1832 and was a UNESCO World Heritage site.
The Dharahara Tower in Kathmandu, in a DigitalGlobe satellite image taken in October 2014. (Image credit: DigitalGlobe)The Dharahara Tower is shown leveled following the earthquake (Image credit: DigitalGlobe).
Specifically, DigitalGlobe activated FirstLook, the subscription service that provides emergency management and humanitarian workers with fast, web-based access to pre- and post-event images of the impacted area. DigitalGlobe captured imagery of the area April 26 through heavy cloud cover with its WorldView-1, and WorldView-3 and GeoEye-1 satellites. WorldView-2 and WorldView-3 have been tasked to image the area again April 28. Pre-event imagery dating back to April 1 is also available to aid understanding and coordination for on-the-ground missions.
In addition, DigitalGlobe has activated Tomnod, the crowdsourcing platform that allows web-connected volunteers around the globe to help disaster response teams by mapping damage from this earthquake. While satellite imagery on its own is useful, greater benefit comes from extracting meaningful information that can be used by first responder and recovery agencies.
By visiting the Tomnod website, users can participate in the Nepal campaign by tagging damaged buildings, roads, and areas of major destruction to inform disaster response teams on the ground. Whether a person donates five minutes or five hours, anyone can analyze DigitalGlobe imagery to help make a difference.
A massive 7.8 magnitude earthquake struck 77 kilometers (48 miles) northwest of Nepal’s capital Kathmandu at 0611 GMT on April 25, toppling office blocks and towers and killing thousands of people. More than two dozen people were also reported killed in neighboring India, China and Bangladesh.
As of April 27, the Government of Nepal reported 3,351 deaths and 6,833 injured people, according to ReliefWeb. These numbers are expected to increase further as search and rescue teams reach remote areas. Most of the deaths are recorded in Bhaktapur, Kathmandu and Lalitpur. Eight million people in 39 districts have been affected, of which over 2 million people live in the 11 severely affected districts.
The Esri disaster page is featuring news stories, video feeds, and other information about the earthquake in Nepal, on an Earthquake Public Information Map. Users can explore the locations and intensities of the various quakes that struck Nepal, along with a shakemap from the USGS. This map also includes geotagged social media from Twitter and YouTube with local content related to the quakes.
Another Esri map, Mapping the 2015 Nepal Earthquake, provides a closer look at Nepal’s history of seismic activity, and shows how people are impacted by earthquakes. This story map also includes information about relief operations and key points of interest in the region, as well as a 3D web scene of the area affected by the avalanche on Mt. Everest.
OpenStreetMap is also working to help with relief efforts. “Our goal is to contribute to humanitarian relief by rapidly providing a detailed and accurate map (i.e., road network, villages, buildings, etc.) to support the humanitarian organizations. These services help locate people at risk efficiently, and facilitate the delivery of goods and services to remote areas.”
Fugro has released an upgrade to its EZ-FRISK package — seismic hazard analysis software used by consultants and academics. The new upgrade includes the Next Generation West 2 ground motion prediction models, and improved user interface along with software fixes.
By early 2015, the software will incorporate the U.S. Geological Survey (USGS) 2014 National Seismic Hazard Maps for the continental U.S., with the exception of California, and will include the Uniform California Earthquake Rupture Forecast (UCERF) version 2. Fugro provides UCERF version 3 ground motion reports for California as an independent consulting service.
The EZ-FRISK single site probabilistic and deterministic tool enables engineers and geoscientists to study seismic hazards in an easy and flexible manner. As with earlier releases, EZ-FRISK has modules for probabilistic and deterministic seismic hazard analysis (PSHA/DSHA) (with globally available regional seismic source models and a database of ground motion prediction models); spectral matching (adjusting an accelerogram to match a target response spectrum, while preserving realistic time-dependent characteristics of the ground motion); and site response (calculating the ground motion at the surface given a bedrock ground motion and the layers of soil and rock that overlay the bedrock at the site).
EZ-FRISK can quickly create design ground motions for engineering purposes that use earthquake modeling and statistical analysis to accurately reflect the desired level of safety, provide realistic time-dependent behavior, and consider site-specific soil and rock layering.
The model was developed using a regional grand inversion process. The outputs are in the form of participation rates, rather than individual faults with defined slip rate or segmentation models. Instead faults are assigned magnitude frequency distributions that include participation of adjoining faults based on over 200,000 rupture scenarios.
“Fugro continues to extend its legacy of developing state-of-the-art software for the industry. We listen to our clients, and our engineers and geoscientists work closely with them to ensure that we provide the necessary tools for performing seismic hazard analyses worldwide,” said Recep Yilmaz, president of Fugro Consultants.
CoreLogic, a global property information, analytics and data-enabled services provider, has released an analysis ranking Florida as the U.S. state with the highest level of comprehensive risk exposure to multiple natural hazards, with Michigan identified as the state with the lowest risk.
The analysis was derived from the new CoreLogic Hazard Risk Score (HRS), an analytics tool launched today that gathers data on multiple natural hazard risks and combines them into a single easy-to-use score ranging from 0 to 100. The overall score indicates risk exposure at the individual property and location level.
For every geocoded location across the U.S, the CoreLogic HRS is compiled using data representing nine natural hazards: flood, wildfire, tornado, storm surge, earthquake, straight-line wind, hurricane wind, hail and sinkhole. Locations with higher risk levels are exposed to multiple hazard risks and will, therefore, receive higher scores when the risk analysis is aggregated. Subsequently, locations with minimal risk levels have lower exposure and receive lower scores. Geocoded locations are generated at the property-address level using latitude and longitude coordinates and include both residential and commercial properties.
“Florida’s high level of risk is driven by the potential for hurricane winds and storm surge damage along its extensive Atlantic and Gulf coastline, as well as the added potential for sinkholes, flooding and wildfires. Michigan alternatively ranks low for most natural hazard risks, other than flooding,” said Dr. Howard Botts, vice president and chief scientist for CoreLogic Spatial Solutions.
The proprietary CoreLogic HRS is able to calculate risk based on a 10 x 10 meter grid, the lowest level of granularity available for the underlying hazard data. In calculating the overall score, both the probability of an event and the frequency of past events are significant contributing factors used to determine risk levels associated with individual hazards, as well as each distinct hazard’s risk contribution to total loss. The data is combined into an aggregated, consistent and normalized value that allows statistically valid combinations to be derived.
“In the past, natural hazards have been difficult to compare and combine in a meaningful way,” said Dr. Botts. “Hazard Risk Score is a single solution that measures risk concentration consistently and pinpoints the riskiest places in the U.S. with timely and granular accuracy. This insight is critical in conducting comparative risk management nationwide and fully understanding exposure to potential natural hazard damage.”
Insurers, risk managers and mortgage servicers can use CoreLogic Hazard Risk Score to improve decision-making and enhance a variety of business operations, including:
Business continuity and disaster recovery planning
Analyzing risk associated with a residential property or portfolios of properties
Measuring mitigation savings vs. total hazard potential damage
Evaluating and determining natural hazard risk levels of distribution and supplier networks
Recognizing which underinsured or uninsured properties may become at risk of default
Adverse selection avoidance and identification of “good risk” properties
U.S. Natural Hazard Risk by State* (Ranked by CoreLogic Hazard Risk Score)
Rank State HRS
1FL94.51
2RI79.67
3LA79.23
4CA75.56
5MA72.12
6KS69.51
7CT69.04
8OK66.82
9SC66.38
10DE65.38
11OR64.89
12NJ61.54
13IA61.02
14TX60.89
15NC59.72
16MO57.81
17DC57.33
18MS57.05
19AR56.7
20NH55.3
21ID52.75
22MD52.28
23CO51.88
24NE51.86
25IL51.8
26IN50.74
27GA50.58
28NV50.12
29AL49.42
30KY47.34
31TN46.48
32UT45.22
33NM43.76
34AZ42.81
35VA42.35
36WA42.3
37WI38.52
38SD38.24
39MT37.91
40MN36.42
41OH34.61
42ME31.64
43WY30.24
44PA28.79
45VT28.31
46ND27.5
47NY24.97
48WV20.67
49MI20.22
Source: CoreLogic 2014.
* AK and HI were excluded in the ranking due to limited natural hazard risk data.
2014 USGS National Seismic Hazard Map, displaying intensity of potential ground shaking from an earthquake in 50 years (which is the typical lifetime of a building).
To help make the best decisions to protect communities from earthquakes, new USGS maps display how intense ground shaking could be across the nation.
The USGS recently updated its U.S. National Seismic Hazard Maps, which reflect the best and most current understanding of where future earthquakes will occur, how often they will occur, and how hard the ground will likely shake as a result.
42 States at Risk; 16 States at High Risk
While all states have some potential for earthquakes, 42 of the 50 states have a reasonable chance of experiencing damaging ground shaking from an earthquake in 50 years (the typical lifetime of a building). Scientists also conclude that 16 states have a relatively high likelihood of experiencing damaging ground shaking. These states have historically experienced earthquakes with a magnitude 6 or greater.
The hazard is especially high along the west coast, intermountain west, and in several active regions of the central and eastern U.S., such as near New Madrid, Missouri, and near Charleston, South Carolina. The 16 states at highest risk are Alaska, Arkansas, California, Hawaii, Idaho, Illinois, Kentucky, Missouri, Montana, Nevada, Oregon, South Carolina, Tennessee, Utah, Washington, and Wyoming.
While these overarching conclusions of the national-level hazard are similar to those of the previous maps released in 2008, details and estimates differ for many cities and states. Several areas have been identified as being capable of having the potential for larger and more powerful earthquakes than previously thought due to more data and updated earthquake models. The most prominent changes are discussed below.
Students conduct the “drop, cover, hold on” safety procedure during an earthquake preparedness drill. Photo Credit: Jessica Robertson, USGS
Informed Decisions Based on the Maps
With an understanding of potential ground shaking levels, various risk analyses can be calculated by considering factors like population levels, building exposure, and building construction practices. This is used for establishing building codes, and in the analysis of seismic risk for key structures. This can also help in determining insurance rates, emergency preparedness plans, and private property decisions such as re-evaluating one’s home and making it more resilient.
These maps are part of USGS contributions to the National Earthquake Hazards Reduction Program (NEHRP), which is a congressionally-established partnership of four federal agencies with the purpose of reducing risks to life and property in the U.S. that result from earthquakes. The contributing agencies are the USGS, Federal Emergency Management Agency (FEMA), National Institute of Standards and Technology, and National Science Foundation (NSF). As an example of the collaboration, the hazards identified in the USGS maps underlie FEMA-sponsored seismic design provisions that are incorporated into building codes adopted by states and localities. The maps also reflect investments in research by academic and other scientists supported by grants from the USGS and the NSF.
“The standards for seismic safety in building codes are directly based upon USGS assessments of potential ground shaking from earthquakes, and have been for years,” said Jim Harris, a member and former chair of the Provisions Update Committee of the Building Seismic Safety Council.
“The committees preparing those standards welcome this updated USGS information as a basis for making decisions and continuing to ensure the most stable and secure construction.”
Key Updates
East Coast
The eastern U.S. has the potential for larger and more damaging earthquakes than considered in previous maps and assessments. As one example, scientists learned a lot following the magnitude 5.8 earthquake that struck Virginia in 2011. It was among the largest earthquakes to occur along the east coast in the last century, and helped determine that even larger events are possible. Estimates of earthquake hazards near Charleston, SC, have also gone up due to the assessment of earthquakes in the state.
Damage to the Washington National Cathedral in DC from the earthquake in Virginia on August 23, 2011. Photo Credit: William Leith, USGS
In New York City, the maps indicate a slightly lower hazard for tall buildings than previously thought (but still a hazard nonetheless). Scientists estimated a lower likelihood for slow shaking from an earthquake near the city. Slow shaking is likely to cause more damage to tall structures in contrast, compared to fast shaking which is more likely to impact shorter structures.
Central U.S.
The New Madrid Seismic Zone has been identified to have a larger range of potential earthquake magnitudes and locations than previously identified. This is a result of a range of new research, part of which was recently compiled by the Nuclear Regulatory Commission.
West Coast
In California, earthquake hazard extends over a wider area than previously thought. Most notably, faults were recently discovered, raising earthquake hazard estimates for San Jose, Vallejo and San Diego. On the other hand, new insights on faults and rupture processes reduced earthquake hazard estimates for Irvine, Santa Barbara and Oakland. Hazard increased in some parts of the San Francisco Bay Area and Los Angeles region and decreased in other parts. These updates were from the new Uniform California Earthquake Rupture Forecast Model, which incorporates many more potential fault ruptures than did previous assessments. Recent earthquakes in Alaska, Mexico and New Zealand taught scientists more about complex ruptures and how faults can link together. This insight was applied to California for which approximately 250,000 potential complex ruptures were modeled.
New research on the Cascadia Subduction Zone resulted in increased estimates of earthquake magnitude up to magnitude 9.3. Deep-sea cores were collected that show evidence within the sea-floor sediments of large earthquake-generated mudflows. Earthquake shaking estimates were also increased following abundant data gathered from the magnitude 9.0 earthquake in Tohoku, Japan in 2011 and the magnitude 8.2 earthquake offshore of Chile in 2014, as those events ruptured along subduction zones similar to the Pacific Northwest zone.
In Washington, scientists incorporated new knowledge of the Tacoma Fault into the maps and identified changes to the geometry of the Whidbey Island fault in the northern Puget Sound. Earthquake hazard also increased for Las Vegas because of new science. In Utah, scientists dug trenches to study prehistoric earthquakes along the Wasatch Fault. While the overall seismic hazard didn’t change significantly, detailed changes were made to the fault models in this region and robust data were acquired to hone the assessments. This is valuable since approximately 75% of Utah’s population, including the residents of Salt Lake City, lives near this fault.
The magnitude 7.9 earthquake in Wenchuan, China in 2008 provided many new records of shaking that are very similar to anticipated future earthquakes in the western U.S., as the fault structures are similar. Previously, scientists did not have nearly as many shaking records from earthquakes of this size.
Induced Earthquakes — Research Underway
Some states have experienced increased seismicity in the past few years that may be associated with human activities such as the disposal of wastewater in deep wells.
One specific focus for the future is including an additional layer to these earthquake hazard maps to account for recent potentially triggered earthquakes that occur near some wastewater disposal wells. Injection-induced earthquakes are challenging to incorporate into hazard models because they may not behave like natural earthquakes and their rates change based on man-made activities.
CoreLogic, a global property information, analytics and data-enabled services provider, has released a new version of its EQECAT natural catastrophe modeling platform, which contains three new proprietary risk models that quantify and analyze the potential financial impact of catastrophic natural hazards in peak exposure regions across the globe. The expansion of natural catastrophe risk analysis includes modeling for earthquake and tsunami events in Japan and earthquake events in Singapore, as well as for European windstorms, including a North European offshore wind farm risk model.
EQECAT, which was acquired by CoreLogic in December 2013, first introduced its natural catastrophe risk modeling platform RQE (Risk Quantification & Engineering) in January 2013 that includes more than 180 natural hazard models for 96 countries and territories spanning six continents. Loss calculations simulate 300,000 years of losses to provide comprehensive and highly credible estimates of risk exposure to earthquakes, tropical cyclones and windstorms, severe convective storms, brushfires, winter storms and flooding.
“This release of the RQE v15.0 platform not only advances the innovative and industry-leading science that is the hallmark of EQECAT risk models, but also demonstrates the commitment CoreLogic has to delivering timely enhancements and new platform features to our clients,” said Paul Little, head of EQECAT.
The additional catastrophe risk modeling delivered through the new RQE v15.0 platform includes:
The European Windstorm Model, which introduces the ability to analyze offshore wind farm turbines that are rapidly expanding in Europe as a result of major investments in alternative energy. The “Eurowind” model extends over the North Sea, Irish Sea, Baltic Sea and Atlantic Ocean, and gives insight into loss caused by wind storms. In addition, the windstorm model includes two views of frequencies — the empirical model based on the historical record from 1960 to present, and the analytic model with a continuous 1200-year simulation of an Earth System Model (ESM) driven by climatic background conditions to characterize the frequency and severity of European windstorms. The European Windstorm Model also now incorporates Spain and Portugal, extending the existing coverage to 24 countries and provides analysis of extratropical cyclone risk. Expanded capabilities also include access to Global Climate Model research used to help determine the frequency and scale of European windstorms.
The Japan Earthquake Model, which provides the most current view of earthquake risk across the country based on December 2013 research released by the Japanese government and national research organizations. This model accounts for previously un-modeled very large magnitude events with updated seismic source zones and increased maximum magnitudes. New damage and loss data from the 2011 Great East Japan (TÅhoku-oki) earthquake prompted a complete review and update to model vulnerability functions, including major changes to performance -based effects of deep building foundations and base isolation. For the first time, CoreLogic introduces tsunami as a sub-peril, offering both a fully probabilistic and a scenario-based tsunami risk model, using 30-meter digital elevation maps for more granular and precise risk evaluations for a complete view of earthquake and tsunami risk across Japan.
The Singapore Earthquake Model, which accounts for the increased probability of a near-term large-magnitude earthquake on the Sunda (Java) megathrust fault. This fault zone is one of the most active on Earth and largely influences earthquake risk in Singapore. This new model accounts for seismic risk factors specific to Singapore, such as soft soils that amplify intermediate-period ground motions from distant large earthquakes and the existence of reinforced concrete high-rise buildings.
“Combining more than 30 years of collected data from CoreLogic with EQECAT natural catastrophe models allows us to deliver a more comprehensive, highly credible analysis of key drivers of hazard risk at various levels of exposure around the globe, from across regional borders to individual site levels,” said Mahmoud Khater, chief science officer for catastrophe modeling.
The updated EQECAT RQE v15.0 platform also offers significant enhancements to user interface, reporting options and workflow management tools. Enhancements include a more comprehensive view of exposure data with expanded filter options, event-specific hazard intensity reports for individual locations, and analysis of annual exceedance probability refined by region and sub-peril to show drivers of portfolio losses, among other capabilities.
“In an ever-changing environment, it would be ideal if the U.S Geological Survey had a presence in every corner of the nation. While we may not be able to cover every inch of the landscape, we can greatly enhance our scope with your help,” the USGS continues.
The USGS has a variety of citizen science efforts where people can report what’s happening in their own backyards. It’s seeking information on events such as earthquakes, landslides, new construction, and climate. “If you live in Alaska, we want you to tell us if you experience a volcanic ash fall and even collect a sample,” the USGS said.
The information gets aggregated and disseminated through a variety of tools geared toward making this information easily accessible so it can be put to use. Using , there are interactive online systems where people can report what it was like during an earthquake, and then see all the reports for that event mapped out for the affected area.
“Through your contribution, not only will your observations build a much larger and more complete database, but you will also become a virtual member of the USGS scientific team!” the USGS said.
Map of tweets containing the word “terremoto” (Italian for “earthquake”) collected in the two minutes following a magnitude 6.0 earthquake in Northern Italy on May 5, 2012. The red star shows the location of the earthquake. The tweets are concentrated in the epicentral area but discussion of the earthquake has already spread beyond the impacted region. This shows the speed that USGS Tweet Earthquake Dispatch (TED) collects tweets to provide insight into potential earthquake events. Image Credit: USGS.
The valuable role of crowd-sourcing data is outlined in a 2013 report by the Woodrow Wilson International Center for Scholars, authored in collaboration with the USGS. The report highlights success stories from the USGS’ Tweet Earthquake Dispatch (@USGSted) program, Did You Feel It? and related USGS activities. For example, although there was an exceedingly swift international aid response to the massive 2008 earthquake in Wenchuan, China, the first reports of the event outside of the impacted area came from citizens, and information spread through the use of social networking tools such as Twitter. Similarly, 148,000 individuals used Did You Feel It? to describe their experience of a magnitude 5.8 earthquake that occurred in Virginia on August 23, 2011. Because large-magnitude earthquakes are fairly rare along the East Coast, there were only a handful of seismometers installed nearby to record the event. Thus, much of the preliminary data regarding this earthquake came from the DYFI? system.
These are the ways USGS gathers information from the public:
Improving Earthquake Monitoring
Did You Feel It? (DYFI?) is an online crowd-sourcing system developed by the USGS for the public to provide first-hand accounts of earthquakes they experience. As one of the longest standing and most successful examples of citizen-based science to date, it has garnered more than 2,790,000 total responses since its launch in 1997.
Through this program, users are able to document the shaking level they experienced and find out what was felt elsewhere. Specifically, USGS scientists aggregate results by zip code (domestically) and by city (globally) to show reported shaking intensity. Those reports also augment shaking data from sensors and are incorporated in ShakeMaps used for emergency response. To document a seismic encounter, visit the DYFI? home page and fill out a brief questionnaire.
Tweeting and Shaking
Many regions around the world have only a scant number of seismometers, complicating the rapid detection and characterization of earthquakes. To enhance earthquake monitoring, Twitter has proven to be an advantageous source for USGS scientists to receive rapid firsthand accounts of potential events.
The USGS Tweet Earthquake Dispatch (TED) program rapidly detects possible earthquakes when a large number of public tweets mention “earthquake” or its equivalent in several languages. These tweet-based detections often come prior to sensor alerts in sparsely instrumented regions. USGS analysts at the National Earthquake Information Center (NEIC) receive these indicators and then turn to more accurate earthquake sensors and instrumental data for confirmation and quantitative assessment. For earthquakes with a magnitude 5.5 or greater, the USGS sends out notifications via the Twitter account @USGSted to people around the world.
Did You See It? Watch Out for Landslides
In an average year, landslides can cost the United States up to $2 billion in damage. Now, scientists at the USGS are asking the public to help track landslides to better understand how to protect lives and property. This is being done through the system, Did You Feel It? This program allows respondents to report detailed accounts of observed landslides, including photographs. To make your contribution, visit the DYSI? webpage and click on the Report a Landslide tab.
Ascending eruption cloud from Redoubt Volcano as viewed to the west from the Kenai Peninsula. Photo Credit: R.J. Clucas, USGS.
Is Ash Falling? Helping Monitor Volcanic Eruptions
This tool will help AVO scientists build a more complete record of the amount, duration, and extent of ash fall. Getting first-hand accounts of ash fall will also help refine computer models of ash cloud movement and interpretation of satellite imagery. Citizens are also encouraged to collect ash samples and send them to AVO. With your help, volcano scientists can greatly expand their sampling of ash deposits.
The National Map Corps
Citizen volunteers are also making significant additions to The National Map (TNM), a web-based geospatial visualization platform. The public is encouraged to collect data on manmade structures such as schools, hospitals, post offices, police stations, and other buildings. The project started in 2012 in Colorado and has expanded to 35 states. A recognition program has also been created where badges can be earned based on the number of data points a volunteer contributes. This effort is through The National Map Corps (TNMCorps) Volunteered Geographic Information project, which partners with organizations such as 4-H and GISCorps.
Observing Nature’s Calendar
As the seasons come and go, temperatures fluctuate, leaves emerge and change colors, and animals migrate. The USA National Phenology Network gives you this opportunity through its program Nature’s Notebook. Volunteers are collecting observations of these seasonal changes—referred to as phenology—to help scientists better understand subjects including climate change, invasive species, agricultural production, impacts of frosts and freezes, and the timing of pests and diseases.
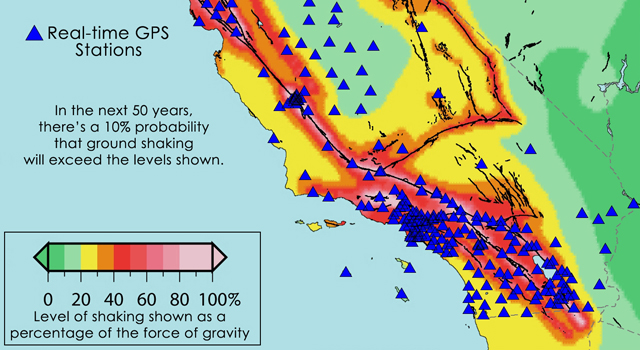
Location of the more than 500 real-time GPS monitoring stations in the western United States that make up the Real-Time Earthquake Analysis for Disaster Mitigation Network. Image credit: USGS/UC Berkeley/Scripps Institution of Oceanography.
The space-based technology that lets GPS-equipped motorists constantly update their precise location will undergo a major test of its ability to rapidly pinpoint the location and magnitude of strong earthquakes across the western United States, according to NASA. Results from the new Real-time Earthquake Analysis for Disaster (READI) Mitigation Network soon could be used to assist prompt disaster response and more accurate tsunami warnings.
The new research network builds on decades of technology development supported by the National Science Foundation, the Department of Defense, NASA and the U.S. Geological Survey (USGS). The network uses real-time GPS measurements from nearly 500 stations throughout California, Oregon and Washington. When a large earthquake is detected, GPS data are used to automatically calculate its vital characteristics, including location, magnitude and details about the fault rupture.
“With the READI network, we are enabling continued development of real-time GPS technologies to advance national and international early warning disaster systems,” said Craig Dobson, natural hazards program manager in the Earth Science Division at NASA Headquarters in Washington. “This prototype system is a significant step towards realizing the goal of providing Pacific basin-wide natural hazards capability around the Pacific ‘Ring of Fire.’”
Accurate and rapid identification of earthquakes of magnitude 6.0 and stronger is critical for disaster response and mitigation efforts, especially for tsunamis. Calculating the strength of a tsunami requires detailed knowledge of the size of the earthquake and associated ground movements. Acquiring this type of data for very large earthquakes is a challenge for traditional seismological instruments that measure ground shaking.
High-precision, second-by-second measurements of ground displacements using GPS have been shown to reduce the time needed to characterize large earthquakes and to increase the accuracy of subsequent tsunami predictions. After the capabilities of the network have been fully demonstrated, it is intended for use by appropriate natural hazard monitoring agencies. The USGS and the National Oceanic and Atmospheric Administration are responsible for detecting and issuing warnings on earthquakes and tsunamis, respectively.
“By using GPS to measure ground deformation from large earthquakes, we can reduce the time needed to locate and characterize the damage from large seismic events to several minutes,” said Yehuda Bock, director of the Scripps Institution of Oceanography’s Orbit and Permanent Array Center in La Jolla, Calif. “We now are poised to fully test the prototype system this year.”
The READI network is a collaboration of many institutions, including Scripps at the University of California in San Diego; Central Washington University in Ellensburg; the University of Nevada in Reno; California Institute of Technology/Jet Propulsion Laboratory in Pasadena; UNAVCO in Boulder, Colo.; and the University of California at Berkeley.
NASA, NSF, USGS and other federal, state and local partners support the GPS stations in the network, including the EarthScope Plate Boundary Observatory, the Pacific Northwest Geodetic Array, the Bay Area Regional Deformation Array and the California Real-Time Network.
“The relatively small investments in GPS-based natural hazards systems have revolutionized the way we view Earth and allowed us to develop this prototype system with great potential benefits for the infrastructure and population in earthquake-prone states in the western United States,” said Frank Webb, Earth Science Advanced Mission Concepts program manager at JPL.
The READI network is the outgrowth of nearly 25 years of U.S. government research efforts to develop the capabilities and applications of GPS technology. The GPS satellite system was created by the Department of Defense for military and ultimately civil positioning needs. NASA leveraged this investment by supporting development of a global GPS signal receiving network to improve the accuracy and utility of GPS positioning information. Today that capability provides real-time, pinpoint positioning and timing for a wide variety of uses, from agriculture to Earth exploration, NASA said.
“Conventional seismic networks have consistently struggled to rapidly identify the true size of great earthquakes during the last decade,” said Timothy Melbourne, director of the Central Washington University’s Pacific Northwest Geodetic Array. “This GPS system is more likely to provide accurate and rapid estimates of the location and amount of fault slip to fire, utility, medical and other first-response teams.”
The GPS earthquake detection capability was first demonstrated by NASA-supported research on a major 2004 Sumatra quake, conducted by Geoffrey Blewitt and colleagues at the University of Nevada in Reno.
Four years ago my wife and I moved to Lake Guntersville as our ultimate retirement location because it seemed to have ideal factors we were looking for — mountains, lakes, great fishing, mild weather, low taxes, low cost of living and genuinely nice people. This inland location had navigable water to the Gulf of Mexico and even to the Great Lakes. We liked the small town atmosphere away from coastal hurricanes, panicky road clogging evacuations, blizzard, earthquakes or big tornadoes. Well, so much for that plan as we had a front row seat to one of the biggest tornado events of the decade with one of the tornadoes passing 500 yards in front of our windows.
Just like in the movies, on Wednesday morning, April 27, the winds started to pick up, tornado alarms sounded, and debris started flying, including outdoor furniture. The boathouse next to us had the shingles stripped off the roof like a deck of cards, and then big oak trees started toppling over. The lake looked like it was boiling violently as winds in Guntersville reached 130 mph. We could see countless power lines and transformers arcing green and then going dead. Many buildings and trees were okay while others were totally demolished.
Downed trees caused much of the damage.
My visual estimate was that at least 10 percent of the power poles and lines were damaged or toppled. It’s now six days after the storm. Although utility crews have been busy putting in new poles and lines, much remains to be done and I’m doing this article on battery power from my car charger.
This tornado event was unusual in that Alabama rarely gets more than one tornado at a time with most being the smaller F-1/F-2 storms. Tuscaloosa got the worst of it with an F-4 that stayed on the ground for 70 miles.
Concrete block walls were no match for the 130 MPH winds.This was a TV repair shop in downtown Guntersville.
Our county, Marshall County, was lucky with only 10 tornadoes during the 8 hour period. I don’t think any were over an F-2 but Marshall County still had 5 fatalities. Alabama had over 200 tornadoes that day with fatalities nearing 300.
One thing that really impressed me about the people in Alabama is their resilience and willingness to help their neighbors. There was no hand wringing waiting for the government to help. Almost immediately after the first tornado you could hear the sound of chainsaws as neighbor helped neighbor dig out and clear the roads. This helped the city and county get most roads passable within a day.
People helping people.
Local businesses helped also. Within 12 hours T.L.’s Barbeque and our favorite seafood restaurant, Crawmama’s, had a catering service set up in downtown Guntersville providing free meals for the National Guard, emergency workers and anyone who needed a hot meal. Crawmama’s is one of those hidden gems that serve seafood comparable to the best restaurants in New Orleans.
After the tornadoes, NOAA captured ortho imagery of the affected areas using a King Air at 5000 ft. The imagery can be seen at the NOAA website. Pictometry is providing low altitude high resolution ortho and oblique imagery and there are stunning video clips of the Tuscaloosa tornado on youTube.
The first tornado came and went so fast that I really didn’t have much time to ponder the event. However the unexpected surprise was news media reports that we could expect numerous tornadoes during the 8 hours following the initial tornado. The tornado alarms sounded again and again throughout the day and I can tell you from first-hand experience that getting through this was much easier thanks to the location based GIS services of my iPhone. Here is why.
When the power was still on we had the luxury of watching the television news with Doppler radar and all the detailed graphics. Once the power went out all we had were tornado alarms, a portable radio and my lowly cell phone. The tornado alarms were nerve racking since they went off so often. I later learned that the alarms are linked county-wide so a tornado threat anywhere in the county will cause all the alarms to sound. Radio stations were helpful but it was difficult to form a clear picture of the moving storms.
The iPhone proved to be wonderful. It continued working even after power was lost so we could communicate with family members. From the first power outage until now the cell phone service continued un-interrupted. The service did slow and show weaker cell tower signals as the system switched to battery power and standby generators. But it did continue to work.
Most important, the iPhone radar mapping application from the Weather Channel provided us with a video loop of weather bands and their path on a Google map so we could see for ourselves how the storms were moving and if we would be affected. This really put our minds at ease most of the time despite numerous tornado alarms. Throughout the day as we dodged other tornadoes, I thought about all the man-hours I and my colleagues spent in the early ’90s digitizing street centerline data and addresses ranges to build the digital street databases and other maps that are now the backbone of location based services.
I never could get really excited about the tiny screens of smart phones but this tornado event and even more mundane applications such as navigation are making me appreciate these little devices. My iPhone has replaced my cell phone, camera, calculator, notepad, and now my GPS. I liked the navigation and Google maps of my iPhone but many times, such as in DC traffic, it was hazardous looking at the screen. So I was very pleasantly surprised with an application that turns the iPhone into a full featured car navigation system including voice navigation and real time traffic. The MotionX GPS Drive is one of the hottest selling applications for the iPhone and I’m a convert. I bought a mounting bracket that lets me mount the iPhone on the AC vent of any rental car and I now don’t bother packing my old GPS. The only downside is that it uses up the iPhone battery so I have a 12v adapter to keep it charged when using navigation.
That little iPhone and GIS keep making my life better. So for all the hand wringers nearly panicked that their iPhone tracks their location and worried about their privacy, my vote is for more and better location-based services.