This is the mecca of geographic information systems, or GIS, at least in the United States: the 2014 Esri International User Conference (UC) in San Diego, California, held every July. GPS World and Geospatial Solutions were there in force. A newly dominant technology that got plenty of discussion was unmanned aerial systems (UAS or UAV). Eric Gakstatter, GPS World’s survey and GIS editor, said “I can boil where this technology is headed down to one word: real-time.”
Tag: Geospatial Solutions
-
GPS World at the 2014 Esri International User Conference
This is the mecca of geographic information systems, or GIS, at least in the United States: the 2014 Esri International User Conference (UC) in San Diego, California, held every July. GPS World and Geospatial Solutions were there in force. A newly dominant technology that got plenty of discussion was unmanned aerial systems (UAS or UAV). Eric Gakstatter, GPS World’s survey and GIS editor, said “I can boil where this technology is headed down to one word: real-time.”
-

GPS World, Geospatial Solutions Report from Esri Conferences
Geospatial Solutions Editor Eric Gakstatter, who is also a contributing editor to GPS World magazine, will be attending the 2013 Esri Survey Summit and Esri International User Conference, providing continuous new and analysis for the duration of both conferences. The conferences are being held this week in San Diego, California.
On Tuesday at 1:30 p.m. in Room 24A of the San Diego Convention Center, Gakstatter will deliver a presentation entitled “High-Precision GPS/GNSS on your Smartphone, Handheld and Tablet,” discussing trends and new product innovations for sub-meter and centimeter mapping on smartphone, handheld and tablet devices, including Windows Mobile, Android and iOS (Apple) devices.
Steve Copley, GPS World and Geospatial Solutions associate publisher, shared images of the event on his Twitter account. A few of them are below.
For live coverage all week follow:
Eric Gakstatter @GPSGIS_Eric
Steve Copley @SteveCopleyGPS
Geospatial Solutions @GSS_NCM

Esri User Conference registration. 
Esri User Conference. 
Esri User Conference. 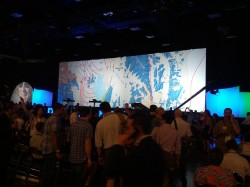
Esri User Conference. -
Second Annual Field Technology Conference (FTC 2012)
September 26, 2012 – September 27, 2012
Portland | Oregon | United States (USA)
 Eric Gakstatter, GPS World’s editor for survey and Geospatial Solutions Weekly, will be a keynote speaker at the Second Annual Field Technology Conference (FTC 2012). FTC 2012 is hosted by the Western Forestry and Conservation Association (WFCA), GPS World magazine, and Geospatial Solutions Weekly.
The conference will be held September 26-27 at the Holiday Inn Convention Center in Portland, Oregon. This unique conference, centered around geospatial technology, features tracks on field devices (handhelds/tablets, GPS, lasers, 3D scanning), remote sensing (aerial photography, satellite imagery, airborne lidar), and mapping software (mobile GIS, open source GIS, datum conversions).
The opening general plenary session will feature world-class experts in emerging geospatial technologies of Unmanned Aerial Vehicles/Systems (UAV/UAS), Mobile GIS, Open Source GIS, and GPS/GNSS. The keynote speakers will discuss how these emerging technologies are changing the way geospatial data is collected and managed. Besides Gakstatter, featured speakers include:
- Dr. Joe Paiva – Paiva Consulting
- Jeff Shaner – Esri Mobile Technology Program Manager
- David Percy – Portland State University GIS Research Faculty
“Audience feedback from last year’s conference was very good,” said keynote/moderator Eric Gakstatter. “Attendees said they appreciated our intimate and focused content as well as expert analysis of technology trends. Listening to feedback from last year’s attendees, we’ve expanded a bit this year to include outdoor demonstration sessions with UAVs, handhelds/tablets, laser rangefinders, mobile phones, and GPS units. We’ve also attracted more experts from around the country to present their work and thought leadership.”
Registration for the Second Annual Field Technology Conference (FTC) is now open. 2011 attendees included representatives from federal, state, and local government, Fortune 1000 companies, Native American tribes, higher education, and natural resource consultancies.
The registration fee is $245 if registered by September 21, and $295 if registered after September 21, 2012. The registration fee includes lunch on both days as well as refreshments during breaks. The conference room rate is $99/night plus tax. After September 5, the reduced rate will be subject to availability.
For more information as well as a draft of the conference agenda, visit the website.
Sponsorship opportunities are available. Contact Richard Zabel.
-
GeoEye and Rolta Form Strategic Partnership to Develop Geospatial Solutions for Global Markets
GeoEye, Inc. announced that it has signed a Memorandum of Understanding to partner with Rolta, a global, leading provider of innovative IT solutions. With this new partnership, Rolta gains access to GeoEye’s high-resolution satellite imagery, services and expertise to develop innovative geospatial products and services. Rolta plans to offer these GeoEye-enabled solutions to its customers across high-growth global markets, beginning with India.
Preetha Pulusani, Rolta’s chief strategy officer, said, “Rolta has been engaged in providing geospatial solutions for over two decades. Imagery plays a critical role – especially for defense and homeland security – to enable users to rapidly analyze change, visualize impacts and make informed decisions in the field in a timely manner. We are pleased to have the opportunity to work with GeoEye to provide our customers with tools and content to meet their most challenging needs.”
According to the announcement, Rolta also plans to develop intelligent 3-D city solutions for commercial users in urban planning, construction and infrastructure development. Ninety percent of the fastest-growing metropolitan economies are located outside North America and Western Europe and in regions such as Southern Asia. Rolta intends to offer these high-growth global markets financially accessible 3-D model solutions developed from GeoEye satellite imagery.
Tony Frazier, GeoEye’s senior vice president of Marketing, said, “Geospatial intelligence has become crucial to decision making. We are excited about this partnership and believe that our world-class imagery, information service capabilities and expertise, coupled with Rolta’s product development and IT services track record, will produce innovative geospatial solutions that deliver clear, deep and timely insights to global government and commercial users.”
-
GIS Gives Simulators More Realism

IITSEC 2008. What is a GIS guy doing at a training simulation conference? Having a lot of fun — and learning that GIS makes everything better.
By Art Kalinski, GISP
Last week I attended the Interservice/Industry Training, Simulation, and Education Conference (I/ITSEC) in Orlando, Florida. It was an international gathering of more than 16,000 attendees, both military and civilian, that featured some 550 exhibits focusing primarily on military-related training and simulation. I know that Geospatial Solutions is a GIS-focused publication and that most of you are GIS professionals, but this conference clearly demonstrated the merging of many disciplines in formerly unrelated communities, including GIS.
When we hear the word “simulators,” we generally think of flight simulators — and there were many of those on display — but the exhibits also included ground combat, medical, logistic, and cultural immersion simulators. This conference demonstrated the most realistic and up-to-date training and simulation tools available in the world today, and GIS played a fundamental role as the underpinning of many applications. Autodesk, ESRI, and 3D model builders Precision Lightworks all had booths at the four-day event.
One interesting terminology quirk that I noticed is the difference in usage of the term “database.” We GIS folk generally use the word to describe our vector data and attributes, with imagery as separate layer. But in the training environment, the term is used to describe all the datasets that feed the simulators, including maps, imagery, GIS data, DEMs, CAD drawings, photos, objects, characters, TINS, wireframes, draping textures, skins, etc. The overlap with the video gaming community is significant, but GIS is growing in importance as many applications strive for real-world connectivity.
Experiencing the Exhibit Hall
Some of the exhibits showed a significant investment, not just in the technology but in the displays themselves. It was apparent that training and simulation is a big business, with lots of dollars at stake. One exhibitor summed it up this way: “With aircraft and ships costing tens and hundreds of millions each, simulators are a low-cost way of building competence without risking expensive equipment.” The same holds true for soldiers in the field. Actual combat is not the place to conduct training, and everyone is striving to create training that is so realistic that it is indiscernible from actual combat.
Many exhibitors showcased new display technology, such as very high-resolution projectors from Sony. Most simulators used large flat screens, tripled in some cases to provide panoramic views. One flight simulator used nine separate screens, but even more impressive were large concave screens similar to IMAX. that provided realistic and seamless images, even in 3D.

Big screen display technology. Some trainers used head-mounted displays (HMDs) for combat action scenarios, but an unusual addition was a 10-foot spherical cage for humans that resembled a giant hamster ball. The subject enters the cage wearing a wireless HMD, and can move in any direction responding to the HMD display and program. The cage was so well designed that it moved with just light finger pressure. Users indicated that getting used to walking or even running in the cage became natural quite rapidly.

Users indicated that walking in the cage — or even running — became natural quite rapidly. Some of the exhibits showed significant expense, not just the technology but the displays themselves. The Augusta Westland helo trainer was one example.

The Augusta Westland helo trainer. It was apparent that training and simulation is a big business with lots of dollars at stake. One exhibitor summed it up stating, “With aircraft and ships costing tens and hundreds of millions each, simulators are a low cost way of building competence without risking expensive equipment.” The same holds true for soldiers in the field. Actual combat is not the place to conduct training and everyone is striving to create training that is so realistic that it is indiscernible from actual combat
I expected to see more simulators that imitated the movement of flight, but as one of the exhibitors told me, the motion and G forces of jet fighters are so great that simulators can’t even come close — so they replicate other aspects of the experience instead. Two motion simulators that were effective included a helicopter flight and gunner simulator, and a Hummer simulator that recreated the motion of a vehicle struck by an improvised explosive device (IED). The shock and rollover over of the vehicle trained soldiers how exit a turned over vehicle while under fire, the goal being to simulate and practice what could happen so there were no surprise situations.

Vehicle rollover trainer. Lockheed Martin featured a shipboard engine-room simulator that enabled the training of engineering personnel by simulating various casualties and damage control actions, without risk to people or equipment. The operation was very similar to a video game, with realistic characters responding to the commands of the trainee. As a former Navy Surface Warfare Officer I had to try my hand at the Kongsberg ship bridge simulator. I can attest that not only did the simulator look good, the physics, behavior and reaction of the ship was dead on accurate.

As a former U.S. Navy surface warfare officer, I had to try my hand at the Kongsberg ship bridge simulator. I can attest that not only did the simulator look good, but the physics, behavior, and reaction of the ship were dead-on. There were numerous small arms trainers and ranges on display that were capable of training individuals, multiple trainees, and even groups acting as teams within a combat environment. I also saw countless examples of wearable gear that permitted simulation of small arms combat using of laser weapons to simulate hits. Numerous urban building mock-up trainers incorporated video displays, realistic sounds, and even explosions and smoke.

Weapons team training. Medical simulation included traumatic injuries and triage scenarios played via video screens. Sickeningly realistic moulage kits imitated all types of injuries, complete with exposed bones and spurting blood. There were many exhibits of peripheral equipment and supplies such a carrying cases, communication gear and even very high quality surface coated mirrors for projectors and displays. One little gem that I hands-on tested at the ESRI booth was a 3D mouse by 3D Connexion. The “Space Navigator” was the smoothest, most intuitive, most precise, quality feeling mouse I’ve ever used. I’m getting one.

3D mouse. An area I found fascinating — because I didn’t expect to see it — featured exhibitors that focused on human simulation and cultural immersion. DI-Guy and MetaVR were displaying human simulations of crowds that looked realistic and could be programmed to behave in various ways, with each character acting as both an individual and part of the group. The photo shows a Mideast group walking toward an infantry squad while hiding two terrorists in their midst. Some of the video characters are a little blocky, but new techniques derived from the video gaming industry include draping “skins” on mesh frames instead of boxes or tins. The end result is smoother-looking characters and objects, such as flowing robes.

Computer generated crowd. One exhibitor that displayed human motion capture tools used by Hollywood to create animations. They had a young dancer wearing a capture suit whose motion was transferred to a character on a video display. She won the unofficial endurance record since she danced continuously during the four-day exhibit hall operation.

Human movement capture. Another exhibitor, the Tatitlek Corporation, takes cultural immersion to the extreme with live, culturally correct role players that recreate Middle Eastern environments. The live players create the look, sounds, and feel of being in the region, so that it’s not a shock for our troops when they arrive in-theater. Tatitlek displayed one example of their cultural simulations: a sheik’s tent complete with rugs, seating, accessories, and even staged arguments and police intervention.

Live cultural immersion. Enhancing Reality with GIS and Imagery
So how does GIS fit into this community? As I learned from people that have been in this business for years, training simulation first evolved from physical mock-ups to computer-based, CAD-like “cartoon” environments that were only loosely tied to reality. It was considered a challenge to get an image up on the screen that represented reality and make it move around in response to the trainee, but that’s no longer good enough. Now imagery and GIS-referenced data is enhancing the entire environment.
Lockheed Martin was a big presence at the conference, and created a buzz with flight simulation systems that incorporated photo-realistic and photo-accurate oblique imagery and 3D models into geo-referenced applications that simulate weather conditions and even provide night-time views. This kind of accurate simulation achieves realism not previously seen, and now has captured the attention of mission planners, who have significantly different needs from trainers. The mission planners, as their title implies, plan real missions just before actual execution. For their work they need up-to-date information that is accurate, geo-referenced, and measurable. They cannot tolerate made-up data or imagery — it may be perfectly fine for training, but could be disastrous if relied upon for real execution. The bar has been raised.
Attending I/ITSEC, I could see the growing convergence of GIS, CAD, BIM models (see my August column for the BIM – GIS convergence), computer display technology, and the training/simulation applications. It’s amazing to watch how everything is coming together. An especially interesting system displayed by the Navy was a flight simulator that collected brain wave data and recorded images of the pilot’s eyeball movements.

Human factors flight simulator. As I viewed this rig I couldn’t help but recall a photo I saw at Moody Air Force Base of an early flight trainer crafted from plywood and broom handles. Imagine how alien this new Navy system would look to the designer of that plywood trainer. I wonder where we will be in 20 more years.
-
Right Oblique . . . March!
A complex base-mapping project spawns new techniques — and brings the power of oblique imagery to the military.
By Art Kalinski, GISP
When I started basic training and learned the marching command “right oblique march,” little did I know that the term “oblique” would become a capstone of my GIS career. As most readers know, I was a career naval officer who set up the Navy’s first GIS in the mid-eighties. After military retirement and graduate work at the University of North Carolina, I served as the Atlanta Regional Commission (ARC) GIS Manager until I retired early to join Pictometry last year.
I did so because, much to my surprise, oblique imagery was not being used by the military. In Atlanta, we saw such a dramatic improvement in the effectiveness of first responders using oblique imagery that I felt compelled to help bring this technology to our troops in the field. The first major oblique imagery project that I managed was imaging all Marine Corps Bases in the continental United States.
The United States Marine Corps contracted Pictometry International and the engineering firm PBS&J to image every USMC base in the continental U.S. with high-resolution ortho and oblique imagery. The imagery was captured from late 2007 through early 2008 and delivered to Marine Corps headquarters for installation in the East and West Coast GeoFidelis GIS systems. Capturing the imagery was uneventful, except for scheduling flights around base exercises and a solving a technical issue that was keeping us from shooting the high-altitude Marine Corps Mountain Warfare Training Center in Bridgeport, California.
We assisted with the installation of the imagery and software at the East and West GeoFidelis computer centers in a CITRIX environment. After the installation, eighteen user-training classes were held at ten Marine Corps bases.

Students in the USMC user-training classes learned about oblique imagery, the viewing software, and ESRI ArcGIS integration. The contract also called for a Public Works Implementation Plan and a Fire Protection Implementation Plan. Several other projects — including a 3D interactive model for security use, an oblique mosaic of a base to replace a large wall photograph lost in a major fire, and a proof of concept demonstrating the integration of oblique imagery with TerraGo GeoPDFs — were also completed.
Quality Control
I personally reviewed all the imagery for completeness of coverage, and individual images were spot-checked for image quality. The initial Quantico imagery had too much snow cover to be useful; it was reshot later in the season when the snow had melted. Snow obscures ground details, and the white reflections create excessive contrast that diminishes the visibility of adjoining features.
All imagery from five directions — north, south, east, west, and ortho — had complete coverage, with the exception of the west view imagery of Miramar. Heavy winds had caused the aircraft to drift off course, resulting in a gap in the oblique imagery from the west view. The other views fully cover the two-square-mile area, and although this falls within quality standards, it will be reshot later this year. This is an error rate of only .02 percent.
Technical Difficulties
Oblique imagery had never been collected at the high altitudes needed to photograph the Mountain Warfare Training Center, located about 30 miles east of Yosemite Park. The problem was that the hard drives used to record the imagery couldn’t operate above 10,000 feet. Hard-disk magnetic recorders require a minimal air density in order to separate the record heads from the magnetic media with a microscopic air layer. Low air pressures at 14,000 feet cause the record heads to “crash,” or come in contact with the magnetic surface of the record media. Significant engineering time and experimentation ultimately solved the problem.
The initial solution was to use pressurized rotating media with high-altitude specifications. This solution functions at up to approximately 16,000 feet above mean sea level, but is not fully reliable. The drives also have slower transfer rates, so more drives were needed in the aircraft for efficient capture. There are other limitations of the rotating technology that are not desirable for a long-term solution, but the capture was accomplished. Engineers are currently testing a more promising technology for high-altitude capture using high-speed, solid-state drive technology. Early examples of this technology proved to be too slow for efficient capture, but new versions of the equipment are showing more promise.
There were concerns that a CITRIX deployment of the imagery and viewing software could have speed problems. Additionally, the Marine Corps is moving to ArcServer technology, so engineering time was devoted to alternative solutions. Engineers developed thin-client viewing software that could be used if needed.
Something New: An Oblique Mosaic
During the course of the contract, a feasibility question was raised: Was it possible to merge individual oblique images to create a base-wide oblique image? This idea was prompted by the loss, during a building fire, of a large traditional aerial photograph. Engineers developed a technique to tile and seamlessly merge multiple oblique photographs to form what looks like a single high-altitude — yet high-resolution — oblique image. This was especially challenging since oblique images don’t edge-match easily; each image has a different perspective, with each pixel being a different size and not rectangular in shape. Those challenges were overcome, and a single base-wide oblique image was created to replace the destroyed aerial photograph. Since the large mosaic was created from many low-altitude, high-resolution obliques, the final large oblique image had very fine resolution throughout.
3D Models
One of the deliverables requested under this contract was an interactive 3D model of a high-visibility location in the Washington D.C. area. The location presents security and logistics challenges, so an interactive 3D model will be very useful. The “wire frame” model was created from multiple oblique images by Precision Light Works (PLW) with a semi-automated process similar to stereo pair analysis.
Once the wire frame is created, the same imagery is automatically draped on the 3D model to create not only a photo-realistic model, but a photo-accurate model — meaning that features are accurately located on the models. The 3D model created by PLW can be used in various software viewers, including Google Earth. Some 3D viewers can also do measurements within the 3D model.
Public Works Report
PBS&J worked with Pictometry engineers to develop an implementation plan using oblique imagery for public works applications. One public works application surfaced because there was a need to conduct a survey of runway approaches to determine whether trees had grown into the glide paths or if unauthorized construction had occurred within the glide paths.
The traditional method to accomplish this task was with survey crews sighting and measuring objects on site — a time-consuming task. The ability to measure heights of vertical features made oblique imagery a natural choice for this application. PBS&J tested the concept and demonstrated the feasibility of doing surveys with the imagery, but more work will be needed to test the accuracy of this method and ultimately receive certification.
Fire Protection and Emergency Response Report
Another use of oblique imagery, which received significant publicity, is its use as a planning tool for firefighters en route to a fire. The imagery permits the firefighters to get the lay of the land, measure distances to fire hydrants, and view accessibility.
Many counties using the oblique imagery have statistically measured a reduction in fire attack time of 60 to 90 seconds. This is a significant improvement, and the Marine Corps wanted to provide this advantage to their firefighters. The contract called for a firefighting implementation plan, and we had veteran Battalion Fire Chief Wayne Harper on our team to develop one. Paper reports have always left me cold, so I asked Harper, Why not deliver a functioning laptop, similar to those used by other firefighters, as a deliverable with the plan? We did exactly that, and delivered a fully functional Toughbook laptop configured with oblique imagery, GIS data, and software that could be used in fire trucks for tactical planning. This hands-on working example went further than just a paper report, and should facilitate the installation of similar capabilities on all USMC fire trucks.
Taking the Lead
Usually the Marine Corps is at the “tip of the spear” in world conflicts and combat situations, but rarely are they in the lead when it comes to technology. With this oblique imagery project, the USMC has certainly moved to the forefront with oblique imagery technology.
Although not part of the Marine Corps contract, the development work done to complete the contract underpinned potential war fighter applications. The research and testing clearly points the way to make this technology available to deployed combat units in-theater in an operational mode that could provide near-real-time imagery to ground troops. To this end, Pictometry recently signed an alliance partnership with a leading defense contractor to work on a number of related military projects.
Photos: Art Kalinski
-
GEOINT Transitions to the Future
By Art Kalinski, GISP
Attending the GEOINT 2008 conference was like drinking from a fire hose: too many superb sessions by top leaders in the field, and more than 120 exhibitors on the show floor. In a short amount of time, this community has transformed itself. Just three years ago there were many contractors offering data and imagery, but very little in the way of integration and analysis tools. This year almost all efforts were pointed toward integration, with fast evaluation and response.

Keynote speaker Retired Air Force Lt .Gen. James R. Clapper, Jr. The opening session keynote speaker was the current Undersecretary of Defense for Intelligence, retired Air Force Lt .Gen. James R. Clapper, Jr. He addressed the need for integration of intel sources and explained how difficult it is to achieve, because of security concerns about sharing data among agencies and coalition forces. He expressed apprehension about managing the flood of data — how will we sort out meaningful information from the torrent? Clapper discussed the growing uneasiness over our vulnerability to cyber attacks, and noted that new developments in biometrics make identification of terrorists easier, but complicate the ability of our forces to infiltrate hostile groups.
General Clapper then compared the Cold War, which presented us with an enemy that was static and predictable, with the irregular warfare of today. Gone is the old environment that permitted the intel community to take days to identify and evaluate threats; now we must identify threats in mere hours by observing patterns of life and individual behavior. Clapper stated that we have become very good at precise attacks, but we still have a long way to go to prevent attacks.
Integration on Display
In the exhibit hall there were countless examples of improvements to existing technology, with many efforts toward data integration. There were also a few new developments on display.

BAE Systems created a significant buzz — including strong mention by another keynote speaker, Maj. Gen. John M. Custer — with its new SOCET GXP system. The system grew out of SOCET SET and breaks down the wall between image analysis and geospatial analysis to an environment that the company calls Extreme Analysis. It combines imagery, geo data, metadata, attributes, and analysis tools into one unified package. Lockheed Martin demonstrated a very interesting capability. Starting with 3D models created by PLW with Pictometry imagery, Lockheed transforms the models with complex algorithms to reflect night-time views or varying weather conditions, with very realistic results.
Speaking of Lockheed, the aerospace company used the conference to announce that it has signed an agreement to collaborate with Pictometry. The two companies will develop next-generation visualization tools for both domestic applications and in-theater, near-real time oblique imaging and 3D model creation using manned and unmanned aircraft.
FortiusOne demonstrated its Web-based service that bridges GIS and GeoWeb services with very user-friendly tools that access a huge global database of coverage designed for non-GIS-trained users. The Web service not only permits the viewing of maps and data, it also allows viewers to add their own data. One example was flood maps that could be enhanced with local data and then saved as printed documents or PDFs.
I also saw a demonstration of Zebra Technologies’ holographic video table, which displays full-motion video as a 3D hologram similar to the still holograms that Zebra has previously developed. While viewing the holodeck-style platform, I half-expected to see Princess Leia appear and ask for help. The technology is still a long way from prime time, but it was amazing to see full-motion video as a hologram.
Getting Results
The most impressive keynote session was given by Maj. Gen. John M. Custer, Commander of the U.S. Army Intelligence Center at Ft. Huachuca. He was probably the most passionate speaker, and clearly had a sense of urgency about his mission. He heads the intel training efforts for the U.S. Army, and described how they transformed training of intel people to be as realistic as possible so that soldiers leaving the training can hit the ground running.
General Custer addresses the crowd during his keynote speech.
That’s one thing about military training that impressed me early in my career: they have to get results. You can’t pretend to get a ship under way, you have to actually do it on schedule. You can’t philosophize about getting rounds on target, you have to actually do it. Having an education background, I was completely dumbfounded when I joined the Navy and saw 19-year-old kids do more effective teaching than I had experienced in high school and college. There is no better example than the work done at Ft. Huachuca.
General Custer played a very fast-paced video showing the results; it depicted intel specialists in the field supporting their own unit under fire. They were receiving intel from many sources — satellite imagery, database from interrogations, intercepted communications, aerial imagery, down-linked video, and video from field robots in hostile fire locations — all of which were integrated and analyzed into actionable intelligence that saves lives and accomplishes the mission.
Getting there was not easy, and the General had to overcome many hurdles, including getting live data feeds so the soldiers could train on current, real-life data. Custer’s goal was to have a training environment that was absolutely indistinguishable from the actual combat environment. He indicated that all tools are moving from thick clients to thin clients and that UAVs are playing and increasing roll in the battlefield. Brigades will be working with up to 32 UAVs, with 18 of them in the air. As a result, their data centers will be dealing with petabytes of data. Custer cited an interesting statistic he developed. He observed that in each war cycle since WWII the number of troops was only 10 percent of the previous war, but the needed data bandwidth increased 100-fold.
The video was powerful, and Custer shared how he had personally presented the flag at over 25 military funerals to grieving widows and parents — a life-changing event. I can tell you from personal experience that he is absolutely correct. It’s one thing to attend a funeral of someone that has lived a long and fulfilling life. It’s totally different to see very young children standing in front of the boots and helmet, knowing that they will never know their dad who died for his brothers and to keep the rest of us safe. General Custer received the longest, strongest standing ovation that I’ve seen in years.
As I looked around at the crowd I reminded myself that these are the people that have been instrumental in preventing another major attack on this county. I was reminded of the Irish Republican Army after a thwarted bombing of 10 Downing Street. The spokesman was quoted saying that Scotland Yard was lucky this time, but the Yard will have to be lucky every time — and the IRA will only have to be lucky once. I’m hoping that with everyone’s hard work we will make our own luck.
-
Puzzling Over PDFs
By Art Kalinski, GISP
GeoPDFs have become a very valuable tool for the GIS community, but it has been a slow evolution. My first exposure to GeoPDFs came about five years ago, when I saw a new GIS map-publishing medium offered by Layton Graphics. The local Atlanta firm started out as a microfilm copy specialist, then slowly moved into digital media. While I was in the GIS shop at the Atlanta Regional Commission (ARC), I would occasionally get a visit from one of their salespeople, but they really didn’t have anything we needed.
As time progressed, Layton Graphics evolved further into digital publishing, and eventually into the Adobe Acrobat format. I continued to get an occasional visit, and I always gave them 10 minutes of my time. As the years progressed, however, I grew in age and my patience shrunk proportionately, so when I received a visit from them again in 2003 I barely gave them three minutes.
But to quote my uncle, “Eventually even a blind pig will find an acorn.” The sales rep showed me a new Layton Graphics product based on Adobe technology — and it fit a real need perfectly. For the first time, my perfunctory meeting grew into two hours as I invited more and more ARC staff members to sit in on this new product demo.
What Layton Graphics — now known as TerraGo Technologies — had created was the GeoPDF format, plus tools that manipulated the files in Adobe Reader. It was a brilliant new geospatial publishing medium. For those of you who are not familiar with TerraGo, let me explain the features that caught my attention.
For years, we published our ARC GIS data on CDs (primarily as Shapefiles) and included a copy of ArcExplorer for those users who didn’t have a GIS. The problem with providing raw GIS data to inexperienced users is that it typically resulted in cartographically poor maps, many of which were truly terrible.
ESRI’s Map Publisher partially solved that problem by permitting the creation of a GIS-based map as an MDF, which retained the original cartography of the publisher. The only problem was that the user had to download Map Reader, the MDF, and all the GIS data layers. Additionally, if there was a problem with Map Reader pointing to any of the data, the map would not print. Some of those problems were solved in later versions, but it is still not as elegant a solution as TerraGo’s: a single file viewable in Adobe Reader.
In ESRI’s ArcGIS, users create maps using the data layers, colors, and symbology of their choice. When the GeoPDF is created using TerraGo Publisher (previously known as Map2PDF), the desired “look” will be maintained, but it won’t be a dumb map; the file is actually a self-contained GIS viewing environment. Users can zoom in and out, pan, and — using the table of contents to the left of the map view — turn layers on and off. There is even a query tool that permits the display of attributes as users click on the geographic features. The map layers can be GIS vector data or background ortho imagery. All these manipulations can be performed using the ubiquitous, free Acrobat Reader from Adobe.
The thing that makes the GeoPDF so remarkable is that the GIS map layout, and all GIS data, travels as one single file: no lost or mis-pointed data! It’s foolproof for the receiver, and is very intuitive even for users not trained in GIS.
But it doesn’t end there if the receiver is willing to download TerraGo Desktop, a free collection of even more sophisticated tools. The solution, which until recently was known as the GeoPDF Toolbar, offers users the ability to publish and collaborate on the same GeoPDF file via the Internet (annotations created on the map are viewable by all linked viewers). They can also measure distance, area, and direction, and view vehicle locations if GPS tracking data is available.
This interactive collaboration capability really got my attention for homeland security and first-responder applications, especially in mutual aid situations. Just imagine creating a compact GIS project of a disaster location, then quickly sending the single GeoPDF to anyone responding, even those who are unfamiliar with the area or with GIS software. The annotations can be saved as Shapefiles, which makes the GeoPDF an ideal data collection environment.
TerraGo designed the GeoPDF format with an extensive capability to store and catalog large and complex datasets. That’s one reason why the Army Corps of Engineers has published its entire collection of world maps as GeoPDF files. The National Geospatial-Intelligence Agency is another federal user taking advantage of the format.
Discerning Differences
There has been a Kabuki dance going on between TerraGo, ESRI, and Adobe as they try not to step on each other’s intellectual-property toes. TerraGo and Adobe worked together to get GeoPDF support in Adobe Reader. Adobe and ESRI partnered to extend the ISO 3200 specifications for PDFs to include geospatial. In the meantime, TerraGo is creating GeoPDFs from ArcMap and ESRI is creating PDFs with the proposed geospatial extension to ISO 32000.
Now that TerraGo isn’t the only option anymore, the question for many of us is, What’s the difference between TerraGo’s GeoPDFs and geospatial PDFs created by ESRI software? For simple map creation, the answer is: not much. The Adobe solution and the TerraGo solution are very similar now that TerraGo has signed an alliance agreement with Adobe.
By opening the door, TerraGo hopes to reach many more users to promote the added functionality of their Desktop tools. Specifically, the added functionality enables users to perform the following tasks:
- Use drawing tools to mark up maps and collaborate between users in remote locations. The remote users don’t need GIS software or special training.
- Convert the mark-up graphics to GIS data. This makes a GeoPDF a very simple, low-cost field GIS data collection tool. There’s no need for additional GIS licenses to do simple field data collection. This same capability permits the export of the data as Shapefiles or KML files.
- Create complex linked collections of maps as map books, or combine many maps into a large mosaic.
- Retain and enable hyperlinks to other documents, files, and HTML sites.
- Display AVL (automatic vehicle locator) GPS data to show the movement of vehicles on the GeoPDF map.
In addition, according to users of both types of files, many of the common capabilities seem to be more robust and work better in the TerraGo environment. For example, there are more problems selecting attributes in an Acrobat map than in a TerraGo GeoPDF. TerraGo has had years of experience to refine its solution and create more robust, reliable tools.
The simple conclusion is that both options perform the key job of creating cartographically sound maps in a GIS viewing environment. Both are georeferenced. Both provide attribute query. Both provide the ability to turn layers on and off, pan, zoom, measure distances, and obtain coordinates. The subtle differences only become noticeable as you use both solutions. Whether you require the additional capabilities of a TerraGo GeoPDF — such as the collaboration and Shapefile creation — will ultimately depend on your needs.
-
Seeking Synergy
By Art Kalinksi, GISP
Three weeks ago, I attended the Second Annual Synergy Conference and Expo in southern Florida. The operations and intelligence conference was organized by Nancy Wheeler and Brigadier General Billy Bingham, USAF (Ret). Although both are retired from intel, they continue to work in the community through their support of the Government Emerging Technology Alliance and the conference co-sponsor, the United States Strategic Command (USSTRATCOM).
The conference was very well organized and was a superb opportunity for civilians, contractors, and all ranks of military personnel to interact freely. Junior enlisted personnel, such as Air Force Sergeant Barrett and Senior Airman Roach, who had hands-on Predator image analysis experience, were given as much attention as their senior counterparts.
I’m writing this column not as a knowledgeable intel guy, but rather as an intel outsider with a GIS focus. Although I served 20 years in the Navy, my experience with the Navy intel community was very limited. The “spooks,” as we called them, were usually cloistered behind cipher-lock security doors in rooms that were impervious to electronic spying, where disruptive background music thwarted any eavesdropping. Occasionally, someone reminiscent of the Wizard of Oz door guard would open a security window and pass us a scrap of classified paper telling us to do something or sharing some very limited information. We “ops pukes” would then act on the intelligence, sometimes blindly depending on the source. At the time, that was the model common to all branches of the military, with its origins going back to Napoleon’s army.
At Synergy, I learned that the old Napoleonic model is changing dramatically; the conference title confirmed the evolution in thinking and action. Synergy refers to the merging of Operations and Intelligence divisions, and is spurred by changing operational needs — specifically, the increasing need for speed. According to General Bingham, gone is the time when operational forces reacted to intelligence within days. Now, even a reaction time of hours is not good enough; instead, it must be measured in minutes. Additionally, many of the operational forces are also major intelligence collectors.
In the old days, the need for security trumped the need for fast response. Information was secured through multiple layers of security and compartmentalization. Even if there was a bad apple who leaked information, very few individuals possessed enough information to cause serious damage.
Today, that model is changing because of the rapid changes to the operational situation. However, much of our satellite imagery, sources, and methods are still carefully protected, with limited access by our operational forces. That’s the key reason I joined my current employer: to get very high-resolution, but unclassified, oblique imagery into the hands of our operational ground troops quickly. (In fact, I attended the conference because Pictometry will be an exhibitor next year, partnering with Lockheed Martin to install oblique imagery cameras on the Predator and perhaps the Osprey.)
The keynote speaker, Lt. General Mark Owen of USSTRATCOM, discussed the evolution of the command’s mission. Historically, USSTRATCOM was primarily involved in strategic nuclear deterrence, but its mission has been extended to cover all WMDs, space warfare, and cyberspace.
Colonel Stuart Maberry, USAF, addressed the problems associated with irregular warfare. His presentation reminded me of a visionary Naval War College Review article written back in 1989 by CDR Steven Rose that described the array of threats we would face, including chemical weapons, biological attacks, and even nano-technology. Rose mused that one day we might long for the “good old days” when all we had to worry about were nuclear weapons. I can relate to that, having served in sensitive weapons assignments. Nuclear weapons require significant technical skill and ongoing maintenance if one hopes to achieve nuclear yields, as opposed to just a dirty bomb. The other dubious upside of a nuclear attack is that you know that you’ve been attacked, as well as when and where. This information may then point to the attacker.
That may not be the case with cyber, chemical, and biological attacks that could seem like accidents or natural outbreaks. Add to that the relative simplicity of creation and delivery, and the fact that some of our enemies have no concern for collateral damage — or even their own lives — and the problem gets very serious. The only effective defense seems to be very good intelligence and constant vigilance.
Major General Michael Ennis USMC of the CIA discussed current intelligence efforts, with a focus on human intelligence collection. It was interesting to note how valuable he considered open-source information as a way of confirming intel collected from other sources. He indicated that Internet blogs and Web sites, because of their numbers, are sometimes a superior source of information. He also expressed concern over the chasm between the ops and intel groups, and the walls that still exist between domestic and overseas collection, as well as the cultural differences between military and homeland agencies (such as the ATF and FBI).
The vendor expo section had a strong focus on data management and data mining; countless products addressed the complexity of managing a flood of data. I observed numerous products and services that were not easily understandable. In many cases I couldn’t tell if I was looking at vaporware or I just wasn’t smart enough to understand that I was looking at a marvelous new development. After talking to some attendees, I suspect that it was a little of both.
Of course homeland security agencies, all the military branches, and the intelligence community are big users of GIS technology, so one would expect ESRI to be an exhibitor. Indeed, ESRI had a booth demonstrating ArcGIS and ArcGIS-related products, including custom applications, but I didn’t see anything new other than some statistical analysis packages and discussions about Image Server. Spatial Analyst seems to be more important to the intel community than to most other GIS users I’ve seen, who are more involved in cataloging than analysis.
ERDAS demonstrated its wide array of GIS data and image processing software, including the universal data translator TITAN. Adobe demonstrated its geo-referenced PDF maps, as well as publishing and collaboration tools. In the coming weeks I’m going to learn about (and report on) the differences between PDFs and the capabilities of TerraGo Technologies’ GeoPDFs.
Zebra Imaging showed examples of its 3D holograms of buildings and neighborhoods. Although they looked very impressive, it was difficult to assess the benefit holograms offer over other visualization tools. I believe that we are still early in the life cycle of this promising technology, and I look forward to seeing how it will evolve.
In one of the closing plenary sessions, LTC Casey Carey discussed the Sons of Iraq program, which (along with the surge) changed the entire dynamic in that country. By enhancing community relations and bringing Iraqis into the fold, intelligence gathering and the effectiveness of all coalition forces was greatly improved. This was a complex effort that required imaginative thinking. Life was simple when all we asked the military to do was kill people and break stuff. Now they also have to be military tacticians, spies, intelligence analysts, public works engineers, economic developers, diplomats, and even social workers. As if that isn’t enough, most of them are very young, without the benefit of college degrees or years of experience.
As part of a panel discussion on mega-trends, Bob Gourley of Crucial Point, LLC, talked about the convergence of PCs and cell phones; there will be more than 6 billion G3-type phones in use worldwide by 2014. Add to that the changing rules governing domestic origins of calls, and we have a very daunting surveillance task. The panel also discussed In-Q-Tel, the nonprofit incubator for CIA support companies. One of In-Q-Tel’s success stories was the creation of Keyhole, which was later acquired by Google as Google Earth.
There are three themes of the conference that I can’t overemphasize. First of all, GIS and related image processing software, along with data mining software, are growing in importance as the environment of the intelligence community grows increasingly sophisticated and complex. Second, there are many more people, military and civilian, involved in this work than the average person would imagine. Third, if you know any new graduates with GIS or computer science backgrounds, let them know that there are some very interesting career opportunities in the intel communities — the work is serious and significantly more interesting than printing road maps or maintaining a parcel tax map.
My hat is off to the legions of military and civilian workers that are currently operating to keep us safe. They need all the support we can provide, and I hope our leaders keep politics out of these profoundly important issues. My overarching impression is that we have a lot of very smart military and civilian people spending countless hours to protect our interests. It’s very hard work in a constantly changing environment of one-upmanship. The classic Mad Magazine Spy vs. Spy cartoon serves as a good analogy, and I saw the cartoon included in several presentations. The difference is that the stakes are very high, and the results of failure not funny.
-
BIM, Son of CAD and GIS
By Art Kalinski, GISP
For those of you who haven’t been looking over the cubicle wall, there is a quiet revolution occurring in the CAD world that is affecting the GIS community. That revolution is BIM (building information modeling). BIM was developed in the mid-90s by the American Institute of Architects (AIA) to bring building design into the 21st century, but BIM is much more than just a building design model. Very simply put, it combines the best capabilities of CAD software with the best capabilities of GIS in a 3D environment.
For years, many designers understood that the primary limitation of CAD software is that CAD drawings consist of points, lines, and polygons, with no topology and no link to a database — just object ID numbers. CAD traditionally focused on the quality and detail of the drawing, with a strong focus on 3D visualizations.
Conversely, GIS is a topological model of points, lines, and polygons that’s linked to a database. Because of topology, a GIS understands relationships and can perform analyses such as what object is next to another, what object is within another, and what object intersects another, and display the results graphically or within the linked database.
CAD drawings can look very good, because the software was designed to that end. GIS also draws points, lines, and polygons, but the tools were not designed to do sophisticated renderings. The best analogy I can think of is Microsoft Office. You could draft a letter in Excel, but it would be awkward and probably not look as good as one prepared in Word. Likewise, you could create a spreadsheet-style document in Word, but it wouldn’t have all the mathematical functionality of an Excel spreadsheet.
Family Factions
The CAD and GIS communities have, for the most part, lived separate lives, even in my own family. For years, while I was the GIS manager of the Atlanta Regional Commission (ARC), I taught ArcView classes. I offered to teach my son and daughter this entry-level GIS so they would have one more tool to put on their resume, but neither was interested in “that GIS stuff.” My son Alex was an electrical engineering major, and he learned CAD software as part of his program. Two years ago he received an internship with CH2MHILL doing CAD work. After he graduated, CH2MHILL grabbed him full-time, and he continued working on electrical design projects.
Six months ago I was chatting with Alex about his new job and budding career. He was excited, explaining that he was now doing much more sophisticated work. He described a new software program that permitted him to link the elements of CAD drawings with a database that could then be searched spatially or through the database. With a tilt of my head I asked, “Do you realize that you’ve just perfectly described a GIS?” He said, with a look of revelation, “Is that what you’ve been doing all these years!” We both laughed, realizing that — unknowingly — the apple didn’t fall too far from the tree.
My son “gets it” and understands the broad capability of BIM, but he’s in the minority. If you read some of the CAD blogs regarding BIM, most CAD people don’t get it yet. Many still view BIM as just a new kind of 3D model and miss the entire concept of topology and linked databases. This presents a huge opportunity for GIS professionals, since you already understand and have been performing spatial analysis in this topological environment.

BIM of a Pantex Plant during initial design phase. Note building components, conduit, piping. Image courtesy of CH2MHILL. 
Images courtesy of CH2MHILL. 
BIM showing complex system of piping, ventilation, electrical and other building and equipment components. Courtesy of CH2MHILL, Atlanta, GA. John Przybyla of Woolpert, who has worked in both disciplines for years, cautions us GIS people not to underestimate or downplay CAD projects. He used a simple wall as an example. In a GIS a wall may be represented as one or two lines, but the detailed CAD drawing could contain more than six layers of data: paint, drywall, framing, blocking, fire stops, insulation, etc. So there will be a learning process on both sides as we evolve. On the other hand, Przybyla wishes that GIS had more robust 3D modeling.
Putting BIM to Work
The 500-pound gorilla in BIM software is Autodesk’s Revit. Bentley BIM and Oracle are big players, and ESRI is working hard to be a contender in the BIM environment too. At the ESRI International User Conference, the plenary session included a demo of work being done at M.I.T. Michael Parkin demonstrated a 3D GIS model of the Cambridge campus that he created. Using the model, he was able to spatially identify by horizontal and vertical location each laboratory that was sensitive to noise and vibration. Parkin then created an intersecting 3D sphere of influence that would result from a planned construction project. This would help campus officials minimize the interference by changing schedules, or even moving some labs.
Parkin also mapped, in 3D space, the location of campus parking spots and of the offices of assigned users. This helped the school assign spots closer to the users’ workplaces — something of a 3D trade area analysis for parking garage customers. Also at the conference were numerous presentations on building models and facility management (FM), even though most were not using the term BIM. ESRI has a team of people dedicated to all aspects of BIM, headed by Matt Davis of the Boston regional office and John Young of the Charlotte office. Both are good points of contact regarding BIM and GIS.
We must all understand that BIM is much bigger than just building models. The AIA designed BIM as a full life cycle management tool that captures and uses the continuous stream of data, from construction to day-to-day operations to ultimate demolition. It’s the in-between area that will affect so many more users than just architects and builders. That wealth of data will be a boon to new users who will also add to the database.
David Fouche of CH2MHILL worked on the development of early BIM software such as Bentley MicroStation and TriForma, as well as the more current Bentley BIM. He indicated that there is still much confusion and jockeying for position. He stated that use of BIM in design work is a given, but there is still much discussion as to where BIM will fit into the big picture of building life cycle management. Fouche indicated that when one considers the total cost of a facility, roughly 0.5 percent goes into design, 10 percent goes into construction, and the remaining cost is in life cycle management. Obviously there is a huge potential for efficiency and savings with the proper application of BIM tools.
Fouche also mentioned that complex facilities such as oil refineries and other processing plants have been using BIM-like models for years, combining CAD and GIS tools to manage the facilities in a 3D model. GIS software such as Network Analyst is a natural for this kind of work. I remember seeing a poster at an ESRI User Conference years ago that showed the human circulatory system built with ArcView and Network Analyst. This was an eye opener, and I thought to myself, “Of course — a network is a network whether it’s a highway, oil pipes, or the blood supply system.”
I remember that when ARC moved into a new facility in 2000, we took the building CAD drawings and brought them into ArcView 3.3. We then attached attributes to each room, including the occupant, furniture, computers, phone/data ports, etc. We then used ArcView to manage our facility, including the allocation of square footage to each department.
One Step Forward, Two Steps Back
Large FM companies like ARCHIBUS, Woolpert, and Penobscot Bay Media “get it,” and have a foot in both the CAD and GIS communities. All were exhibitors and heavy participants at the ESRI User Conference this year. They see where the world is evolving and plan on being there.
But all is not rosy. On the federal side, the Army Corps of Engineers (ACE) is involved with BIM in a big way, but has changed the name of its CADD/GIS Technology Center to the CAD/BIM Technology Center. (Some of us GIS people look at that as one step forward and two steps back.) Looking at the ACE CAD/BIM Web site, I was surprised by how little attention is devoted to GIS and spatial analysis tools. The majority of material seems focused on BIM and CAD drawings, with little or no mention of GIS and spatial analysis. (We GISPs have a lot of educating to do.)
ACE is working with all DOD agencies to establish standards and common data formats for BIM. A recent posting by ACE staff indicates that many military construction projects will require BIM models as a project deliverable. Most believe that BIM will become a nationwide federal requirement soon.
Keep in mind that BIM models are spatially searchable or database-searchable 3D models, not just pretty 3D renderings. Again, think of CAD drawings combined with GIS spatial capability in a 3D model. As one considers the potential uses, including links to traditional GIS tasks and even temporal models, the list grows significantly. Some are already using BIM models with traditional GIS for energy management based on interior usage and building loading, measurement of water runoff and impermeable surfaces, and even links to transportation demand models and visualizations.

An example of lifecycle management using GIS and BIMs. This shows Carbon Monoxide concentrations in one floor of a building. Courtesy of Penobscot Bay Media, New York. The application of BIM models that could be especially critical is their potential use by first responders. Currently most fire departments maintain pre-plan data in the form of building blueprints and large paper ledgers that list hazardous materials, fire hose connections, etc. Imagine firefighters accessing BIM models that were created when a building was designed and updated throughout the life of a building. Additionally, picture how quickly they could view the complex systems as interactive 3D models, especially if they were presented as oblique views.

A map of hazardous materials inside a building, including both location and description for emergency responders. Image courtesy of George MacBeth and Brad Peterson of ARCHIBUS, Inc. It was interesting to note that CH2MHILL also used 3D PDFs as a quick way of sharing the models with many staff members. This proved to be a valuable collaboration tool and way to get input from many designers involved in the project. Some users are even enhancing the BIM models with photo-accurate surfaces or photo-accurate 3D models.

A photo-accurate Precision Light Works 3D model using Pictometry oblique imagery. Image courtesy of Precision Light Works and Pictometry International. The playing field is still very unsettled, with many groups pushing their own data standards, approaches, and naming conventions. The names BIM, CAD, and GIS could evolve, but the basic functionality will still be there and smell just as sweet. BIM is here to stay, along with its parents CAD and GIS. Look for BIM to become a requirement — and a huge opportunity — in your future work.
-
TITAN: The Geospatial Babel Fish
About 10 years ago PBS aired a very funny science fiction comedy called The Hitchhiker’s Guide to the Galaxy, written by Douglas Adams. The serial radio programs, which originated in Great Britain, were about two characters who traveled the universe by bumming rides on spacecraft. One curiosity highlighted in the second episode was the Tower of Babel-inspired “Babel fish,” which was described as (spoken with an authoritative British accent):
Small, yellow, and leech-like, and probably the oddest thing in the Universe. It feeds on brainwave energy received not from its own carrier but from those around it. It absorbs all unconscious mental frequencies from this brainwave energy to nourish itself with. It then excretes into the mind of its carrier a telepathic matrix formed by combining the conscious thought frequencies with nerve signals picked up from the speech centers of the brain which has supplied them. The practical upshot of all this is that if you stick a Babel fish in your ear you can instantly understand anything said to you in any form of language.
We’ve all been looking for a Babel fish for geospatial data. In the early years of GIS, sharing data was very painful. The most glaring difficulty was the issue of projections. You had to know the datum and projection the data were created in and modify it — or your GIS environment — to match. More recently, thanks to that uncomfortable word “metadata” and more advanced GIS software such as ArcGIS, users were able to import GIS data and re-project it on the fly.
This was a much easier method, but still messy on occasion. ArcGIS opened the door to importing and sharing spatial data across networks, and even the Web. You could actually create GIS projects that accessed data layers from remote servers and sources, ensuring that you had the latest version every time you opened a project. But this was still an environment for GIS professionals and not easy to do.
Recently, Google Earth changed the picture by creating a very easy-to-use spatial viewing environment. This really opened the eyes of the world and introduced non-GIS people to the world of spatial data. The Google environment was simple to understand, but somewhat limited to viewing spatial data and imagery with no real spatial analysis capability. It was especially good at organizing spatial data for visualization.
ESRI soon followed, offering a more robust viewer that could be best described as a professional version of Google Earth with spatial analysis capability. However, one still had to suffer through the zoom-in globe. As good as life became with both Google Earth and ArcExplorer, there was still room for improvement. Then, several months ago, I saw a demonstration of ERDAS TITAN (formerly known as Leica TITAN).
TITAN takes spatial data sharing, viewing, and publishing to a new level. It seems to magically ingest almost any spatial data format, read it, use it, and publish it back out in any format — and do so quickly. It does for spatial data what the Babel fish did for language and speech. A universal translator designed for sharing and the sharing environment is completely controllable via permissions, so you don’t lose data ownership. TITAN delivers data via geospatial Web services, such as Web Map Services (WMS), permitting you to view spatial data without actually getting access to the source dataset.
Most early adopters seem to be data providers and emergency response organizations, because this new globe solves their most critical problem: publishing data with permissions while retaining digital ownership rights (data providers) and ingesting, organizing, and using spatial data from many disparate sources very quickly (emergency management). With TITAN, emergency management organizations and workers have ready access to real-time data appropriate for situational awareness and response management. Communication using chat and collaboration via 3D interactive presentations is easily implemented for disaster participants. Key decision-makers have access to the same common operational picture with up-to-date information.
The datasets are searchable, accessible, and viewable by a broad spectrum of disaster workers using a broad array of applications. Data creators can publish geo-products with permissions from the field for direct and rapid delivery without format translation problems. Licensed data is controlled with participants accessing current content as well as historic and pre-disaster data.

A screenshot of the TITAN environment, showing the Geospatial Instant Messenger chat window. Image courtesy of ERDAS. 
Amy Zeller of ERDAS shared some of the features and applications of TITAN, specifically:
- TITAN is a scalable, dynamic, rapidly deployable, online, real-time data sharing solution, supporting data publishing and delivery into many geospatial applications.
- TITAN enables “real-time” shared viewing of a common operating picture vital to effective communication during an emergency response.
- Users can create and share a “MyWorld,” a geographically enabled space to upload data, set permissions, and share content with other network users. This “geospatial presentation space” means sharing crucial geospatial data, notations, images, and other location-based content in a collaborative, interactive 3D space with thousands of users across the globe. This feature, plus instant messenger chat, enables real-time, effective communication and collaboration among disaster participants within a common operational picture.
- By using TITAN, authors of data become servers of data, publishing geo-products immediately with permissions and from the field.
- Data publishing is facilitated while digital ownership rights are protected. TITAN enables ingestion of data in various file formats and delivers data via different means, including geospatial Web services (e.g., WMS), which means that only a portrayal of the data is distributed and the data owner still has full control over the actual dataset.
- Data consumers can rapidly pull data from unlimited public and private sources, directly into a variety of applications including Google Earth, Microsoft Virtual Earth, ERDAS IMAGINE, ArcMap, ArcGIS Explorer, MapInfo, GeoMedia, and AutoCad.
- TITAN is interoperable and can be used in conjunction with static, centralized data stores and solutions — but it does not need to rely only on static, centralized data stores!
- A TITAN GeoHub enables internal and external permission-based data distribution for disaster management. With a GeoHub, stakeholders can rapidly be enabled to participate in publishing and consuming data. A GeoHub is ideal for implementation at a local government operations center or state EOC, yet flexible and sturdy enough to be set up and configured quickly and run from a field office.
- The TITAN solution is a scalable solution and provides support for large numbers of users over a broad geography.
- Users can connect to ERDAS TITAN via a cell phone, aircard, and laptop.
You may remember that my February article was about Virtual Alabama, which is a Google-based state emergency response spatial visual collaboration environment. Virtual Alabama has received national interest, and the evolution of VA will be a plenary session topic at the DOJ, DHS, and DOD-sponsored Critical Incident Preparedness Conference in October. Virtual Alabama was the first application that came to mind when I saw the potential of TITAN. In addition to enabling access to current, rapidly developing content in disaster situations, TITAN ties into historic and pre-disaster data and content that is already made available via various data management and delivery solutions.
This entire data sharing and delivery environment is very complex, with connectivity issues, security concerns, and nuances of performance. I know that there are many software products and custom applications that accomplish what TITAN does, but I haven’t seen an off-the-shelf product that matches TITAN’s capability. Let me know if you have seen one, so I can share it with our readers. In the meantime, TITAN deserves a serious look.


