The United States Geospatial Intelligence Foundation (USGIF) is now accepting applications for its 2015 Scholarship Program. The program assists promising students pursuing the geospatial sciences with scholarship awards to further the advancement of the geospatial intelligence tradecraft.
In 2014, $101,000 in scholarships was awarded to 22 recipients. Since 2004 when the scholarship program began, $792,000 in scholarships has been awarded to more than 170 students.
“The USGIF Scholarship Program is open to students with innovative ideas for advancing the use of geospatial science, data, and technology to solve human security challenges such as conflict, natural disaster, emergency response, public safety, health, the environment, transportation, and more,” said Maxwell Baber, USGIF’s director of academic programs. “We accept applicants from any discipline focused on human-scale activity and the human-environment interface.”
Graduating high school seniors, undergraduate, graduate, and doctoral students studying geospatial intelligence, geography, political science, computer science, biology, anthropology, and any other field in the natural and social sciences are encouraged to apply. Applications can be found at USGIF’s website and are due no later than April 20.
USGIF is a nonprofit educational foundation dedicated to promoting the geospatial intelligence tradecraft and developing a stronger GEOINT Community with government, industry, academia, professional organizations, and individuals who develop and apply geospatial intelligence to address national security challenges. USGIF’s mission is to build the community, advance the tradecraft, and accelerate innovation.
For more information on the USGIF Scholarship Program or to read about past USGIF scholarship recipients, visit usgif.org/education/scholarships.
Trimble introduced several new products at InterGeo 2014, being held this week in Berlin, with a focus on incorporating data from photographs and imagery into geospatial databases.
Trimble also offered an expanded GNSS portfolio for surveyors that includes the Trimble NetR9 Geospatial receiver; the Trimble Geo7X with Trimble Access field software onboard; and enhanced Trimble xFill functionality that provides continuous RTK level accuracy when paired with a Trimble CenterPoint RTX subscription. The new additions offer surveyors more flexibility in the field to meet a variety of work requirements. Learn more here.
Photo: Trimble
Inpho version 6.0. Trimble announced a new version of its photogrammetric software suite, which provides highly automated workflows for photogrammetry and remote sensing professionals so they can process thousands of airborne images with high precision. Inpho version 6.0 increases efficiency by reducing project turnaround times and improves the quality of deliverables via new automated and interactive tools and satellite triangulation functionality.
A new satellite triangulation function in Inpho version 6.0 allows professionals to quickly generate deliverables from satellite imagery data and expand their capabilities, addressing the needs of industries such as environmental, forestry, agriculture and land management. Automatic tie point extraction and bundle block adjustment provides improved orientation of satellite images. The highly automated process results in a significant reduction in office processing time so projects can be delivered with quality precision in a shorter turnaround time.
Photo: Trimble
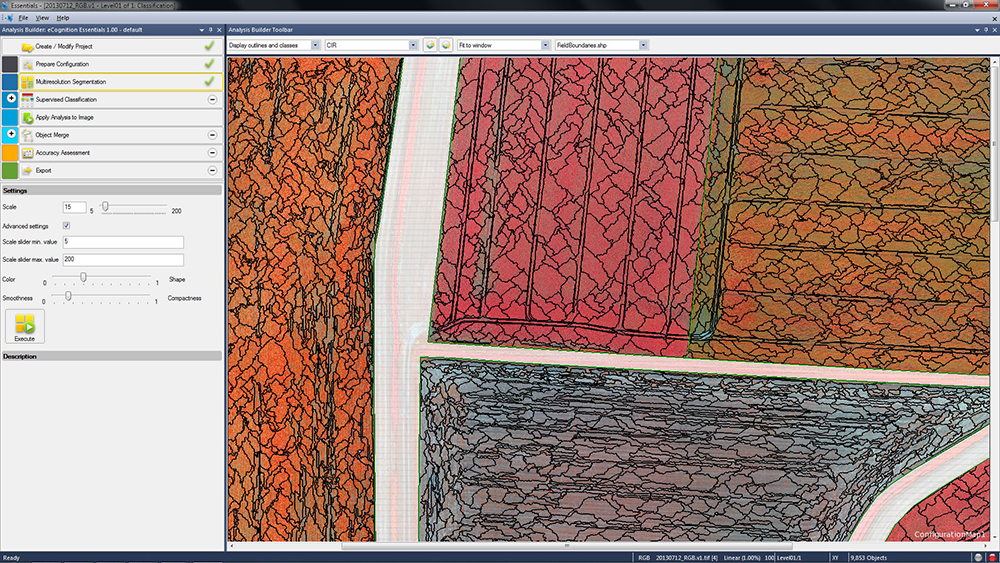
eCognition Essentials. eCognition Essentials is a new software solution for geospatial and remote sensing professionals performing land-cover mapping tasks using satellite imagery. eCognition Essentials offers an intuitive image analysis solution that allows users of all levels to quickly produce high-quality, Geographic Information System (GIS)-ready deliverables.
Leveraging core eCognition software technology, eCognition Essentials is easy to use with its simplified and intuitive interface. eCognition Essentials reduces analysis error as it applies predefined and structured rules to analyze and transform imagery data into relevant geospatial information. The new automated image analysis functions — such as image segmentation or sample-based classification — combined with a set of interactive tools for quality control offer users a streamlined workflow for quicker project turnaround times.
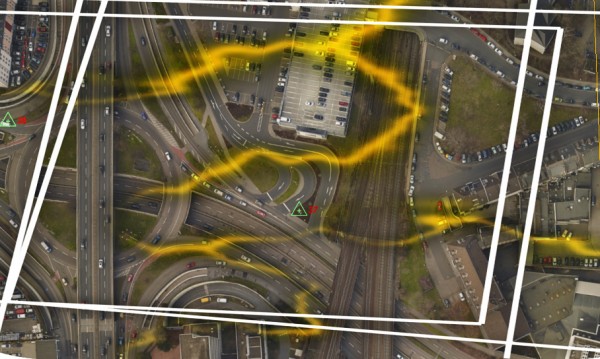
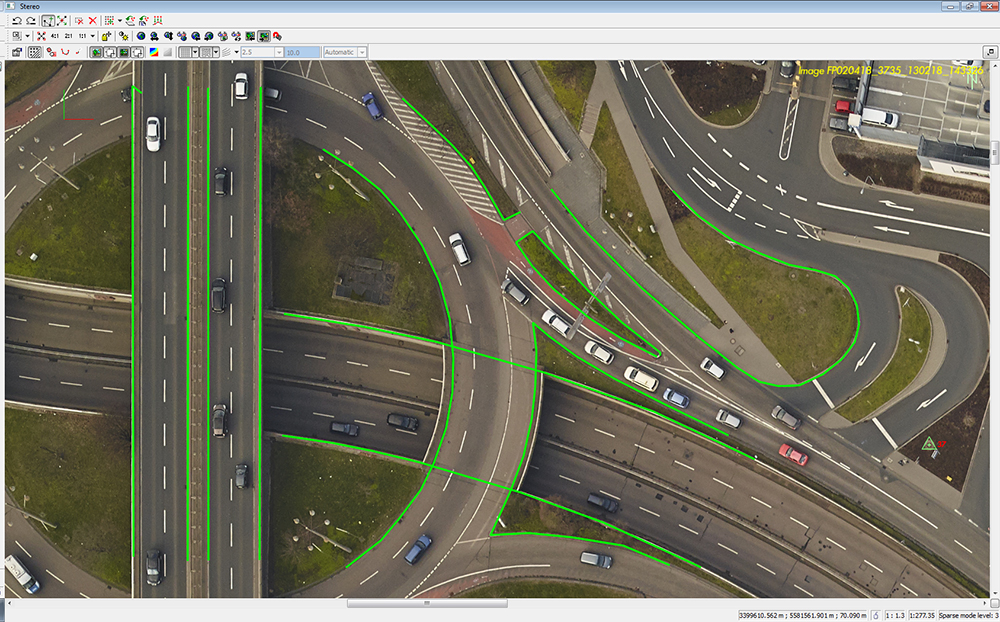
Trident version 7.0 is a new version of the mobile data analysis software designed to efficiently manage, interpret and extract features from digital images and point cloud data collected via land mobile systems. Enhancements in the new version significantly reduce the time required for geospatial professionals to transform land mobile sensor data into relevant geospatial information used in civil engineering, transportation and GIS mapping. In these applications, Trimble Trident can be used for surface modeling, roadway sign and pole detection, lane marking detection, edge and breakline detection, road geometry and clearance measurements.
Trident version 7.0 offers increased automation functionality to deliver results more quickly. Updated feature extraction tools within the software provide greater reliability and minimize manual editing and verification. Trident version 7.0 breakline detection routines now include a cross-sectional workflow for rapid and progressive development of supervised roadway breakline models.
Photo: Trimble
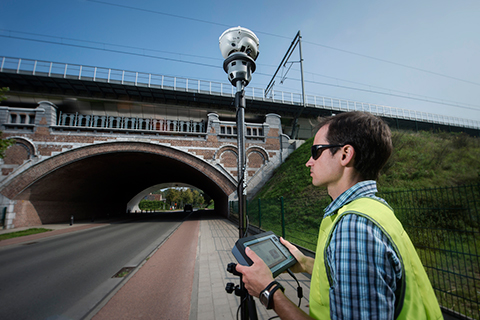
Trimble V10 Imaging Rover. The Trimble V10 is an integrated camera system that precisely captures 360-degree digital panoramic images for visual documentation and measurement of the surrounding environment. Enhancements include additional integration options and high-dynamic range (HDR) imagery. The Trimble V10 offers an accessible and efficient means of visually documenting site conditions to perform measurements in the office, produce more powerful deliverables and speed up decision making for managers on or off the site.
In addition to the R10 GNSS receiver, the Trimble V10 Imaging Rover now seamlessly integrates with Trimble’s R-Series GNSS receivers — the Trimble R8, R6 and R4 — and TSC3 controller. Through this seamless integration, geospatial professionals can easily capture high-quality, geo-referenced panoramic images to document the surroundings. Now more Trimble customers can take advantage of the Trimble V10’s powerful capabilities. In addition, a new two-piece power rod option enables easy transportation of the Trimble V10.
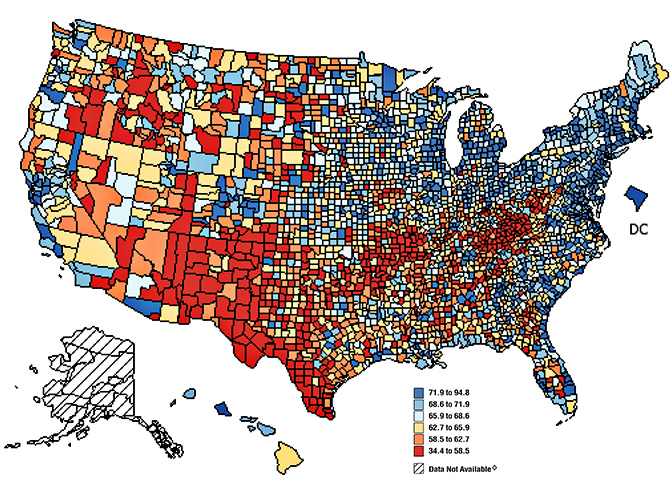
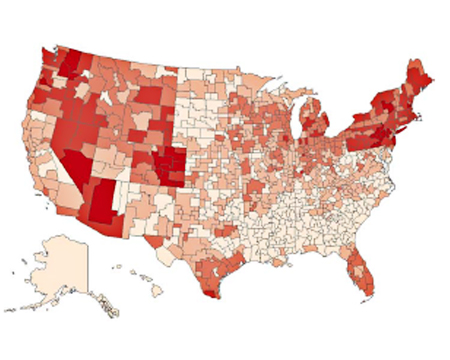
Figure 1. Mammograms in last two years; percent of respondents, by counties.
Trends Discerned in the National Cancer Institute’s Geospatial Databases Carry the Fight Forward
Location matters in cancer, as in many other things. The National Cancer Institute (NCI) recognized this fact more than 40 years ago, and its researchers have been investigating striking geographic differences in many cancers ever since. Most studies have found that these differences were due to lifestyle differences, such as levels of smoking and diet, although research into possible environmental causes are hampered by a lack of exposure data during the relevant period, 20–30 years prior to diagnosis.
Geospatial tools serve NCI in a variety of applications, including:
the identification and display of the geographic patterns of cancer incidence and mortality rates in the U.S. and their change over time,
the creation of complex databases for the study of cancer screening, diagnosis, and survival at the community level,
environmental exposure assessment through satellite imagery,
spatial statistical models to estimate cancer incidence, prevalence, and survival for every U.S. state,
communication of local cancer information to the public and public health professionals through interactive web-based tools,
the identification of health disparities at the local level through the comparison of cancer outcomes across demographic subgroups, and
development of new methods of displaying geospatial data for clear communication to the public and for examination of complex multivariate data by researchers.
Division of Cancer Control and Population Sciences
The Epidemiology and Genomics Research Program (EGRP) and the Surveillance Research Program (SRP) support grant research to use GIS in cancer research and the development of methodologies to accomplish this research. EGRP also funded the development and maintenance of a geographic information system for breast-cancer studies on Long Island (LI GIS). The LI GIS is available to researchers and can be used to study other types of cancer and conditions as well.
Surveillance Research Program
The Statistical Methodology and Applications Branch (SMAB) contributes to GIS research by developing statistical methods for the analysis, display, and web-based communication of geo-referenced cancer data.
The Surveillance Systems Branch (SSB) oversees the Surveillance, Epidemiology, and End Results (SEER) program, an integrated, comprehensive, multiple population-based reporting system of cancer registries covering 26% of the U.S. population. Cancer incidence information is provided at the state, county, and census-tract level. Investigators in SEER’s Rapid Response Surveillance Studies (RRSS) are exploring and applying GIS technology in several areas.
Division of Cancer Epidemiology and Genetics
The Epidemiology and Biostatistics Program (EBP) has a long history of publishing the NCI cancer atlases.
The Occupational and Environmental Epidemiology Branch (OEEB) has an active research program in using satellite imagery to estimate the potential exposure to cancer-causing environmental agents by individuals living in agricultural areas.
As to the finer granularity customarily seen in GIS databases by professionals using them in mapping, natural resource and asset management, utilities, and other sectors, researcher Linda Pickle of Pennsyslvania State University and StatNet Consulting comments:
“The SEER program at NCI does get the census-tract identification from the registries, but you have to get permission to use it. Mortality is only reported to NCHS at the county level. Therefore, all nationwide maps of cancer rates (incidence or mortality) must be at the geographic level available for all states, that is, county. Each state has the option to present its own data at smaller levels.
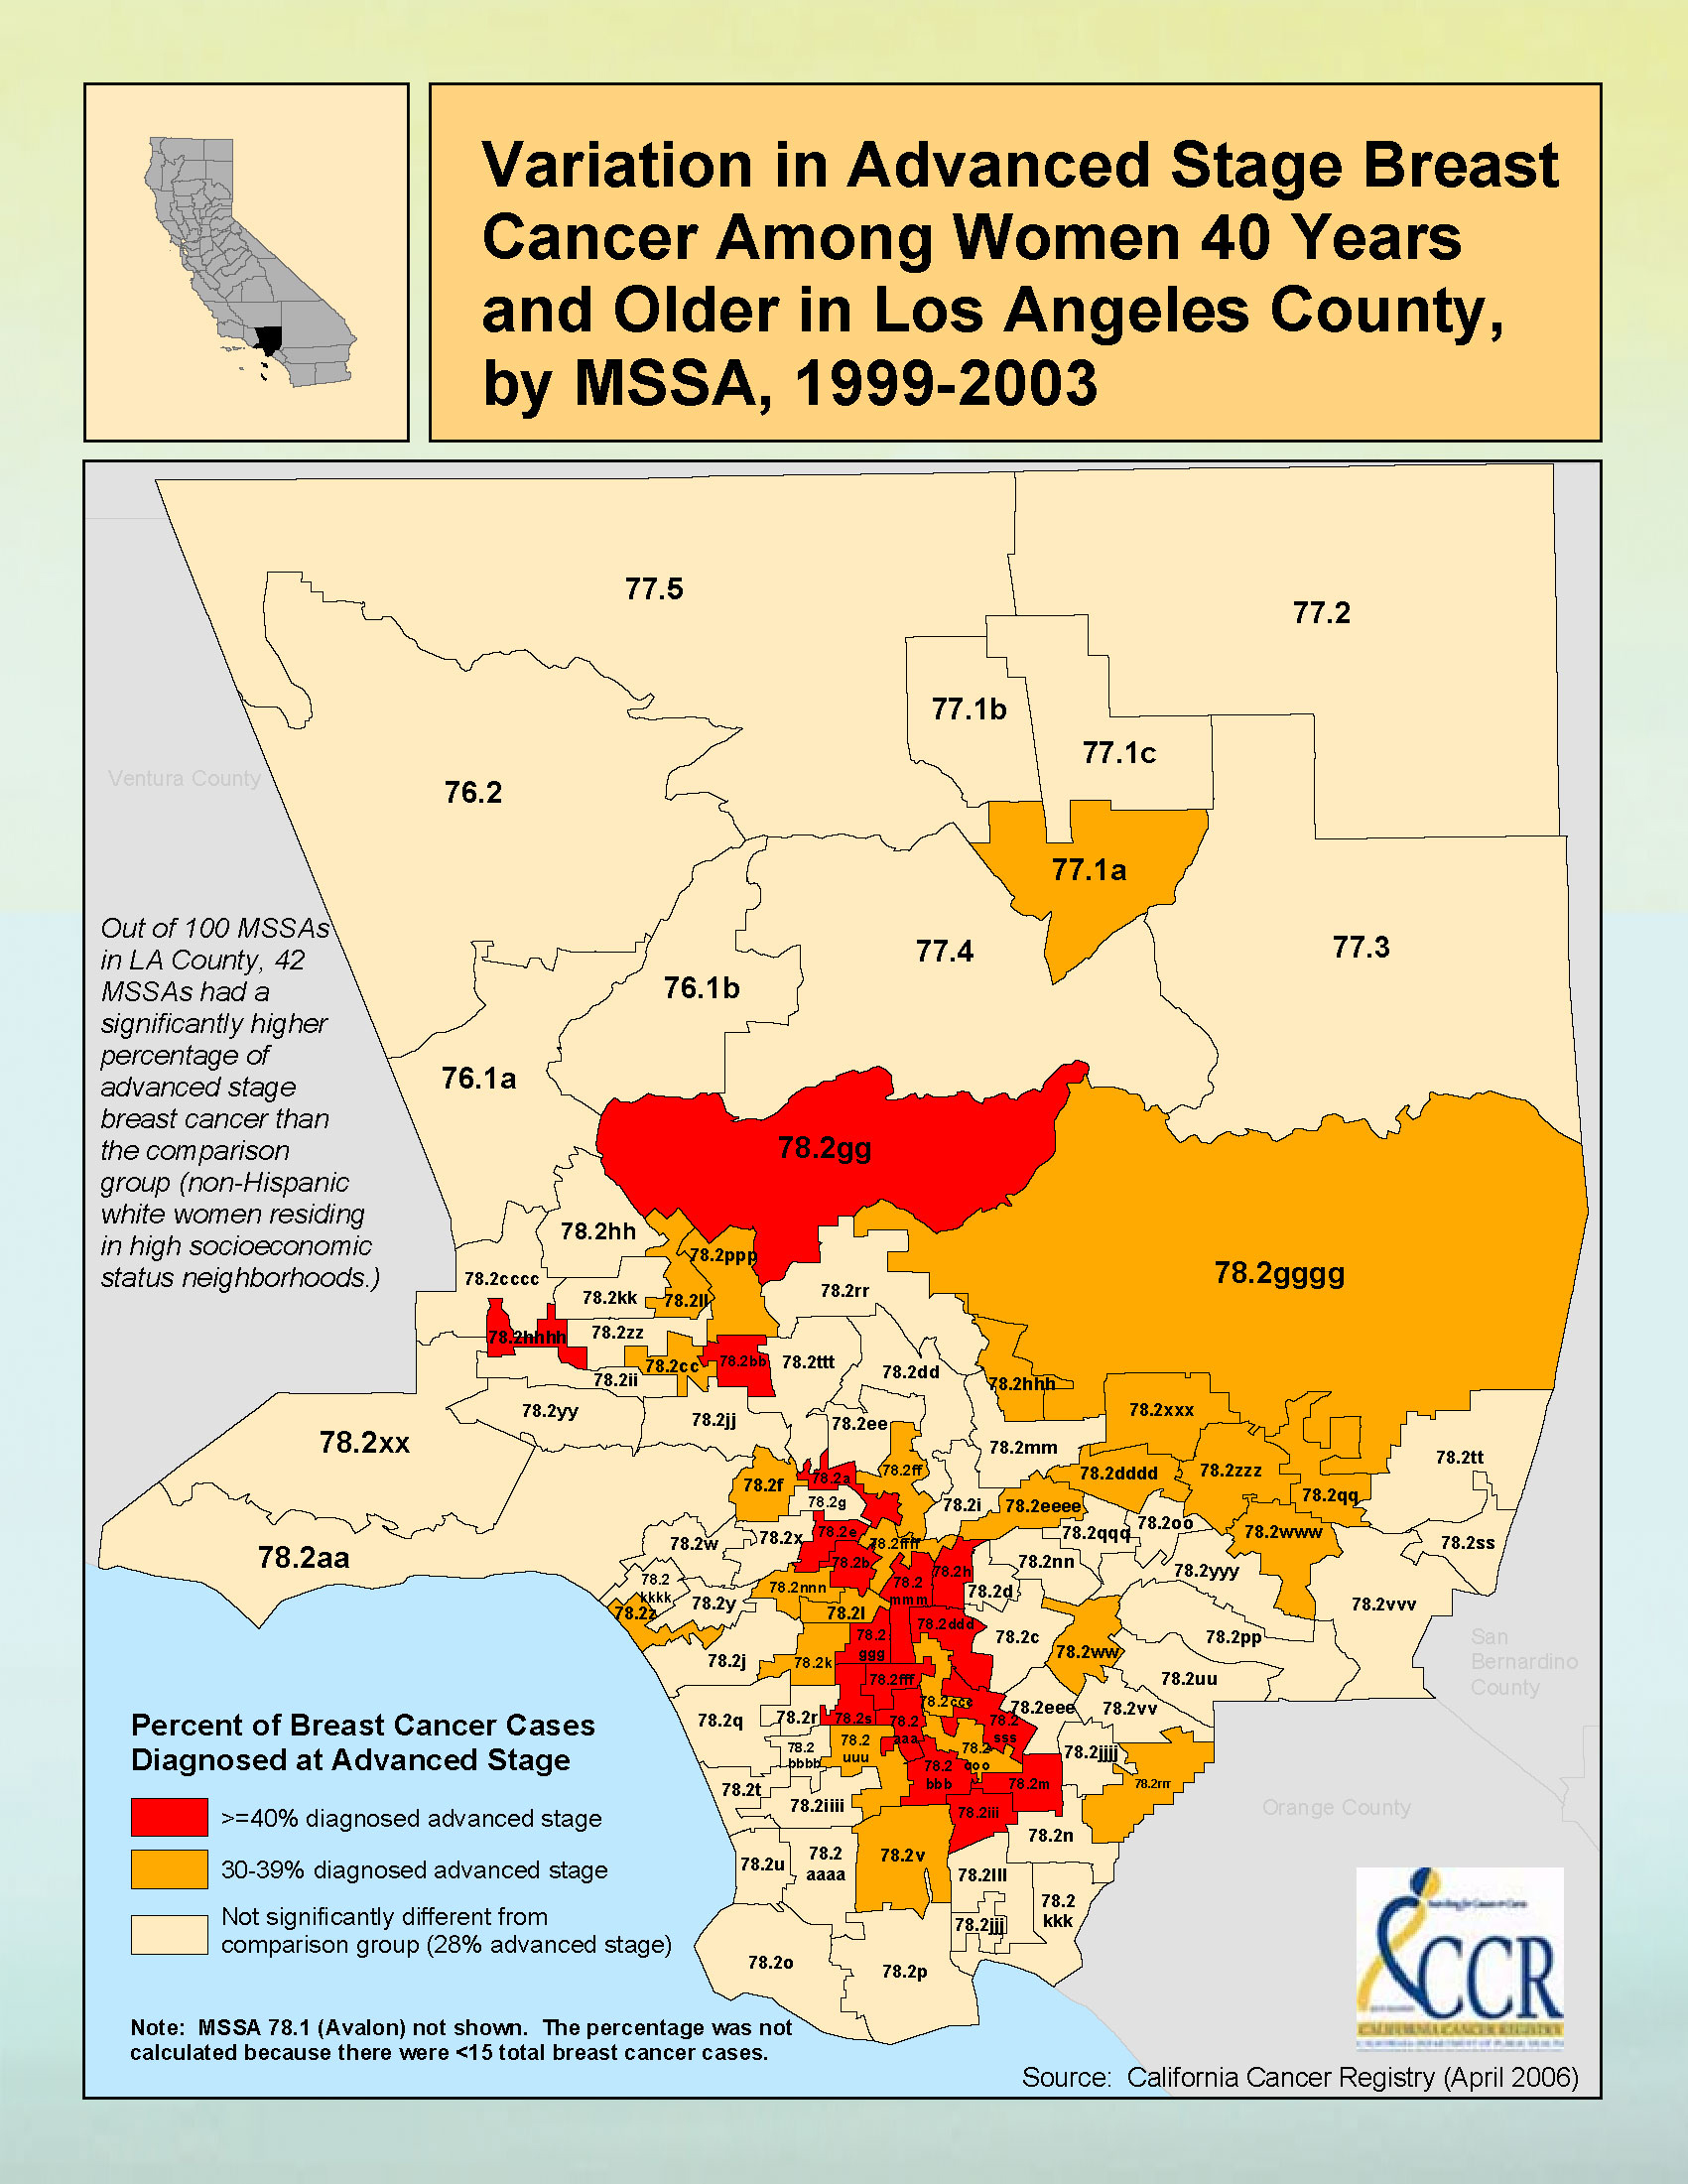
“Figure 2 gives an example of sub-county maps published by California Cancer registries. California is densely populated in many counties, and so the state has defined aggregations of census tracts for their maps. Some of California is in the SEER program; other parts have registries funded by the Centers for Disease Control (CDC).”
Figure 2. Breast cancer data for Los Angeles County.
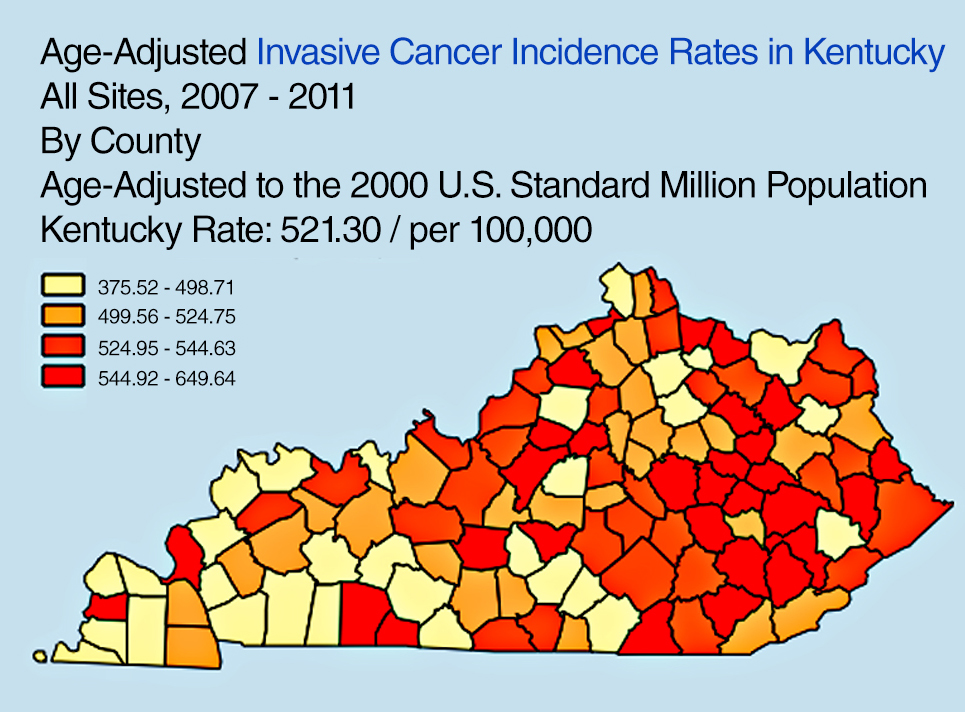
“Another state example: the Kentucky SEER registry has developed a useful online tool to explore Kentucky cancer patterns,” Pickle said. “See Figure 3. This design has been used by CDC for an online U.S. cancer atlas and by other states.”
Figure 3. Cancer incidence rates in Kentucky.
FURTHER READING
Visualizing Data Patterns with Micromaps By Daniel B. Carr and Lindia Williams Pickle
Cancer surveillance — an assessment of the number and type of cancer cases that occur in an area and in a specified population — provides critically important information needed for determining geographic variations in cancer rates and for planning cancer control intervention programs.
By Li Zhu, Linda W. Pickle, Zhaohui Zou, and James Cucinelli
This article is about projecting from the data that were available from surveillance/data-collection efforts to get estimates of the number of new cancer cases that would occur in the upcoming calendar year. That is, we used data from up to four years previous (because of the time it takes to find cases, process data, and so on) to get a current estimate of the number of cases.
We developed the statistical model to do this in 2006, then validated it, modifying the temporal projection method a few years ago. This method was then adopted by the American Cancer Society to produce the numbers of new cases published in their annual Cancer Facts & Figures reports, the most cited cancer reference in the world.
Since the models did not break out childhood cancers, we repeated the modeling process to do that, resulting in the paper cited here.
The method requires first a spatiotemporal prediction across the extensive years of data, since not all cancer registries have data for every year, and secondly a four-year temporal projection from the most current data point to the current calendar year. Here we use this same process applied only to childhood cancer data.
The generalized linear mixed effects model is applied to observed childhood cancer case counts reported to the North American Association of Central Cancer Registries over 1995– 2006 to predict case counts and incidence rates for every U.S. state and the U.S. total (for patients aged 0 to 19 and for major cancers among childhood). Covariates included in the model are measures of income, education, housing, urban/rural status, health insurance coverage, smoking, obesity, and cancer screening. Temporal trends and spatial distribution patterns are compared among childhood cancers for males and females.
Results. A total of 15,168 new cancer cases was projected for the 0–19 age group, with 10,032 childhood cancer cases younger than age 15, and 5,136 cases in the 15–19 age group, in the United States for 2010. There are more male cancer cases than female cases in all three age groups for most cancer sites. The order for the most common malignancies diagnosed in children differs by age group and sex. The study also identifies differences in the geograhic patterns at a small geographic area level by gender, and temporal trends by gender and subsites of childhood cancer incidence.
Conclusions. The resulting set of predictions provides annual estimates for states that did not provide data at all, and projections ahead in time to the current calendar year for every U.S. state and the United States in total. These projections fill in the data gaps for recent years of diagnosis and state registries to provide complete count and rate estimates for childhood cancers for all states, regions, and the U.S. in total for the current calendar year.
(The full article, “Trends and patterns of childhood cancer incidence in the United States, 1995–2010,” appears in Statistics and Its Interface, Volume 7 (2014), pp. 121-134.)
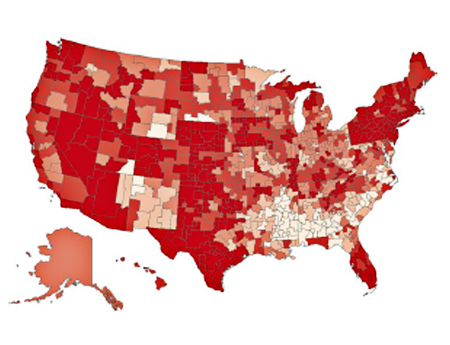
Figure 1. Rates, Ages 0–19 of All Childhood Cancers at HSA Level, 1995–2006, Female. From lightest to darkest: 10.0–14.5,14.6–15.5,15.6–16.5,16.6–17.5,17.6–22.2 per 100,00.Figure 2. Rates, Ages 0–19 of All Childhood Cancers at HSA Level, 1995–2006, Male;
Urban Sprawl, Obesity, and Cancer Mortality
Cross-Sectional Analysis and Methodological Challenges
By David Berrigan, Zaria Tatalovich, Linda W. Pickle, Reid Ewing, and Rachel Ballard-Barbash
Urban sprawl has the potential to influence cancer mortality via direct and indirect effects on obesity, access to health services, physical activity, transportation choices, and other correlates of sprawl and urbanization.
Methods. This paper presents a cross-sectional analysis of associations between urban sprawl and cancer mortality in urban and suburban counties of the United States.
A major focus of our analyses was to adequately account for spatial heterogeneity in mortality. Therefore, we fit a series of regression models, stratified by gender, successively testing for the presence of spatial heterogeneity. Our resulting models included county-level variables related to race, smoking, obesity, access to health services, insurance status, socioeconomic position, and broad geographic region, as well as a measure of urban sprawl and several interactions.
Results. Total cancer mortality rates were higher in less sprawling areas and contrary to our initial hypothesis; this was also true of obesity-related cancers in six of seven U.S. regions (census divisions) where there were statistically significant associations between the sprawl index and mortality. We also found significant interactions between region and urban sprawl for total and obesity-related cancer mortality in both sexes.
Conclusions. Despite higher levels of obesity in more sprawling counties in the U.S., mortality from obesity-related cancer was not greater in such counties. Identification of disparities in cancer mortality within and between geographic regions is an ongoing public health challenge and an opportunity for further analytical work identifying potential causes of these disparities. Future analyses of urban sprawl and health outcomes should consider exploring regional and international variation in associations between sprawl and health.
“Urban sprawl, obesity, and cancer mortality in the U.S.: cross-sectional analysis and methodological challenges,” in International Journal of Health Geographics, January 2014.)
GPS-Measured Physical Activity in Non-Small-Cell Lung Cancer
By C.L. Granger, L. Denehy, C.F. McDonald, L. Irving, R.A. Clark
Physical activity (PA) is increasingly recognized as an important outcome in non-small-cell lung cancer (NSCLC). We investigated PA using GPS, tracking individuals with NSCLC and similar-aged healthy individuals.
Methods. Fifty individuals with NSCLC and 35 similar-aged healthy individuals without cancer were included. Primary measures were triaxial accelerometery (steps/day) and GPS tracking (outdoor PA behavior). Secondary measures were questionnaires assessing depression, motivation to exercise, and environmental barriers to PA.
Results. Individuals with NSCLC engaged in significantly less PA than similar-aged healthy individuals and had higher levels of depression and lower motivation to exercise. Daily outdoor walking time and distance traveled away from home were not different between groups. Individuals with NSCLC spent less time outdoors in their local neighborhood area. A greater number of steps per day was seen in patients who were less depressed or had better access to nonresidential destinations such as shopping centers.
(The full article, “Physical Activity Measured Using Global Positioning System Tracking in Non-Small Cell Lung Cancer: An Observational Study,” appears in Integrative Cancer Therapies, July 2014.)
A new text and reference book, Geospatial Computing in Mobile Devices, has been published by Artech House. Recent developments in smartphones enable them to meet many of the demanding requirements for geospatial computing, in terms of computation power, data storage capacity, and memory space. This book, written by Ruizhi Chen and Robert E. Guinness, addresses and instructs in geospatial data acquisition, processing, visualization, context detection, and context intelligence.
Chapters of the 209-page book include:
Fundamentals of Mobile Positioning
GNSS, Wireless, and Hybrid Positioning in Mobile Devices (three separate chapters)
Mobile GIS and LBSs (two separate chapters)
Context Awareness and Reasoning (two chapters), and
GeoLearn, a start-up devoted to servicing the geospatial industry with online learning and continuing education credits, has launched its website and training portal with an initial catalog of 22 one-hour-long courses taught by industry-leading faculty members. Course topics available at launch include “Unmanned Aerial Vehicles (UAV’s),” “ALTA/ACSM Land Title Surveys,” and “National Flood Plain Insurance.”
“We want to provide quality professional development to satisfy continuing education requirements that also enables you to deliver services to your clients from a higher quality knowledge base,” said GeoLearn Principal Joe Paiva. “You often have to get continuing education to satisfy licensing requirements; at GeoLearn you will also leave enriched — a plus for any geospatial organization.” While catering to professionals, GeoLearn will begin to build up courses suitable for technicians as well, including a series that supports those pursuing Certified Survey Technician (CST) status.
GeoLearn faculty members are nationally recognized experts in the geospatial field. Initial faculty include Gary Kent of the Schneider Corporation, Wendy Lathrop of Cadastral Consulting and GeoLearn Principal Joseph Paiva. More courses will come soon from other notable professionals in the geospatial industry.
“A key motivation to start GeoLearn has been the desire to significantly improve the learning experience for busy professionals and technicians,” said GeoLearn Principal Bob Morris. “With limited time availability and the growing cost of travel associated with more traditional methods of securing continuing education credits, we hope to provide an attractive option using of state-of-the-art multi-media through our online training portal.”
GeoLearn has invested in a multi-camera video production studio optimized for online learning, and hired Emmy Award-winning marketing and video expert Peter Barrett to head up those efforts.
Trimble announced today several enhancements to the Trimble R10 GNSS Surveying System designed to drive field productivity to a new high. With sophisticated tilt-compensation technology, CenterPoint RTX correction service support, and updated field and office software, the R10 platform demonstrates Trimble’s commitment to driving improved surveying productivity.
The announcement was made at Intergeo 2013, being held October 8-10 in Essen, Germany.
“Innovations in techniques such as our tilt compensation technology can have a pervasive impact on the everyday surveying experience,” said Elmar Lenz, business area director of GNSS Solutions for Trimble’s Geospatial Division. “With our innovative approach to total surveying workflow, Trimble is redefining the way surveying work is done.”
The Trimble R10 is now augmented to further speed GNSS field work. With its new internal tilt-compensation, Trimble SurePoint technology takes field efficiency to the next level. The system will automatically adjust for pole-tilt up to 15 degrees from plumb, saving time and reducing fatigue. With tilt compensation, surveyors can now utilize GNSS in more situations and with 100 percent measurement traceability.
In addition, Trimble introduced its high-accuracy correction service, CenterPoint RTX, into the geospatial market with support in the Trimble R10. Powered by Trimble RTX technology, CenterPoint RTX is a subscription service that delivers real-time 4 centimeter (1.5 inch) or better corrections via satellite directly to the receiver without requiring the use of a base station, VRS network, or investment in additional hardware.
Both Trimble Access field software and Trimble Business Center office software have been updated to streamline data flow and automate data processing. Faster in the field and more flexible in the office, Trimble’s premium GNSS surveying system enhances the entire surveying workflow.
The updates to Trimble R10 GNSS System, CenterPoint RTX service support, Trimble Access version 2013.40 and Trimble Business Center version 3.10 are expected to be available in the fourth quarter of 2013 through Trimble’s Geospatial Division distribution network. For current R10 users, the tilt-compensation feature and CenterPoint RTX support will be available through a free firmware update.
Everything has a geospatial aspect. Everything. Past, present, future.
Over grits, coffee, and the airborne delicacy purveyed at the Flying Biscuit Cafe (right out of the oven, right into your mouth) in Sandy Springs, Georgia, I absorbed this high-tech homily.
You’ve heard of the European financial crisis. Trace it back to geospatial, from the Greek banking collapse, which in turn had roots in the implosion of the Greek tax system, due to a plethora of gaps, inconsistencies, and exceptions filed in a largely uncontrolled property cadastre — the register of real property, including details of ownership, precise location (by GPS coordinates), and value of land parcels.
Lose control of your cadastre (your GIS), lose the country. With global interconnections, soon the continent, if not perhaps the world economy.
For want of a nail, the battle was lost.
Jump forward, technologically, to flash lidar. Ball Aerospace created this ability to capture continuous rapid multiple laser interferometry detection and ranging (LiDAR) images/point clouds, merged with continuous high-resolution optical images, to create full-color 3D models in real time. Stitched together with GPS, this produces real-time full-motion video: interactive geo-referenced metric 3D models.
In field application, this can yield time-critical 3D mapping for urgent missions, enhanced situational awareness, battlefield characterization, and tactical mission planning. It can help with disaster-response planning and event forensics. Real-time models could be communicated with the public through easily comprehended moving images via television or the Internet. of the actual progress of a fire or flood, together with evacuation routes.
Jump again to fabfi. What’s a fabfi?
FabFi is an open-source, lab-grown system out of MIT using common building materials and off-the-shelf electronics to transmit wireless Ethernet signals across distances up to several miles. Communities can build their own networks for high-speed Internet connectivity, and access to online educational, medical, and other resources.
Simple, low-cost, and feasible in unstable environments: Afghanistan, Kenya, and any number of countries that leapfrogged telephone landlines to come quickly into the cellular era; now they can leapfrog Ethernet cable networks and even Wi-Fi for virtual connectivity. Implement with locally available materials. Print out a 2D design file and create the pieces out of wood, metal, acrylic, clay, stone, or ice, as long as you can attach a metallic RF reflective surface to the front.
If you haven’t guessed the geospatial aspect of this, I assure you it’s there, but I’ve run out of room here.
Alan Cameron is editor-in-chief and publisher of GPS World magazine, where he has worked since 2000. He also writes the monthly GNSS System Design e-mail newsletter and the Wide Awake blog.
Photo: TrimbleTrimble has introduced the Trimble MX2 mobile spatial imaging data capture system. The MX2 extends the capabilities of geospatial professionals, allowing them to safely and effectively address complex projects by collecting spatial data from a mobile scanning platform, the company said. The Trimble MX2 provides a versatile and complimentary addition to Trimble’s family of mobile data capture systems.
Designed for mapping, surveying and engineering environments, the MX2 is rugged, lightweight and portable. It is also easily deployed and redeployed on projects similar to conventional surveying equipment. A precise laser scanner, along with an embedded Trimble-Applanix GNSS/Inertial positioning system, allows geospatial professionals to create the point cloud accuracies necessary for many spatial imaging projects. Accompanied by Trimble Trident software to capture, process and analyze point data, the MX2 offers a ready-to-use workflow for surveyors and professionals in mapping, engineering, planning, oil and gas, utilities, mining, environmental, public safety and more. The system is available in single and dual-laser versions.
In conjunction with the MX2 system, Trimble also announced new features for its Trident Software 6.0. The software developed for rapid transformation of point clouds and imagery into geospatial intelligence has been significantly enhanced to provide a scalable software suite for a wide range of users. Additions include the incorporation of direct trajectory import and the Trimble Coordinate System Manager. The Trimble Trident software suite is ideal for the analysis of mobile laser scanner data and geo-referenced imagery.
“The Trimble MX2 provides survey companies with the opportunity to enter the world of mobile scanning at a time when it is becoming a desired service within their solution portfolios,” said Katherine Sandford, general manager of Trimble’s Imaging Division. “The MX2 offers a simple and highly productive mobile data collection capability and a 3D point cloud workflow for a wide range of users.”
Leica Geosystems Ltd. has signed a formal agreement with Sigma Seven Ltd. to provide improved value data collection and workforce management solutions to the GIS asset collection and management market. The strategic partnership combines GeoField software from Sigma Seven with the Leica Zeno CS25 GNSS tablet computer, allowing high-accuracy satellite position data to be collected with richly attributed data in one system, the companies said.
“Many organizations are demanding the need for better, more reliable information to improve the on-going management and maintenance of their assets,” said Nathan Ward, market segment manager. “This partnership with Sigma Seven with their industry renowned geospatial and work management software will provide a fantastic integrated solution to enable field and office staff to work more efficiently and enhance the quality and effectiveness of their corporate data. A combination of proven capabilities, experience and a long and highly regarded heritage in the geospatial sector, will mean that this partnership will further enhance the solutions in Leica Geosystems’ Asset Collection and Management market.”
Andrew Coleman, Sigma Seven Director adds, “Leica Geosystems is one of the premier manufacturers in the asset collection and GIS industry and they continue to innovate in spatial and measurement technology. By working together I believe we have a unique field mobile proposition, backed up by a shared quality and customer service ethos, that will accelerate the delivery of cost, performance, service and accuracy benefits to our customers.”
Since 2000, Sigma Seven has helped some of the largest utility companies in the UK and developed a range of systems for utilities, government, environmental and engineering customers. GeoField is a powerful mobile data and work management system that enables field workers to access enterprise data at the point of action, Sigma Seven said. An intuitive map-based interface is supported by comprehensive imaging, red-lining, structured workflow, data capture and field reporting facilities.
The Leica Zeno GIS series has been designed and optimized to capture accurate GNSS positions and richly attributed data quickly, even in the most demanding of environments, the company said.
Andrew Coleman, Sigma Seven Director, and Nathan Ward, Market Segment Manager for Leica Geosystems.
The Geospatial Information & Technology Association (GITA) announced the transition of GITA to an all volunteer organization officially begins at the close of business Friday, June 29, 2012. The following Monday, the association will enter a new phase of its existence, one that will be marked by a focus on virtual, on-line education and less of a dependence on resource-heavy conferences.
According to Executive Director Bob Samborski, it means the following for GITA members?
You will continue to receive the GITA News Hub without interruption.
Existing memberships in GITA will continue and individuals will be contacted at the time of their next renewal.
GITA is reaching out to each of its current chapters to determine how each of these local organizations can move forward. Any currently active chapter can continue to operate as usual under the auspices of GITA’s non-profit status.
Options for realigning GITA’s administrative and IT infrastructure in a cost-effective way are being researched. Because the current staff of GITA will end full–time employment on Friday, normal communication channels (phone calls and emails) will be changed.
More information about the transition will be made available in the near future in the News Hub and on the GITA website.
Samborksi writes:
“It is important for everyone to know that GITA will continue to function as a professional, non-profit educational association. The Board of Directors will continue to explore new ways to add value to GITA membership and consider options for managing potential future educational events. More content and learning will become available online. And, as the association transitions to a volunteer-driven organization, active participation from our members in GITA activities will be sought.”
“While I personally will not be an employee of GITA after Friday, I will continue to serve the association as a volunteer during the period of transition. If you would like to contribute your time and effort to helping to redesign GITA, please just let me know! I will be reachable at my usual email address for the foreseeable future: [email protected].”
“Finally, I look forward to contacting our individual and corporate members, chapter officers, international affiliates and other important constituents in the next few days as we wind down this chapter of GITA. I will offer a few more details about what the future holds for GITA, as well as some personal comments about my 24 years of service to the association.”
“Until then, sincere thanks to everyone who reads the GITA News Hub. I wish you the best in your geospatial endeavors.”
At this week’s Hexagon 2012, Intergraph announced it is showcasing the exciting capabilities of ERDAS Imagine’s next-generation Spatial Modeler. This revolutionary technology provides a unique environment for the creation of solutions, combining ERDAS Imagine’s processing capabilities with the powerful vector analysis functionality of GeoMedia.
According to the announcement, ERDAS Imagine’s existing spatial modeling capabilities enable you to graphically create models of complex raster imagery processing workflows. Those with less domain knowledge can easily execute the models to obtain the same accurate, reliable results as more expert users. By reducing training time and helping automate complicated workflows, the ability to process imagery using automated spatial models has become a quintessential feature for many customers.
Integraph reports that the new spatial modeling framework expands this proven technology by providing full extensibility and true interoperability with other systems, enabling you to construct complete geoprocessing workflows. You can also enhance existing solutions with the spatial modeling technology, allowing you to add new types and operations, providing full extensibility.
“Integrated within a new graphical user interface and extensible through third-party scripting environments such as Python, the next-generation spatial modeling capability will support desktop and on-demand enterprise geoprocessing,” said Mladen Stojic, Vice President – Geospatial, Intergraph. “With this new capability, GIS modeling with vector operators meets image processing with raster operators, all within one graphical environment. This is all based an open and commonly accepted scripting environment, brought to you by a single company.”
The new spatial modeling framework offers the option of creating models graphically using drag-and-drop components or through widely used Python scripting. To learn more, please visit http://www.intergraph.com/geospatial


![Trimble-MX2-Spatial-Imaging-System[1].jpg Photo: Trimble](https://stage.globalpositioningnews.com/wp-content/uploads/2013/07/Trimble-MX2-Spatial-Imaging-System1.jpg.jpg)
