Automated Movement and Identification Solutions (AMIS), a division of the U.S. Department of the Army, has bestowed a Certificate of Appreciation to GeoDecisions, Gannett Fleming’s geospatial technology division.
The certificate recognizes GeoDecisions for its outstanding technical expertise and dedication in the modernization of the Transportation Coordinators’ – Automated Information for Movements System II (TC-AIMS II) Convoy Planning Highway Regulation (CPHR-M) module.
TC-AIMS II CPHR-M is an advanced software solution used to plan the Army’s convoy movement around the globe. GeoDecisions integrated the Transportation Geospatial Information System (TGIS) map and routing tool through the TGIS application programming interface to embed the map within the TC-AIMS system.
The TGIS integration with TC-AIMS provides enhanced, real-time mapping functions, faster processing speeds, and a more user-friendly experience.
The recognition also honors the GeoDecisions team for its technical knowledge, attention to detail, and ability to recognize, understand and address issues quickly to allow CPHR-M to stay on schedule.
The team’s efforts resulted in more than a dozen changes to the baseline to provide better performance and additional capabilities that were not identified at the start of the project.
“It’s almost unheard of to receive an award like this from a government program, so we feel especially humbled by this honor,” said Brendan Wesdock, MCP, GISP, president of GeoDecisions. “We’ve built an exceptional team of geospatial professionals who continuously push the boundaries of geospatial technology to deliver the most effective and valuable solutions to our clients.”
AMIS is the primary source of providing automated movement and identification solutions across the DOD and around the globe. AMIS is the essential supplier for Transportation Coordinators’ – Automated Information for Movements System II (TC-AIMS II) with approximately 5,000 active users.
The GeoDecisions team (from left): Jay Ross, senior software test specialist; Jeff Carter, TGIS lead system administrator with sub-consultant Aegis Strategies, LLC; Steve Kraabel, senior client manager; Debra Houser, director of Application Development; Bret Huber, lead and software developer; (not pictured) Andrew Miller, developer. (Photo: GeoDecisions)
The new system, called Guardacostas Pro, uses a combination of satellite imaging and signal processing to monitor vessels for illegal activities such as drug smuggling and fish poaching in the coastal waters of Argentina’s exclusive economic zone (EEZ).
As Argentina’s coast guard, Prefectura Naval deploys patrol vessels, helicopters and airplane spotters to protect its economic interests and to guard against the decline of its fishery.
This year, the Guardacostas Pro system allowed Prefectura Naval to track a Spanish vessel that entered the EEZ and attempted to return to international waters. The coast guard was able to catch the ship, which had poached roughly $380,000 worth of fish; escort it back to port; impound it; and fine the crew.
The captain had little ground to refute the charges because the coast guard had the data to prove the illegal activity.
“As of five years ago, we had very little information about the use of our seas,” said Ernesto Miguel Klocker, Prefectura Naval director of informatics and communications. “Now we have a good picture, which gives us electronic control of the sea, allowing us to send our air and naval units directly to the places where ships operate.”
Until recently, its primary enforcement tool was constant patrolling and investigation of all ships. Now Guardacostas Pro monitors signals that every vessel transmits to avoid collision and to provide data on vessel type, speed, and location. It combines this with satellite imaging and Esri’s spatial analytics capabilities to give coast guard personnel real-time alerts when a vessel is entering their waters.
“Prefectura Naval is setting a truly cutting-edge example of a forward-thinking organization,” said Dean Angelides, Esri head of international alliances and partners. “The best way to effectively enforce laws over such a large scale as the EEZ is to know exactly where things are happening and when, and Argentina is now leading the way in data-driven public safety.”
After being successfully proven at sea, the Guardacostas Pro system has been moved ashore and is now a multiagency tool to aid Argentina’s Ministry of Security’s homeland security mission. The Ministry of Security will use the system to track and locate its operative units through mobile phones, radio equipment, vehicles with location sensors, and search and rescue aircraft.
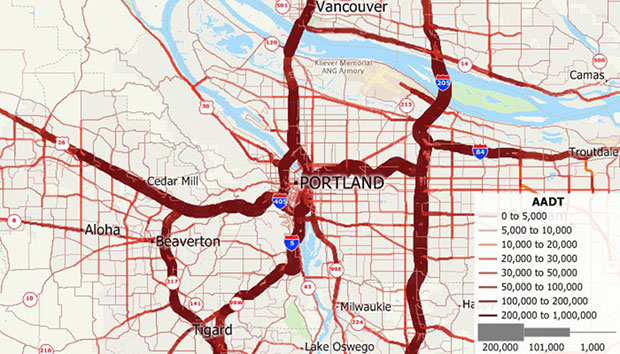
Caliper has released a free average annual daily traffic (AADT) map layer for Maptitude 2018 users.
The latest version includes fields with total AADT traffic count, semi-trailer truck count, single-unit truck and bus count, number of through lanes and road classification.
AADT is the total volume of vehicle traffic on a highway or road for a year divided by 365 days. It is a useful and simple measurement of how busy a road is, and is useful for:
selecting a new site or facility location, evaluating a site, or designing a territory
determining funding for highway maintenance and improvement
forecasting road maintenance needs and expenditure
identifying the best location for your business based on traffic patterns
analyzing how traffic may impact store construction
analyzing the environmental hazards of sound and pollution related to road transport
The downloaded layer can be added to any Maptitude 2018 map.
Extensis and LizardTech are uniting as one global company to help organizations increase their return on investment and the value of their digital assets, fonts and large imagery.
In 2017, Extensis and LizardTech collaborated on the development of new portfolio asset geo-referencing capabilities for applications in the geospatial, infrastructure, architecture/engineering/construction and building information modeling segments.
With Extensis’ market leadership in digital asset and font management combined with LizardTech’s expertise in image management and image compression technology, the united company is situated to provide a suite of solutions and support for digital asset challenges.
“Organizations today are investing in imagery of all kinds, including photography, aerial, and spatial, to name a few,” said Osamu Ikeda, CEO of Extensis. “Fully leveraging these digital files means having an easy and efficient way to organize, store, access and distribute them.”
Ikeda continued, “Uniting Extensis and LizardTech strengthens our ability to support our customers’ success and give them effective and time-tested solutions for maximizing the value of digital assets of all kinds.”
The combined company will operate under the Extensis brand, headquartered in Portland, Oregon, with an office presence in Seattle.
Starting now, LizardTech products (GeoExpress, Express Server, GeoViewer) will become part of the Extensis suite of solutions, which spans digital asset management, font asset management, brand asset management, image management and image compression.
The mobile mapping market size is expected to be worth more than $40 billion by 2024, according to a new research report by Global Market Insights.
The mobile mapping market is propelled by the increasing adoption of mobile devices such as smartphones and tablets across the globe. Smartphone users are extensively using mapping applications on their devices for navigation and driving assistance, the report said.
Furthermore, they are also leveraging on the GIS and GPS applications to access geo-referenced data for searching nearby restaurants, cinema halls and other landmarks. This is encouraging the technology companies to commence mapping across the globe to acquire accurate GIS data and provide an enhanced customer experience.
High initial investment is a major factor limiting the growth of the mobile mapping market. Currently, the market comprises a few major players with a long-standing expertise in location-based technologies. High initial investments in developing mobile mapping systems and assembling major components have restricted the entry of new players in the market.
According to the report, the software market is anticipated to grow at a CAGR of 15 percent over the projected timespan. The growing demand for geo-referenced data acquisition and data analysis software among the organizations is driving the mobile mapping market growth. The software assists organizations in simplifying the data extraction process by combining the vital details. It retrieves geographic and spatial data captured by the positioning devices to develop maps and other graphic displays. This data is also used by enterprises to build effective decision support systems, which will drive the market demand.
The report includes key industry insights in 250 pages with 341 market data tables and 38 figures and charts from the report, “Mobile Mapping Market Size, By Component (Hardware [Imaging Device, Laser Ranging Device & Scanning Device, Positioning Device], Software [Mapping Data Extraction, Data Processing], Service [Consulting, Integration & Maintenance, Managed Service]), By Application (Road & Railway Survey, GIS Data Collection, Vehicle Control & Guidance, Asset Management), By End-User (Agriculture, BFSI, Government & Public Sector, Real Estate, Retail, Mining, Telecommunication, Transport & Logistics), Industry Analysis Report, Regional Outlook (U.S., Canada, the United Kingdom, Germany, France, Italy, Spain, Australia & NZ, China, India, Japan, South Korea, Brazil, Mexico, Argentina, GCC, Israel, South Africa), Growth Potential, Competitive Market Share & Forecast, 2018 – 2024.”
The mobile mapping technology is used for conducting road and rail surveys, collecting GIS data, and developing vehicle control and guidance systems and asset management systems. The road and rail survey market is expected to register a growth rate of over 17 percent during the forecast period. It is used to analyze the road and rail infrastructure and plan the engineering operations with minimum disruptions. The surveying authorities across the globe are using mobile mapping technology to create maps for the transportation department for road assessment purposes.
The agriculture sector is estimated to grow at a CAGR of 22 percent during the forecast timeline. The integration of the GPS and GNSS devices into the farming process to acquire geospatial data is the primary factor driving the mobile mapping market share. Furthermore, the ability of the mobile mapping technology to monitor the crop yield and land variability also augments the demand for the technology among the farmers.
The European region accounted for over 25 percent global mobile mapping market in 2017. The increasing investments by the government agencies have accelerated the adoption of mobile mapping technology in the region. For instance, in 2017, the U.K. government established the Geospatial Data Commission to frame a strategy for using the public sector location data to support the country’s growth.
The Asia Pacific region will grow at a rapid pace over the forecast timespan. The rapid urbanization of the region and the growing number of infrastructural projects have fostered the growth of the mobile mapping market in the region. Moreover, the widespread adoption of smartphones has also driven the market size.
Prominent players operating in the mobile mapping market are Phoenix LiDAR, Sharp Corporation, Teledyne Optech, TomTom International, Topcon Positioning Systems, MapJack, Mapquest, Navteq, NCTech, Microsoft, Mitsubishi, NovAtel, Phaseone industrial, Hexagon, EveryScape, Foursquare Labs and XIMEA.
The major companies in the market are collaborating with other expert companies in the market to develop new product offerings and conduct strategic acquisitions to gain a competitive advantage over its competitors.
For instance, in 2017, Garmin acquired Navionics, a provider of electronic navigational charts to the marine industry. This acquisition is aimed at combining the data from Navionics charts and Garmin’s blue charts to develop improved navigational services to its customers. Similarly, in 2017, Hexagon entered into an OEM partnership with Smart Guided Systems to develop new precision technologies for commercial applications.
The global mobile mapping market research report includes an in-depth coverage of the industry with estimates and forecast revenue in USD respectively from 2013 to 2024, for the following segments.
Mobile Mapping Market, By Component
Hardware
Imaging device
Laser ranging and scanner device
Positioning device
Software
Mapping data extraction
Data processing
Service
Consulting
Integration & maintenance
Managed
Mobile Mapping Market, By Application
Road & railway survey
GIS data collection
Vehicle control & guidance
Asset management
Mobile Mapping Market, By End-User
Agriculture
BFSI
Government & public sector
Real estate & infrastructure
Retail
Mining
Telecommunication
Regions and Countries
North America
U.S.
Canada
Europe
UK
Germany
France
Spain
Italy
Asia Pacific
ANZ
China
India
Japan
South Korea
Latin America
Brazil
Mexico
Argentina
MEA
GCC
South Africa
Israel
GIS software company Caliper has released new highway exit data for the United States and Canada.
Users of Maptitude 2018 with the Canada or United States country packages can download a free point layer containing all signed and numbered highway exits within their respective country.
The highway exits layer allows users to find the nearest highway interchange to a particular location or determine proximity to a desired interchange. Applications include site location assessment, commercial real estate, franchise development and accessibility studies.
The data can also be used in conjunction with the free U.S. traffic count data to determine traffic volumes around a chosen exit.
The Highway Exits and Interchanges layer can be added to any Maptitude 2018 map.
Europe-based Airbus Defence and Space has entered into a partnership with Orbital Insight, a U.S.-based geospatial analytics company, to build a suite of geospatial analytics services and tools.
The agreement will provide Orbital Insight with access to Pleiades and SPOT satellite imagery at scale, and provide Airbus with analytics services, making Orbital Insight the first analytics partner for the Airbus Digital Platform OneAtlas.
The OneAtlas Platform is a collaborative environment enabling users to easily access constantly updated satellite imagery, perform large-scale image processing, extract industry-specific insights, and benefit from Airbus assets to develop tailored solutions for a wide range of markets in both commercial and government sectors, the company said.
“Under this agreement, we will offer premium analytics capabilities to a large range of users, powered by Orbital Insight’s services and tools,” said François Lombard, director of the Intelligence Business at Airbus Defence and Space. “The OneAtlas Platform is definitively the cornerstone to leverage both Airbus and partner assets to support our customers’ business development and growth.”
“We’re proud to be Airbus’ first geospatial analytics partner on the OneAtlas Platform,” said James Crawford, Orbital Insight’s CEO and founder. “Along with our new satellite imagery agreement, this partnership drives customer value for those looking to better understand what’s happening on and to Earth.”
GIS specialists are much more than mapmakers. Make sure your organization and customers understand how spatial analytics can help them succeed.
By Adam Carnow
Most non-GIS users hear the term “G-I-S” and think “M-A-P.” That is, they think of GIS, and GIS practitioners, as mapmakers. Most GIS practitioners have unknowingly perpetuated this image. Ask any GIS practitioner what they do for a living and most will say, “I make maps;” however, the reality is that what they do for a living is help people make better decisions through the power of location. This is what I call location intelligence.
There is a tremendous growth opportunity for GIS in government across the enterprise. GIS was created to perform spatial analysis. GIS can often be underutilized because non-GIS users sometimes don’t understand the reach of spatial analysis and how it can help them. GIS practitioners need to market and evangelize the power of spatial analysis to help change that image.
Photo: rmnoa357/Shutterstock.com
You can break down location intelligence into six categories. As you move down this list, the value of the location intelligence increases:
Understanding Where. A map (could be paper or PDF, but should be an interactive web map) showing where the fire stations are located across a city.
Measuring Size, Shape and Distribution. A map showing the size, shape and distribution of wetlands across an area would help with wetland protection and preservation.
Determining How Places Are Related. Showing how certain soil types correspond to flood zones.
Finding the Best Locations and Paths
To find the best location for a new fire station, run a drive-time polygon process to show the coverage area for each fire station. The areas that are uncovered are where a new fire station is needed.
To find the best path for field inspectors: We have 50 inspections to do today and three inspectors. Divide the inspection locations among each inspector and create the most efficient route to get their work done.
Detecting and Quantifying Patterns. Crime analysts look at crime data to try to predict where the next one may occur and to help identify known perpetrators. (See also An inside look at fighting crime with GIS.)
Making Predictions. Modeling a watershed can allow for flood predictions based on anticipated rainfall.
Another way to help break the mapmaker image is to rebrand. Most staff in any organization use spreadsheets daily for a multitude of things that bring value to the organization – some say it’s the number one business intelligence (BI) tool.
There are GIS software tools that are as easy to use as a spreadsheet; in fact, you can use GIS inside of spreadsheets.
Wetlands map, Oregon’s Klamath Lake. (Map: USGS)
Even though spreadsheets are such a useful tool, you don’t see a Spreadsheet Department. Spreadsheet is just the name of the tool, so you don’t have, or name, a department for it. A department should be named based on the function, or value, it serves.
GIS should be thought of as BI with location data and spatial analysis, or location intelligence. A great way to get people to understand the real value and power of GIS is to rebrand your GIS department to something like Enterprise Location Intelligence.
One such example of this is Walgreens. As the drugstore chain’s GIS department became more strategic and tied to the analytics of the organization, the company rebranded it as Enterprise Location Intelligence.
If your organization has a BI group, they should consider reorganizing to put GIS with that BI group. I’m seeing real-world examples of this rebrand:
GIS job title changes to things like:
Data Analytics Manager
Content Delivery Manager
Business and Location Intelligence Manager
Reorganization putting GIS with BI: A major city has a Smart City initiative, and in response the city has reorganized its IT group — they now have a Data Analytics Group that consists of a BI team and their GIS team.
This rebrand, and expansion of the understanding of the true purpose and value of GIS, will not just help the organization realize more return on investment (ROI) for their GIS investment, it will help the GIS practitioners elevate their value to the organization and hence their careers.
What can you do? If you’re a GIS practitioner:
Explore rebranding your title and your GIS group as a start to changing your image from mapmaker to solution provider.
Evangelize the power of location intelligence. This is actually pretty easy to do. When someone asks for a map, ask them why they need it, probe to find out more about their project; you will probably uncover a need for spatial analysis.
Start to enable others in your organization to become GIS users via easy-to-use web maps and apps. As they use GIS, they will realize its full potential and seek to utilize it more often.
If you’re not a GIS practitioner, seek out your GIS team to learn more about their capabilities and how they can help you. And, become a GIS user, there are plenty of GIS tools available that are easy to learn and use.
This article originally appeared on Govloop.com and is reprinted with permission.
Adam Carnow is an Esri community evangelist and part of the GovLoop Featured Contributor program.
GIS is growing in importance to urban development, whether for environmental impact studies, geofencing or building information modeling (BIM). Sharing GIS data with developers is critical to a coordinated approach to smart city growth.
By Christine Easterfield, Principal Analyst, Cambashi
Just over half the world’s 7 billion population lives in cities. In Europe, this rises to three quarters, and 30 cities worldwide have populations of more than 10 million — the majority in India, China and South America.
This trend will continue. It is projected that the global population will reach almost 10 billion by 2050, which means cities will need to cope with increasing demands on housing, transport and communications.
Growing urban populations place considerable stress on housing stock. Cities need to provide scope to build new, but also to look at best use of existing properties.
In the growing urban population, there will always be a proportion that needs more support as employment rates shift and wages do not always keep up with city expenses. Social housing projects need to keep pace, and making the most of city resources opens opportunities for smart buildings.
The role of GIS
Proposed Indianapolis zoning map. (Image: City of Indianapolis)
Coordinating new build and refurbishment plans across a city requires planning and organization, and a set of tools to support planners and designers. The layout of city-planning zones is the starting point for many new developments — sharing data about these areas is typically achieved using a GIS (geographic information system).
The standard city map with records of roads, emergency routes, bike routes, key buildings, new development zones, existing housing stock, utility services and street lighting are a central resource for most cities.
Sharing data between these city maps and developers’ plans is critical to a coordinated approach to city growth.
Environmental impact
The early stages for many developments involve an environmental impact study. How will the new development fit into the existing landscape? What restrictions are imposed because of the conditions of the site or the current demands on local resources? What options are there for addressing these constraints?
This last point is important for acceptance of the development. Being able to show a level of flexibility to accommodate local concerns and developers’ challenges will build a cooperative relationship. The ability to easily integrate building plans with the city map means that confidence is quickly built into the new plans.
Combining the geography of the city view with the building model destined for development provides a perfect foundation for an integrated GIS/BIM model to take the development from drawing board to handover.
Maintaining a digital twin of a development, in the form of a BIM, provides a rich source of information about the as-built building — exact measurements, materials used, changes from the original design and more. Integrating this with the city maps held in GIS means a continuous dataset can be formed.
Tools for construction site inspection and reporting
Photo: Alen Ajan/Fotolia.com
Developing building information models (BIMs) requires monitoring the build activity and accurate recording of the construction. The best way to do this is as it happens.
Simple-to-use tools that are robust enough to cope with a construction site are becoming more available from software providers. These support gathering data by construction teams and contractors as the work is completed.
As well as recording data, these tools are also useful in registering the progress and completion of tasks. Many enable interaction with central systems that can send changes and updates directly to the site for immediate action.
The same tools can register the location of the user, enabling safer working practices to be enforced.
The practice of geofencing to monitor or even restrict access to parts of a construction site, by registering the location of a device against a predefined region on a map of the site, can track critical activities and react with the most appropriate action if an incident is reported.
Remote site inspection and reporting
The Aeryon SkyRanger. (Photo: Aeryon Labs)
The safest inspections don’t involve human intervention at all. Sending an unmanned aerial vehicle, UAV or drone, to fly over your site removes risk to staff when viewing hazardous environments.
Photographic imagery collected by drone can be loaded into GIS tools and accurately registered against the map of the area to provide a seamless view of the site.
Data integration is key
The range of data that can be accurately gathered and viewed together now covers original 3D designs, 2D construction plans, inspection photo-imagery and as-built updates.
Integration of BIM and GIS tools means that these different data types can be viewed together and in the same spatial context.
Support for building operation, management and maintenance in the wider context of a smart city
On-the-spot data capture of accurate as-built building information models that can seamlessly integrate with existing city plans leads to a data resource that cities can build on to improve safety, security and facilities for their citizens.
So what should the smart city planner be looking for?
Existing geospatial and data management tools already address many of these challenges, and when an opportunity for a technology refresh is presented, the approach to smart city support should be a big part of the mix.
Christine Easterfield
Christine Easterfield is principal analyst for Cambashi. She has more than 20 years’ experience in the software business. Her experience has covered geospatial asset management for the utility industry: assessing market needs and opportunities, managing customer requirements, liaising with development teams and running global product introduction programs.
Previous roles include programming, training, consultancy and product marketing management.
She has worked for a range of companies from multinationals to small start-ups, resulting in an understanding of how different sized organisations operate, grow and manage change. Christine has a BSc in Computational Sciences and an MA in English Literature.
June’s Geointelligence Insider article on Jack Maple was the human interest article. One of the readers of June’s article had the opportunity to meet Jack Maple. I appreciate the feedback. This month’s article is based upon the recommendation of Geospatial Solutions Managing Editor Tracy Cozzens to cover the technical side of GIS and crime fighting.
Recap
Fighting crime with GIS sounds simple enough — map where the crimes are happening and where the bad guys are and send in the cops. That would be a gross over simplification. As always, there’s more to the case.
The first CompStat was founded in the pre-internet days of 1994 on a Commodore 64, harkening back to the days of 128-MB floppy disks and MS-DOS, a Jurassic period of computer evolution that marked some of the first steps into crime fighting’s digital era. The graph above is the current CompStat 2.0 from the NYPD. It is a GIS-based system, interactive, user-friendly and available to the public. Take note of the highlighted number.
Since CompStat was introduced, crime has fallen precipitously. As of this writing (Aug. 25, 2018) New York City has 183 reported murders year to date. By comparison, in 1990, prior to CompStat, there were 217 murders per month on average. More murders were committed per month in 1990 in New York City than what it will experience in all of 2018. Murders have dropped nearly 90 percent. In other words, nine out of 10 who would otherwise have been killed are alive to return to their families, parents, classmates and colleagues, and friends. The difference is staggering, providing tangible proof geospatial science is a benefit to humanity.
The arsenal of geospatial applications available for the crime fighter is enough to make any superhero envious. The list of these high-tech, integrated intelligence systems push the limits of science fiction.
The underlying strength of these systems is the robust GIS/GPS platform they are built on. Security cameras are geospatially connected to the network with dynamic mapping capabilities. This allows the surveillance video to be overlaid on GIS software in order to interact with more information and create actionable intelligence.
Cameras use a host of software algorithms that are able to recognize aggressive behavior, patterns, anomalies, change detection, biometric features, objects and text. Systems can integrate real-time information like social media feeds as well as live video, including facial recognition software scans for wanted individuals in real time. This information is shared with police officers in the field.
Police cars are becoming mobile command centers outfitted with a suite of sensors, and will eventually include drones. Police officers wear smart glasses augmenting information about who they are looking at in an intelligence and location-based context.
The police officer’s belt is Bluetooth enabled, connecting all these devices, as well as monitoring the officer’s vital signs. The officer’s gun is also Bluetooth enabled, reporting when it is drawn, the direction it is pointed and if it fired. The gun also comes with a chip for tracking purposes and to ensure only the officer it belongs to can fire the weapon.
The vest-worn camera is woven into the seamless geospatial network of sensors and records the officer’s experience from a first-person perspective.
Imagine this scenario. A crowd gathers at an intersection triggering an anomaly detection sensor due to the number of people gathering in that location at that time. Out of the thousands of security cameras being monitored at the Command and Control Center (C3), this video scrolls around and flashes yellow, bringing attention to the possible situation. Other mounted cameras that have that intersection in the field of view automatically align along the edge of the main security video projecting their imagery onto a 3D data model of the area. Police officers in the field nearest to that location are simultaneously alerted. No action is taken at this point except the police begin heading in that direction. Facial recognition software scans the video images for faces of known suspects. Social media and texts scroll next to the video and geospatially link to those in each frame of the video. Colored sentiment indicators showed levels of concern. Boxes outlining people in various colors correspond to threat levels determined by datamining multiple databases. Semi-persistent motion trails lag behind each box showing the speed and direction of people in the video. Pattern identification looks for convergence, divergence and synchronous movements.
Video analytics identify several people converging on a car that just pulled up. The license plate reader linked to the security camera reports the car as stolen with two traffic violations. Based on this preliminary information, the situation is elevated. A police officer is dispatched but before arriving, a drone launches from the police car outfitted with a true color camera and a stereographic infrared camera. The stereographic imagery pair is streamed live to the police officers entering the area of interest through their smart glasses and to a team of imagery specialists at the C3. The video analytics of the police drone are seamlessly integrated with the security camera videos focusing on the car and the individuals as it arrives on scene and surveils the area. Object recognition identifies three possible weapons on the persons of interest. The boxes around those individuals turn red. They are tagged for persistent surveillance by all security cameras in the area. The order is given to apprehend them for probable cause. More police officers are called in and before they arrive they know who they are looking for, where the person is located, and that they may be armed and dangerous. In less than a minute, the police arrive. The suspects flee. The drone follows one of them up the street into an alley. Two of the officers pursue him. The other two suspects jump into the car and drive away. License plate readers and security cameras track the car on a map showing the vehicle’s route and speed with corresponding real-time video as the vehicle passes into view of each camera. As the vehicle travels south a police officer steps out from a cross street and shoots an electromagnetic dart into the speeding vehicle, disabling it. The police officers approaching the car shine a disorienting laser light weapon called a dazzler at the suspects, preventing their eyes from focusing. The occupants are apprehended without incident. They are searched for probable cause and arrested for carrying handguns without a permit.
The other suspect fled on foot. The drone followed him relaying live imagery to the police officers’ smart glasses. Their smart glasses showed a real-time map of their locations and the suspect’s. They cornered him in a fenced area. Guns drawn, the smoky red light of the laser cutting through the air pointed at the suspect. He surrendered. No gun was found on the suspect but the drone video the gun being thrown into a dumpster. One of the officers went back and retrieved the gun.
Gun traces were run on the three confiscated weapons and one was identified as stolen, matching a description of a gun used in a recent homicide. One of the suspect’s fingerprints match those found on shell casings at a nearby location reported by gunshot acoustic sensors. Based on this information, there is probable cause and a tap and trace is approved electronically by a special task force judge. The phone records of the three suspects are searched linking them to the el Diablo gang. Several unknown numbers are also in the call logs. Those numbers are added to the case file to be investigated later.
Only one of the suspects has a known address. The other two have no known location. Activity extracted from phone records show their whereabouts over the preceding days pin pointing their main locus of operation. Search warrants are issued. Within hours of arresting the suspects, the locations are raided and searched. Officers discover a cache of weapons, drugs, laptops and other useful information.
Everything described above is already available — it is only a matter of time and money. And, if Dubai is any indication of things to come, police could soon be arriving on hoverbikes.
The police arriving within minutes is key to the success of preventive policing. Time saves lives. The goal is to intervene before crime happens. But how is it possible? Before answering, let’s look at some numbers.
By the numbers
In 2017 almost 84 percent of the population of the United States was considered urban residing within 106,400 square miles. The Bureau of Justice Statistics reports there are only 758,854 sworn officers in the United States. Maintaining the same 84 percent ratio as the population means only 634,847 officers cover those urban areas. Specifically, it breaks down to six police officers per square mile. It is one police officer for every 431 residents except that police, like all of us, work 40 hours a week, have days off, take vacations, etc., so, only one out of every six police officers is on duty at any given time. That is one police officer for every 2,153 residents; however, police often operate in pairs, so 4,306 residents depend upon two brave souls to protect them from danger.
Victims of violent crime are 2.1 percent of the population. In a sampling of 4,306 residents that equals 90 victims of violent crime every year. In the top 10 cities it is far worse. Police officers have an incredible responsibility placed on them and they rightly deserve our praise, support and respect for the dangers they face every day.
Why not more officers you ask? Police protection comes at a cost of $100 billion annually. Our relative safety is not cheap. Crime is a huge expense. Jails, trials, public defenders, prosecutors, judges and incarceration all cost money. Safety is expensive. Budgets are stretched thin. The answer for increased safety and security isn’t more police. The answer is integrated and intelligent technology systems leading to increased efficiency. Technology has benefitted most other professions. Now, the field of law enforcement and crime prevention are benefitting. Cost is the driving need. These efficiencies are being realized on a grand scale. Making matters more urgent is the worldwide mass migration as populations move towards cities. It is imperative to manage crime now rather than later.
Enter predictive policing — putting the power of open data, cloud computing, machine learning, geoscience and artificial intelligence in support of law enforcement and prevention. Basically, cities are broken up into grid patterns, typically 500×500 feet. Within each grid, crime data is compiled using multiple factors and resources, such as historical data, 9-1-1 calls, recent crime reports, and residences of known offenders and parolees. Even considerations such as the time, day of week, celebrations and cyclical events are taken into account. Information derived from security cameras, license plate readers, social media and financial transactions help the algorithm. The algorithms take into account information collected by authorized wire taps, call logs and other confidential sources. The goal of the algorithms are to include all available resources to develop the most complete and reliable dataset upon which the heatmaps base their probabilities. This helps police departments allocate their resources, know what to prepare for and, most importantly, know where to be to protect the public at large.
University of Montana, Research and Training Center (Data: U.S. Census Bureau)
Police tighten their patrols around the hotspots. Throughout their shifts those hotspots are subject to change depending upon new data. Mobile units simply focus their patrol efforts accordingly. Once a threat is reported, automated navigation routing systems show police the fastest route to the incident and their expected time of arrival. Officers continue to receive intelligence about the incident while en route to anticipate the situation prior to arriving. Knowing where the areas of highest probability are expected to occur focuses non-human assets too, such as geofencing the areas of interest and monitoring more closely for key indicators. This technology is not too different than numerical weather forecasting models predicting what and where weather events will occur in the next hour, three hours, six hours and so on. Numerical models continue to evolve making forecasting more and more reliable. And, although the past does not predict the future, it is a strong indicator. The disclaimer would be similar to the ones most have seen before, “Past performance does not guarantee future returns.” Sometimes preventing a crime is saving a life, sometimes it’s protecting property and almost always it is stopping someone from doing something they will later regret. All crime cannot be prevented but for every crime that is prevented there is a family spared from tragedy.
Preventive policing does more than help keep communities safer. It improves economic viability. Crime has an inverse relationship with a community’s vibrancy. As crime increases, prosperity decreases. Real estate values go down, the tax revenue goes down, employment opportunities go down, and safety, happiness and well-being go down. Crime is a societal disease. Reducing crime reverses those affects. Home values, employment, affluence and the quality of life all go up, which correlates to increased tax revenues. Thus, reduce crime and the city’s revenues increase. That means politicians can divert money into other programs to benefit the citizens. For these reasons there is bi-partisan support for computer based policing.
If you do the research you will see opposition efforts against artificially intelligent systems to fight crime, but those opponents are not well supported. Communities want to feel safer. Politicians want to be able to say they are using the latest technologies to keep the community safe. Companies want to prove their systems work in decreasing crime and capturing criminals. Crime prediction causes the greatest concern because it borders on Minority Report, but it is the echo of Jack Maple and William Bratton putting police where they need to be to support the people they need to protect. It is the essence of community based policing.
This article only touches on the front side of GIS and law enforcement, but there is another world on the back side piecing crime scenes together with forensics in artificially replicated environments. That too is a fascinating topic to explore.
Do yourself and your neighborhood a favor. Thank the police officers in your community for the job they do. They are foundational to the fabric of our society.
Esri is updating the ArcGIS Living Atlas of the World, a vast collection of geographic information from around the globe. The updates include new data and capabilities for users to gain insight for helping in decision making, as well as a more complete and dynamic picture of the world.
The new features were introduced at this year’s Esri User Conference, held July 9–13 in San Diego, California.
The new Earth Systems Monitor app, powered by Living Atlas data, showing Sea Surface Temperature. (Image: Esri)
Earth Systems Monitor. This new app (currently in beta) is powered by Living Atlas data. It allows users to see — on a 2D map or a 3D globe — historical, forecasting and real-time data for depicting land, the oceans and even the human footprint.
Users can see where events or phenomena such as marine temperature shifts are occurring at any time on the planet, or even model global population growth and its effects, the company said.
The configurable app will be released later this year. The app can be used with Living Atlas data layers or with other layers from an organization’s own data or ArcGIS Online.
Wayback Imagery. This digital archive of the World Imagery basemap enables users to access more than 80 different versions of world imagery captured over the past five years.
Each record in the archive represents a version of world imagery as it existed on the date it was published. Users can move back and forth in time and choose the imagery they want to use.
OpenStreetMap Vector Basemap. Moving to a local scale, OpenStreetMap (OSM) is an open, collaborative project to create a free editable map of the world, built by a community of mappers who contribute and maintain data about roads, trails, buildings, restaurants and more.
Until now, OSM was only available as a raster basemap in ArcGIS Online. The new vector basemap, introduced in beta, will be available for free to all ArcGIS users and developers.
“The Living Atlas shows how our community of users continues to contribute to the innovations that power our technology,” said Jack Dangermond, Esri founder and president. “The beauty of these new features is that they transform the data that users are supplying into valuable online services like Earth Systems Monitor.”
Living Atlas can be used to create indexes displaying properties such as vegetation health or soil moisture and quantifying the changes over time, enabling better understanding of the environment.
Earth Systems Monitor, OSM Vector Basemap and Wayback Imagery are all examples of how online GIS technology is transforming traditional mapping organizations into web service providers, Esri said. These innovations are just the latest steps in creating a living digital twin of the systems and processes that help run organizations, cities and even nations.
By fostering the adoption of apps, web maps, and collaborative efforts, Living Atlas is supporting end users who face increasing geospatial data demands, enabling them to be self-sufficient with the application of location intelligence across their organizations.
Wayback Imagery is currently accessible, while both OSM Vector Basemap and Earth Systems Monitor will be available soon in ArcGIS Online.
A number of geospatial companies played a key role in the government’s response to the Kilauea Volcano eruption. The volcano on the Big Island of Hawaii began erupting May 3, and while quiet for more than a week, it could resume erupting at any time.
Mapping the flow. As a resident of Hawaii, Brennan O’Neill, Hawaiian branch manager of Frontier Precision, was in a unique position to offer support. Frontier Precision provided free access to technology and expertise to assist in mapping the lava flow.
“I had to help out,” O’Neill said. “It was tearing at my soul. For a geologist, it’s even more powerful than that. The lava flow is like a living mass that has a mind of its own, creeping, glowing — an upside-down conveyor belt surging forward and burning everything in its path.”
Through Frontier Precision, O’Neill offered high-tech mapping equipment, his own expertise, and the help of Nathan Stephenson, an applied geospatial engineer working in the company’s Denver office.
“We used a combination of Trimble R10s and Trimble R8s to gather accurate data points on the ground,” Stephenson said.
This thermal map shows the fissure system and lava flows as of 6 a.m. on Saturday, Aug. 11. The thermal map was constructed by stitching many overlapping oblique thermal images collected by a handheld thermal camera during a helicopter overflight of the flow field. The base is a copyrighted color satellite image (used with permission) provided by Digital Globe. (Map: USGS)
The mapping team flew UAS drones over the flow to gather visual imagery data, matched it to the ground reference points, stitched the photos together and draped it over county maps. The process was repeated as often as needed — daily, and sometimes even hourly — to show the speed and direction of the flow.
Stephenson isn’t new to mapping lava flows. As a graduate student at the University of Hawaii – Hilo, he worked on collecting data on the Pahoa eruption in 2014, and he’s seen advances in technology in just a few years.
“One thing we have now that we didn’t have in 2014 was a thermal radiometric camera that helps us map more accurately at night and enables us to capture large heat signatures.”
The collected data helps Hawaii Civil Defense and other agencies keep the public informed and safe, and in the long term it also contributes to the store of scientific knowledge about eruptions and lava flow behavior.
Lidar image of the Hawaii dataset showing the Kilauea Calderand the Halena’uma’u Crater and within it. (Image: Quantum Spatial)
Airborne lidar insights. Another technology that aids in volcano response is lidar. High-resolution lidar surveys help first responders, scientists and government agencies monitor Kilauea conditions and predict future lava flows.
Independent geospatial data firm Quantum Spatial Inc. (QSI) has conducted high-resolution lidar surveys of areas surrounding the Kilauea volcano eruption in Hawaii.
The emergency response effort was part of the U.S. Geological Survey’s (USGS) Rapid Response Imagery Products (RRIP) in support of the Kilauea’s 2018 East Rift Zone – Remote Sensing Acquisition Requirement.
The USGS Hawaiian Volcano Observatory (HVO), along with emergency responders, government agencies and academics, will use the data to better understand the conditions and characteristics of the volcano, and help planners model potential lava flows, which may better predict and respond to future flows and enhance safety of residents.
The QSI team, which included GEO1 and Windward Aviation, deployed within days to acquire high-resolution lidar at point densities averaging from 40 to 80 ppsm, with up to 150 ppsm in select areas and 100-mp digital imagery using a Riegl dual VUX-1 LR sensor pod equipped with ABGPS/IMU mounted on a Hughes 500D helicopter.
The project required 11 missions over the course of six days, operating at times as low as 500 feet above the ground and above active flows and nearby erupting calderas. With a need for a quick turn around, QSI deployed an analyst with the flight crew to post process each mission within hours of collection.
The data was uploaded to the Geospatial Repository and Data Management System (GRiD) interface, developed by the U.S. Army Corps of Engineers (USACE), where additional data products have been developed and provided to the response team that includes FEMA, Hawaii’s Emergency Operations Center (EOC) and the Hawaii County Civil Defense.
After data collection, QSI measured topographic shifts during the processing by comparing new data with a 2011 lidar collection from the same area. Survey specialists and USGS experts confirmed within hours of processing QSI’s lidar data that areas within the site had shifted up to 1.5 meters east, 2 meters to the north and 1 meter in elevation.
USGS scientists will continue to examine the new topographic data to better understand the nature of these shifts, and integrate it into lava flow models for more accurate predictive modeling.
The eruption in action. Using small unmanned aerial systems (sUAS) together with air-quality sensors, advanced imaging tools and Esri’s spatial analytics and mapping, a team from the Center for Robot-Assisted Search and Rescue (CRASAR) provided real-time aerial views of the eruption.
The five volunteers armed with drones, advanced sensor systems and GIS technologies joined the response effort May 14-19 at Kilauea Volcano Lower East Rift Zone to assist in tracking and predicting the ongoing volcanic eruption. The team supplemented the University of Hawaii Hilo’s (UHH) sUAS capabilities, allowing UHH sUAS operators to focus on geographical and volcanology.
The CRASAR team identified a new fissure not visible from the ground, projected the lava flow rate during the night when manned helicopters were not allowed to fly, and provided ongoing data collection from new thermal sensors technology.
During the six-day Leilani deployment, the CRASAR team flew 44 sUAS flights, including 16 at night, using DJI 200, 210, Inspire, and Mavic Pro drones. Esri’s Drone2Map for ArcGIS together with Hangar’s Enterprise Platform for 360-degree imaging enabled rapid 360-imaging for situational awareness.
DJI’s new XT2 thermal sensor provided unprecedented drone-based air-quality monitoring. Video and data were shared with local first responders using FirstNet, the first high-speed, nationwide wireless broadband network dedicated to public safety.
The CRASAR response marks the first known use of sUAS for emergency response to a volcanic eruption and first known use of sUAS for sampling air quality.
The GIS mapping and imaging technologies responders used on the scene at Kilauea Volcano Lower East Rift Zone are available here.