Tag: GIS

  • U.S. Corps of Engineers GIS Cadre Maps Hurricane Season

    The Army Corps' GIS Cadre working at the Corps' Recovery Field Office in Joplin, Missouri after a multiple-vortex tornado struck Joplin on May 22, 2011. (Credit: U.S. Army Corps of Engineers)
    The Army Corps’ GIS Cadre working at the Corps’ Recovery Field Office in Joplin, Missouri, after a multiple-vortex tornado struck Joplin on May 22, 2011. (Credit: U.S. Army Corps of Engineers)

    When rescue and recovery crews make their way through communities devastated by hurricanes, tornados and wildfires, they need maps to help them to get around safely. One of the most relied on sources of these maps has been the U.S. Army Corps of Engineers, Geographic Information System (GIS) Cadre.

    The cadre has successfully created maps to assist many federally declared disasters since 2002, including Hurricane Katrina and most recently Super Storm Sandy.

    The Corps already had Planning Response Teams for disaster rescue and recovery, including teams to perform temporary housing, power, water and ice missions, and decided a GIS cadre would also be useful. The GIS cadre is made up of Corps employees from throughout the nation who are GIS subject-matter experts.

    Wildfire Damage Maps. (Credit: U.S. Army Corps of Engineers)
    Wildfire Damage Maps. (Credit: U.S. Army Corps of Engineers)

    When a federally declared disaster occurs, the team gets ready to deploy and can be on the ground in just hours, setting up their own equipment even before other agencies are on the scene. At the disaster location, they provide their GIS expertise in support for USACE Emergency Support Teams and for the Federal Emergency Management Agency (FEMA) and other state, federal and volunteer agencies.

    Stephen McDevitt was one of the national action officers responsible for deploying and managing GIS teams during nationally declared disasters. “The GIS takes data from various sources, including aerial photographs and electronic data, and combines these layers of information in various ways to create maps. These maps can be used to perform many different missions and solve complex problems.”

    “FEMA has called us for every major disaster since the team started in 2002,” McDevitt said. These missions have included ice storms, hurricanes, typhoons, tornados, floods, wild fire disasters and could also include manmade terrorist events if needed.

    For these missions, a wide variety of maps have been created to help agencies to make important decisions to support relief and recovery efforts after a disaster strikes. Following are a few of these maps:

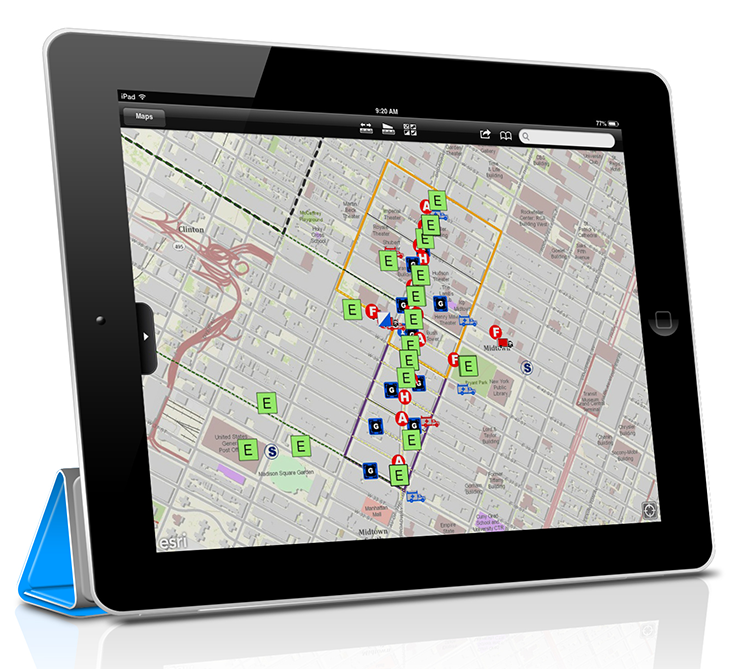
    Rescue & Recovery: The cadre creates maps using geospatial information on where hurricane victims are located so that search and rescue workers can locate and recover stranded individuals.

    Building Temporary Homes & Critical Facilities: Temporary housing and critical public facilities can’t be constructed on flood-prone land. The cadre creates maps that show agencies where there are flood zones. In addition, they create maps that show where there is safe land to place housing and facilities away from the devastation and near water, sewer and electric lines and services, such as schools and hospitals.

    Debris Removal: The cadre creates maps that show field workers the location of debris, as well as clear land to use as staging areas for debris removal equipment. Maps can also show field workers the optimal routes for removing and transporting debris. This is needed when street signs have been blown away and many structures destroyed.

    Pumping Water: The cadre creates maps that show agencies how long it will take for flood waters to subside, using different rates of pumping. The cadre can also take data on the locations and functionality of pump stations to create maps that help agencies figure out how long it will take to pump water out of a region.

    Identifying Impacted Communities: The cadre can create maps that show the locations of damaged homes and businesses. These maps show agencies like FEMA where displaced citizens requiring assistance may be located and where recovery centers should be stationed. The cadre can also create demographic maps so that agencies know where economically challenged individuals may live who do not have transportation to reach the nearest recovery center. In these cases, a mobile center can be sent to these areas.

    Preventing Future Safety & Environmental Problems: The cadre creates maps that can help communities prevent future dangers. For example, in the aftermath of the Southern California wildfires in 2008, the cadre created soil burn severity maps. These maps show where the fires burned the valley the most and where there is soil erosion. These large pieces of hardened soil can cause mud slides during the rainy season, creating dangerous landslides. These maps also show agencies where people should be evacuated.

    Stephen McDevitt, former action officer for the U.S. Army Corps of Engineers GIS Cadre and former coordinator for the Enterprise GIS for the Army Corps' New York District. (Credit: Dan Desmet, Public Affairs, USACE, New York District)
    Stephen McDevitt, former action officer for the U.S. Army Corps of Engineers GIS Cadre and former coordinator for the Enterprise GIS for the Army Corps’ New York District. (Credit: Dan Desmet, Public Affairs, USACE, New York District)

    The Army Corps’ GIS Cadre is unique from other national GIS teams because these individuals are not only GIS specialists, but are also from other disciplines with the Army Corps. These professions include geographers, cartographers, physical scientists, civil engineers, park rangers, environmental scientists and others.

    “Because of this, they bring a lot to the table,” McDevitt said. “We have engineers and hydrologists who use GIS to support district projects. These additional skills are very valuable when it comes to disaster situations. For example, if flood zones need to be identified before temporary housing can be set up; those with both GIS and water resources skills are especially useful for working with this data.”

    He added, “If there wasn’t a GIS Cadre, FEMA would be constantly contacting the Army Corps for information needed during a disaster, pulling Army Corps personnel away from other important projects. By having this specialized GIS team, the team can focus their time and energy to the mission on hand. This is more efficient and makes better use of taxpayer money.”

    McDevitt, a former action officer for the cadre and former coordinator for the Enterprise GIS for the Corps’ New York District, has been active with the cadre since it was created 11 years ago. Now as he nears his retirement he says he hopes the cadre, that is unique from other GIS teams, will continue well into the future. “I am proud to have had the opportunity to serve with the GIS Cadre since its creation. After 30 years of service with the federal government, I can honestly say it has been one of the most rewarding experiences,” said McDevitt.

    McDevitt said that the cadre’s future is bright and he hopes it will continue strong for another decade or more. He says what will contribute to its success are team members who have GIS skills. These skills can come from having experience working with remote sensing, computer-aided design (CAD) and other geospatial data and systems technology.

    There is also an increased need for individuals with advanced computer skills  because many of the new mapping applications are web-based. This includes knowledge of HTML 5, Java and Silver Light as well as good database skills, such as working with Oracle, because the team works with large data sets.

    “The Army Corps’ GIS Cadre stands ready to serve the nation, whenever and wherever there is a need for dedicated GIS subject-matter experts,” McDevitt said.

    McDevitt (Far right) when he was an action officer with members of his GIS Cadre team. (Credit:  U.S. Army Corps of Engineers)
    McDevitt (Far right) when he was an action officer with members of his GIS Cadre team. (Credit: U.S. Army Corps of Engineers)
  • New Esri Book Proposes Changes to U.S. Land Records System

    new-esri-book-proposes-changes-to-us-land-records-system-lgThe latest book from Esri Press provides a comprehensive view of the American Land Records System (ALRS). Modernizing American Land Records: Order upon Chaos examines the history of American land concepts, governance, and records systems and their use. The book considers institutional land record trends and the latest technical developments of location-oriented land data systems such as geographic and land information systems (GIS/LIS). Both the institutional and technical concepts are reconciled in the authors’ proposed design of a modern ALRS  that is consistent with current attitudes, practices, and technological development.

    The book is coauthored by Earl F. Epstein and Bernard J. Niemann Jr. Epstein is professor emeritus in the School of Environment and Natural Resources at Ohio State University. Niemann is professor emeritus in the Department of Urban and Regional Planning and director of the Land Information and Computer Graphics Facility at the University of Wisconsin-Madison.

    Modernizing American Land Records: Order upon Chaos (ISBN: 9781589483040, 216 pages, US$24.99) is available at online retailers worldwide, at esri.com/esripress, or by calling 1-800-447-9778. Outside the United States, visit esri.com/esripressorders for complete ordering options, or visit esri.com/distributors to contact your local Esri distributor. Interested retailers can contact Esri Press book distributor Ingram Publisher Services.

  • Getmapping Aerial Photography Company Posts Strong Financials

    Getmapping has posted strong growth for the 2013 financial year. The recently released financial results showed Getmapping post record turnover and profits on the back of strong growth in both the United Kingdom and African markets.

    Getmapping is a public limited company, and terms itself the UK’s leading supplier of aerial photography, mapping products and data hosting solutions.

    Group turnover was up 34% overall from £3.5m in 2012 to £4.7m in 2013, with the contribution from African operations up 86% on the previous year. Getmapping’s strong performance has also been reflected in its share price which has tripled in the last three years as interest in the company from investors grows, the company said.

    Getmapping has been working hard to extend both the range of products and services that it can offer as well as its global reach. In 2013, for example, Getmapping established a new LiDAR division in Centurion, South Africa, which has enabled it to extend its range of services and provide them across a wider geographical area.

    While the UK remains a challenging market, Getmapping continues to work hard to retain its strong position. As an example, Getmapping, together with Bluesky, was recently awarded a multi-million pound contract for the supply of geographic data to Central Government organizations. The contract, awarded by the Department for Environment, Food and Rural Affairs (DEFRA), covers high resolution aerial photography, detailed 3D height models and colour infrared imagery for the whole of England, Wales and Scotland. Under the new Aerial Photography for Great Britain (APGB) contract, Getmapping and Bluesky can also provide training, consultancy and workshops to contract members.

    “Getmapping delivered strong growth in 2013 across all of our core business streams. The company has invested heavily in new sensor and processing technology and the investment is already delivering strong results which we expect to carry through 2014 and beyond,” said Dave Horner, managing director of Getmapping. “The recent DEFRA contract and winning the aerial photography contract for the Scottish government in 2013 has reinforced our position as the leading supplier of aerial photography services in the UK. The financial results are an endorsement of our strategy, but we won’t be resting on our laurels and aim to continue to improve our performance in 2014 and beyond.”

  • Supergeo Hosts Free Online GIS Courses

    Supergeo is providing free online GIS web courses to support real-world case application of GIS technologies. The courses will introduce GIS software on various platforms, from basic to advanced. Through the courses, users can gain geospatial knowledge and  a comprehensive understanding of SuperGIS software operations and applications.

    Supergeo is dedicated to providing total GIS solutions for worldwide users and enabling personnel in diverse domains to apply spatial technologies on various platforms, including desktop, server, mobile devices, and web services. The courses will cover:

    • Desktop GIS: the use and application of SuperGIS Desktop and extensions, analysis functions in SuperGIS Toolkit, and image data processing.
    • Server GIS: Publishing map services and customizing JavaScript map website with SuperGIS Server, the applications of Mobile SDK, and so on.
    • Mobile GIS: Collecting spatial data with smart devices, recording GPS tracklog, viewing waypoints with Augmented Reality in SuperSurv (for iOS), and more.

    For more information, visit the Supergeo Developer Network website or contact [email protected]

  • Epson Launches Next-Generation Large-Format Color Printers

    SureColor-T-Series-Family-W

    Epson America has introduced its next-generation family of large-format color printers — the Epson SureColor T3270, T5270, T7270, T5270D, and T7270D. Available in both single- and now dual-roll models, the SureColor T-Series features the Epson PrecisionCore TFP print head and Epson UltraChrome XD pigment ink to provide technical, corporate and marketing professionals an unprecedented combination of precision, performance and brilliance, the company said. The new line will be available in September.

    “The next-generation of SureColor T-Series printers were designed based on direct feedback from customers who demand cost-effective, versatile and scalable printing solutions,” said Timothy Check, product manager, Professional Imaging, Epson America, Inc. “The new SureColor T-Series printers not only meet the specific requirements of today’s engineering and scientific professionals, they incorporate the latest in printing technology to create accurate large-format prints well-suited for a variety of projects and applications, ranging from CAD drawings and GIS maps to corporate graphics and retail posters.”

    The Epson SureColor T-Series delivers extreme line accuracy with resolutions up to 2880 x 1440 dpi at incredibly fast speeds — producing a presentation quality D-size plot in as little as 25 seconds, the company said. For increased efficiency, the SureColor T-Series single-roll printers use a horizontal catch basket for enhanced output stacking, while the dual-roll printers feature a high-capacity catch basket for quick retrieval and reduced sorting time.

    In addition, the SureColor T-Series 36- and 44-inch printer models offer an optional multifunction (MFP) module, enabling PC-free full-color scan and copy capabilities — up to 36-inches wide — at best-in-class speeds for added convenience. In addition, ergonomic design with intuitive copy and scan-to-share capabilities ensures seamless integration to maximize workflow performance, Epson said.

    The SureColor T-Series is comprised of five printer models, offering varying performance and feature sets to accommodate a range of printing needs:

    SureColor-T-Series-table-W

    The SureColor T3270, T5270, T7270, T5270D, and T7270D offer a range of value-added features that help lower total cost of ownership and increase productivity, including:

    • Three printer widths: The SureColor T-Series features maximum print widths of 24, 36, and 44 inches, with minimal floor space requirements to fit virtually anywhere.
    • Optional multifunction MFP: An optional upgrade for 36- and 44-inch single- and dual-roll T-Series models, the PC-free MFP Scanner leverages Epson’s REALOID image processing engine to produce crisp color D-size copies in under 40 seconds, and best-in-class color scan speeds up to 6.0 inches per second — maximizing productivity.
    • Epson UltraChrome XD ink: Epson pigmented ink delivers brilliant color and crisp lines on virtually any paper type, as well as truly archival and extremely smudge and water-resistant output; the SureColor T-Series printers are designed to be used exclusively with these specially-formulated inks, and not with other brands of cartridges or inks.
    • Varied ink capacities: To maximize efficiency and keep printing costs low, each of the five ink colors — cyan, magenta, yellow, photo black, and matte black — are available in 110 ml, 350 ml and high-capacity 700 ml cartridge sizes, which can be used interchangeably to accommodate a range of printing needs; all cartridges are front-loading for easy access.
    • Epson PrecisionCore TFP print head: Offers high-performance and consistency for accurate plotting with high-precision line detail and minimum line widths as thin as 0.018 mm, along with variable size ink droplet technology for remarkable photographic print quality
    • Current and future-ready print language: Epson Precision XD printer language sets a new standard for high-performance, high-resolution printing, compatible with today’s latest applications and workflow software
    • Optional internal print server: An internal 320GB print server boosts workgroup productivity by quickly transferring print jobs to free-up workstations; adds print queue management, as well as print job save and reprint functionality.
    • Optional True Adobe Postscript 3 hardware engine: Fastest in-class postscript engine enables direct and hot-folder batch printing and support for secure PDF printing; includes the optional internal print server hardware.
    • Control panel: Full color LCD panel with simple button layout provides quick access to printer features and controls, as well as an intuitive help system for most frequent tasks
    • Professional media handling: Supports virtually any media type in roll or cut-sheet, from plain bond paper to 1.5 mm thick posterboard, for use with a wide variety of print applications.
  • USGS Releases Earthquake Hazard Map

    2014 USGS National Seismic Hazard Map, displaying intensity of potential ground shaking from an earthquake in 50 years (which is the typical lifetime of a building).
    2014 USGS National Seismic Hazard Map, displaying intensity of potential ground shaking from an earthquake in 50 years (which is the typical lifetime of a building).

    To help make the best decisions to protect communities from earthquakes, new USGS maps display how intense ground shaking could be across the nation.

    The USGS recently updated its U.S. National Seismic Hazard Maps, which reflect the best and most current understanding of where future earthquakes will occur, how often they will occur, and how hard the ground will likely shake as a result.

    42 States at Risk; 16 States at High Risk

    While all states have some potential for earthquakes, 42 of the 50 states have a reasonable chance of experiencing damaging ground shaking from an earthquake in 50 years (the typical lifetime of a building). Scientists also conclude that 16 states have a relatively high likelihood of experiencing damaging ground shaking. These states have historically experienced earthquakes with a magnitude 6 or greater.

    The hazard is especially high along the west coast, intermountain west, and in several active regions of the central and eastern U.S., such as near New Madrid, Missouri, and near Charleston, South Carolina. The 16 states at highest risk are Alaska, Arkansas, California, Hawaii, Idaho, Illinois, Kentucky, Missouri, Montana, Nevada, Oregon, South Carolina, Tennessee, Utah, Washington, and Wyoming.

    While these overarching conclusions of the national-level hazard are similar to those of the previous maps released in 2008, details and estimates differ for many cities and states. Several areas have been identified as being capable of having the potential for larger and more powerful earthquakes than previously thought due to more data and updated earthquake models. The most prominent changes are discussed below.

    Students conduct the “drop, cover, hold on” safety procedure during an earthquake preparedness drill. Photo Credit: Jessica Robertson, USGS
    Students conduct the “drop, cover, hold on” safety procedure during an earthquake preparedness drill. Photo Credit: Jessica Robertson, USGS

    Informed Decisions Based on the Maps

    With an understanding of potential ground shaking levels, various risk analyses can be calculated by considering factors like population levels, building exposure, and building construction practices. This is used for establishing building codes, and in the analysis of seismic risk for key structures. This can also help in determining insurance rates, emergency preparedness plans, and private property decisions such as re-evaluating one’s home and making it more resilient.

    These maps are part of USGS contributions to the National Earthquake Hazards Reduction Program (NEHRP), which is a congressionally-established partnership of four federal agencies with the purpose of reducing risks to life and property in the U.S. that result from earthquakes. The contributing agencies are the USGS, Federal Emergency Management Agency (FEMA), National Institute of Standards and Technology, and National Science Foundation (NSF). As an example of the collaboration, the hazards identified in the USGS maps underlie FEMA-sponsored seismic design provisions that are incorporated into building codes adopted by states and localities. The maps also reflect investments in research by academic and other scientists supported by grants from the USGS and the NSF.

    “The standards for seismic safety in building codes are directly based upon USGS assessments of potential ground shaking from earthquakes, and have been for years,” said Jim Harris, a member and former chair of the Provisions Update Committee of the Building Seismic Safety Council.

    “The committees preparing those standards welcome this updated USGS information as a basis for making decisions and continuing to ensure the most stable and secure construction.”

    Key Updates

    East Coast

    The eastern U.S. has the potential for larger and more damaging earthquakes than considered in previous maps and assessments. As one example, scientists learned a lot following the magnitude 5.8 earthquake that struck Virginia in 2011. It was among the largest earthquakes to occur along the east coast in the last century, and helped determine that even larger events are possible. Estimates of earthquake hazards near Charleston, SC, have also gone up due to the assessment of earthquakes in the state.

    Damage to the Washington National Cathedral in DC from the earthquake in Virginia on August 23, 2011. Photo Credit: William Leith, USGS
    Damage to the Washington National Cathedral in DC from the earthquake in Virginia on August 23, 2011. Photo Credit: William Leith, USGS

    In New York City, the maps indicate a slightly lower hazard for tall buildings than previously thought (but still a hazard nonetheless). Scientists estimated a lower likelihood for slow shaking from an earthquake near the city. Slow shaking is likely to cause more damage to tall structures in contrast, compared to fast shaking which is more likely to impact shorter structures.

    Central U.S.

    The New Madrid Seismic Zone has been identified to have a larger range of potential earthquake magnitudes and locations than previously identified. This is a result of a range of new research, part of which was recently compiled by the Nuclear Regulatory Commission.

    West Coast

    In California, earthquake hazard extends over a wider area than previously thought. Most notably, faults were recently discovered, raising earthquake hazard estimates for San Jose, Vallejo and San Diego. On the other hand, new insights on faults and rupture processes reduced earthquake hazard estimates for Irvine, Santa Barbara and Oakland. Hazard increased in some parts of the San Francisco Bay Area and Los Angeles region and decreased in other parts. These updates were from the new Uniform California Earthquake Rupture Forecast Model, which incorporates many more potential fault ruptures than did previous assessments. Recent earthquakes in Alaska, Mexico and New Zealand taught scientists more about complex ruptures and how faults can link together. This insight was applied to California for which approximately 250,000 potential complex ruptures were modeled.

    New research on the Cascadia Subduction Zone resulted in increased estimates of earthquake magnitude up to magnitude 9.3. Deep-sea cores were collected that show evidence within the sea-floor sediments of large earthquake-generated mudflows. Earthquake shaking estimates were also increased following abundant data gathered from the magnitude 9.0 earthquake in Tohoku, Japan in 2011 and the magnitude 8.2 earthquake offshore of Chile in 2014, as those events ruptured along subduction zones similar to the Pacific Northwest zone. 

    In Washington, scientists incorporated new knowledge of the Tacoma Fault into the maps and identified changes to the geometry of the Whidbey Island fault in the northern Puget Sound. Earthquake hazard also increased for Las Vegas because of new science. In Utah, scientists dug trenches to study prehistoric earthquakes along the Wasatch Fault. While the overall seismic hazard didn’t change significantly, detailed changes were made to the fault models in this region and robust data were acquired to hone the assessments. This is valuable since approximately 75% of Utah’s population, including the residents of Salt Lake City, lives near this fault.

    The magnitude 7.9 earthquake in Wenchuan, China in 2008 provided many new records of shaking that are very similar to anticipated future earthquakes in the western U.S., as the fault structures are similar. Previously, scientists did not have nearly as many shaking records from earthquakes of this size.

    Induced Earthquakes — Research Underway


    Some states have experienced increased seismicity in the past few years that may be associated with human activities such as the disposal of wastewater in deep wells.

    One specific focus for the future is including an additional layer to these earthquake hazard maps to account for recent potentially triggered earthquakes that occur near some wastewater disposal wells. Injection-induced earthquakes are challenging to incorporate into hazard models because they may not behave like natural earthquakes and their rates change based on man-made activities.

  • Esri Launches Global Disaster Resilience App Challenge

    Esri and the United Nations are working hard to help communities build resilience to impending twenty-first century disasters. Esri’s Global Disaster Resilience App Challenge is born from the United Nations Office of Disaster Risk Reduction (UNISDR) campaign “Making Cities Resilient: My City is Getting Ready,” and supports the UN secretary-general’s efforts to accelerate actions that build resilience to climate change. Participating developers will create map tools that help communities see, understand, and prepare for a variety of disasters.

    “This partnership with Esri can help bridge the gap between aspiration and implementation,” said Margareta Wahlström, the head of UNISDR. “It puts the latest science and technology at the disposal of those who have joined the Making Cities Resilient campaign.”

    UNISDR launched the Making Cities Resilient campaign to improve land use and urban planning for more than 1,800 participating cities worldwide. These communities have committed to observe UNISDR resiliency recommendations. Esri is collaborating with UNISDR on the initiative and giving these cities access to its developer technology. Esri invites the developer community to lend a hand and use the ArcGIS platform developer tools.

    Esri launched the Global Disaster Resilience App Challenge to help local, regional, and national governments find the tools they need to reach their goals to become resilient. Developers will build apps relevant to UNISDR’s 10 Essentials for Making Cities Resilient. Esri will present a $10,000 award each for the best professional/scientific app and the best consumer/public-facing app. Winners will be announced in mid-September, one week before the Climate Summit to be convened by UN secretary-general Ban Ki-moon on September 23.


  • Topcon Adds Cellular Connectivity to HiPer SR for GIS

    HiPerSR_GIS_Topcon-WTopcon Positioning Group has added a cellular modem option for the HiPer SR for GIS receiver.

    “The integrated modem provides greater functionality for the HiPer SR,” said Jason Hooten, Topcon GIS national sales manager. The unit can now be used as a cellular base station through the MAGNET® Relay option. In addition, the cellular feature allows the receiver to provide a connection to existing data collectors that do not contain internal cellular modems.

    “With the new cellular modem and HSPA (High Speed Packet Access), the receiver not only enables users to easily obtain Spectrum-RTK (Real Time Kinematic) and RTK corrections via the Internet, it also allows it to function as a mobile base station as part of the MAGNET Relay GIS broadcasting service, ‘relaying’ corrections to multiple rovers,” Hooten said.

    “The multiple configuration options make the compact and lightweight HiPer SR extremely versatile for any GIS user,” said Hooten.

    Additional features of the HiPer SR for GIS include 226-channel Vanguard technology with Universal Tracking Channels and Fence Antenna® technology for signal tracking sensitivity and multipath rejection.

  • Colorado County Authorized to Operate Trimble’s Unmanned Aircraft System

    Trimble has announced that Mesa County in Colorado has received a Certificate of Authorization (COA) that will allow the Public Works Department to operate its Trimble UX5 Aerial Imaging Solution throughout the county. A COA is an authorization from the Federal Aviation Administration (FAA) allowing the operation of an unmanned aircraft in a designated area and not for commercial use.

    The authorization is currently required to legally operate a public unmanned aircraft in the U.S. The COA was granted to the Mesa County Sheriff’s Office, who manages the county’s unmanned aircraft system (UAS) operations and has been flying systems since 2008.

    Mesa County’s Public Works chose the Trimble UX5 for a variety of applications including determining volumes and compaction of its county landfill, surveying and monitoring capital improvement projects such as roads and bridges, as well as assist the Mesa County Sheriff’s Office or other county departments, as needed. “With the Trimble UX5, Mesa County is one of the first to benefit from a cutting-edge solution that can change how surveyor’s collect data,” said Frank Kochevar, GPS/Survey Supervisor for Mesa County Public Works. The Trimble UX5 was used by Mesa County Public Works to gather aerial images of the landslide that occurred in Western Colorado in May of this year.

    “Trimble’s goal is to allow geospatial professionals to quickly and efficiently capture and convert existing field conditions into actionable information for their customers. We are pleased that Mesa County will now be able to apply the Trimble UX5 Aerial Imaging Solution to meet their public works department needs,” said Phil Sawarynski, business area director for Trimble’s Geospatial Imaging solutions.

    Mesa County has received multiple COAs since 2008 from the FAA for public safety purposes. This is the first COA issued to the Mesa County Sheriff’s Office that will be used specifically for aerial mapping on surveying and engineering projects, in partnership with the Public Works Department. According to Ben Miller, UAS Program Director for the Mesa County Sherriff’s Office and coordinator for all their COA’s, “In collaboration with Trimble, Mesa County, Colorado continues to demonstrate that small unmanned aircraft are not just a tool to save lives, but a community asset that can help save its citizens tens of thousands of tax payer dollars.”

    The Trimble UX5 is an unmanned fixed-wing aircraft targeted at the surveying, oil & gas, mining, environmental and agriculture industries. The system autonomously captures a series of high-resolution images during flight, which is typically up to 50 minutes covering as much as 2.3 square kilometers (approximately 1 square mile) when flying 120 meters (approximately 400 feet) above the ground. Using Trimble Business Center Office software, images are used to easily generate 2D and 3D deliverables such as orthomosaic images, three-dimensional point clouds and contour maps. The Trimble UX5 enables the collection of large amounts of data, often faster than traditional surveying technologies.

  • Topcon Releases MAGNET Relay for GIS

    MAGNET_Relay_GIS_Topcon-W

    Topcon Positioning Group has added the MAGNET Relay for GIS to its suite of cloud-based solutions software. As a component of MAGNET Field GIS, MAGNET Relay GIS is a mobile base station real-time kinematic (RTK) broadcasting service. The system is designed to allow subscribers to connect a GNSS base receiver to MAGNET Relay via a cellular connection for high-accuracy RTK corrections.

    “The RTK base station can be used by up to 10 rovers, which makes MAGNET Relay a great solution for large scale and highly precise GIS projects,” said Jason Hooten, Topcon national sales manager for GIS products.

    “MAGNET Relay for GIS allows for data to be collected in the field without the need for post processing, and then quickly transferred to the office using the company’s secure, cloud-based MAGNET Enterprise account,” Hooten said.  “Additionally, the service brings real-time network-based corrections to project sites that do not have existing coverage.”

  • PenBay Solutions Launches InVision 1.5 for Facilities Management

    PenBay Solutions Launches InVision 1.5 for Facilities Management


    Photo: PenBay Solutions

    PenBay Solutions, a developer of GIS-based facility management and public safety software, is introducing InVision 1.5 in booth #F116 at the Esri User Conference in San Diego, July 14-17. The new technology will also be featured at the InVision Special Interest Group Lunch in room 28B at 12 p.m. on July 16 at the conference.

    InVision software is built on the Esri ArcGIS platform to help users visualize, analyze and interpret data in ways that reach beyond individual buildings and site maps. InVision bridges the gap between managing exterior and interior built environments by aggregating all facility and infrastructure data from various sources into a single, comprehensive, visual system for portfolio management, operations, and safety and security.

    The 1.5 release of InVision software introduces several new features and enhancements with an emphasis on mobile capabilities. InVision 1.5 introduces mobile viewers for:

    • Space Management: view space types, uses and assignments while in the field to more easily find and understand space use and classification.
    • Asset Management: remotely view utility and asset types, statuses and conditions to more quickly locate and evaluate assets.
    • Campus Viewing: provide information about campus points of interest so employees, residents and visitors can easily find what they are looking for.
    • Security Planning: view security plans – including both indoor and outdoor environments – and share that security information via mobile devices with outside public safety agencies and response personnel.
    • Security Operations: view critical building, floor, space and security asset information in the field to better understand the location and status of security assets in real time.

    “Mobility is critically important to our customers,” said Stu Rich, Chief Technology Officer at PenBay Solutions. “These new InVision Mobile Viewers are just the beginning. We’re in the process of developing mobile applications designed for data collection, data editing and inspection workflows as well. Watch for announcements around those exciting new applications in the coming months.”

    The InVision Secure Event Management Solution supports a range of activities and users throughout event planning, coordination, and operations. With InVision Secure, users can coordinate plan creation, manage the review and approval process, and securely share information that is relevant to the safety and security of events. The solution helped make Super Bowl XLVIII a safe and successful event, according to PenBay Solutions.

    “PenBay Solutions was instrumental in helping us with all the agencies we worked with to gather data, and for implementing a public safety system that met our needs for the Super Bowl,” said Captain Steven Pollackov of FDNY’s GIS Unit. “As we move forward, we will be utilizing this platform more and more.”

  • CompassCom Previews On-the-Fly Geofencing at Esri User Conference

    CompassCom will offer Esri User Conference attendees a sneak peek at advanced asset tracking capabilities in the upcoming version of its CompassTrac software powered by Esri ArcGIS technology. Scheduled for release in late summer, CompassTrac 6 provides Esri users with custom digitizing tools for geofencing applications and map optimization for any electronic device.

    CompassCom will demonstrate the new CompassTrac 6 capabilities in booth #2307 at the Esri User Conference, being held July 14-18 in San Diego.

    “The newest version of CompassTrac will enable Esri GIS users to keep track of their vehicles and high-value assets with greater ease than ever before whether they are in the office or out in the field,” said CompassCom CEO W. Brant Howard. “On-the-fly geofence alerts increase fleet efficiency and improve crew safety.”

    CompassTrac is the software tool that enables Esri ArcGIS users to view the locations and statuses of vehicles and other high-value assets on their GIS map in real time. Leveraging existing Esri architecture and GIS data files, CompassTrac locates addresses and displays vehicle positions, speeds, and heading on the fly using selected ArcGIS data layers as the map background, including satellite and aerial imagery, the company said.

    Over the past 16 years, CompassTrac has provided field service management services for thousands of vehicles operated by organizations involved in public safety, public works, utilities, road maintenance, delivery and transportation.

    The premier upgrade to CompassTrac version 6 is a set of digitizing tools that allows the user to draw a geofence polygon around any feature or area — a street, neighborhood or town — on the GIS map. If any vehicle or asset being tracked by the system crosses the geofence boundary, CompassTrac will automatically send a text or email alert to select users and highlight the vehicle in question on the map display. These geofence alerts occur instantly and on the fly in real time, providing enhanced tracking of mobile resources to help operators manage their mobile work force.

    Now with version 6, CompassTrac is also hardware agnostic. The software will automatically scale, or optimize, its map view to fit on the screens of desktop computers, laptops, tablets and smartphones, giving Esri users the ability to track assets from any location where they have Internet.

    Visitors to CompassCom’s booth #2307 at the Esri User Conference will also view demonstrations of the new CompassLDE Connector, which provides plug-and-play capabilities to link AVL and mobile resource management tracking to the Esri ArcGIS GeoEvent Processor.