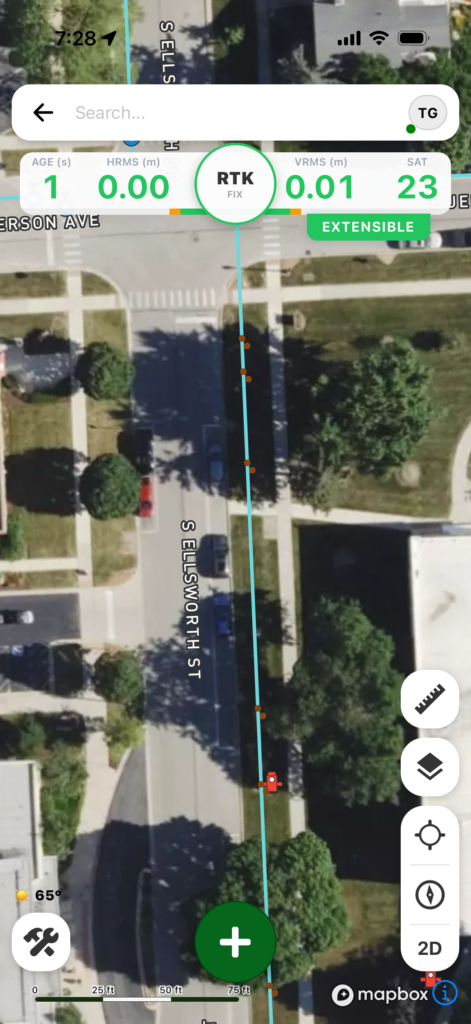
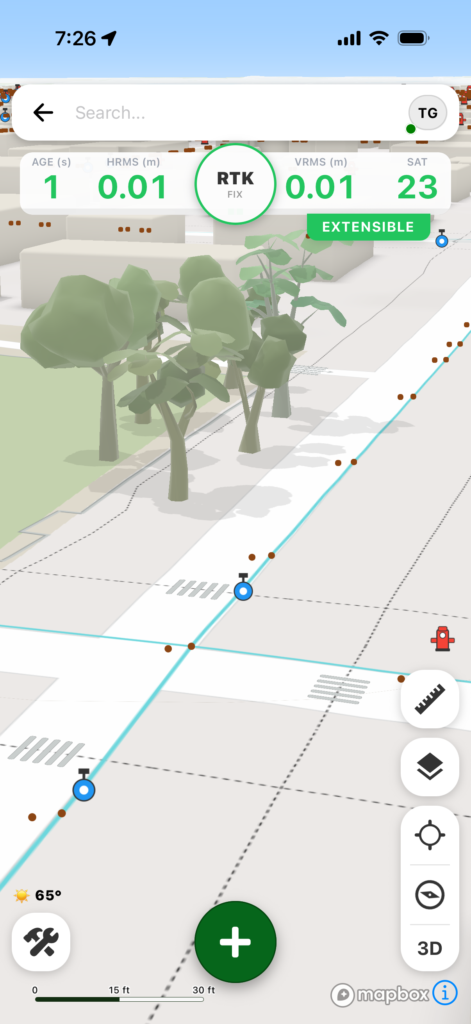
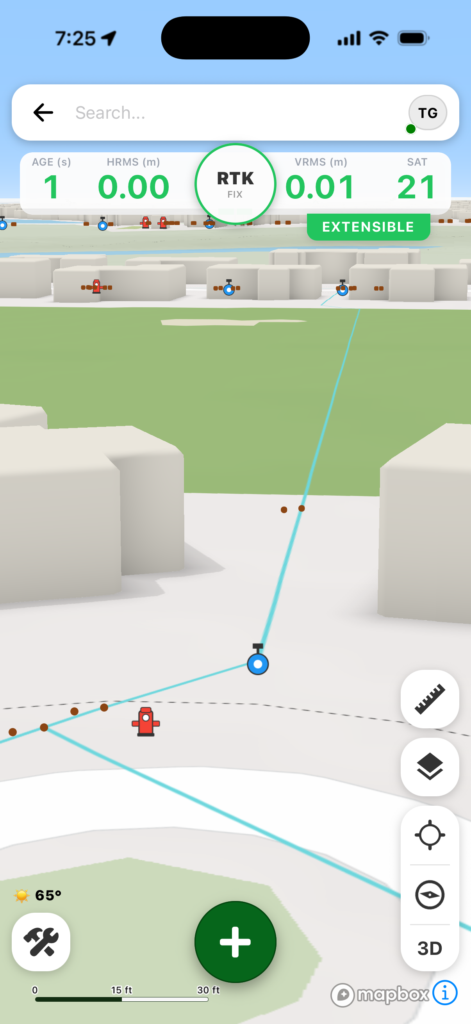
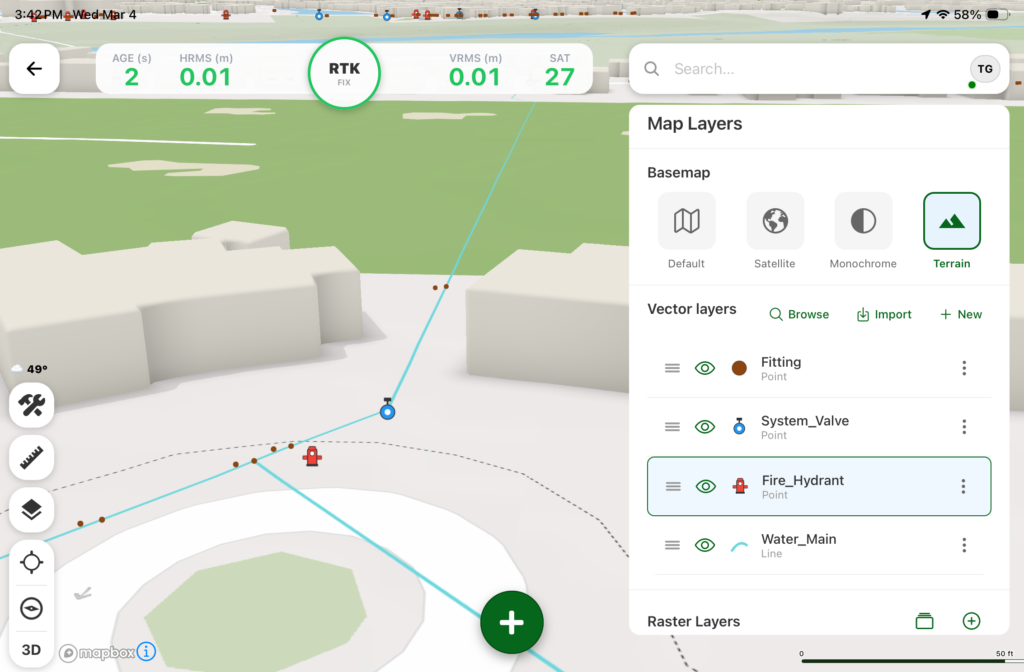
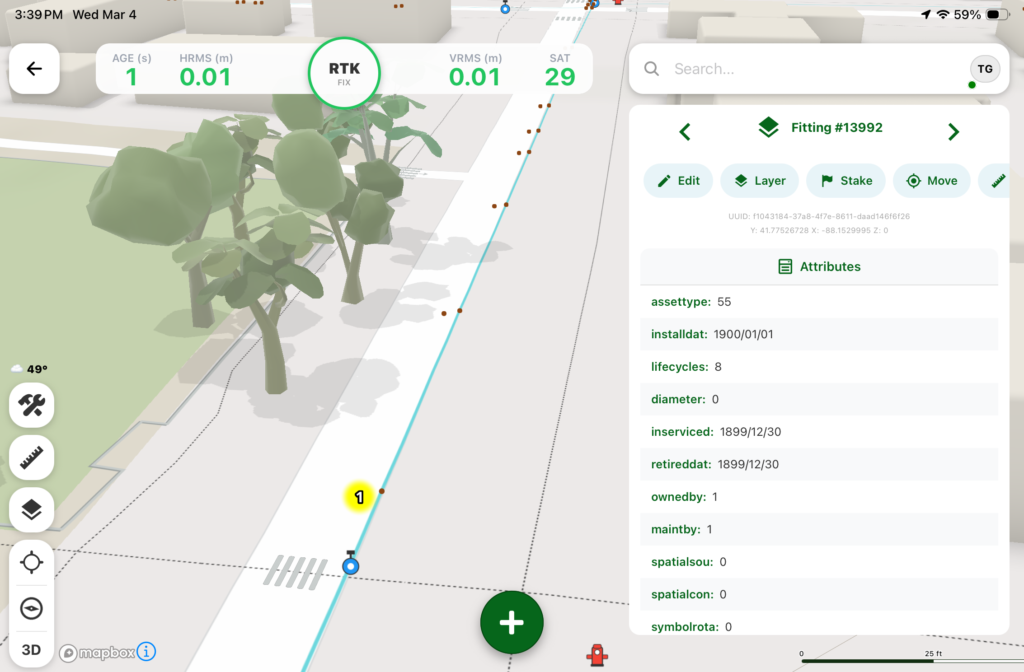
Digital Mapping Group, a pioneer in high-accuracy GNSS solutions for more than two decades, has released FastXY, a powerhouse mapping application for iOS and Android.
FastXY is designed to transform standard mobile devices into professional-grade data-collection tools for geospatial information system (GIS) and architecture, engineering and construction (AEC) professionals.
As the industry shifts away from bulky, proprietary hardware, FastXY offers professionals the ability to collect point, line and polygon data with the devices already in their pockets. Unlike “lite” mapping apps, FastXY delivers advanced capabilities including 3D basemaps, construction staking, topographic surveying, on-the-fly datum transformations, and survey-grade elevations.
Credit: Digital Mapping GroupCredit: Digital Mapping GroupCredit: Digital Mapping GroupCredit: Digital Mapping GroupCredit: Digital Mapping Group
One of FastXY’s most disruptive features is its built-in Bluetooth data parser. This allows users to configure the app to collect data from virtually any instrument supporting BLE Bluetooth or RS-232 — including echosounders, radiation sensors, laser rangefinders, barcode scanners and more — and marry that data instantly with precise GNSS coordinates.
“Our goal to create the most useful GNSS field data collection software for iOS/Android that uses the latest software tools,” said Ryan Skeele, software engineer. “The power of iOS/Android mobile devices increases every year, and we intend to iterate quickly to provide users more powerful solutions in the field.”
Available in two versions: Free and Premium
Essentials (free version)
High-accuracy ready. Works with device internal GNSS or Eos Positioning Systems’ Bluetooth receivers.
Offline-first approach. No internet connection required for field editing/data collection.
Rich visualization. 3D basemap featuring satellite, terrain and building overlays.
Smart logic. Attribute picklists with computational operations.
Survey-grade datum support. Real-time horizontal and vertical datum transformations.
Professional powerhouse (premium version)
Advanced point staking, auto-topographic data collection and cross track navigation.
Hardware integration. Full support for Eos Positioning Systems’ Skadi Tilt compensation and Smart Handle hardware.
Sensor hub. Connect to echosounders, laser rangefinders, barcode readers, radiation sensors, and other instruments with the external instrument configurator.
Advanced field workflow. Import Trimble Data Dictionaries, CAD/GIS files, KMZ/KML, and drone-captured raster imagery.
Post-processing. RINEX data collection and direct OPUS submission for static post-processing.
“We’re excited to offer an app for high-precision AEC users that runs on the mobile device in your pocket,” said Eric Gakstatter, principal GNSS consultant and former GPS World survey editor. “Separately, the unique Sensor Hub feature allows FastXY to consume data from almost any external instrument, combining it with high-precision GNSS data.”
FastXY is available for download today on the Apple App Store and Google Play. For more information, visit fastxy.com.
Digital Mapping Group
Founded 24 years ago, Digital Mapping Group has deployed tens of thousands of high-accuracy GNSS solutions globally. Their expertise spans utilities, public works, AEC, environmental, transportation and government sectors.
Michigan Technological University library and department of social sciences are examining 11,000 historical images of Michigan’s Upper Peninsula (Copper Country), to find precisely where a photographer stood to take the photo.
The location will provide richer information about a place’s surroundings, especially in circumstances where structures or environmental landmarks are no longer present.
The project also will transform how people search for historical images, according to Bob Cowling, the school’s geographic information system (GIS) data librarian. Searching by keyword terms relies on accurate metadata. If there isn’t good data governance from the organization managing the images, then the metadata could be missing important fields.
Donated historical images often arrive without any dates or location information attached to them., but now will be easier to find on a map, making it possible to visualize what was there in the past compared to today.
First UAE government entity to join global geospatial organization
Dubai Municipality has become the first government entity in the United Arab Emirates to join the International GNSS Services (IGS), a global organization specializing in satellite-based geospatial systems, precision surveying, and global reference frameworks.
The IGS supports optimization of GNSS, plate tectonics monitoring, and the calculation of International Terrestrial Reference Frames (ITRFs).
This recognition reflects Dubai Municipality’s continued efforts to strengthen its surveying infrastructure and geospatial capabilities to support urban development, infrastructure planning, and construction. It also underscores the municipality’s commitment to advancing research in geodesy and hydrographic mapping, developing digital navigation maps, and contributing to global knowledge-sharing in the geospatial field.
By joining IGS, Dubai Municipality gains access to the GNSS service and the international reference framework used in scientific, commercial and educational applications. The IGS brings together more than 200 research institutions, universities and agencies from more than 100 countries, offering precise satellite orbit data and enabling high-accuracy positioning and mapping.
“Dubai Municipality’s accession to the International GNSS Services represents a major milestone that reinforces the position of Dubai and the UAE as global hubs for scientific innovation and geospatial excellence,” said Maryam Al Muhairi, CEO of the Buildings Regulation and Permits Agency at Dubai Municipality. “This membership enables collaboration with more than 350 members worldwide, including major scientific organizations and international institutions specializing in navigation, climate studies, Earth dynamics, and advanced surveying applications.”
She added that the membership would contribute to the implementation of Dubai Municipality’s strategic goals by enhancing surveying operations and 3D mapping, integrating research insights into infrastructure and urban planning projects, and promoting a smarter, more sustainable construction sector. It also supports Dubai’s digital twin ecosystem and the emirate’s vision for a globally leading, high-quality urban environment.
Membership will also facilitate collaboration in a range of specialized research fields, including coordinate system referencing, tectonic plate monitoring, Earth rotation studies, navigation systems development, and climate impact modeling.
Wherobots and Felt have entered a strategic partnership aimed at modernizing the geospatial data stack.
The integration combines Wherobots’ spatial intelligence lakehouse and compute engine with Felt’s collaborative mapping platform, connecting large-scale data engineering with interactive, map-based applications. The partnership allows organizations to move from processing petabyte-scale geospatial datasets in the cloud to exploring insights in a collaborative mapping environment without transferring large datasets between systems.
Organizations are handling growing volumes of location-based data, and analyzing that data has historically required specialized GIS software or custom applications that were difficult to connect with modern data systems. The integration lets users create live, interactive visualizations for uses ranging from mapping fields and creating vegetation indexes to building AI-enabled user experiences and automated workflows that monitor climate risks.
Agricultural company puts partnership to the test
Leaf Agriculture, which provides a unified API for agriculture organizations and farms working with telemetry data from tractors and field sensors, is already using both platforms together.
The company uses Wherobots to create data products from a large data lake of agricultural, parcel and tractor telemetry datasets. It recently announced a new product, LeafLake, built on that foundation. Leaf then uses Felt to build interactive maps based on the spatial data processed within Wherobots. Rather than relying on in-person screen-sharing sessions, the team now distributes maps via links viewable from any device. Here is an example of one of Leaf’s interactive maps.
“Wherobots and Felt’s new integration allows organizations to move seamlessly from processing petabytes of raw geospatial data in the cloud to visualizing actionable insights in a browser-based, collaborative environment — all without the friction of traditional desktop-based tools,” said Rachel Zack, chief strategy officer and co-founder at Felt. “For modern enterprises who rely on geographic information, this is the complete, end-to-end spatial data infrastructure that makes working with GIS data at scale finally feel effortless.”
“As climate impacts intensify — from fires to floods — maps are no longer optional; they’re critical tools for understanding a rapidly changing world,” said Mo Sarwat, CEO of Wherobots. “Yet building and scaling them has traditionally required heavy engineering effort, especially for teams working with satellite and drone data. Through our partnership with Felt, AWS users can now access, analyze and visualize spatial data directly from S3, eliminating infrastructure complexity and accelerating decision-making when it counts most.”
For more details, please see the Wherobots blog post here.
Researchers from Finland, Switzerland, Spain and Romania gathered at Tampere University in Finland for a workshop this month within the Robosat project focusing on localization of autonomous machines.
Workshop participants discussed and demonstrated novel technical solutions to improve localization, particularly of autonomous machines operating in challenging and unconstrained environments, such as forests and mountainous regions.
The Robosat project aims to change how autonomous robots navigate in the wild by integrating multi-sensor and multi-GIS data. During the Tampere workshop, partners from Tampere University (Finland),ETH Zürich (Switzerland), Universitat de València (Spain) and CITST (Romania) discussed strategies for sharing data, identifying relevant GIS and GNSS datasets, and leveraging AI for autonomous labeling of large-scale data.
Key topics included the integration of multi-sensor and multi-GIS data to enhance positioning accuracy, planning piloting tests with ETH’s ANYmal robot and TAU’s new I/Q GNSS grabber device, and discussing methods for AI-driven data labeling for massive datasets collected during field trials.
The Tampere University project team includes Elena Simona Lohan and Jari Nurmi as supervisors and Ph.D. students Yelyzaveta Pervysheva and Muhammad Safi.
The Robosat efforts supports applications in robotics, environmental monitoring, and industrial automation. By combining expertise across Europe, Robosat intends to pave the way for smarter, safer and more efficient autonomous systems.
It also aims to provide new open-access rich datasets to the research community. A first dataset enabling multimodal classification studies has already been published on Zenodo as a collaborative work between Tampere University and CITST teams.
The Robosat project
Autonomous robot navigation in the wild using satellite-based 3D geographical information (ROBOSAT)aims to provide a scalable MultiGIS high-quality data collection platform through the use of a quadrupedal robot that can autonomously perform long-distance missions in challenging environments, such as Alpes mountains or Finnish forests.
Consortium organizations are comprised of three universities and one SME:
Tampere University, Finland. Expertise: GNSS, wireless positioning, sensing, and communications, RF Fingerprinting and interference mitigation. Coordinator: Elena Simona Lohan
ETH, Switzerland. Expertise: automation, mapping, control theory, and legged-robot research. PI:Marco Hutter
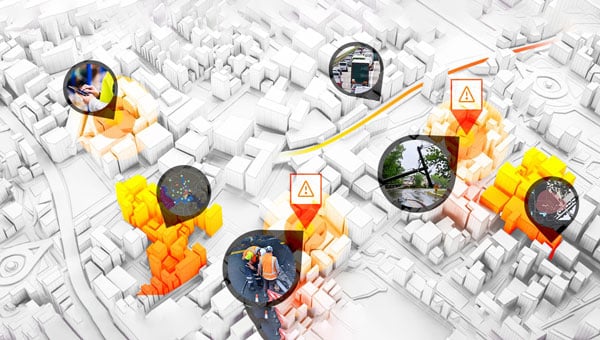
Real-time situational awareness (RSTA) is crucial in numerous fields, particularly in public safety, transportation and emergency management. It enables decision-makers and first responders to quickly assess situations, select appropriate actions and implement plans effectively, ensuring timely assistance and resource allocation.
RTSA is a process of continuously monitoring and analyzing information to understand what is happening in a given environment. Virtually every owner or operator has a need for this, although the data that may be relevant varies.
RTSA refers to the ability to understand your environment and act appropriately. This will enable response to events as they unfold, using integrated data from various sources to enhance decision-making and operational efficiency. [1]
While real-time situational awareness is desired by various entities, it should be noted that it does not come from a single data point, as a single data point is not sufficient. There need to be locational, temporal and informational elements present to draw reasonable conclusions. One promising tool enabling this improved decision-making is the geographic information system.
Real-Time Geographic Information System
GIS is a technology that connects data to a map, integrating location and descriptive information. GIS helps users understand patterns, relationships and locational context, and supports decision-making in various industries.
A real-time GIS can create situational awareness because of its ability to simultaneously ingest, integrate, analyze and display streaming data from most any sensor, device and social media. GIS and location-based analytics can automatically refine and focus real-time data to accomplish the mission with up-to-the-minute intelligence on what’s happening in the field and across agencies and governmental jurisdictions. That’s why police, fire and emergency management organizations at all levels of government use real-time GIS capabilities in their operations and dispatching centers.
Building Robust New Layers is Key
As the duration — or reach and impact — of an emergency event increases, so does the number of agencies involved in responding to and mitigating that event. This requires communication systems to scale accordingly, ensuring seamless information exchange and communication among those agencies.
A significant obstacle to this essential communication is the lack of interoperability, with data interoperability playing a critical role. Data interoperability is the ability of different systems, devices or organizations to share digital information so they can communicate and work together effectively. Without this interoperability, organizations face delays in decision-making, reduced response efficiencies and challenges in coordinating incident management.
The Cybersecurity and Infrastructure Security Agency published the Information Sharing Framework as an approach to address the data interoperability challenge. It puts forward a three-layer framework that presumes:
a data layer, which resides with an individual agency in its nonsharable silo;
a presentation layer, which is the end user who needs to see the data in context for real-time situational awareness and decision-making;
and sandwiched in between is an integration layer, which does the necessary translation between the data and presentation layers in which the data is discovered, accessed, exchanged, analyzed and transported to the end user. [2]
For RTSA, the system must be able to access the relevant information in the data layer, to transform and standardize that data such that it can be augmented with other data to create actionable information that can be pushed or pulled into the presentation layer to inform the end user. This information will answer myriad questions about the situation such as when, where, who and what.
Radio Frequency Real-Time Situational Awareness
In today’s world of autonomous vehicles and swarms of drones, the electromagnetic spectrum is becoming a critical part of situational awareness. Both in knowing what spectrum is available for use and what spectrum needs to be defended or excluded due to willful interference.
Even in the context of space, RF spectrum data can help monitor satellite communications and detect anomalies, providing a more comprehensive understanding of the space environment and its potential threats.
The RF spectrum frequencies range from 3 kilohertz to 3 THz (which spans 3 KHz up to 3 billion KHz). Radio waves, part of the RF spectrum, are regulated by national laws and coordinated by the International Telecommunication Union to prevent interference between different users.
Radio frequency real-time situational awareness involves the use of radio frequency data and sensors to monitor, analyze and understand this environment. It is crucial for operational planning where the electromagnetic spectrum is a critical domain.
Its ability to provide real-time awareness of radio frequencies is critical to building an actionable picture of what are very dynamic environments. For example, recognizing the critical nature of an incident as it escalates from a local situation to a regional one.
Under the Hood
Effective spectrum monitoring devices rely upon modern developments in software-defined radio (SDR) technology that facilitate rapid reconfiguration and adaptation for various tasks. These include significant enhancements not only to computing capabilities but to the neural processing unit capacity as well. In part, to facilitate RF bandwidth pattern of life technical capability including time frame to gain specific insights.
Various capabilities are also expected to emerge in the coming years associated with situational awareness that may have a significant impact on the effectiveness, safety and health of especially the first responder community. The internet of things, cameras, data from other applications and networks, and sensors continue to produce increasing amounts of data. Artificial intelligence and data analytics are envisioned to be increasingly important mechanisms to assist in enabling timely and more informed decisions.
Multipurpose Remote Sensors
RF devices used for assured positioning, navigation and timing(A-PNT) most naturally are able to provide RF mapping for situational awareness. The same RF spectrum mapping that gives operators the tools to see real and potential frequency interference and usage. Just as GIS helps provide real-time situational awareness in the physical world, spectrum mapping provides RF real-time situational awareness in the virtual world. Different data, different tools, but the same need and general approach.
Such multipurpose devices could further contribute to helping build RF situational awareness to include information about emitter identification and locations core to RF mapping. Or RF-based sensors could be able to use signals such as those used by tactical radios, once their location is established.
This fulfills the vision that these RF devices, for example, could be positioned to support RF multiple aspects of situational awareness when not performing their primary mission.
This requires RF real-time situational awareness to be integrated into operational frameworks to allow for better decision-making, improved safety and enhanced capabilities in both military and civilian applications. By leveraging RF data in multiple ways, organizations can fill gaps in traditional monitoring techniques, leading to a more robust understanding of the operational landscape. RF real-time situational awareness is a critical capability that enhances operational effectiveness using advanced sensing technologies and data analysis, particularly in complex environments.
Poised for a New Generation
A key element for the aforementioned presentation layer is to provide the same data to many, although specific locations, referred to as narrowcasting (think narrow multicasting). A new company, EdgeBeam Wireless, is building a next generation broadcast system to provide these services largely referred to as datacasting. Powered by the broadcast industry’s latest ATSC 3.0 standard, this new service will make its datacasting compatible with standard IP networks, fiber networks and mobile 3GPP networks. It could be used for very efficient geolocation delivery of all real-time situational awareness data to many specific locations. [3]
A good example of an RF-based terrestrial platform is MerlinTPS. This terrestrial positioning system provides 100% terrestrial, RF-based assured positioning, navigation and timing. As part of its operation, the system naturally makes a spectrum map within the radius of each of its reference units. For example, coverage of the entire U.S. would take about 200 reference units, plus about 100 backup units. This RF spectral map is updated with one-second iterations, keeping the data up to date for any unfolding spectral and terrestrial events.
The MerlinTPS platform is based on modern-day SDR technology, ideal for flexibility of RF spectrum presence, as well as the growing use of AI. This feature then naturally could be used to create and maintain a total spectrum map and pattern of life.
The platform supports high-precision time transfer of plus or minus 10 ns, critical to A-PNT today, along with positioning and navigation services. The platform can also provide geolocation data for modern real-time GIS features needed for this new generation of real-time situational awareness.
The combination of MerlinTPS with use of the ATSC 3.0 pending EdgeBeam Wireless service could provide the highly full-featured capabilities to fuel the newest generation of real-time situational awareness networks.
ProStar’s PointMan software will now be bundled with Bad Elf’s high-precision GNSS receivers for worldwide sales. PointMan Precision Mapping provides a powerful cloud and mobile precision mapping solution to surveyors and geospatial intelligence systems (GIS) professionals.
This strategic partnership expands the market reach of both companies and directly addresses the growing demand for a complete mapping solution in the utility and critical infrastructure industries.
By combining Bad Elf’s advanced GNSS receivers with ProStar’s patented precision mapping solution, utility owners, contractors, municipalities and engineering firms are able to capture, record and visualize the precise location of critical infrastructure at a low cost and with a complete solution.
Bad Elf delivers accurate, compact, lightweight and cost-effective GNSS solutions compatible with a broad range of third-party vendors. Together with PointMan, the bundled solution provides customers with a comprehensive, ready-to-deploy precision mapping solution designed to reduce costs, improve efficiency and accelerate industry adoption.
The survey is designed to gather information from organizations using GIS technology, to learn about how they organize and GIS, and provide services to their users.
All respondents will receive a report of survey results.
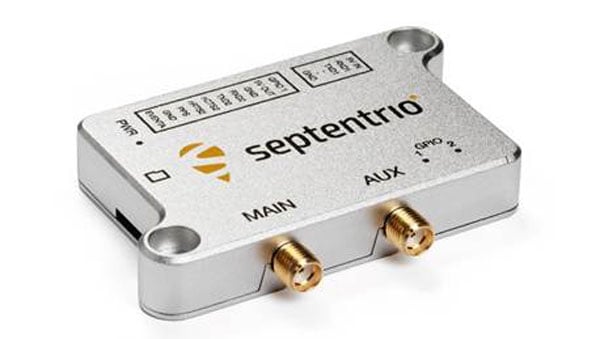
Septentrio, part of Hexagon, has started volume shipments of its mosaic-G5 modules. Measuring 23 mm by 16 mm and weighing 2.2 g, mosaic-G5 enables reliable positioning without performance compromises for commercial UAVs, robots, geographical information system devices (GIS) and many other size and power-constrained industrial applications. The company’s GNSS technology provides enhanced positioning availability in challenging environments where signals are degraded or obstructed.
“We have had a lot of interest in the mosaic-G5 module series since its announcement earlier this year. After successful beta testing with various customers, I am pleased to say that we have now started shipping volume orders,” commented François Freulon, director of product management at Septentrio.
The mosaic family offers users a range of receiver modules to balance performance and cost. The quad-band mosaic-G5 P3 and the triple-band heading module mosaic-G5 P3H provide positioning availability in challenging environments for applications such as mapping or light show UAVs. The modules complement the mosaic product line, including the mosaic-X5 receiver, which the company positions as a benchmark for GNSS open-signal anti-jamming and anti-spoofing² resilience in a small form factor.
The mosaic-go G5 evaluation kit is available through the Septentrio webshop for testing and prototyping. It offers direct autopilot connections, and the free RxTools user interface assists with setup and evaluation.
Septentrio will showcase the mosaic-G5 modules at Intergeo in Frankfurt, Germany, Oct. 7-9, in Hall 12, Booth 114.
Geoinformation has evolved from a specialist tool to an essential resource for government, business and civilian use. Whether captured from space or drones, analyzed through artificial intelligence (AI) or 3D visualizations, geographic data now, more than ever, drives critical decisions across industries.
INTERGEO 2025 exemplifies this transformation. From Oct. 7-9, the Frankfurt Exhibition Center will host the world’s leading conference and trade show for geodesy, geoinformation and land management, featuring more than 500 international exhibitors ranging from innovative startups to industry giants.
Three-Day Conference Program Features 100 Sessions The INTERGEO Conference will present approximately 100 presentations and sessions over three days, drawing speakers from space agencies, United Nations organizations, government ministries and international technology companies.
Key topics include AI-powered remote sensing, urban digital twins, open data strategies, Earth observation for climate and crisis management and building information modeling (BIM) integration for infrastructure lifecycle management.
Keynote presentations such as “Earth Observation and Artificial Intelligence” and “Cartography for the Future” will provide forward-looking insights, while panel discussions on digital sovereignty and standardization will address strategic frameworks. Each session demonstrates how geoinformation serves as the critical foundation for climate adaptation, disaster preparedness, urban development and infrastructure protection.
Opening Day Features Space Technology Focus
DVW President Prof. Rudolf Staiger will open INTERGEO on Tuesday, Oct. 7, followed by a keynote from Johann Dietrich Wörner, space coordinator for the state of Hesse. His presentation, “Earth Observation and Artificial Intelligence,” will explore how AI transforms massive Earth observation datasets into actionable insights for climate, agriculture and urban planning projects.
Prof. Serena Coetzee of UNU-FLORES will deliver the German Cartography Congress keynote on Wednesday, Oct. 8, addressing cartography’s evolution amid growing geodata volumes and governance challenges.
Thursday morning’s panel discussion, “Digital Transformation – Perspectives, Trends and Theses,” will examine the need for reorienting geoinformation management to foster innovation and collaboration.
Revolutionizing Geospatial Data Analysis
AI is accelerating the transformation of raw data into actionable insights, fundamentally changing how professionals work with geoinformation. The session “AI-Based Analysis of Remote Sensing Data for Updating the ATKIS Basic DLM” demonstrates practical applications in public administration.
The Hessian Administration for Soil Management and Geoinformation uses AI methods to automatically detect landscape changes, significantly improving the quality and timeliness of digital landscape models.
Urban digital twins are rapidly advancing from static models to powerful operational platforms. The session “From Data to Insights: Visualization Technologies for Next-Generation Digital Twins” will showcase how modern visualization makes complex systems accessible and accelerates planning processes.
The research project “DigitalCities4Us” illustrates practical applications, using high-resolution 3D data to enable barrier-free urban planning and improve accessibility for people with mobility restrictions.
Additional sessions will examine implementation across administrative levels. “The Digital Twin NRW: A Practical Report” presents a statewide geospatial data infrastructure that is freely accessible and continuously developed. The city of Zurich will demonstrate its transition from traditional geospatial data infrastructures to multifunctional twin platforms.
Geodata infrastructures, open data and data spaces form the backbone of digital transformation and serve as key prerequisites for digital sovereignty. Multiple sessions will emphasize the importance of stable, future-ready geodata infrastructure.
Standardization receives particular attention through presentations like “Three Perspectives, One Goal: Digital Sovereignty through Open Standards in BIM and GIS” and the position paper “Official Geodata as a Basis for Digital Processes in Planning, Construction and Operation.” These sessions demonstrate how uniform standards for data exchange between geographic information systems and building information modeling can accelerate planning, construction and operational processes.
The position paper represents a joint initiative of buildingSMART Germany, the Working Committee of the Surveying Authorities and the Federal Association of Publicly Appointed Surveyors.
Critical infrastructures require precise, reliable data to minimize risks. The presentation “Regional and Effective Flood Protection in the State Capital of Düsseldorf” demonstrates how geoportals and flood forecasting tools prevent flooding and strengthen urban infrastructure resilience.
Bringing Innovation to the Exhibition Floor
Registration is now open at the INTERGEO website. The INTERGEO 2025 team looks forward to welcoming attendees to the Frankfurt Exhibition Center from Oct. 7-9.
Throw a dart at a map of Tennessee. You will probably hit somewhere that is growing. Nashville’s outskirts are projected to add a quarter to their population in the next 15 years. The Ford Motor Company has begun construction on the BlueOval City manufacturing plant outside of Memphis. A multibillion-dollar uranium enrichment facility has broken ground in the Knoxville exurbs.
Tennessee growing at double the rate of the rest of the U.S. does not surprise anyone who issues residential building permits in the state. Inspectors at the Tennessee Department of Environment and Conservation (TDEC) saw requests for subsurface sewage disposal system services jump 18% in one year. “It’s a monumental, staggering rate to grow,” said Steve Owens, the TDEC environmental consultant tasked with expediting service delivery across the state.
Owens, a meteorologist by training, hydrologist by virtue, and self-taught geographic information system (GIS) engineer by practice, streamlined the work of TDEC inspectors with enterprise GIS technology. With it, a team of fewer than 100 inspectors processed over 23,000 requests last year in Tennessee’s rural fringe communities.
Designing a System Around How Inspectors Work
About one in five Americans lives in a home that relies on a septic system. They are built in remote areas too far to connect to municipal sewage systems, which happen to be the places where Tennessee is growing the fastest. High demand for housing created a sense of urgency to issue permits as swiftly — and as safely — as possible.
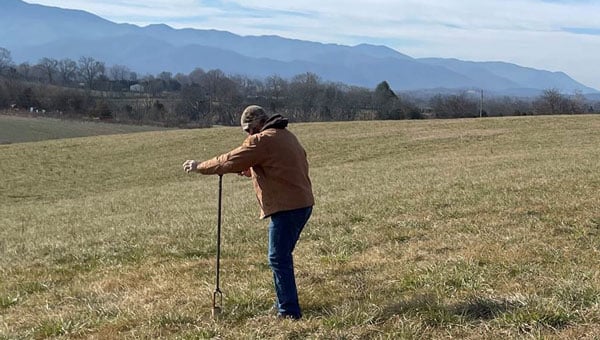
Owens spent his early career in a truck as a septic permit inspector. “It’s hard work,” he said from his Memphis office. “You’re dealing with outdoor conditions all day and you’re never working fast enough.”
Inspectors often eat lunch in their trucks while driving to their next site. The septic systems that they design, permit and inspect treat wastewater from homes and businesses. These systems must be well suited to the specific soil conditions of the land to work properly. When evaluating proposed subdivisions, inspectors conduct a range of fieldwork assessments — such as soil profiles, percolation data, and absorption rates — all while answering calls from the public.
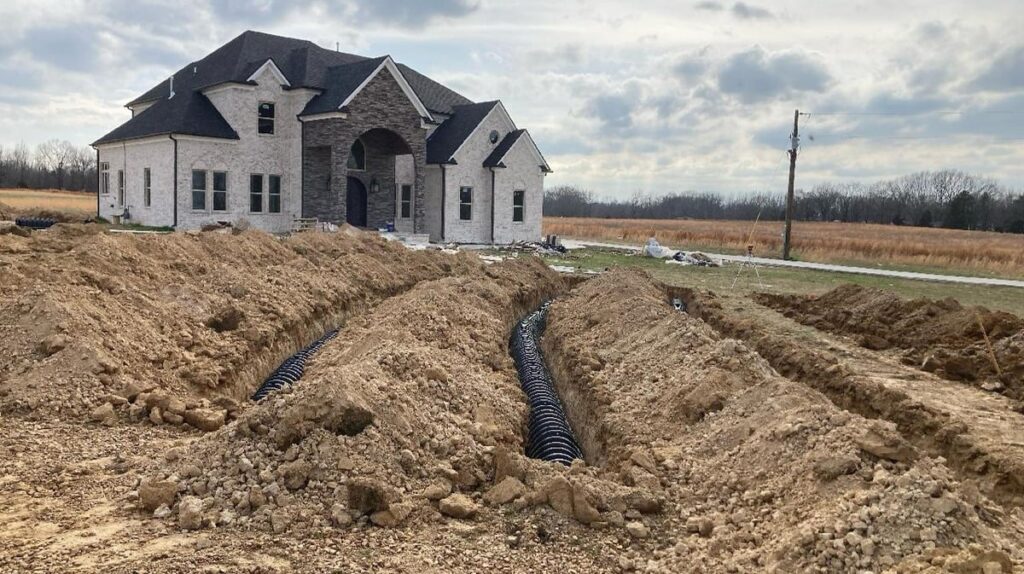
Inspectors assess whether a new septic drain field meets state regulations before the property can be occupied.
A malfunctioning or ill-fitted septic system can pollute wells of drinking water and springs. Foul-smelling sewage can pool on the surface, creating a breeding ground for parasites, mosquitoes and other vectors that can spread pathogens to neighbors and pets.
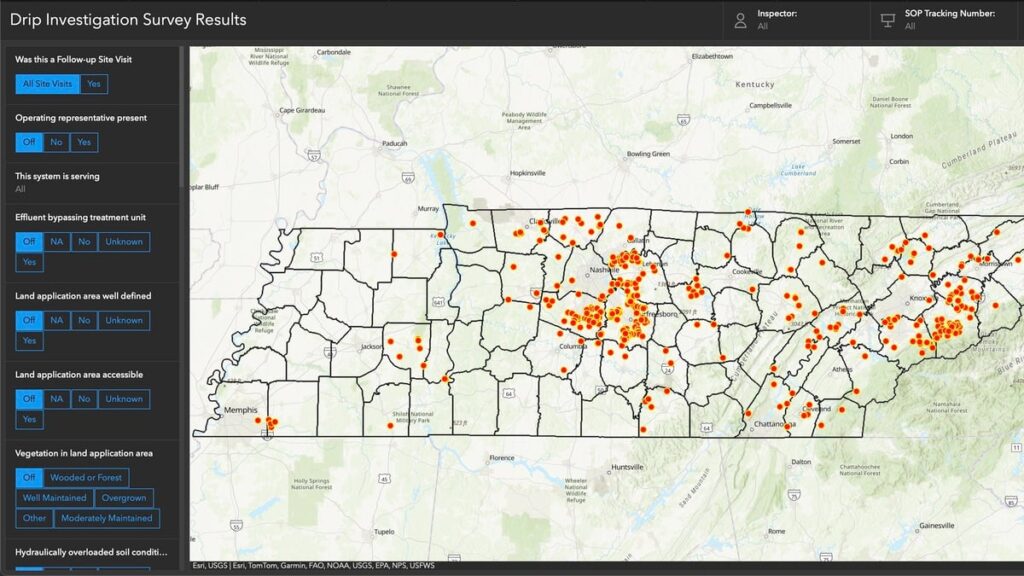
A June 2024 TDEC audit of drip dispersal systems documented more than 400 site visits in a short time frame. Inspectors used an ArcGIS enterprise program to compare standard observations and record site-specific notes and photographs at each site. Results are filtered and displayed on an interactive map.
The audit represents a fraction of the work that TDEC permit inspectors do. Complaint investigations, repair designs, and expansion assessments are among the 13 different types of services inspectors deliver each day. To modernize, Owens configured an enterprise GIS to manage the full scope of operational data for those services—from how residents make requests, to how inspectors execute the work and get documentation to the customer, to how management reports progress.
“It’s different from the typical mapping and analysis you might associate with GIS,” Owens said. “We’re utilizing ArcGIS Survey123 and ArcGIS Dashboards to create an efficient ecosystem for what we do with our work and how to get that work out to the public.”
The drip dispersal system audit documented all results from more than 400 site visits.
A “Flintstones to Jetsons” Digital Transformation
As recently as seven years ago, Tennessee septic permit data existed entirely on paper. Pulling a permit meant driving to a state office in the county seat and making photocopies. Digitization came with an announcement from the governor that made headlines across the state. Trucks hauled away filing cabinets full of septic records, and technicians scanned their contents to create a FileNet public document system of record. “We have gone from Flintstones to Jetsons in the last decade,” Owens said.
In the past, permit requests came to TDEC inspectors as a list of addresses and contact information. Inspectors started each day punching addresses into online mapping sites, guessing at an efficient route. Their days ended back at the office to log their time, update templates, and input data into various spreadsheets.
In high-growth counties, where multiple inspectors collaborate to tackle a significant workload, they often duplicated efforts. “It would not be uncommon for someone to go out to a site on Wednesday, and the next guy would go out there on Friday and not know the work had already been done,” Owens said.
Owens considered the extensive manual processes involved in permit inspections. Having used GIS technology for environmental impact assessments for other TDEC projects, he knew the work could be automated. “We had already been using mobile GIS tools for some time at that point, so staff were used to it,” Owens explained. “I thought we could utilize a lot of the tools that Esri already has built in and customize it a little bit to meet our needs.”
Conversations with TDEC managers confirmed the hunch. Inspectors were spending up to two hours each day planning their routes and logging what they had done. “It ended up being somewhere about 34,000 hours a calendar year just figuring out where we’re going and tracking what we do,” Owens said.
The project to upgrade the workflow with GIS would pay for itself in eight months if they could cut the tracking and logging time in half.
Automating Data Editing and Management Workflows
Owens envisioned a system that would link service requests to jobsite workflows. He designed configurable applications for inspectors to use for data collection. Permit and inspection data would integrate into an enterprise geodatabase that serves as a source of truth for TDEC septic service requests. The database would sync to the public document viewer.
In the new GIS-based system, residents and developers make permit service requests by filling out an online application. The system then locates the request, assigns an inspector, and sends the appropriate form that guides the inspection work. Inspectors check the boxes, record the test results, upload photos and drawings, and issue letters and certificates—all from tablets in the field.
Inspections in the queue now appear on a shared map.
Submitting the completed permit or inspection through ArcGIS Survey123 generates PDFs that automatically go to the applicant, TDEC staff, and the database that syncs to the public site.
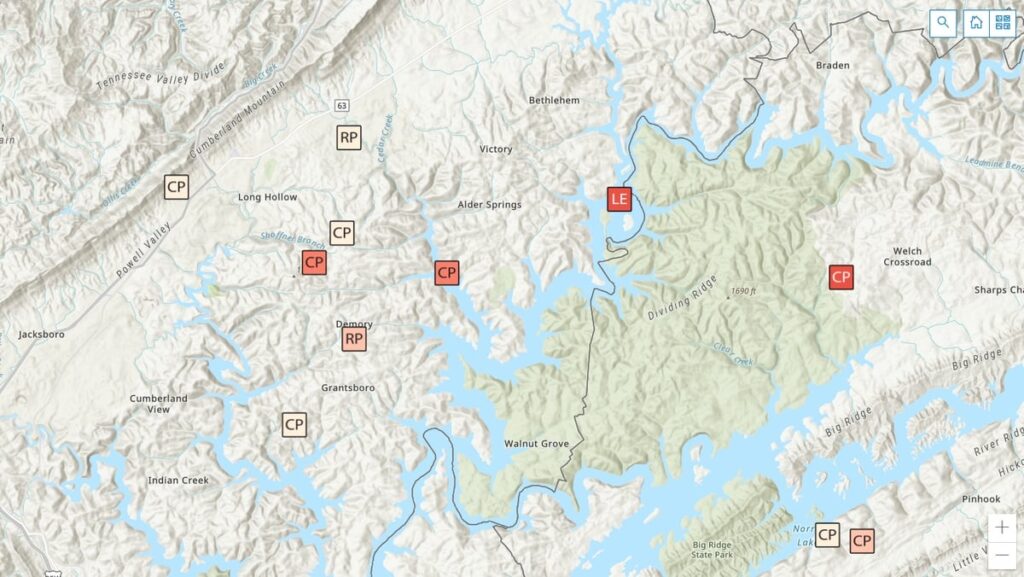
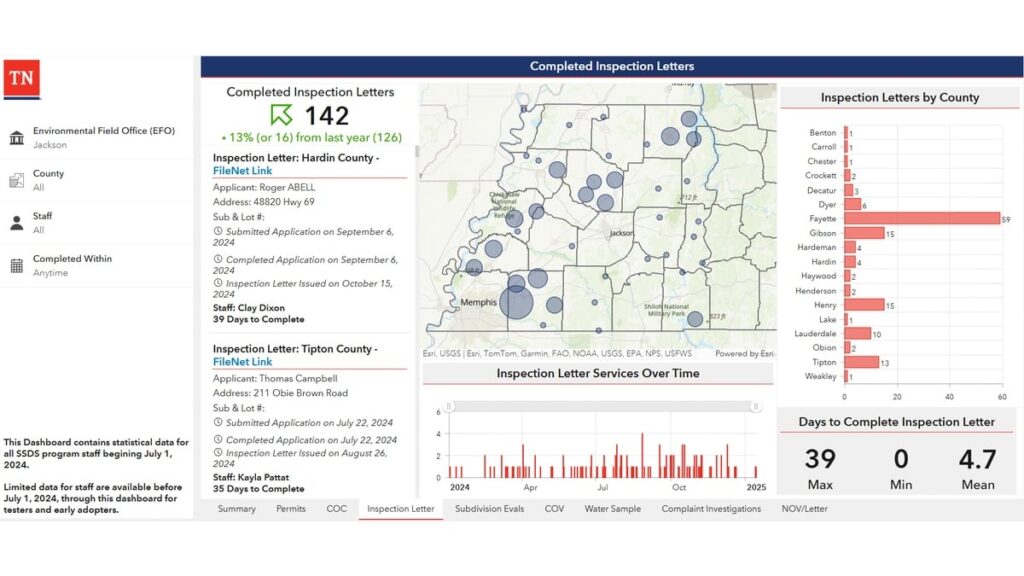
“The real gem is for staff to be able to plan their day by using a map instead of entering all that data into online map tools and seeing what they come up with for their route,” Owens said. The map is part of a real-time operations dashboard with hundreds of requests dotted across Tennessee.
Points colored with darker hues alert inspectors to older requests—fees are waived if they are not completed within 45 days. All the related information—requester contact, location data, violations, resolutions, test results, and historical records—is organized by location. “This used to be done in spreadsheets and file cabinets so it’s a huge time-saver,” Owens said.
TDEC staff now have a completed inspection report that details their work across the state and allows managers to keep an eye on the completion rate.
When management sees clusters of requests on the map, they know it is time to reallocate resources. “They can pull in inspectors from other counties to get the work done, and then go back to normal workload,” Owens added.
Management watches a splash page that tabulates completed work to keep a pulse on field staff and avoid backlogs. They can drill down on how long specific tasks are taking, and view performance metrics for individual staff members. They pay close attention to the average number of days it takes to issue permits. If the times go up, they have the data to bring to the budget office to justify hiring more inspectors.
Amid Tennessee’s building boom, officials face intense pressure to keep pace and deliver high-quality results. Modernizing their permitting and inspection system has provided TDEC with tangible efficiency gains to present to legislators and the public.
“This was a major investment in our division, and we want to let them know that, ‘we hear you,’” Owens said. “We can show how much work that we have done to address those concerns, and the output speaks for itself.”
This year, TDEC was awarded honorable mention by the Environmental Council of the States (ECOS) in the State Innovation category for their septic permitting modernization project.
In February 2024, Vision Pro, Apple’s long-awaited extended reality (XR) headset, hit stores. It is Apple’s stab at the consumer XR market, but XR is not how Apple describes it. Instead, when it was announced last summer, Apple CEO Tim Cook said the headset marks the dawning of the era of spatial computing. “You’ve never seen anything like this before,” he added.
Greg Milner
That is not quite true.
The term spatial computing dates to the 1980s. Its modern definition entered the lexicon in 2003. Simon Greenwold, a graduate student in the Program in Media Arts and Sciences at the Massachusetts Institute of Technology (MIT), described spatial computing wherein a human interacts with a machine, and that machine retains and manipulates referents to objects and spaces in the real world.
But spatial computing extends back even further. It has been the cornerstone of geographic information system (GIS) technology since the software programs debuted in the late 1960s. Indeed, the theoretical foundation of GIS is that it is not only possible but inherently useful to retain and manipulate real objects within some form of virtual space.
In the first GIS programs, virtual space was synonymous with cartographic space. Spatial computing means using maps to organize large amounts of data in a visually intuitive manner.
The Roots of Spatial Computing
Early geospatial technology pioneers applied the concepts of such theorists as Ian McHarg, who described the world as a series of layers of information that exist and interact in the same physical spaces. If we analyze any spot on Earth, we encounter such informational layers as elevation, soil type, hydrology, biology and land use.
GIS brought this idea to life. The technology allows us to visualize and analyze layers of data on a map. In this way, GIS has become a key integrator of information about our world, from science to engineering to commercial operations.
Through innovation, GIS has grown beyond the bounds of mere 2D map layers to generate maps that are, in effect, 1:1-scale 3D models we call geospatial digital twins.
The major benefit of geospatial digital twins is the ability to provide maximum context. This is especially useful for smart planning of our urban environments. For example, architects can use a digital twin to test how their proposals will fare in such situations as flooding and extreme heat brought about by climate change. City planners can understand the effects of large-scale shifts in the urban environment with interventions focused on enhancing livability. The combination of visualization and hard data allows them to predict impacts and modify plans before making expensive changes to the physical world.
Spatial Computing and Digital Twins
Each advance in GIS technology has improved our ability to visualize, link and manipulate real objects and spaces in a digital realm.
GIS has evolved to offer truly immersive experiences. In particular, the combination of GIS and game engines such as Unreal and Unity has transformed the process of large-scale infrastructure projects.
In Brisbane, Australia, for example, a digital twin of the ongoing subway construction has been used to display progress. People can walk virtually through planned subway tunnels and stations. This contextual experience helps project leads show Brisbanites how the work is shaping up.
The experience also allows planners, architects, engineers and construction workers to make decisions with more information than could be provided by a paper map or even a traditional digital twin. They can stand on a platform and see how the design elements of a station will look to people moving through it.
Spatial Computing to Visualize What Could Be
Digital twins can be crystal balls. The virtual spaces can be reconfigured to model different versions of an environment. In practical terms, digital twins allow various stakeholders to have the same vision. This is especially useful in the age of climate change.
Planners and architects can test different versions of a project. If they are designing a subdivision in a coastal community, they can calculate the flooding and storm surge that will likely occur from storms of different magnitudes. Just as important, they can visualize this data, inhabit it, and study it with maximum context.
At root, what they are doing is investigating spatial relations against a realistic backdrop of the world. For the subdivision, these objects include homes, streets, streetlights, and parks, and what matters is their existence in relation to water under multiple scenarios. This is spatial computing: manipulating referents to real objects in a virtual world that, unlike the real one, can be changed at will.
Spatial Computing to Visualize Hidden Real Spaces
Immersive environments also offer the promise of displaying a world that is real and already exists yet remains largely invisible.
Public utilities and other companies involved with underground infrastructure have been some of the most enthusiastic adopters of digital twins because the experience can reveal critical connections buried beneath the earth — made visible without the need to dig.
In 2017, the Toms River Municipal Utilities Authority (TRMUA) in Toms River, New Jersey, began using mixed reality (MR) headsets to help crews find underground utility assets for electric, gas, water, telecommunications and sewer services.
GIS stores the location of these assets, and MR displays the underground infrastructure. Traditionally, utilities display this detail on a 2D map. What MR provides is maximum context. Workers in the field can visualize exactly what is under their feet—and see how it’s related spatially to what is all around them.
TRMUA credits MR with saving time and lowering the chances of breaking connections in the networks residents rely on for modern living — savings in the tens of thousands of dollars every day.
Many utilities have since followed TRMUA’s lead. MR setups serve multiple purposes, including training new employees and sharing information between teams in the field and staff in the office.
One utility industry publication recently noted that what these systems ultimately provide is the elimination of guesswork. The ability to know exactly where an asset is located — and to understand how changes will affect the area around it — leads to increased efficiency and customer satisfaction.
The World in Sharper Focus
Apple’s Vision Pro headset is not the only recent example of XR rebranded as spatial computing. Meta and Microsoft have also marketed their XR headsets — Quest 3 and Hololens, respectively — as spatial computers.
Spatial computing will continue its mainstreaming. Eventually, it will likely be the norm. As XR hardware increases in number and power, more organizations will look to unlock the value of all the spatial data recorded in GIS. Being able to experience data will add further value to the systems and workflows that create it.
GIS pioneers began exploring the outer limits of spatial computing a half-century ago. More recently they have realized its potential for smarter urban planning, climate risk mitigation, management of operations across industries and virtual exploration of real-world systems or scenarios via geospatial digital twins. Someday soon, those limits will be reachable by anyone.
As GIS users have learned through the decades, when we get a better sense of where we are in relation to things we care about, we can create the world we want to see.