The European Union Agency for the Space Programme (EUSPA) has released its first EO and GNSS Market Report, where EO stands for Earth observation. The report is the result of a collaboration between 15 EUSPA experts from various fields and market research companies supporting EUSPA, backed by more than 50 external experts who helped validate the market trends and the data. In his foreword to the report, Rodrigo da Costa, EUSPA’s executive director, wrote: “Since its inception, the report has established itself as the most authoritative reference document for information on the global GNSS market. It is regularly referenced by policymakers and business leaders around the world.”
EUSPA’s EO and GNSS Market Report combines market and application data into one report that provides global coverage of EO and GNSS applications across 17 different market segments: agriculture; aviation and UAVs; biodiversity, ecoystems and natural capital; climate services; consumer solutions, tourism and health; emergency management and humanitarian aid; energy and raw materials; environmental monitoring; fisheries and aquaculture; forestry; infrastructure; insurance and finance; maritime and inland waterways; rail; road and automotive; space; urban development and cultural heritage.
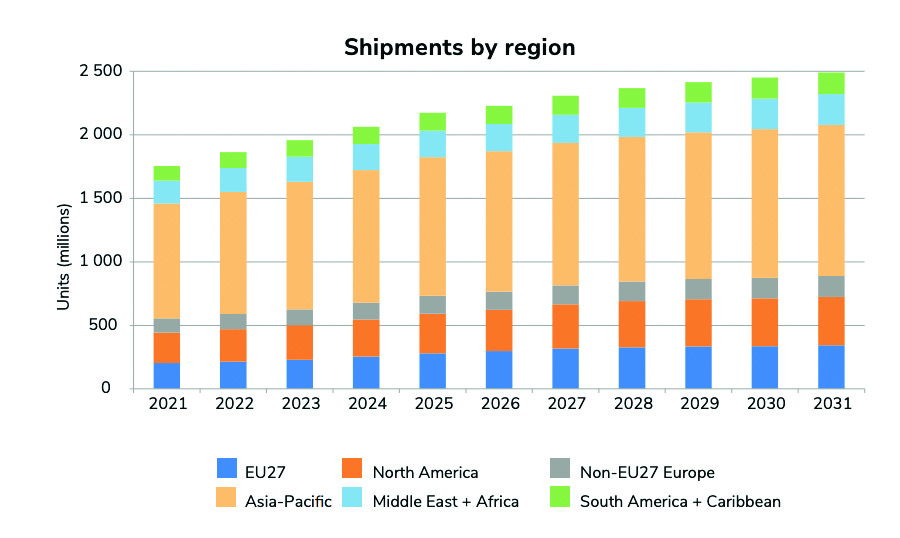
GNSS receiver shipments will grow continuously in the next decade, from 1.8 bn units in 2021 to 2.5 bn units by 2031. (All images courtesy of EUSPA)
Growth dominated by consumer solutions
Between 2021 to 2031, yearly shipments of GNSS receivers are projected to grow from 1.8 billion units to 2.5 billion units. The shipments will be dominated by the consumer solutions, tourism and health segments as the global sales of smartphones and wearables continues to increase.
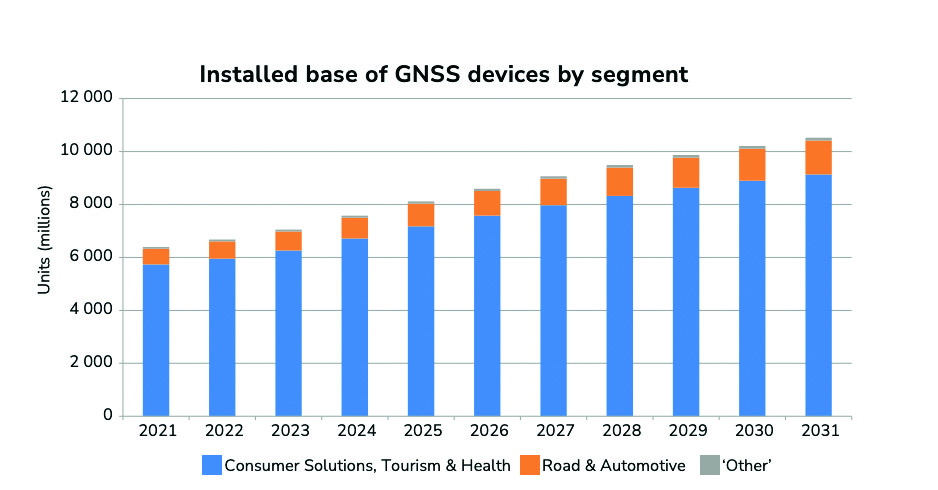
The overall installed base will increase from 6.5 bn units in 2021 to 10.6 bn units by 2031.
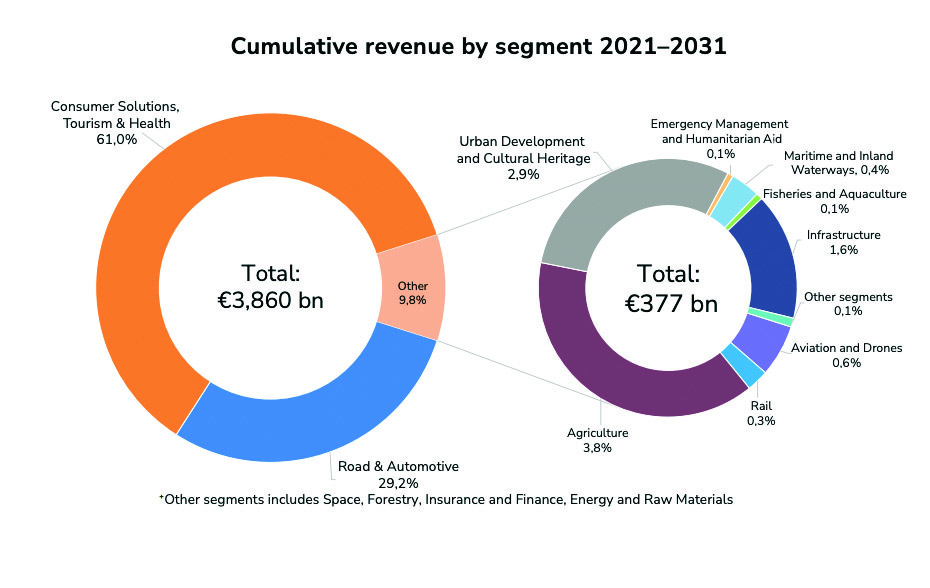
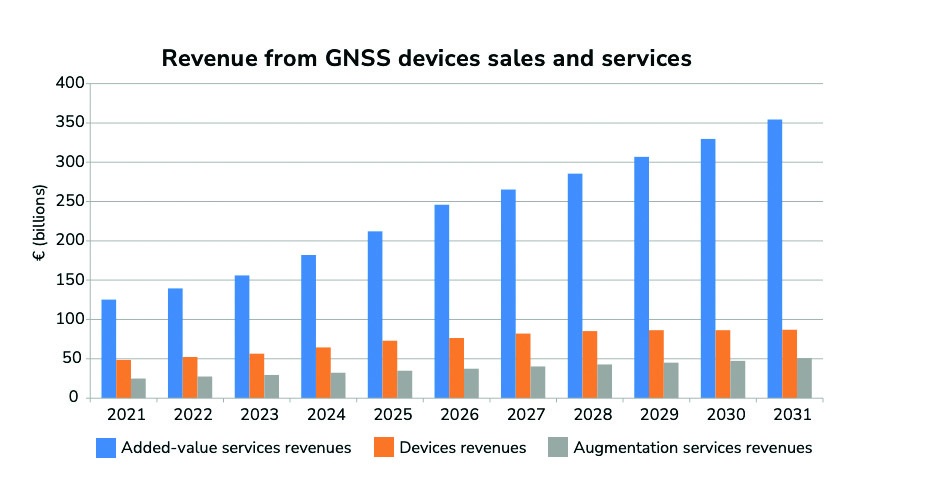
The global installed base of GNSS devices in use is expected to reach more than 10 billion units by 2031 — dominated by consumer solutions, tourism and health, and road and automotive market segments, which will contribute to 98% of all devices in use. The global GNSS downstream market revenues, which covers both device sales and service-related revenues, is expected to grow at a CAGR of 9.2% over the next decade, reaching €492 billion by 2031. More than 82% of the revenue will be generated by value-added services. Beyond the mass markets, the markets of agriculture, urban development and cultural heritage, and infrastructure will be the main contributors to the global GNSS revenue stream.
The Asia-Pacific region continues to be at the top of the GNSS revenue market both for device sales and service revenues based on demand. The region is expected to increase its share of the global services revenues, nearing 46% by 2031; however, it will see a decline of its market share of device revenues. The Asia-Pacific region will be challenged by the upcoming markets of South America and the Caribbean, Non-EU27 Europe, the Middle East, and African regions.
The GNSS market
The report defines the GNSS market as activities in which GNSS-based positioning, navigation and/or timing is a significant enabler for functionality. The GNSS market is comprised of device revenues, revenues derived from augmentation and added-value services attributable to GNSS.
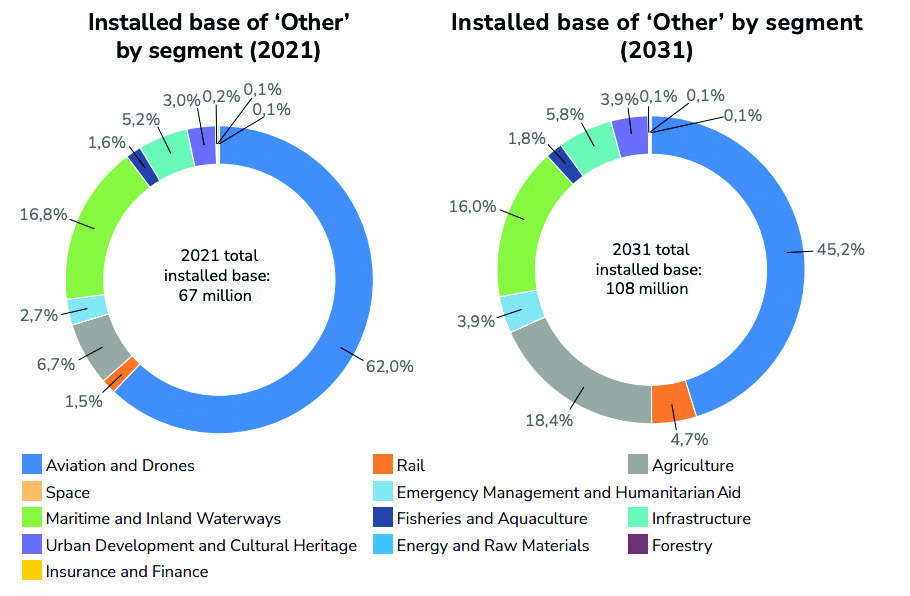
The aviation and UAV market is expected to have significant growth, increasing from 42 m units in 2021 to 49 m units by 2031.The global GNSS downstream market revenues from both device sales and services will grow from €199 bn in 2021 to €492 bn by 2031 with a CAGR of 9.2%. This growth is mainly generated through the revenues from added-value services.
Augmentation services include software products, digital maps and GNSS augmentation subscriptions. Added-value service revenues include data downloaded through cellular networks specifically to run location-based applications, the GNSS-attributable revenues of smartphone apps, subscription revenues from fleet management services, and UAV service revenues across a range of industries. For multi-function devices such as smartphones, the revenues include only the value of GNSS-functionality, not the full device price, so, a case-specific correction factor is used.
About the charts
Data on the charts presented in the report start from the year 2020 and are estimated, projected and subject to update in the next edition of EUSPA’s Market Report. Historical figures are actual numbers based on reliable sources, per EUSPA. These will change if the number of applications is expanded in future reports.
Source: EUSPA EO and GNSS Market Report ISSUE 1, copyright EU Agency for the Space Programme, 2022
EUSPA’s mission is to link space to user needs. Over the past year, EUSPA has increased access to EU space data and services around the world, launched new Galileo satellites, and put in place additional satellite navigation services.
EUSPA operates Europe’s satellite navigation systems Galileo and EGNOS. It is also the gatekeeper to a secure EU Space Programme, providing end users with the confidence of knowing that the space-derived data they depend on is safe and secure.
The agency plays a central role in the market uptake of the data and services offered by the EU Space Programme components. EUSPA also manages the development of GOVSATCOM hubs, which will provide secure, cost-efficient communication capabilities to security and safety-critical governmental missions, operations and infrastructure.
the entry into service of a new Galileo satellite for additional accuracy to end-users
publishing the EO and GNSS Market Report, a comprehensive market intelligence study providing trends for the entrepreneurs and investors.
3.1 billion Galileo-enabled smartphones sold globally since 2016.
“I am more than proud of what EUSPA has achieved in a year. I am also proud to be at the helm of an organization staffed with dedicated professionals, with a service-oriented mindset who work to make EU Space accessible to citizens,’’ said Rodrigo da Costa, EUSPA executive director. “EUSPA remains committed to helping the union and its citizens maximize the socio-economic benefits of space.”
DDK Positioning solutions use the Iridium satellite constellation to deliver 5-cm GNSS accuracy to industrial users of the internet of things (IoT).
Iridium Communications Inc. has made a strategic investment in DDK Positioning, an Aberdeen, Scotland-based provider of enhanced GNSS accuracy solutions.
DDK uses the Iridium network to provide global precision-positioning services that can augment GNSS constellations, including GPS and Galileo, to significantly enhance their accuracy for critical industrial applications.
DDK is developing similar services for other GNSS constellations, such as GLONASS and Beidou. Terms of the investment are not being disclosed.
Standard positioning accuracy through a system like GPS is typically within 10 meters; however, by using the Iridium network, DDK’s enhanced GPS accuracy service brings incredibly precise positioning of 5 cm or less. This advanced level of accuracy is suitable for autonomous vehicles such as UAVs, precision agriculture applications, offshore infrastructure projects such as wind-farm construction, automotive applications like driverless cars, as well as a host of construction, mining, surveying and IoT use cases.
Historically, there have been limited geostationary satellite provider options for this type of service, but they suffer from line-of-sight blockage issues and coverage limitations in and around Arctic and Antarctic regions.
“We are delighted to have embarked on this journey with such a strong and well-respected company as Iridium,” said Kevin Gaffney, CEO of DDK Positioning. “This partnership is a perfect fit for DDK Positioning. With Iridium’s satellite communications network and our GNSS solution, we are in a position to deliver a truly unique service which is robust, resilient and secure. The investment made by Iridium will also allow us to grow the company even further whilst expanding our service offering globally.”
According to a report published by the European GNSS Agency, augmentation services like those offered by DDK will account for $76.5 billion (€65 billion) in global GNSS market revenue by 2029, while the global GNSS downstream market, including services delivered and hardware devices, is estimated to reach $382 billion (€325 billion).
“We are impressed with the team that DDK has put together and see great potential for this technology and how it takes advantage of the Iridium network,” said Iridium CEO Matt Desch. “DDK’s enhanced positioning is a unique capability that adds a high-value solution on top of our existing portfolio of custom network services. Solutions from Iridium and DDK partners that are focused on precision agriculture, autonomous systems, maritime and infrastructure projects can now experience incredibly precise GNSS accuracy from anywhere on the planet.”
The full GNSS User Technology Report 2020 is available for download. (Cover: GSA)
News from the European GNSS Agency
The European GNSS Agency (GSA) has released its latest GNSS User Technology Report, providing a comprehensive analysis of GNSS trends and developments.
With four GNSS available and more than 100 satellites in operation broadcasting multiple frequencies, the GNSS industry is shifting towards the wide adoption of multifrequency receivers across market segments to meet the diverging user needs of emerging applications.
The report includes contributions from leading GNSS receiver, chipset manufacturers and service providers, and serves as a valuable tool to support planning and decision-making with regards to developing, purchasing and using GNSS technology.
Published biennially since 2016, the User Technology Report has become a point of reference for the GNSS industry, research and policy-makers.
Rapid Evolution
‘’The GNSS industry is evolving at a rapid pace and is shaped by the dynamics of emerging applications and user needs as well as the upgrade of existing and new GNSS and Satellite Based Augmentation Systems (SBAS),” said Rodrigo da Costa, GSA executive director. “The industry has understood the potential of Galileo’s unique features.”
The third edition of the report begins with a chapter devoted to technology trends common to all segments: receiver design, position processing and signal processing. It also discusses protection measures against GNSS jamming and spoofing, such as authentication, including what 5G and other technologies and sensors can do, in combination with GNSS.
With multi-constellation now being the norm, the industry is moving towards the wide adoption of multi-frequency receivers even for usually power- and cost-constrained consumer solutions. The Galileo E5 is becoming the preferred frequency with about 20% of all receiver models in the market already using it.
The report is built around four macro segments defined on the basis of commonalities from a technology point of view:
high volume
safety- and liability-critical
high-accuracy
timing devices and solutions (a new-entry in this edition)
Each chapter starts with the macrosegment characteristics and receiver capabilities, depicts the industry landscape and typical receiver form factor, it then delves into the key current and future drivers and trends, and finishes with the added value of the EGNSS, Galileo and EGNOS, for the macrosegment at stake.
Space Data for Europe
This year editor’s special “Space Data for Europe” sheds light on the role that Copernicus and Galileo play within the European Space Programme in the data management and use, now and in the future. It also provides a vision of major transformations underway within our society and our economy and the benefits expected from this digital transformation, paving the way towards the European Data Strategy and Green Deal.
“Today, Galileo and EGNOS already provide increased capabilities which are being used across a broad range of applications, and are already igniting the next generation of location-based applications. In the future, new services — the Galileo High Accuracy Service (HAS), Galileo Open Service Navigation Message Authentication (OS-NMA) and Commercial Augmentation Service (CAS) — will raise the accuracy and reliability bar even higher, and dramatically enhance positioning, navigation and timing solutions for businesses and citizens.
By bringing insight and understanding into the evolutions of GNSS technology, we are creating opportunities for innovation,” concluded da Costa.
The new GSAGNSS Market Report is now available for download. The report provides a comprehensive overview of the GNSS market and the global industry, as well as a focus on EGNSS differentiators and synergies with Copernicus, according to the publisher, the European GNSS Agency (GSA).
Areas covered include:
A general overview of the GNSS market and a global industry overview.
Analysis of macro-trends affecting GNSS, including climate change and the circular economy, big data, artificial intelligence, the silver economy, cyber security and the sharing economy.
A review of the main GNSS market segments in detail, including trends and developments, forecasts for future shipments, revenues and the GNSS installed base, and a look into GNSS user requirements.
GNSS in Space. This year, the report features the “Editor’s Special: GNSS for NewSpace,” a section that introduces GNSS receivers in satellites and their relation to the evolving space sector.
GNSS market monitoring is a key activity of the GSA. Market monitoring supports GNSS stakeholders in their planning and decision-making, and offers a clear tool to understand GNSS trends and evolutions.
Since its launch in 2010, the GSAGNSS Market Report has become the go-to-source for information on the dynamic, global GNSS market segments and applications.
The estimated number of Galileo-enabled smartphones in use has reached one billion. This significant milestone has been achieved in the week when the European GNSS Agency (GSA), responsible for operation of the Galileo programme, celebrates its 15th anniversary.
The company BQ pioneered Galileo use in smartphones with its Aquaris X5 Plus in July 2016. Since then, market uptake of Galileo-enabled smartphones has been rapid as other manufacturers were quick to embrace the opportunities that Galileo offers.
Global annual GNSS receiver shipments are forecast to grow from 1.8 billion units in 2019 to 2.7 billion units in 2029.
Currently, 156 Galileo-enabled smartphone models available on the market. The “1 billion users” milestone is based on the number of smartphones using Galileo sold across the world. The actual number of Galileo users around the world is much larger. You can track which devices, including smartphones, are Galileo-enabled on the UseGalileo.eu site.
Today, 95% of companies that produce smartphone chips for satellite navigation make chips that enable Galileo. According to figures in the latest GSA GNSS Market Report, which is to be published soon, global annual GNSS receiver shipments are forecast to grow continuously across the next decade, from 1.8 billion units in 2019 to 2.7 billion units in 2029. Most of these shipments are for receivers costing less than €5, and 90% of receivers in this price segment are used in smartphones and wearables.
The number of Galileo-enabled smartphones in use has soared to 1 billion in just 3 years. (Image: GSA)
“Galileo is now providing high quality timing and navigation services to 1 billion smartphone users globally,” said Elżbieta Bieńkowska, commissioner for Internal Market, Industry, Entrepreneurship and SMEs. “This has been made possible by a truly European effort to build the most accurate navigation system in the world, with the support and dedication of the GSA. I am confident that our space industry will continue to thrive with more work, ideas and investment under the new EU Space Programme.”
“One billion smartphone users is a significant milestone and a major achievement for the Galileo programme and for the GSA,” said GSA Executive Director Carlo des Dorides. “The GSA has worked tirelessly to build bridges with research and industry and create a strong community of service providers who trust Galileo and understand the technological innovation opportunities it brings.
“Chipset and receiver manufacturers in particular have been quick to leverage Galileo’s outstanding performance,” des Dorides said. “These manufacturers believed in Galileo from the beginning, when Galileo was still an idea, and invested in the technology. It is thanks to them and the unique blend of expertise and knowledge of the GSA team that we are now celebrating 1 billion Galileo-enabled smartphones.”
The second edition of the European GNSS Agency’s (GSA) GNSS User Technology Report has been published and is now available for free download, providing an exhaustive review of the latest GNSS trends and developments.
Since its launch in 2016, the GNSS User Technology Report has become the go-to-source for information on the dynamic, global GNSS technology industry.
The GNSS User Technology Report, a sister publication to the GSA’s GNSS Market Report, is published every two years and takes an in-depth look at the latest state-of-the-art GNSS receiver technology, along with providing expert analysis on the trends that will shape the global GNSS landscape in the coming years.
Three key segments
European GNSS Agency
Like the inaugural report in 2016, the second issue focuses on three key macro segments: mass market solutions; transport safety- and liability-critical solutions; and high precision, timing and asset management solutions.
The report opens with an overview of the latest developments and trends in GNSS, with a focus on the multi-constellation and multi-frequency that are driving new trends in the sector.
“With the GNSS User Technology Report, our aim is to provide everybody in the GNSS value chain with a comprehensive overview of the current landscape in the industry and to identify new trends so that stakeholders know in which direction the industry is moving,” GSA Executive Director Carlo des Dorides said.
“The most important new trend identified in this issue is the rapid adoption of multiple frequencies, including for consumer devices, as evidenced by the market introduction of the first dual-frequency smartphone in May 2018,” des Dorides said.
Editor’s special section: Automation
The final section in this year’s report — the “Editor’s special” section — is dedicated to automation and to the increasingly important role GNSS plays in a number of partially — or fully automated tasks and functions. The most publicised examples of these are found in the transport domain — driverless cars, autonomous vessels and drones but, as the report notes, GNSS-based automation applications go well beyond transport.
The analysis of GNSS user technology trends in the report is supported by testimonials from key suppliers of receiver technology, including: Broadcom, Javad, Kongsberg, Leica, Maxim Integrated, Meinberg, NovAtel, Orolia-Spectracom, Qualcomm, Septentrio, STMicroelectronics, Thales, Trimble and u-blox.
In addition, the report includes highlights from around 20 ongoing research projects from the Horizon 2020 and Fundamental Elements programmes, aiming at the development of GNSS receiver technology.
The full GNSS User Technology Report 2018 is available for download here.
GNSS User Technology Report 2018 Highlights
All global and regional GNSS constellations are developing, modernising and innovating, with more than 100 GNSS satellites now available over our heads.
The vast majority of current receivers are multi-constellation, and the most popular way to provide multi-constellation support is to cover all available constellations. Today only around 30% of receivers use GPS only.
In the mass market domain, we are seeing a divide between chipsets optimised for entry-level internet of things (IoT) products, where energy per fix is the primary driver, and high end, where the industry is innovating to propose enhanced positioning performance.
The need for accuracy in the mass market is initiating new solutions, including ones based on Android GNSS raw measurements or, more significantly, using multi-frequency signals.
The frequencies supported across all application areas range from single L1/E1 to 4 frequencies in the professional segment. The dual frequency solution showing the most growth is L1/E1 and L5/E5, however the legacy L1/E1 and L2 are still being used.
Growing interest has been observed in PPP and RTK services proposed by private industry and public system operators, leading to new PPP/RTK concepts aiming to address a wide customer base beyond high precision.
The need to ensure both safety and security of PNT solutions is being highlighted by all solution providers, particularly in systems where humans are out of the control loop, such as in autonomous vessels, cars or drones.
The 316-page QYResearch Group report provides a basic overview of the industry including definitions, classifications, applications and industry chain structure. The GNSS market analysis is provided for the United States markets including development trends, competitive landscape analysis, and key regions development status.
Development policies and plans are discussed as well as manufacturing processes and Bill of Materials cost structures are also analyzed. This report also states import/export consumption, supply and demand figures, cost, price, revenue and gross margins.
The report focuses on leading industry players in the U.S., providing information such as company profiles, product picture and specification, capacity, production, price, cost, revenue and contact information. Upstream raw materials and equipment and downstream demand analysis is also carried out. The GNSS industry development trends and marketing channels are analyzed. Finally, the feasibility of new investment projects are assessed and overall research conclusions offered.
With 335 tables and figures, the report provides key statistics on the state of the industry and is directed at companies and individuals interested in the market.
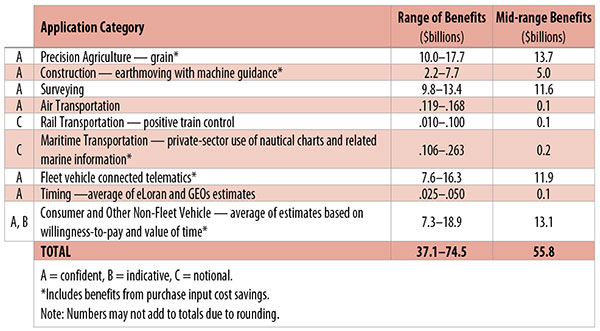
Table 1. Preliminary 2013 U.S. GPS economic benefit estimates. (Chart: GPS World, based on data from author)
This article is based on a presentation to the National Space-Based Positioning, Navigation and Timing Advisory Board in June 2015. The study reported on at the meeting was requested by the National Executive Committee for Space-Based Positioning, Navigation and Timing. It demonstrates the widespread use and importance of GPS to the U.S., with estimated benefits in 2013 of about $56 billion, or 0.3% of GDP for a subset of applications. The study is the first part of an effort that is expected to refine and extend this analysis.
By Irv Leveson
Critical to many civilian applications and innovations, GPS brings great economic benefits. These benefits have grown rapidly with the integration of GPS with other technologies and its wider and deeper infusion into applications. New GPS signals and other improvements in the system will further expand and enhance use. The unmistakable conclusion: GPS is everywhere.
Benefits of GPS to the U.S. will increase with the availability of other GNSS systems, even though GPS will constitute a smaller share of global GNSS benefits. The U.S. will continue to provide leadership, standards and innovation in technology and applications with positive domestic feedback.
GPS and other GNSS and enhancements raise productivity; reduce and avoid costs; save time; enable improved and new production processes, products and markets; increase health and well-being; reduce injury and loss of life; improve the environment; and increase security.
The National Executive Committee for Space-Based Positioning, Navigation and Timing (PNT), which is responsible for maintaining U.S. leadership in GNSS, commissioned a study to assign a quantitative value to the broad economic uses of GPS. The purpose is to inform the public, federal decision makers and critical infrastructure owners/operators on the importance of GPS and the need to protect it from disruption. Assessing the economic implications of actions such as preventing or disallowing interference, spectrum reallocation, developing supplementary or backup systems and/or toughening receivers can be informed by value estimates and the data used to derive them. In addition, economic values can contribute to planning for GPS modernization and analysis of budgets. Baseline estimates facilitate comparisons with future developments. GPS benefit estimates will be “ballpark” no matter how sophisticated the methodology because of limits to the availability of information, but in many cases, knowing orders of magnitude is essential in choosing courses of action.
Widespread, Pervasive Impact. The technological environment is one of rapid changes in information and materials technology and integration of technologies at levels ranging from systems on a chip to large-scale systems. GPS is increasingly integrated with other technologies and systems that build on each other to achieve greater outcomes.
The U.S. Department of Homeland Security counts GPS as an enabling technology because of its crucial role in 14 of the 16 industries that are classified as part of the nation’s critical infrastructure. It is useful to view GPS’ role as being especially important in “enabling the enablers,” industries that particularly support the rest of the economy and are at the forefront of economic growth. The most notable of these are transportation, communications, power and financial services.
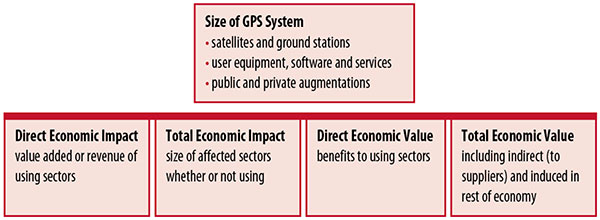
Economic Value versus Impact
Economic value is the addition to the value of the economy from the provision of a good or service, or the introduction of a technology. Benefits are measured relative to what would have been expected if there were no GPS. Direct economic value is the increase in value in using sectors. Total economic value includes increases in value to suppliers and value induced in the rest of the economy.
Direct economic impact, on the other hand, refers to measures of the importance of sectors that are using GPS. Total economic impact is the importance of sectors affected by GPS, whether they are using it or not. Total economic impact of GPS is virtually the size of the whole economy, so it is not very meaningful.
Direct economic impact is measured by value added of using sectors when the purpose is to avoid duplication among sectors that buy from and sell to each other. It may be measured by revenue for a single sector when adding sectors is not involved, so there is no need to avoid duplication.
The distinction between economic value and economic impact is critical. Even if economic impact is measured by value added rather than revenue, the value is not the net addition to the economy from the use of the product or technology. It is only the size of the using sector. See Figure 1.
Figure 1. Measuring GPS economic value and economic impact. (Chart: author)
The GSA Study
The most comprehensive estimates of global GNSS market size come from the European GNSS Agency (GSA), which has released four market reports from 2010 through 2015. The data are measures of economic impact and not economic value. The reports are of great interest because of their comprehensive global look at the sizes of markets and inclusion of forecasts. In contrast, the emphasis in this part of the present study is on current economic value, with U.S. benefits assessed for GPS.
One reason for interest in the GSA reports is that market information and projections often are proprietary and there can be great inconsistency across market research studies. GSA makes use of many confidential studies without revealing which sources contributed to each estimate. It apparently has been allowed to incorporate proprietary information from a number of market research firms since the data is subsumed in GSA’s own estimates and/or presented in graphs for which underlying numbers are not provided — and from which it is often difficult to even roughly extract them.
The 2015 report stated the methodology as: “The underlying forecasting model uses advanced forecasting techniques applied to a wide range of input data, assumptions and scenarios…Where possible, historical values are anchored to actual data.” Results were checked against opinions of market segment experts and market research reports. However, these analyses are not provided in the reports and have not been made available.
A distinction is made between the core market which covers the value of components that provide GNSS functionality in devices and enabled markets which “represent the services and devices enabled by GNSS.” The 2015 report provides global data on both core and enabled market and goes into much more detail on core markets for application sectors. In addition to providing sector information that did not appear previously, the 2015 report presents data on the extent to which each combination of the GNSS constellations was supported by receivers or chipsets offered by suppliers. Additional information on enabled sectors is in earlier reports.
GSA found in its 2015 market report that:
3.6 billion GNSS devices were in use globally in 2014, of which 3.08 billion were smartphones and .26 billion were for road.
North America had about 450 million devices installed (about 80% U.S.).
North America had 1.4 devices per capita in 2014.
North American shipments were 250–300 million in 2013.
Global core revenue was estimated at roughly €62 billion and enabled revenue at €227 billion in 2014. As noted, core revenue includes GNSS device components, software and services, while enabled revenue refers to applications.
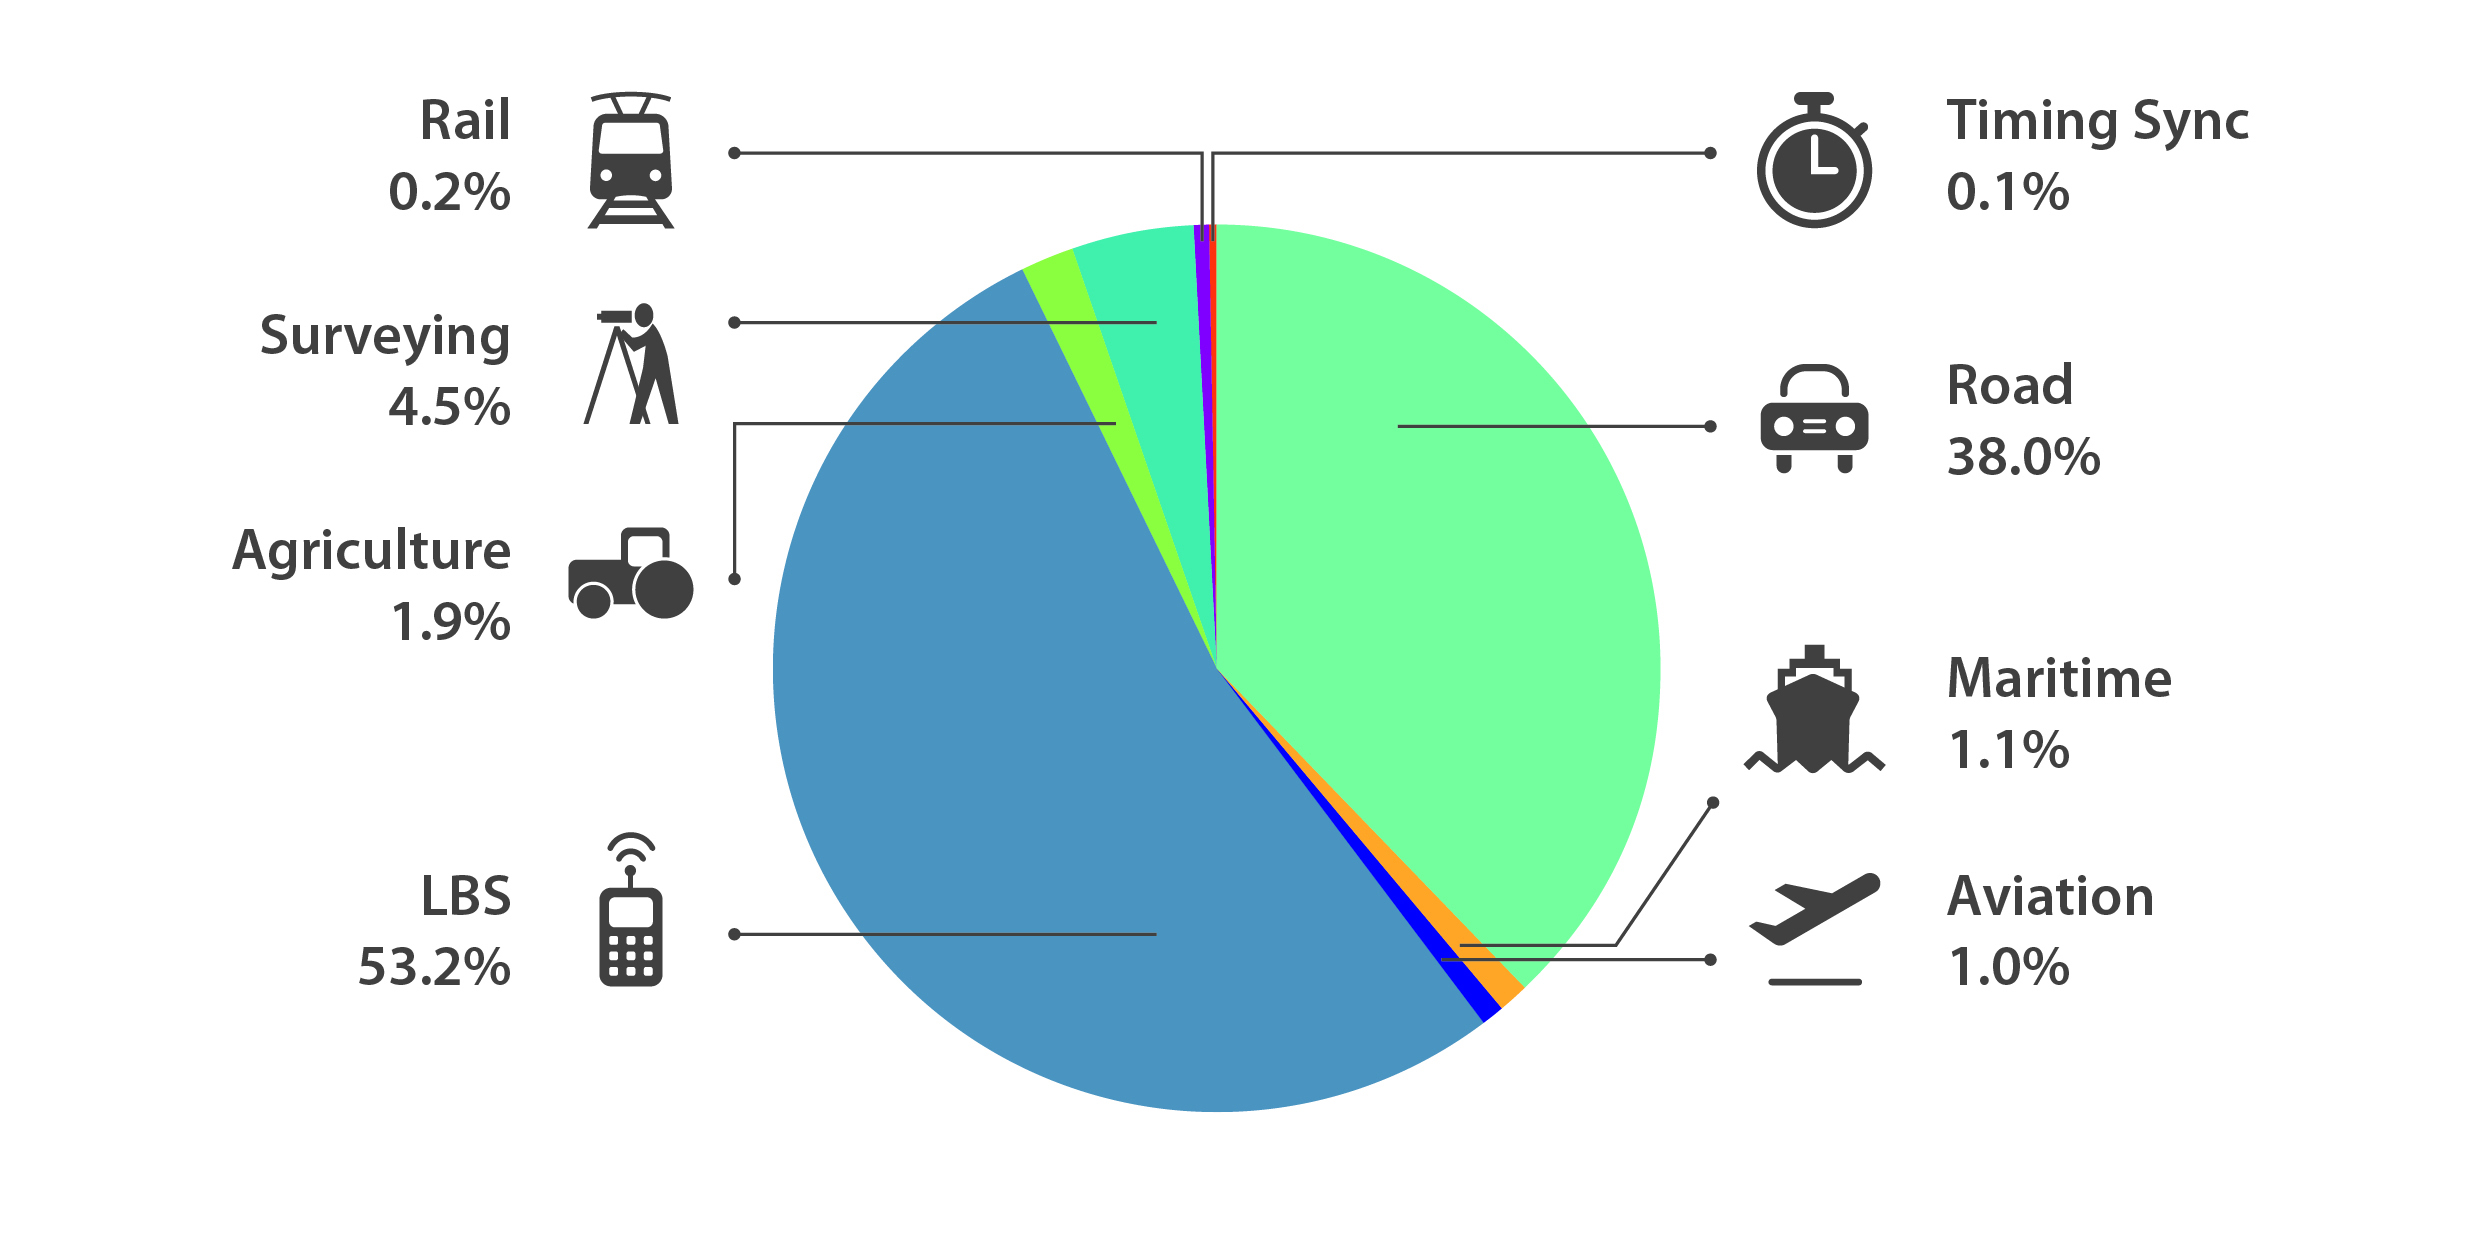
Location-based services (LBS) was projected to account for 53.2% of 2013–2023 core revenue growth, and road for 38%.
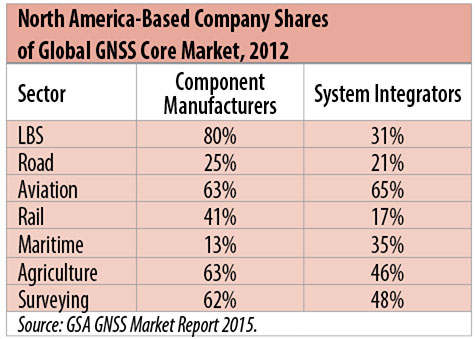
North American-based companies had sizeable shares of the global GNSS core market in 2012, particularly among component manufacturers. (See Table 2). Their market share among system integrators was highest in aviation.
North American-based companies had a 44% market share of value-added services revenue in 2012.
Table 2. North America-based company shares of Global GNSS core market, 2012. (Chart: author)
Markets and Applications
The pervasiveness of GPS-enabled applications is illustrated by the following statistics:
900 million mobile phones that incorporated GPS were sold globally in 2012.
The U.S. had 188 million smartphone subscribers and 263 million Internet users in 2013.
20% of U.S. mobile phone users get up-to-the-minute traffic or transit information.
The new industry category in the 2012 North American Industrial Classification System: “Internet publishing and broadcasting and web search portals” had U.S. revenue of $87 billion and 181,000 employees in 2012.
Google estimated that its search and advertising tools provided $111 billion in economic activity in the U.S. in 2013.
Deloitte estimated that Facebook enabled $104 billion of economic impact and 1.2 million jobs in North America in 2014.
Google Play and the Apple App Store each had more than 1.2 million apps in 2014.
How GPS Is Used. Uses of GPS include:
In agriculture for auto-steering tractors, combines and sprayers for precise operation, variable rate technology for precise placement of seed, fertilizer and pesticides, and for yield monitoring.
Managing forest health and ecological restoration, reducing fire and other hazards, and harvesting forest products.
In commercial fishing, navigation, finding fishing locations and monitoring fish catch by authorities.
In construction to direct the movement of dozers, excavators, pavers, scrapers, compactors and other heavy equipment and the placement of blades to give precise results.
In open-pit mining to guide loaders, dozers, drills and draglines.
In offshore energy exploration and development, for drilling, installations, pipe laying, diving operations, pipe inspection, repair and abandonment.
In surveying, to greatly reduce costs and to improve quality of products that rely on it.
In aviation, for navigation and monitoring positions of aircraft and for satellite-based augmentation systems (WAAS in the U.S.). GPS is the principal source for navigation for aircraft equipped with Area Navigation (RNAV) or Required Navigation Performance (RNP).
Railroad train pacing systems for cruise control, positive train control to keep track of train location and movement authorities, track defect location, and locating trucks with rail workers.
In marine transportation, for navigation, collision avoidance, communications and situational awareness and for monitoring by offshore authorities.
In vehicles, with handheld and embedded devices for navigation and fleet management.
For precise timing and time synchronization and frequency coordination (syntonization). It is used most notably in broadcasting and communications, including both cell phones and traditional telephone applications and the Internet, so packets arrive at the same time, for power generation and distribution to locate problems, and in financial services for time-stamping transactions.
In first responder services for location, navigation and communications and in emergency warnings and evacuations.
In structural monitoring of dams and bridges.
In environmental monitoring, including vegetation growth and sea-level change.
LBS and GIS
Rapid growth is taking place in location-based services (LBS) and geographic information services (GIS), which include everything from indoor location to many aspects of the Internet of Things and the “sharing economy,” and sophisticated systems for information management, analysis and display.
GPS is used for tracking and inventorying assets ranging from heavy machinery on farms and construction and mining sites, to pipes and other materials, containers in trucking sites and ports, and the location of utilities in the ground. In logistics it facilitates planning of product flow and transport.
The growth of same-day delivery — which takes advantage of Internet, cell phone, and location and navigation technologies enabled by GPS — is a continuation of the growth in just-in-time delivery that has been a phenomenon in manufacturing for several decades. Now it is having a profound effect on wholesale trade, retail trade and transportation.
The size of the LBS and GIS sectors is not defined and measured in a consistent way, and except for vehicle use, there is little information on productivity and saving in costs and time. (See sidebar box.)
LBS and GIS Market Size Estimates
For LBS and GIS, definitions and measures can vary greatly and often are not explicit.
Location-Based Services Market Size Estimates
Frost & Sullivan estimated the global LBS market at €22.8 billion in 2012 and forecast €32.0 billion in 2015.
Market and Markets estimated global LBS revenue at $8.1 billion in 2014.
Berg Insight estimated North American LBS revenue at $835 million in 2012.
(The U.S. can be assumed to spend 20–25% of the world value and about 80% of the North American value.)
Geographic information Systems Market Size Estimates
BCG estimated revenue of the U.S. GIS industry at $73 billion in 2011.
The global GIS market will reach $10.6 billion in 2015, according to a report of Global Industry Analysts in 2013.
The Canadian Geomatics study found private-sector spending of $2.3 billion in 2013. If U.S private spending was the same percentage of GDP, it would be $23.6 billion.
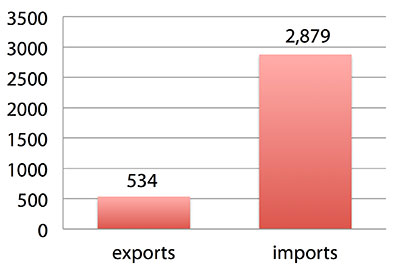
International Trade
Official data show a $2.3 billion U.S. deficit in trade in GPS equipment in 2013. This gives an incomplete and misleading picture of the role of the U.S. and the benefits that result. See Figure 2.
Figure 2. U.S. trade in GPS equipment, 2013 (millions of dollars). (Chart: author)
The trade numbers for GPS equipment do not include revenue for licensing, international payments received by social media and e-commerce companies, or other Internet-based revenue for which the U.S. may have a substantial net trade surplus and which are an important source of revenue and profits of U.S.-based companies.
Imports of GPS equipment software and services enable the U.S. to gain more efficient production in many applications at home and enable the U.S. to export more goods and service that rely on GPS.
Exports of GPS equipment come back to the U.S. as components that benefit U.S. businesses and consumers with more capable products and lower prices. Exports of GPS equipment enable other countries to build on the technologies and contribute to innovation, while imports enable the U.S. to share in foreign innovations. Exports of GPS equipment and associated knowledge also raise incomes in other countries, creating larger markets for U.S. goods and services.
Scope of Benefit Estimates
The U.S. benefit estimates reported here are the result of an initial effort and are not meant to be comprehensive. More work is expected to be done to fill in some of the gaps.
Sectors were chosen based on availability of information to permit relatively robust estimates and importance to the economy or policy issues. These considerations limited the number of sectors for which estimates could be made. Methods were determined based on the nature of available studies and varied among sectors. Only economic benefits were included, with health and safety and environmental benefits left for later research.
Benefits include the value to users above their costs (consumer surplus). Benefits of GPS are compared with alternatives without GPS or an application using it (counterfactuals). Estimates are gross. They are not reduced by the costs of achieving the benefits. Contributions of augmentations are included, since a quantitative basis for separating them is not available.
Estimates were primarily benefits through productivity and cost savings in operations, with savings in input costs included where their magnitudes were clear. Benefits to the rest of the economy are not included. Illustrative allowances were made for the contributions of other technologies and systems to the outcomes examined.
In the case of GPS timing, the estimates were based on the costs avoided by not having to develop an alternative timing source on the assumption that the type of alternative source possible would have evolved from the time GPS became available. The measure does not represent the value of GPS time and synchronization to the nation and to users relative to the absence of a precise time and frequency source.
Government was included in the estimates for construction, surveying, and fleet and non-fleet vehicles. For timing and non-fleet vehicle benefits, two alternative measures are averaged. Sectors with lower quality estimates — rail and maritime transportation — were included because of their importance to the economy. Shares of benefits attributable to GPS were rough assumptions. More robust estimates would require extensive data collection and interviewing in studies greatly exceeding available time and resources.
The primary focus was on productivity improvements, cost savings and cost avoidance, where costs include users’ time. Productivity increases and cost reductions allow more to be produced with the same amount of resources in the sectors utilizing the technology or allow resources to be freed up for other purposes. In that sense, they are equivalent.
When benefits are measured by productivity gains or cost savings, much of consumer surplus (the value to users above what they pay) is implicitly included. Some sources measure value by willingness-to-pay. Willingness-to-pay includes consumer surplus. It also encompasses costs of the purchase and other costs incurred by the user.
Criteria for Selecting Sectors
The potential for making sector estimates of economic benefits was categorized in three basic levels:
confident: based on robust estimates.
indicative: based on one or more less robust estimates.
notional: illustrative, if major contributions of other technologies are not separated and estimates must be based on a plausible percentage of a larger benefit, or if information is not available and estimates must be based on a percentage of market size.
Choices among categories for estimation and estimation methods depended not only on which of the basic criteria are satisfied but also on the following additional criteria:
The importance of the sector to the economy, for example as an enabler of other activities.
The potential use of benefit estimates for the category as an input into analyses of the effects of signal disruption.
Several dozen studies were assessed to determine categories for inclusion and to select studies that can form the basis of estimation. Studies for use in estimation of benefits in a category were chosen according to how well they met the following criteria:
GPS. A test of introduction of GPS or comparison with and without GPS rather than benefits of a broader service.
Coverage. Estimates that cover a major part of the category.
Robustness of estimates, including the type of review the source is likely to have had.
Consistency. If alternative better estimates are not in such a wide range that an average is less meaningful except where explainable by expected sources of variation.
Timeliness. Preference to a recent period being covered by the estimates.
U.S. Economic Benefit Estimates
Preliminary estimates of economic benefits for included U.S. sectors totaled $55.8 billion in 2013. Averaging the alternative estimates, the sum of the benefits in the two vehicle categories is $25 billion, by far the largest of the sectors estimated. Next were agriculture with $13.7 billion, and surveying with $11.6 billion.
Economic benefits are underestimated for several reasons. Some sectors are not included because of lack of information on productivity and cost savings, namely LBS other than vehicle, including asset tracking and locating people; GIS and mapping other than nautical charts, forestry, fisheries, mining, energy exploration and development, land and coastal management, weather, and scientific applications and space.
Parts of others are not included: non-grain agriculture, construction other than earthmoving, GPS in aviation for some Area Navigation (RNAV) Standard Instrument Departure Routes (SIDs) and Standard Arrival Routes STARS) and Required Navigation Performance (RNP), and rail other than positive train control.
Some estimates are conservative. The value of saved time in non-fleet vehicle transportation is based on the recommendation of the Transportation Research Board rather than the much higher value used by the U.S. Department of Transportation.
Some types of benefits are not included — specifically, benefits of GPS timing applications above the cost of alternatives, and avoided income loss, property damage and medical costs associated with reduced accidents and improved emergency response.
Increases in benefits between 2003 and 2005 are not estimated.
And, as indicated, non-economic benefits such as those to health, safety, security, reduced loss of life and to the environment are not yet addressed.
Benefits as measured thus far are about 0.3% of GDP in one year. If all of the excluded sources of benefits were quantified, the benefits would be much larger.
Estimating Benefits for Sectors
U.S. economic benefits of GPS for grain farming were estimated for farms with grain sales of $250 million or more. The same method as was applied for earthmoving in construction.
A composite range of percentages of productivity gains and cost savings of 18–25% was determined from various studies. In the case of grain farming, benefits also come from yield increases due to improvements in plant health. The productivity gains used in the calculations incorporated both sources of benefits. Productivity was taken together with market size and an estimate of 68% adoption of technologies taking advantage of GPS to compute initial estimates of benefits. A notional adjustment was then made to exclude the contributions of other technologies and GNSSs. While having the adjustment determined by a group of experts would have been preferred, that was not possible with the time and resource constraints of the study.
Benefits of GPS machine guidance with earthmoving in construction were calculated based on an 8–12% share of construction for earthmoving operations, a benefit of 18–22% and a 20–25% adoption rate, relying on a number of sources.
For surveying, an estimate of market size was constructed based on U.S. Bureau of Labor Statistics data on numbers of surveyors, cartographers and photogrammetrists in the engineering services industry vs. the rest of the economy, together with revenue data for private surveying and mapping from the Economic Census. This was combined with a composite estimate of productivity gains over conventional surveying of 45–55% and an assumption of 100% adoption.
The benefit values for air transportation were estimated for the study by the Federal Aviation Administration (FAA) based on effects of WAAS and performance-based navigation (PBN). The rail estimates cover only positive train control, which is in early stages of implementation. Information is highly uncertain, but impacts as of 2013 are small. Maritime benefits were based on updating an earlier estimate of benefits of the private-sector value of nautical charts. The estimates for fleet vehicle-connected telematics were based on savings found in an extensive survey of fleet customers over a five-year period.
Timing benefits were based on the avoided costs from not having to develop an alternative source of timing. Alternatives considered were eLoran and a system of three geostationary satellites. Since there would have been strong pressures to develop an authoritative timing source in the absence of GPS timing, it was assumed that one of the alternatives would have been developed rather than assuming as in other cases that technologies in use when GPS became available would have continued in use.
Two estimates also were made for consumer and other non-fleet vehicle use. One was based on extrapolating results of a study of consumer willingness to pay for navigation services, and the other on time saved by navigation services.
Part of the benefits of LBS other than those that are vehicle-related and for GIS are implicitly included in estimates for sectors that use them.
Data and Research Needs
Additional work would be desirable to extend and refine the GPS economic benefit estimates, quantify safety-of-life and environmental benefits, examine international benefits, assess potential future benefits and consider loss from denial of GPS. Benefits of many new and rapidly growing services are yet to be quantified.
Systematic research is needed to fill in gaps in adoption, productivity and cost savings with comparative before-and-after studies as well as with case studies. Robust studies require major and often multi-year efforts involving targeted data collection, which are rarely done by government or academics for GNSS. Information needs to be much more granular, taking into account specific functions in which GNSS is used (such as plowing, seeding, fertilizing, harvesting), specific GNSS and non-GNSS technologies employed in each function at each site, and extent of their use.
Also, results for GPS might be improved or at least be more acceptable if the contribution of other technologies and GNSSs to measured benefits were assessed by a group of knowledgeable individuals rather than by a single researcher.
Information on market size, penetration and growth from market research firms, which tends to capture recent developments, is based on greatly varying sources and methods, resulting in major gaps and great divergence in estimates, especially in new or rapidly growing areas like LBS and GIS. The North American Industrial Classification System (NAICS) and its application in federal data collection such as in the Economic Census lags far behind in recognizing new categories and providing sufficient detail. Lags in data collection and research lead to understatement of the use and benefits of GPS.
Looking to the Future
Future benefits are expected to be even greater because of evolution of technologies, expansion of GNSS systems, creation of new products and markets, and growth and penetration of markets. The possibilities are suggested by the numerous nascent applications that have been emerging. Many will be enabled by expanding GNSS systems, signals and capabilities in conjunction with geographic expansion and increased capabilities in wireless systems.
The progression of platforms is long and growing: mainframes, PCs, mobile phones and other handheld devices, tablets, game controllers, wearables, TVs, home appliances, air and space — including planes, UAVs, satellites, planets, moons, rovers, rockets and spaceships.
The widespread availability of platforms and the growing ability to utilize them promises a long way to go in developing applications and deriving benefits.
Acknowledgments
The author thanks the PNT Advisory Board and Gov. Jim Geringer, liaison from the board to the study; Jason Kim of the Department of Commerce who oversaw the project; Jim Miller of NASA; and the members of the interagency Economic Study Team that advised the effort. Numerous additional people in and out of government provided information and assistance. Responsibility for the content and findings rests with the author.
IRV LEVESON, who has a Ph.D. in economics from Columbia University, is an economic and strategy consultant and founder of Leveson Consulting. He has done extensive work on GNSS markets and issues for more than 10 years. He is a member of the Institute of Navigation, the American Economic Association and the National Association for Business Economics.
A new GNSS market research report by research firm RNCOS forecasts the global core GNSS market to grow at a Compound Annual Growth Rate (CAGR) of 9 percent during 2015-2020.
The GNSS industry includes technology that allows any user having a compatible device to determine their position, velocity and local time by processing signals from satellites in space. Signals include GPS, Galileo, GLONASS, BeiDou and regional SBAS. The GNSS market includes both products (receivers and devices) and services using GNSS-based positioning as a significant enabler.
In the latest research study “Global Navigation Satellite Systems Market Outlook 2020,” analysts identify and decipher the market dynamics in important segments, highlighting the areas offering promising possibilities for companies to boost their growth. The report studies the market by its major application and location-based services, transportation (further divided into road navigation, rail navigation, air navigation and marine navigation), surveying activities and agriculture.
The GNSS application market is further studied by region — North America, Europe, Asia-Pacific, and Rest of World. The report provides a complete overview of the GNSS market globally. All the current trends and drivers coupled with potential growth areas of the GNSS industry have been evaluated in the report. Furthermore, the report provides knowledge of opportunities in the industry for different companies in the “Opportunity Assessment” chapter.
Additionally, to provide an exhaustive knowledge of the prospects for GNSS players on the geographical front, the report provides a comprehensive knowledge of the 10 most worthwhile GNSS markets around the world: U.S., Canada, UK, France, Germany, Russia, Japan, China, South Korea and India. It includes information about the present state and future outlook of the LBS and telematics market in these countries, along with information about their personal navigation systems with the U.S.’s GPS, China’s BeiDou, Europe’s Galileo, Russia’s GLONASS, Japan’s QZSS and India’s IRNSS.
Finally, the study looks into the competitive landscape covering business overviews, key financials, product analyses, recent developments and strengths and weaknesses analyses of each of the players. All in all, the report is intended to help clients analyze the driving forces and understand the opportunities in the industry.
2015 GNSS Market Report: European GNSS Agency Provides a Fresh Look at Worldwide Growth
The fourth edition of the European GNSS Agency’s (GSA’s) GNSS Market Report provides a comprehensive source of knowledge on this dynamic global market. The report has become a key reference for organizations building their GNSS market strategies. The new edition provides:
Comprehensive updates on previous analyses;
New statistics of the GNSS receiver capabilities of the 31 top global manufacturers, offering in total more than 300 models;
Insights on the GNSS industry and regional shares of the GNSS market
A more granular segmentation of the global GNSS market, namely: European Union (EU28); North America (including the United States, Canada, Mexico); Asia-Pacific (including China, Japan, Australia, India, Republic of Korea); Non-EU28 Europe (Norway, Switzerland, Russia, Ukraine); Middle East and Africa (Turkey, Israel, South Africa, UAE, Saudi Arabia); South America and Caribbean (including Brazil, Argentina, Colombia, Guatemala)
Information on a new market segment: Timing and Synchronization
Plus additional applications within existing segments, such as recreational navigation, fishing vessels, personal locator beacons, emergency locator transmitters and digital tachograph.
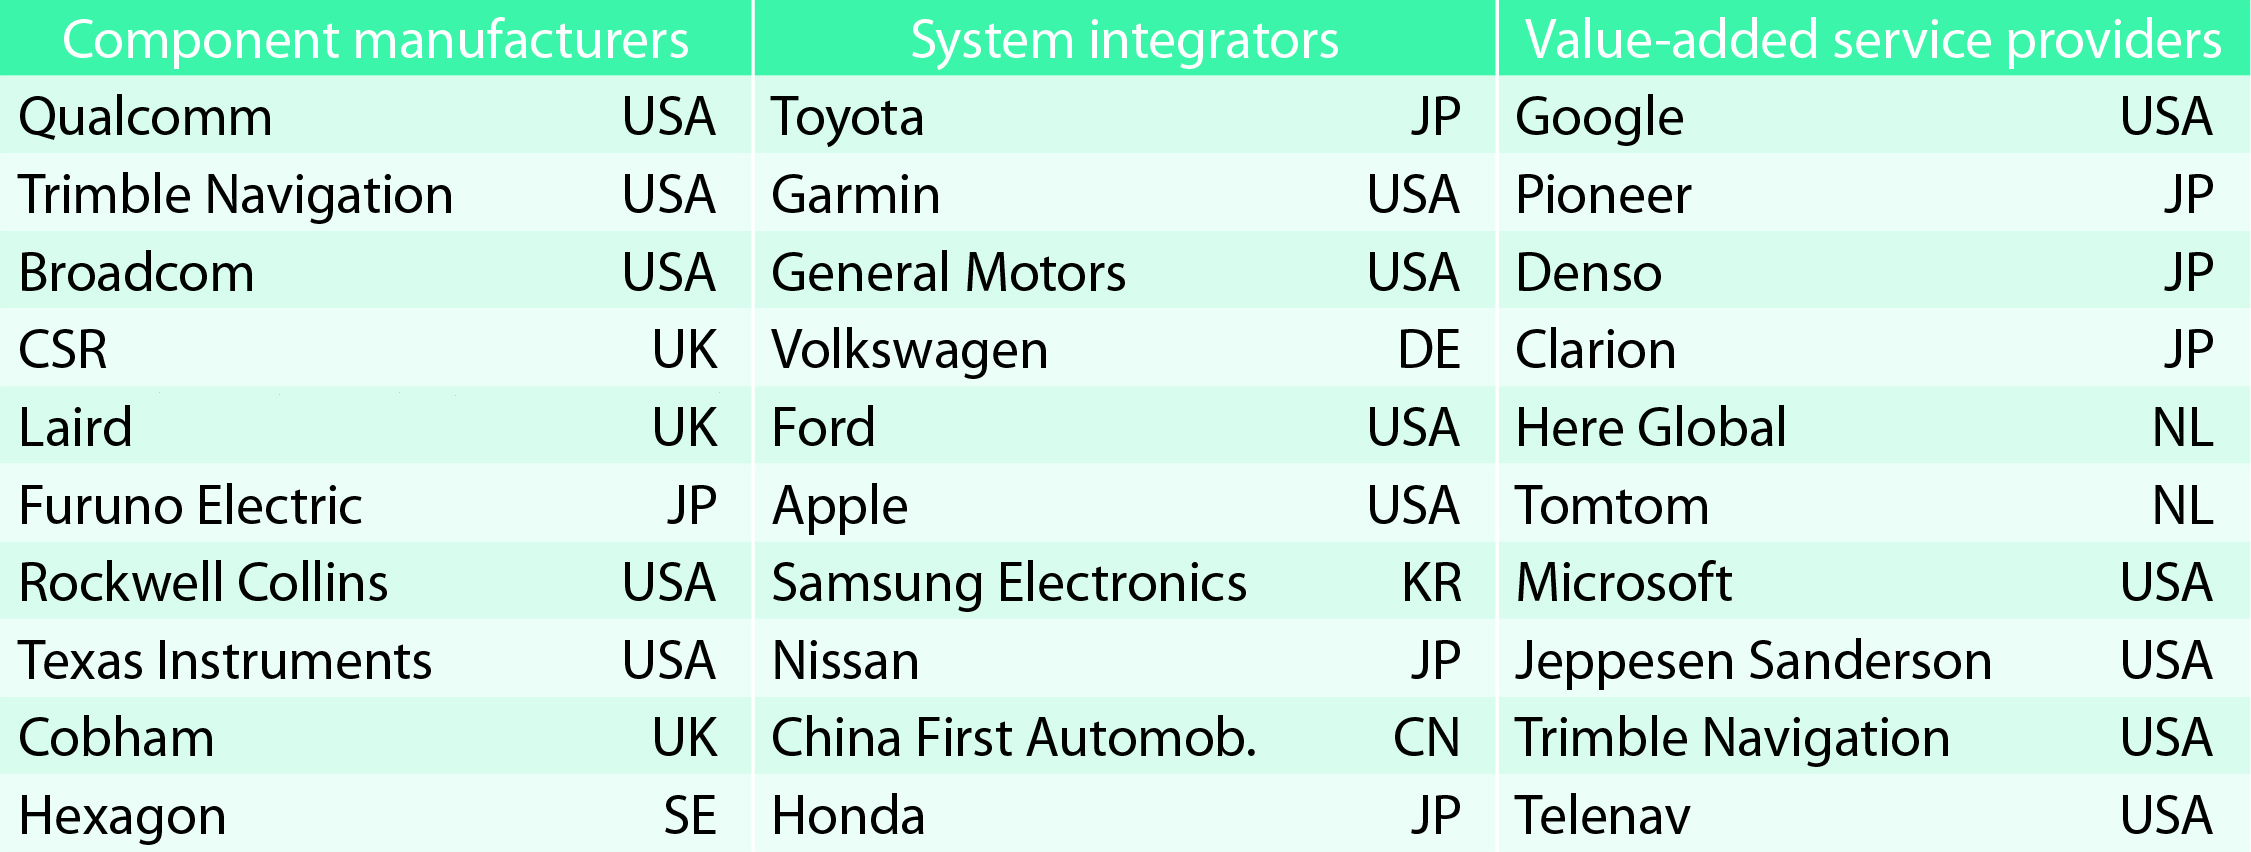
TABLE 1. Top 10 companies in each group based on 2012 revenue.
Key Findings
Top-line insights from the fourth GSA GNSS Market Report:
The global GNSS downstream market is forecast to increase by 8.3 percent annually from 2013– 2019, then slow down to 4.6 annually around 2023, growing on average faster (7 percent) than the forecast global GDP in this period (6.6 percent).
The installed base in the mature regions of EU28 and North America will grow steadily (8 percent per year) to 2023. The primary region of growth will be Asia-Pacific, which is forecast to grow 11 percent per year from 1.7 billion in 2014 to 4.2 billion devices in 2023 — more than the EU and North America together. The Middle East and Africa will grow at the fastest rate (19 percent per year), but starting from a lower base.
Location-Based Services (LBS) and Road dominate cumulative GNSS revenues, driven by booming sales of smartphones and in-vehicle devices, location-aware applications and data services.
With emerging economies catching up in terms of GNSS devices per capita, the Digital Divide will narrow, driven by the take-up of smartphones. The growing dominance of smartphones (3.08 billion in 2014) is foreseen as the most popular platform to access LBS.
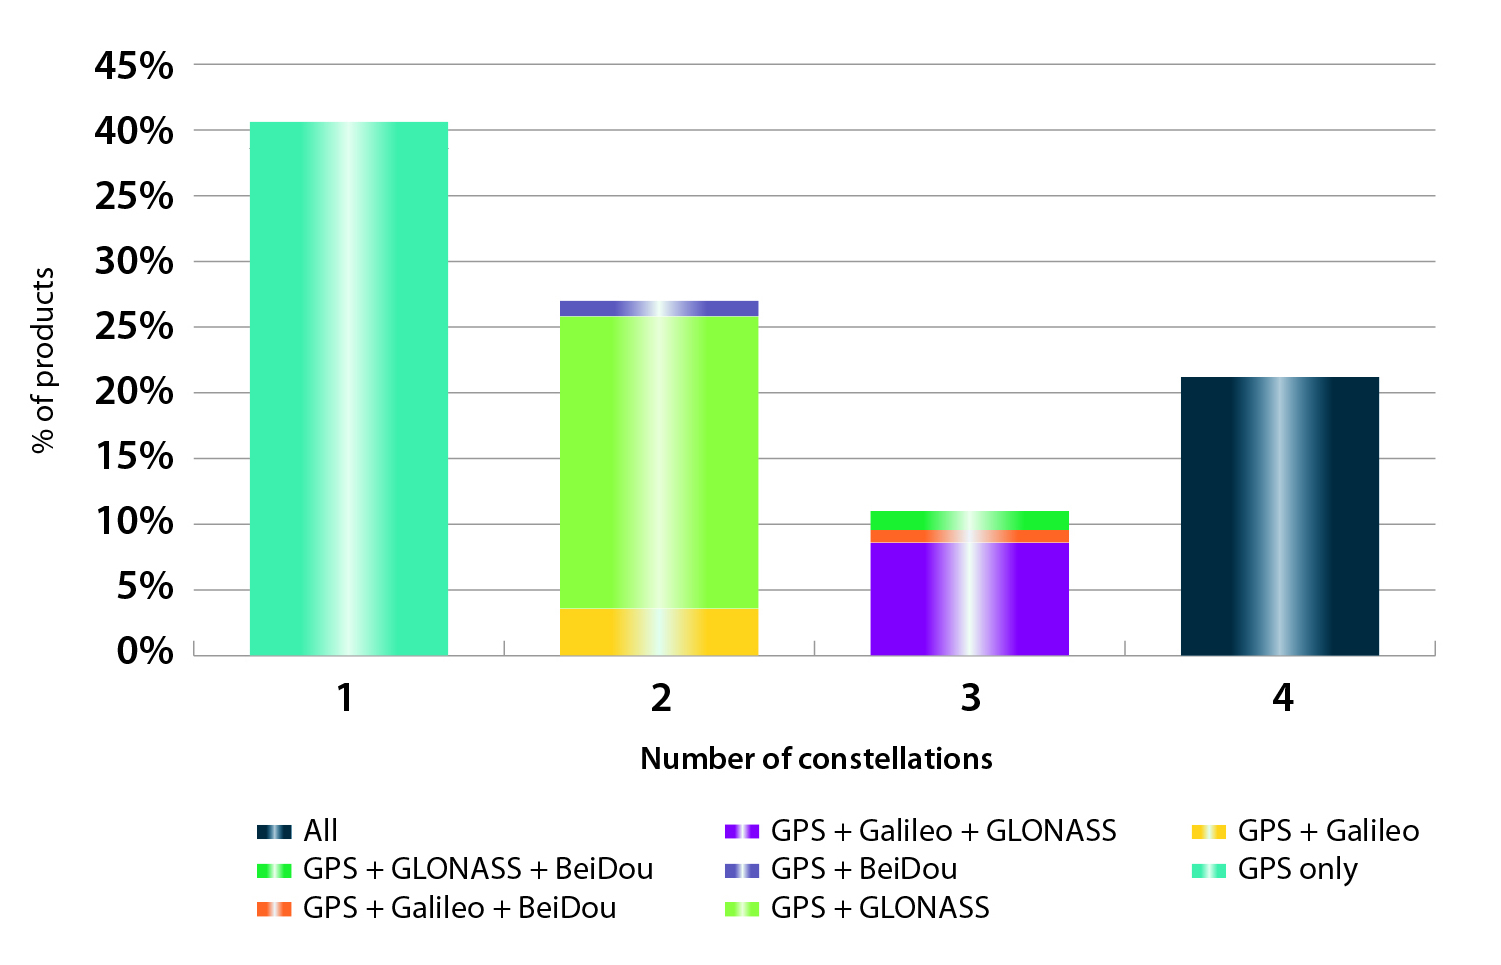
In the analysis of the capabilities of GNSS receivers and chipsets, it is reported that more than 60 percent of currently available receivers and chipsets support a minimum of two constellations with more than 20 percent supporting all four of them.
FIGURE 2. SUPPORTED CONSTELLATION BY RECEIVERS Chart shows the percentage of available receivers capable of tracking signals from one GNSS (such as GPS only), two GNSS (GPS + Galileo, GPS + GLONASS, GPS + BeiDou), three GNSS (GPS + Galileo + GLONASS, GPS + Galileo + BeiDou, GPS + GLONASS + BeiDou) or tracking signals from all constellations at the same time. The percentages add up to 100 percent. We can conclude that almost 60 percent of all available receivers, chipsets and modules are supporting a minimum of two constellations, showing that multi-constellation is becoming a standard feature across all market segments.
New Charts
The report includes new infographics presenting:
Global GNSS downstream market size, core and enabled (2013 to 2023)
GNSS industry share by region (2012)
The global shares of companies among components manufacturers, systems integrators and value-added service providers (2012)
Capability of GNSS receivers and chipsets, all segments (2015)
Supported constellation by receivers and chipsets , all segments (2015)
Detailed analysis of key GNSS segments: LBS, Road, Aviation, Rail, Maritime, Agriculture, Surveying, Timing and Synchronization, quantified in terms of:
Shipments of GNSS devices by application and region (2013 to 2023)
Installed base of GNSS devices by application and region (2013 to 2023)
Core revenues from GNSS device sales by application and region (2013 to 2023)
Capability of GNSS receivers and chipsets (2015)
Supported constellation by receivers and chipsets (2015).
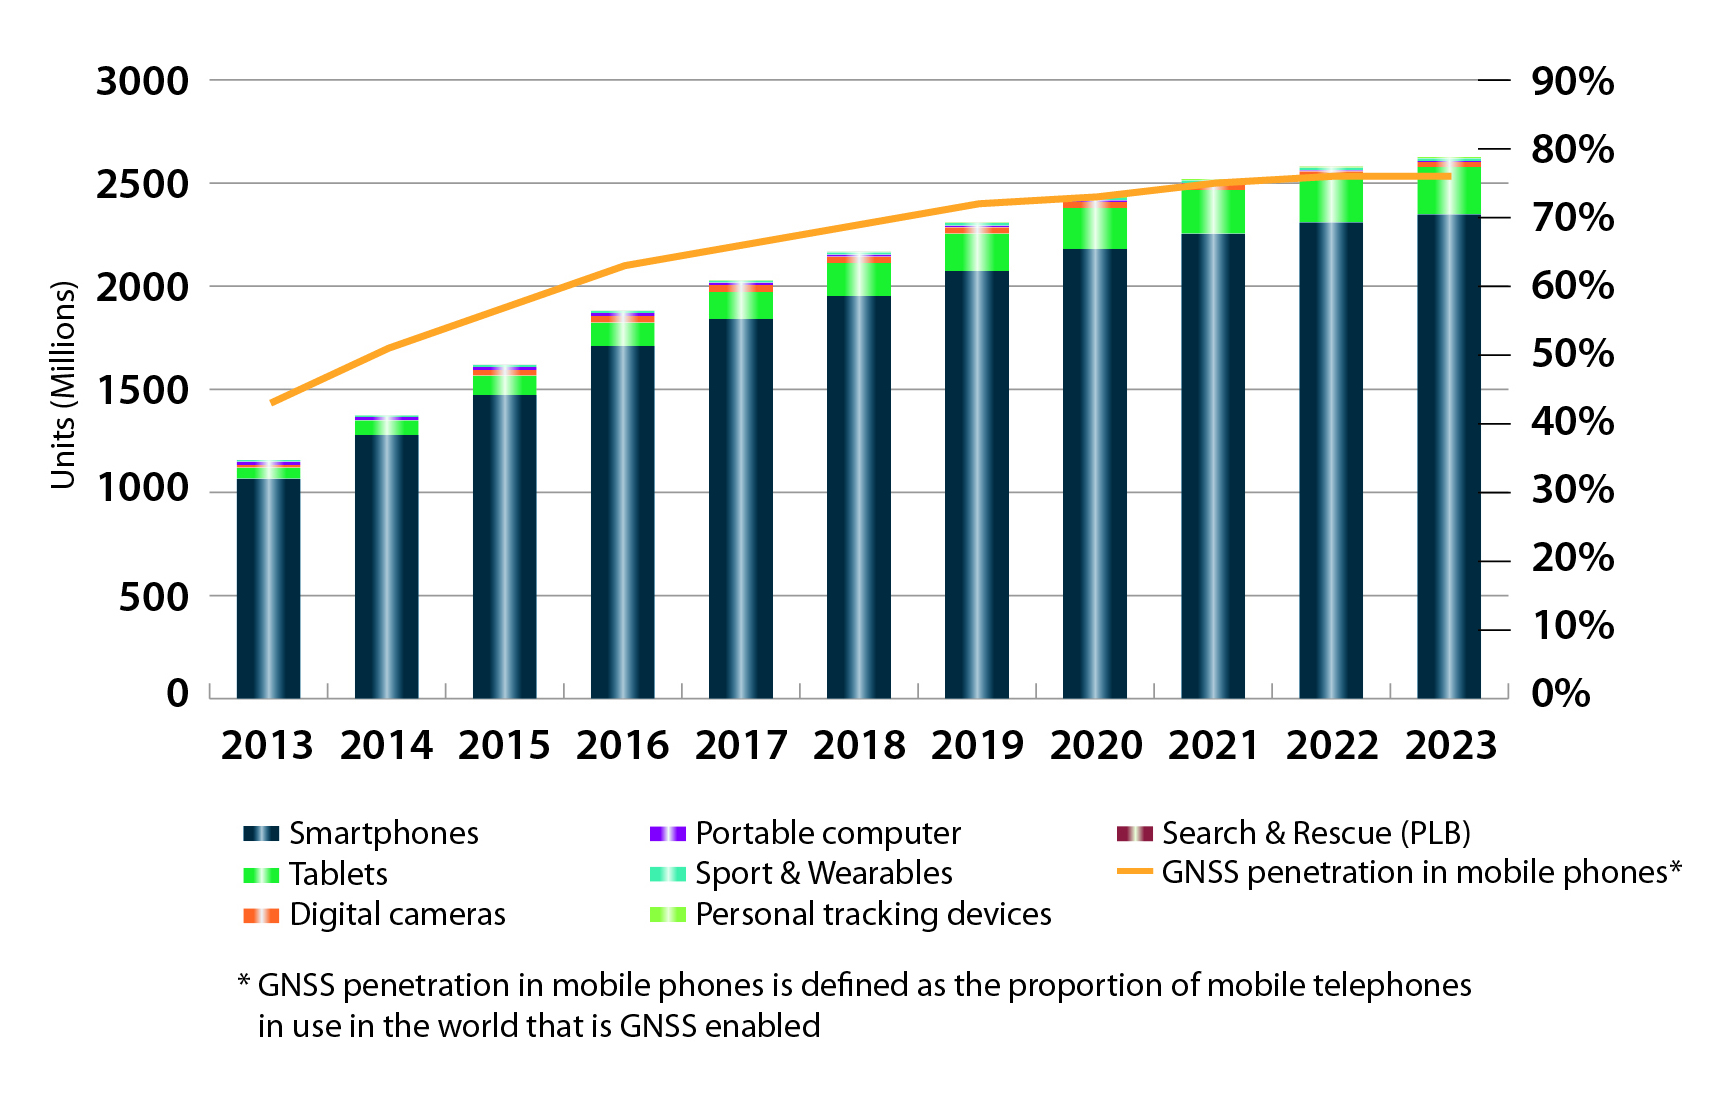
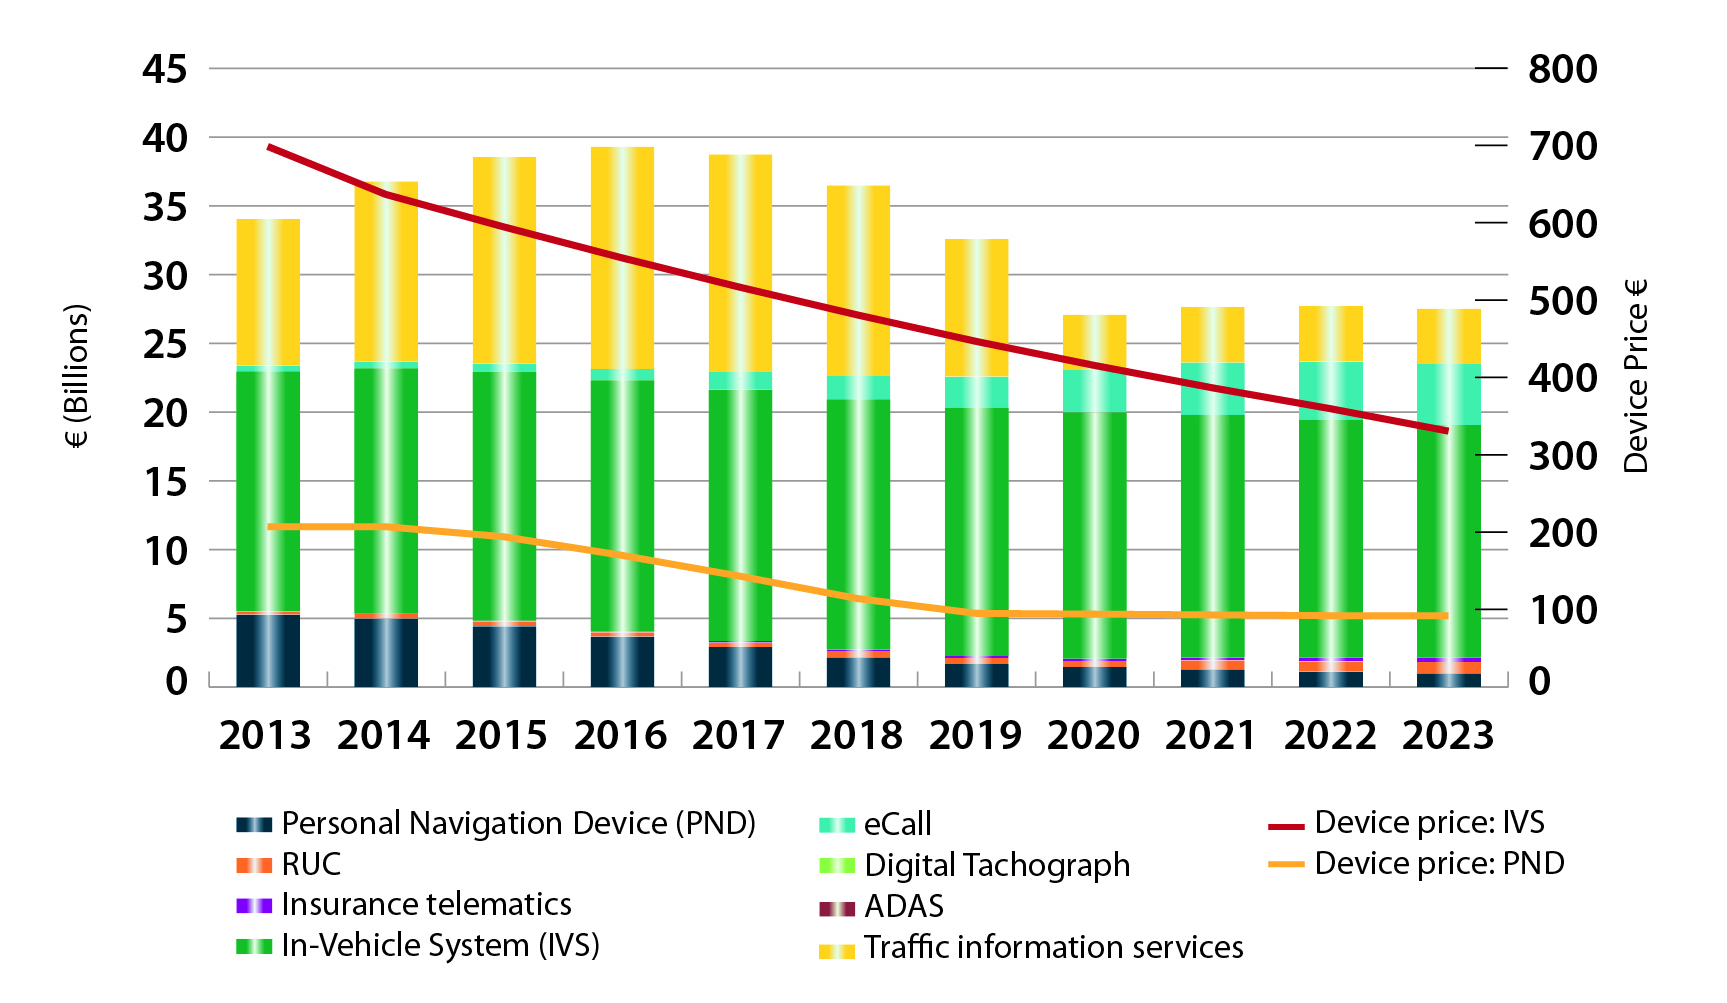
FIGURE 3. LOCATION-BASED SERVICES SECTOR GNSS shipments by type; GNSS penetration in mobile phones is defined as the proportion of mobile telephones in use in the world that is GNSS enabled.FIGURE 4. ROAD SECTOR Core revenue from GNSS device sales and services by application.
Methodology
The “GSA GNSS Market Report” is compiled by the GSA and the European Commission and was produced using the GSA’s systematic Marketing Monitoring and Forecasting Process.
The underlying market model uses advanced forecasting techniques applied to a wide range of input data, assumptions, and scenarios to forecast the size of the GNSS market in terms of shipments, revenue and installed base of receivers.
Historical values are anchored to actual data in order to ensure a high level of accuracy. Assumptions are provided by expert opinions and model results are cross-checked against the most recent market research reports from independent sources, before being validated through an iterative consultation process with sector experts and stakeholders.
A new defense market report from Strategic Defence Intelligence has been released. “The Global Military GPS/GNSS Market 2013-2023 – SWOT Analysis: Market Profile“ provides readers with an exhaustive analysis of industry characteristics, determining the strengths, weaknesses, opportunities and threats faced by the Military GPS/GNSS market.
This SWOT analysis of military GPS/GNSS market is designed for industry executives and anyone looking to gain a better understanding of the market. It utilizes a wide range of primary and secondary sources, which are analyzed and presented in a consistent and easily accessible format. SDI strictly follows a standardized research methodology to ensure high levels of data quality and these characteristics guarantee a unique report, the company said.
The report provides these features to readers:
Quickly enhance your understanding of the global Military GPS/GNSS market.
Gain insight into the marketplace and a better understanding of internal and external factors which could impact the industry.
Obtain an overview of the global Military GPS/GNSS market, with examples being provided for each section.