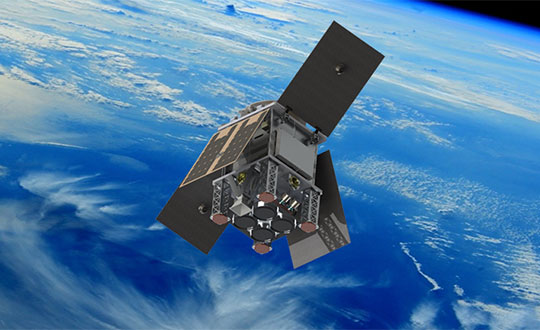
The small satellite will measure climate variables using GNSS Reflectometry
The European Space Agency (ESA) has selected HydroGNSS from Surrey Satellite Technology Ltd. (SSTL) for its second Scout Earth Observation small satellite mission. HydroGNSS is a 40-kg satellite that will be built and operated by SSTL.
ESA selected the first ESA Scout satellite, ESP-MACCS, in December 2020. ESP-MACCS focuses on understanding and quantifying processes in the upper atmosphere over the tropics — processes that play an important role in the overall evolution of the atmosphere.
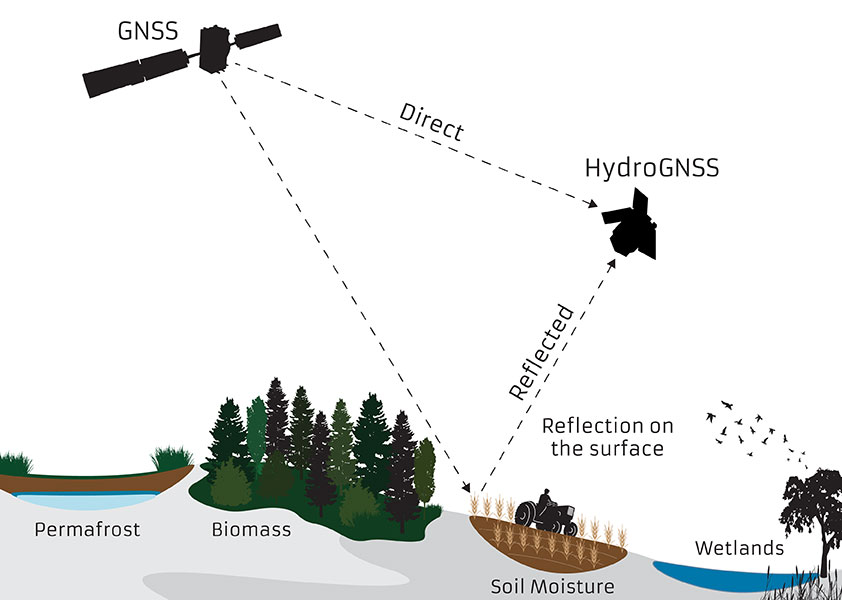
HydroGNSS will take measurements of key hydrological climate variables, including soil moisture, freeze thaw state over permafrost, inundation and wetlands, and aboveground biomass, using GNSS reflectometry. It will complement missions such as ESA’s SMOS and Biomass, Copernicus Sentinel-1 and NASA’s SMAP.
Both small satellites are expected to be the first in a series of ESA Scout missions demonstrating how small satellites on a budget of less than €30 million and a three-year schedule can play an important role in Earth observation, and be scaled up for future missions.
Knowledge of these variables helps scientists understand climate change and contributes towards weather modelling, ecology mapping, agricultural planning and flood preparedness.
“SSTL pioneered GNSS reflectometry, providing the payloads on TechDemoSat-1 and the NASA CYGNSS mission for measuring ocean wind speeds, and I am delighted that we will now launch the first satellite mission specifically addressing hydrological measurements using this innovative technique,” said Phil Brownnett, SSTL managing director.
Previously, addressing hydrological variables such as these has required sizable and higher cost satellites with large aperture antennas, but GNSS reflectometry uses existing signals from GNSS as radar signal sources. These signals are reflected off the land, ice and ocean and can be collected by a low power receiver on a small satellite in low Earth orbit, and used to yield important geophysical measurements.
Image: SSTL
SSTL is working closely with partners to tackle the scientific and technological challenges involved. Partners include Sapienza, Tor Vergata and IFAC-CNR in Italy; FMI in Finland; IEC/IEEC in Spain; and NOC and the University of Nottingham in the United Kingdom (UK),
“The decision to implement HydroGNSS after ESP-MACCS demonstrates that the Earth observation community is very interested in the concept of Scout missions. We are confident that this interest will further flourish when we see the first data in 2024,” said Toni Tolker-Nielsen, ESA’s acting director of Earth Observation Programmes.
As well as the already established GNSS-Reflectometry measurements, new techniques will be explored on HydroGNSS, including use of Galileo signals, dual polarization, dual frequency and recovery of coherently reflected components. These new measurements are expected to improve the separation, resolution and quality of the climate variables under observation.
The HydroGNSS mission exemplifies the UK’s innovation in climate change research, according to SSTL. The 26th United Nations Climate Change Conference takes place in the UK Nov. 1-12.
Image: SSTL
“The UK is leading the way in using space to tackle climate change, with Earth Observation satellites providing some of the most important data to monitor our environment as we build back greener,” said Science Minister Amanda Solloway. “Using a UK satellite just the size of a microwave oven, this pioneering mission will build on the UK’s expertise in space research by measuring changes in the Earth’s water, providing crucial information to address climate change, improve farming and support wider disaster management.”
HydroGNSS paves the way for an affordable future constellation that can offer measurements with a temporal-spatial resolution not accessible to traditional remote-sensing satellites, thus offering new capacity to monitor very dynamic phenomena and helping to fill the gaps in our monitoring of the Earth’s vital signs for the future.
“Seen & Heard” is a monthly feature of GPS World magazine, traveling the world to capture interesting and unusual news stories involving the GNSS/PNT industry.
Photo: welcomia/ iStock / Getty Images Plus / Getty Images
COVID brings better measurements
A new study shows that the quality of GNSS reflectometry measurements may have improved significantly during the pandemic because of the lack of cars parked near the ground station. The study, carried out by geodesists from the University of Bonn, investigated the location of a precise GNSS antenna in Boston, Massachusetts, where parked cars near the ground station decreased accuracy from 2 to 4 centimeters. GNSS reflectometry is used for earthquake early warning systems, determining flood risks, and many other geodesy applications. Read more about the study.
Photo: Daniel Leeb/Iceland Space Agency
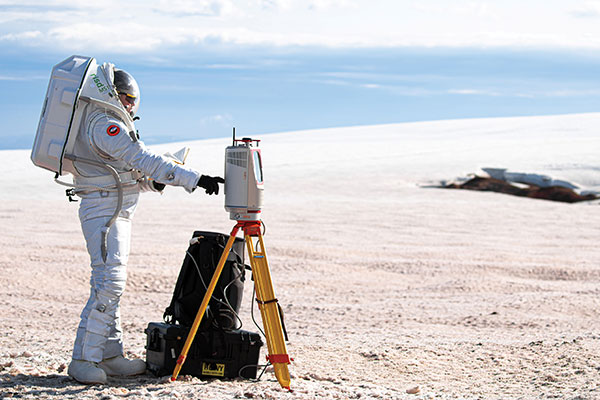
But can you press the right button?
A Riegl long-range terrestrial laser scanner helped field test the newly designed MS1 Mars Analog Spacesuit. The test simulated how the new spacesuit design would perform in a polar, Mars-like environment ‚ in this case atop the Grimsvötn Volcano on the Vatnajokull Glacier in Iceland. The field test was part of a research expedition conducted by the Iceland Space Agency. The team included NASA Coordinator and Rhode Island School of Design (RISD) Professor Michael Lye, who led the team that designed the MS1, and doctoral students from the University of Iceland.
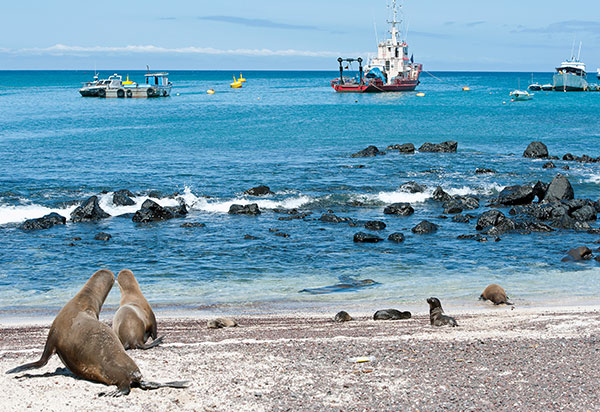
In June, a fleet of 300 Chinese fishing vessels entered the waters of the Galápagos Islands, reports environmental news website Mongabay. The ships had ostensibly turned off their GNSS-based automatic identification system (AIS) transponders to engage in illegal activities. Their presence was detected by their overhead lights and industrial jigging machines to attract and catch squid. An analysis of radio-signal data also detected unidentified ships within Ecuador’s Galápagos exclusive economic zone (EEZ).vThe new data provide additional, but still inconclusive, evidence that the Chinese fleet may have entered Ecuador’s EEZ.
A pilot program in Shenzhen will use China’s BeiDou to regulate bike-sharing and address the problem of bikes parked chaotically or in unpermitted areas, according to Chinese news service Caixin. The program is part of Beijing’s push for wider adoption and commercialization of BeiDou. With guidance from the city’s transportation bureau, BeiDou modules on shared bikes will display parking spots. Users will have to park them within geofenced parking spots.
The successful demo consolidates concept designs for a proposed land-sensing ESA Scout mission, HydroGNSS
Surrey Satellite Technology Ltd. (SSTL) has successfully demonstrated GNSS reflectometry (GNSS-R) from its 18-kg DoT-1 satellite. SSTL has pioneered the new field of GNSS-R with successful payloads on board TechDemoSat-1 and the CYGNSS constellation, and is continuing to develop the technology and data analysis in pursuit of this new science.
SSTL’s DoT-1 satellite was launched in 2019. (Photo: SSTL)
The GNSS-R payload onboard the DoT-1 satellite is incorporated within a new small-form-factor Core Avionics module integral to all SSTL’s future satellite platforms. This innovation paves the way for any SSTL satellite that can accommodate a nadir pointing antenna to become part of a GNSS-R small-sat constellation.
GNSS reflectometry is an Earth-observation technique that uses GNSS signals as L-band radar sources, allowing the satellite to take measurements of ocean wind speeds, polar ice and hydrological land parameters, at a higher spatial resolution and an order of magnitude lower cost than other methods.
“GNSS-R is a powerful new science that can contribute valuable data to help monitor changes in our global climate, and I am really pleased with the success of our DoT-1 demonstration.,” said Phil Brownnett, managing director of SSTL. “We now have an advanced instrument design and deep expertise in this new field, and I am hopeful that SSTL’s HydroGNSS concept will progress to a full mission to support the global climate-control challenge.”
HydroGNSS mission
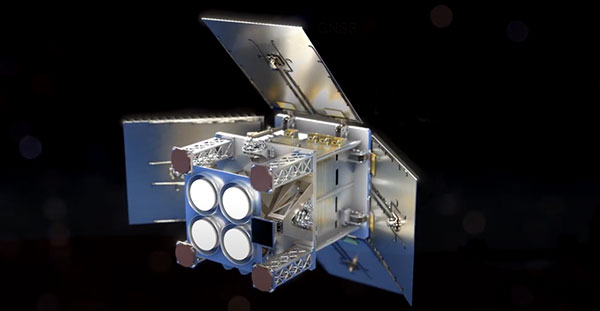
The GNSS-R technology demonstration from SSTL’s DoT-1 satellite is also an important stepping stone for a proposed European Space Agency (ESA) Scout Mission Concept called HydroGNSS, which comprises two 40-kg satellites that collect data continually in near-polar orbits, taking hydrological measurements over the whole globe.
The HydroGNSS mission concept makes advanced use of new GNSS reflectometry techniques such as Galileo signals, dual polarization, and coherent signal acquisition to measure four Essential Climate Variables (ECVs) over land: soil moisture, inundation, permafrost freeze/thaw, and biomass. HydroGNSS has been down-selected by ESA for a concept study; the finally selected Scout mission will commence in 2021.
The below animated video illustrates the HydroGNSS mission.
SSTL’s GNSS-R instrument collects and processes measurements into a “delay Doppler map” (DDM) that can be corrected and inverted into Level 2 products such as ocean wind speed, as has already been successfully demonstrated by the SSTL GNSS-R instruments onboard the TechDemoSat-1 and CYGNSS missions.
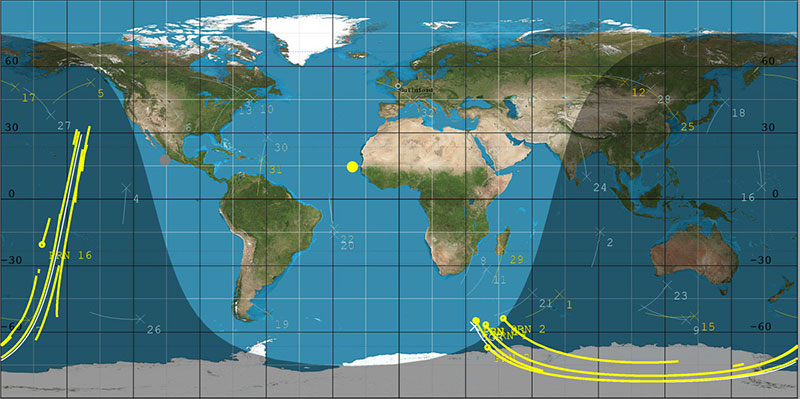
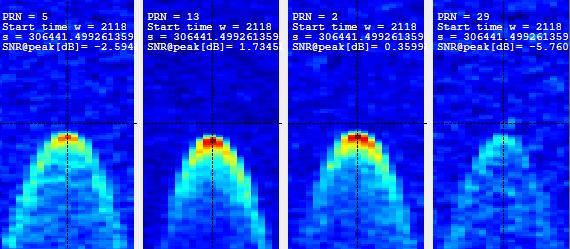
The plot below shows results from data gathered by the DoT-1 satellite on Aug. 12, and shows simultaneous DDMs from four separate GPS satellites. As this is a forward scattering technique, the stronger signals with redder peaks indicate a calmer ocean with lower wind speeds. Approximately 40 minutes of data were collected from the Pacific to the Antarctic to the Southern Ocean.
DoT-1 sub-satellite track (white) and GPS reflection tracks (yellow) collected during 40 minute data operation. (Image: SSTL)Four Delay Doppler Maps (DDMs) collected by DoT-1 that show signal reflections from four GPS satellites. (Image: SSTL)
Soil moisture measurements
Data from the SSTL GNSS-R instruments onboard the CYGNSS mission have demonstrated the potential for soil moisture measurement by GNSS reflectometry, and preliminary work shows that GNSS-R also has good sensitivity for freeze/thaw sensing in the active zone of permafrost. Unseasonal changes in the permafrost cycles could potentially release larger quantities of methane, which risks exacerbating global climate change.
GNSS-R can also be used to assess biomass, a measure of forest density which acts as a vital sink for removing carbon dioxide from the atmosphere. In addition to longer term climate observations, soil moisture and inundation measurements from GNSS reflectometry can provide important information for short-term operational purposes, for example, towards Numerical Weather Prediction and flood warnings following rainfall events.
The development of SSTL’s new GNSS-R instrument was funded in part by the European Space Agency.
Parked cars near ground station decreased accuracy from 2 to 4 centimeters
A new study shows that the quality of GNSS reflectometry measurements may have improved significantly during the pandemic because of the lack of cars parked near the ground station, according to Science Daily. GNSS reflectometry is used for earthquake early warning systems, determining flood risks, and many other geodesy applications.
The study, carried out by geodesists from the University of Bonn, investigated the location of a precise GNSS antenna in Boston, Massachusetts.
GNSS reflectometry works well if the surrounding ground is flat, like the surface of a mirror, study author Jürgen Kusche explained to Science Daily. “But many GNSS receivers are mounted on buildings in cities or in industrial zones. They are often surrounded by large parking lots — as is the case with the antenna we investigated in Boston.”
The researchers show that parked cars significantly reduced the quality of the elevation data by scattering the GNSS signals, causing them to be reflected several times before they reached the antenna, like a cracked mirror. This reduces signal intensity and provides “noisy” data — hard to correct with pattern recognition because the parked cars change positions every day.
“Before the pandemic, measurements of antenna height had an average accuracy of about 4 centimeters due to the higher level of noise,” Makan Karegar told Science Daily. “During the lockdown, however, there were almost no vehicles parked in the vicinity of the antenna; this improved the accuracy to about 2 centimeters.”
While GNSS stations were historically installed in sparsely populated regions, recent installations have been in urban areas to support engineering and surveying work.
“Our study recommends that we should try to avoid installation of GNSS sensors next to parking lots,” Karegar said.
Citation. Makan A. Karegar, Jürgen Kusche. Imprints of COVID‐19 lockdown on GNSS observations: An initial demonstration using GNSS interferometric reflectometry. Geophysical Research Letters, 2020; DOI: 10.1029/2020GL089647
NASA is partnering with the New Zealand Ministry of Business, Innovation and Employment, New Zealand Space Agency, Air New Zealand and the University of Auckland to install next-generation GNSS reflectometry receivers on passenger aircraft to collect environmental science data over New Zealand.
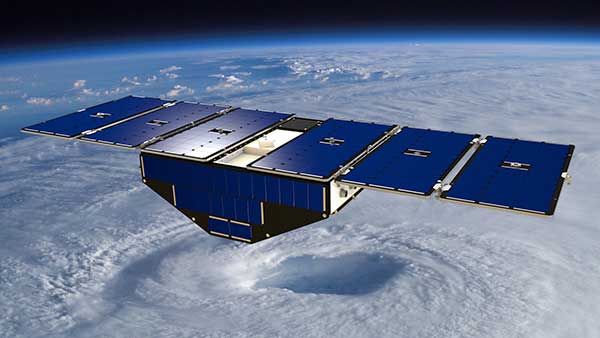
The program is part of NASA’s Cyclone Global Navigation Satellite System (CYGNSS) mission, a constellation of eight small satellites launched in 2016 that use GPS satellite signals that reflect off Earth’s surface to collect science data.
The CYGNSS satellites orbit above the tropics and their primary mission is to use GPS signals to measure wind speed over the ocean by examining GPS signal reflections off choppy versus calm water. This allows researchers to gain new insight into wind speed over the ocean and will allow them to better understand hurricanes and tropical cyclones.
Measurements over land
In addition to its primary over-water research capabilities, scientists have discovered that the CYGNSS technology is also capable of collecting valuable measurements over land, including of soil moisture, flooding, and wetland and coastal environments.
“Partnering with New Zealand offers NASA and the CYGNSS team a unique opportunity to develop these secondary capabilities over land. Taken together over time, they’ll also have an important story to tell about the long-term impacts of climate change to these landscapes,” said Gail Skofronick-Jackson, CYGNSS program scientist at NASA Headquarters, Washington.
The CYGNSS team, led by principal investigator Chris Ruf at the University of Michigan in Ann Arbor, has developed a next-generation GNSS reflectivity receiver with support from NASA’s Earth Science Technology Office. These receivers will be installed in late 2020 on one of Air New Zealand’s Q300 domestic aircraft.
Artist’s concept of one of the eight CYGNSS satellites in orbit. (Image: NASA/University of Michigan)
Aircraft overlap satellite path
As the aircraft traverses New Zealand, it will collect data from the land below, some of which will overlap with the flight paths of the CYGNSS satellites.
This overlap, which will have frequent data observations from regular commercial flights, will provide the CYGNSS team a wealth of data to use to validate and improve the CYNGSS satellite observations, said Ruf.
In addition, the varied New Zealand terrain will provide comparison points with data collected in similar terrains in other parts of the world.
“As a result of this partnership, both Air New Zealand engineers and researchers across New Zealand will now have the opportunity to work with NASA on a world-leading environmental science mission,” said Peter Crabtree, general manager of Science, Innovation and International at New Zealand’s Ministry of Business, Innovation and Employment.
Science Payload Operation Centre
The University of Auckland will host the Science Payload Operation Centre, which will begin operations and data collection in late 2020.
“Over time, the data that will be collected by these receivers could form one of New Zealand’s largest bodies of long-term environmental data, and as such it represents a wide range of research opportunities,” said radar systems engineer and project lead Delwyn Moller of the University of Auckland.
Air New Zealand will be the first passenger airline to partner with NASA to collect data for a science mission. Air New Zealand has 23 Q300s in its fleet, and if the approach is successful, the airline will explore introducing the technology more widely.
An Air New Zealand Bombadier Q300. (Photo: Air New Zealand/NASA)
“As an airline, we’re already seeing the impact of climate change, with flights impacted by volatile weather and storms. Climate change is our biggest sustainability challenge, so it’s incredible we can use our daily operations to enable this world-leading science,” said Air New Zealand Chief Operational Integrity and Standards Officer Captain David Morgan.
Traditional tide gauges are in contact with the water surface and as a result are susceptible to measurement error and damage during extreme weather. An alternative approach is the use of GNSS reflectometry. We learn how this innovative use of satellite navigation signals works in this month’s Innovation column.
Innovation Insights with Richard Langley
Seawater level is conventionally monitored by tide gauges that measure the vertical distance of the water surface from a point on the ground. As the tide gauges provide seamless and highly accurate measurements, many countries operate a tide-gauge network to monitor sea-level changes and to assess flood risk. For example, the National Oceanic and Atmospheric Administration (NOAA) operates a permanent observing system, the National Water Level Observation Network (NWLON), with more than 400 gauges throughout the United States.
However, some challenges of tide gauges can be identified. Firstly, tide-gauge measurements require direct contact with the water, which causes limitations in installing and maintaining the equipment. The equipment requiring direct sensing is highly vulnerable to coastal hazards, such as coastal flooding and tsunamis, resulting in potential measurement errors or even equipment destruction during severe natural events.
Furthermore, tide gauges require maintenance on a regular basis, which is expensive because it requires the use of divers. This greatly limits the operation of tide gauges, especially in extreme environments such as in the Arctic. Alaska, for example, has significant gaps in its available spatially-varying tidal information. However, in the Arctic, it is also very important to constantly and closely monitor the long- and short-term variation of water levels because this area has a significant impact on global climate and ecosystems. Consequently, more support is needed for sea-level monitoring and coastal mapping in this region.
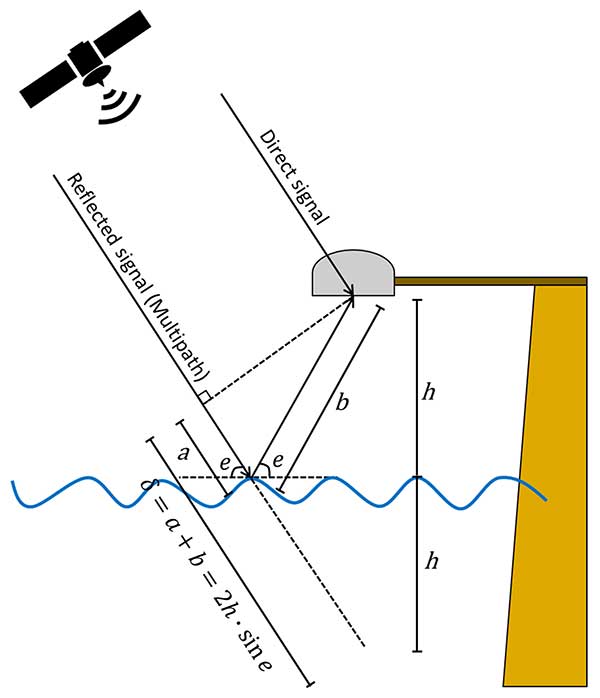
GNSS can serve as an alternative approach for water-level monitoring. GNSS satellites continuously transmit radio signals and ground-based, space-based, and airborne receivers access the signals regardless of weather conditions. Some of the received signals are reflected from obstacles or surfaces near the antenna, a phenomenon referred to as multipath (see FIGURE 1).
FIGURE 1. Schematic drawing of the GNSS-based tide gauge. (Image: Authors)
Multipath tends to be regarded as one of the major error sources for GNSS positioning where it causes unexpected phase delays when compared to the direct signal. Consequently, various procedures have been developed to mitigate the multipath effect. However, the GNSS signals reflected from the Earth’s surface contain information about the geophysical properties of the reflecting surface. The use of these signals is known as GNSS reflectometry (GNSS-R). GNSS-R allows us to monitor the temporal variation of water levels by calculating phase delays of GNSS signals reflected from the water surface. A GNSS-R-based tide gauge does not require direct contact with the water because it measures the water levels based on a remote-sensing technique. Thus, a GNSS-R-based tide gauge can be effectively applied to water-level monitoring.
However, several challenges exist in processing GNSS signals observed at high latitudes compared to mid-latitudes. Not only do we have to contend with extreme weather conditions and limited infrastructure availability, but also with problematic satellite geometry and ionospheric effects on the GNSS signals. To overcome these limitations in the use of GNSS-R in the Arctic, we introduce enhanced algorithms to improve the temporal and spatial resolutions of GNSS-R sea-level measurements.
Our approach includes an enhanced spectrum analysis based on multi-frequency signals and statistical reliability verification. Moreover, we include the signals transmitted by the Galileo constellation in addition to GPS to improve the quantity and the quality of GNSS observations in the Arctic. We have tested the proposed method with an experiment in Alaska and validated the results with nearby tide gauges. The experimental results clearly show the feasibility of employing GNSS-R-based tide gauges in the Arctic.
GNSS-R-BASED WATER-LEVEL MONITORING
Martin-Neria first introduced a method of monitoring sea level using the GNSS-R technique in 1993. Thereafter, many studies have been conducted to apply GNSS-R to water level estimation. Anderson proposed a method to estimate sea level using the interference pattern caused by the direct and reflected GNSS signals, which relies on the fact that the spacing between peaks in the interference pattern is almost entirely dependent on the height of the antenna above the reflecting surface.
The phase difference in the GNSS receiver between the direct and the reflected satellite signals varies while the geometry of a GNSS satellite changes (see Figure 1), generating the interference pattern. The interference pattern is particularly noticeable in signal-to-noise ratio (SNR) data. The reflected signals contribute to the SNR data in the form of oscillations, while the smoothly rising overall arc mostly depends on the signal strength and the antenna gain pattern.
The reflected signals can be isolated from the SNR data by removing the main trend — for example, by polynomial fitting — indicative of the direct signal. The frequency of the remaining dSNR oscillations is constant with respect to the sine of the elevation angle, assuming that the water level does not change during the satellite arc and the reflection surface is horizontal. Consequently, the frequency of the oscillation is linearly proportional to the height of the antenna above the reflecting surface.
The frequency can be derived from the dSNR data by spectral analysis. Among a number of spectral-analysis methods, the Lomb-Scargle periodogram (LSP) is commonly applied since it allows for processing of unevenly sampled data.
Determining the frequency of the oscillations. The antenna height above the water surface is directly calculated from the frequency of the oscillations derived from LSP processing. However, it is difficult to determine the dominant frequency because of the roughness of the water surface, especially in extreme environments such as Arctic regions with high currents and strong winds. In addition, the observed SNR data is easily affected by obstacles near the GNSS antenna. Therefore, it is difficult to distinguish the spectral peak of the signal reflected from the water surface from other additional reflected signals, especially when additional and unexpected reflections occur near the sea surface.
To minimize the erroneous determination of the frequency of the oscillations using dSNR, we can take advantage of the multiple frequencies of modern GNSS signals. In our study, we processed signals from both the GPS and Galileo constellations, with GPS transmitting three carrier signals (L1, L2 and L5) and Galileo transmitting five carrier signals (E1, E5a, E5b, E5ab and E6).
By comparing the spectrum peaks from the multiple signals on different frequencies, one can analyze the dominant peaks across the different frequencies on the same raypath. This algorithm is based on the fact that the multiple frequency signals should detect consistent sea-level heights because they are transmitted along the same raypath during the same period. One of the biggest advantages of this approach is that no additional data or equipment is required to accurately determine the frequency of oscillations of the GNSS signals reflected from the water surface.
Statistical Testing of Retrieved Sea Levels. Reflected signals are not necessarily all from the sea surface. To remove erroneous solutions, we conducted a statistical test. Data including measurement errors and/or some noise can be approximated to the model by the least squares method that determines the model parameters by minimizing the sum of squared residuals. However, this method yields an incorrect result when many outliers deviating from the normal distribution are included in the data set.
This problem can be overcome by applying RANdom SAmple Consensus (RANSAC). RANSAC stochastically estimates the model parameters maximizing consensus, that is, the parameter supported by the largest number of sample data through an iterative process. However, the RANSAC results can act differently each time for the same input data because it is essentially a statistical estimation method using random samples. Therefore, we perform RANSAC with rough constraints primarily to remove outliers significantly out of normal range, then the remaining noise in the data can be excluded by performing secondary fitting using tightly constrained least squares. For the least squares procedure, a series was applied for the fitting model, which represents various motions of the sea surface such as ocean tide loading, as a sum of trigonometric functions.
SEA-LEVEL MONITORING IN ST. MICHAEL
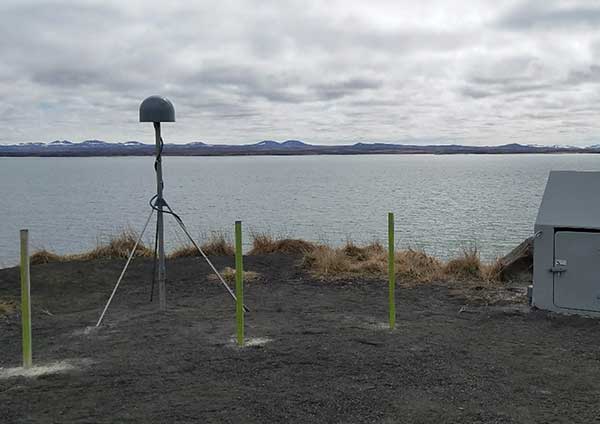
The Plate Boundary Observatory (PBO) network operated by UNAVCO (formerly the University NAVSTAR Consortium) is primarily designed to monitor long-term tectonic and volcanic deformation. However, it can also be used for GNSS-R applications. A new PBO station, AT01, was installed in May 26, 2018, in St. Michael, Alaska, which is designed to be suitable as a GNSS-R-based tide gauge with a clear and wide-open view toward the sea covering from 0° to 230° in azimuth (see FIGURE 2). The equipment at this site consists of a Trimble choke-ring geodetic antenna and a Septentrio PolaRx5 receiver that can receive not only GPS signals but also those of Galileo, with data recorded every 15 seconds.
FIGURE 2. The surrounding area of AT01 in St. Michael, Alaska: south view. (Photo: Authors)
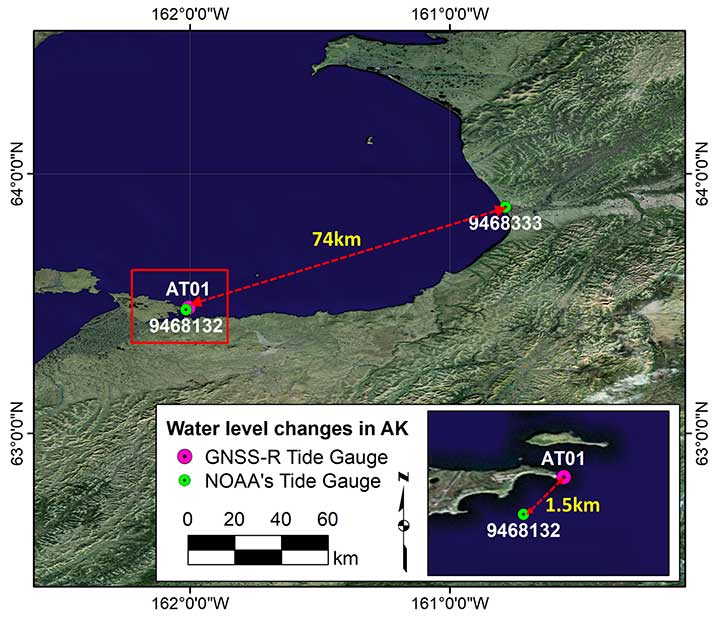
We have used this station to assess our technique using one month of SNR data from June 2018. It should be emphasized that not only GPS but also Galileo signals were processed, and the Center for Orbit Determination in Europe’s Multi-GNSS Experiment final orbit and satellite clock products were used to minimize the satellite orbit error. Additionally, NOAA tide gauge stations (9468132 and 9468333) were used for comparison and verification of the water levels measured from the GNSS-R-based tide gauge (see FIGURE 3).
FIGURE 3. Locations of AT01 and two NOAA tide-gauge stations (9468132 in St. Michael and 9468333 in Unalakleet). The red box represents the zoomed area at the bottom right. (Image: Authors)
The 9468132 tide gauge in St. Michael is the nearest tide gauge at approximately 1.5 kilometers from AT01. However, since it is not operational, NOAA only provides water-level predictions (just high and low tides) based on the harmonic constituents, not the actual measurements. On the other hand, the 9468333 tide gauge in Unalakleet is approximately 74 kilometers away from AT01. This makes it difficult to use the tide gauge as ground truth, but it does provide the actual sea-level measurements including any abnormal daily variations during the observation period. Therefore, we used the water-level predictions and measurements from both stations to validate the GNSS-R-based water-level measurements at AT01.
Determination of Water Level. The GPS and Galileo SNR data were independently analyzed using our in-house software package (written in MATLAB) using the following procedures.
As a preprocessing step, each SNR data series was examined to filter out the signals reflected from other surfaces surrounding the antenna and to isolate the signals that were reflected by the sea surface. Since AT01 PBO station was installed to investigate the feasibility of its use as a GNSS-R-based tide gauge, the most effective azimuth and elevation ranges were given, which are 0° to 230° and 10° to 25°, respectively.
The azimuth and elevation angle ranges were applied, which effectively removed reflected signals from surfaces other than the sea surface. After identifying the SNR data affected by the reflection from the sea surface, the processing windows were dynamically determined by the continuous path and direction (ascending and descending) of the satellites, and the height of the sea surface was estimated using only a portion of the satellite arc contained within each processing window.
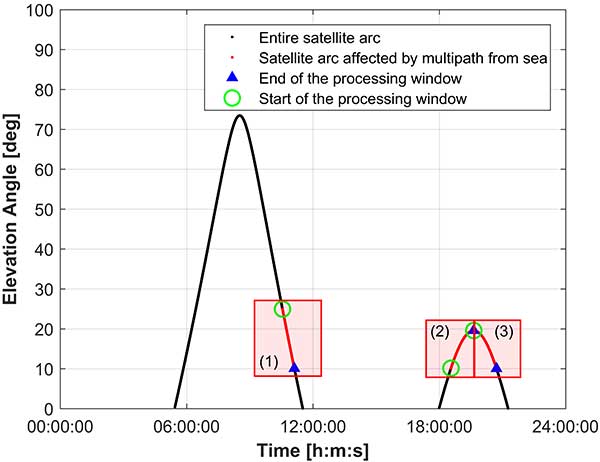
For example, FIGURE 4 shows the processing windows determined for the GPS satellite PRN 1 on June 1, 2018. The red dots in the figure show the parts of the satellite arcs affected by multipath from the sea surface. The data was divided into three processing windows due to the arc discontinuities and satellite path directions. It should be noted that only the processing windows with a data span of 30 minutes or longer were used for water level estimation. This minimum data span duration of 30 minutes was empirically determined by observing the probability of failure of the water -level calculation for shorter spans.
FIGURE 4. An example of the processing window determination for GPS satellite PRN 1 on June 1, 2018. (Image: Authors)
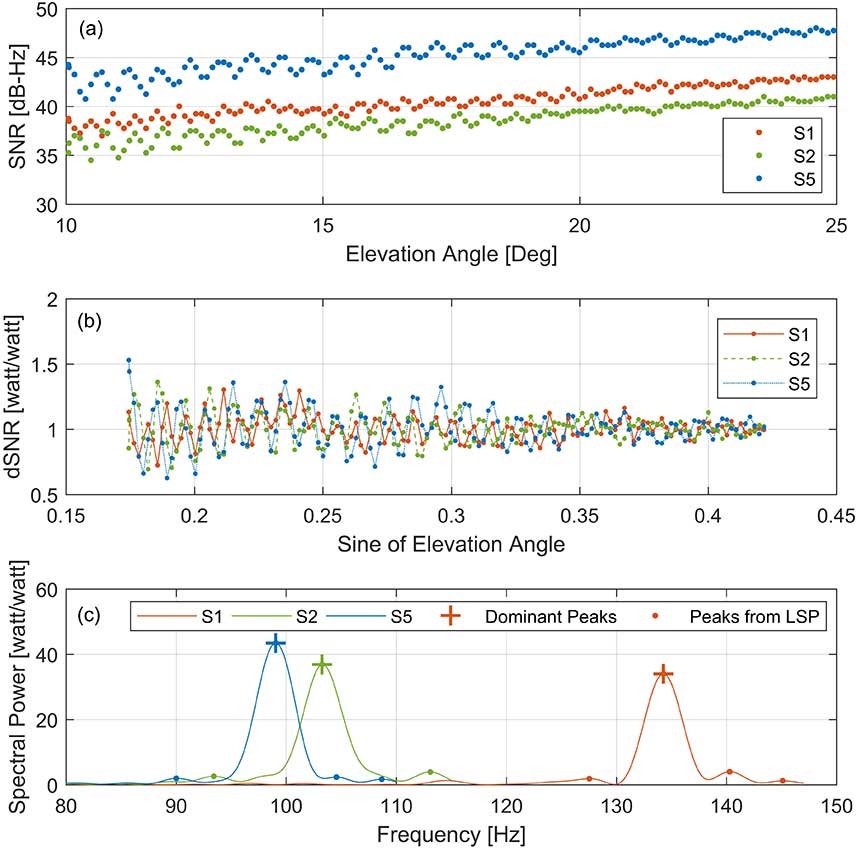
To isolate multipath effects from the SNR observation, we removed the trend in the SNR by a second-order polynomial fitting using only the portion of a satellite arc contained within each window. FIGURE 5 (b) shows the detrended SNR (dSNR) from FIGURE 5 (a), and the impact of the multipath is clearly identified in the form of the oscillation. As discussed earlier, the oscillation frequency is related to the antenna height above the sea surface. Accordingly, the dSNR data was analyzed through an LSP. As shown in FIGURE 5 (c), multiple peaks are founded from the LSP results of each dSNR series, and it is not easy to distinguish the frequency of the reflected signal from the sea level among these peaks.
Since multiple frequency signals from the same satellite must detect the same sea-level height, the final dominant peak was determined by checking the consistency of the resulting heights from each dominant peak among the multi-frequency signals. After that, the dominant frequency was converted to the antenna height above the reflection surface, which was then subtracted from the orthometric height of the antenna (the height above the geoid or, approximately, the height above mean sea level [MSL]) to refer the height of the instantaneous sea surface to MSL.
FIGURE 5. SNR data-analysis procedures with PRN 1 GPS on June 1, 2018: (a) The SNR data affected by the reflection from the sea surface, (b) detrended SNR data through a second-order polynomial, and (c) LSP results and dominant peaks of each frequency. (Image: Authors)
After analyzing all SNR data observed during one day, we carried out the reliability test of the retrieved sea levels to reject erroneous sea-level solutions.
RESULTS AND VALIDATION
The water-level changes from the GNSS-R-based tide gauge at St. Michael were compared to the independently predicted and measured sea levels from the neighboring St. Michael and Unalakleet tide gauges during June 1–30, 2018. Although the tide gauges are considered reliable ground truth, our experimental study must take into account the physical distance between the sites (about 1.5 and 74 kilometers from AT01, respectively) as well as the difference coming from the model versus the actual measurement.
In addition, a vertical offset between the data time series of the GNSS-R-based tide gauge and the standard tide gauges should be considered due to their different datums. Whereas the GNSS-R-derived sea level refers to a geodetic datum — namely the U.S. National Spatial Reference System (NAVD 88) — a standard tide gauge is highly localized with reference to a tidal datum such as local mean sea level. Generally, the difference between the geodetic and tidal datums is provided by NOAA, which allows us to convert between two vertical datums.
However, the vertical datum in Alaska has significant gaps in the spatially varying tidal information because of the difficulties of operating tide gauges there so that accurate information for datum conversion cannot be obtained. Therefore, the averages of the vertical differences were calculated (–6.44 centimeters for the St. Michael tide gauge and 9.54 centimeters for the Unalakleet tide gauge), which were then applied to each of the time series to make the comparisons. In fact, such a problem implies another advantage of a GNSS-R-derived tide gauge: it already returns a water-level height based on the terrestrial datum so that the datum of the land and the ocean can be consistently retained.
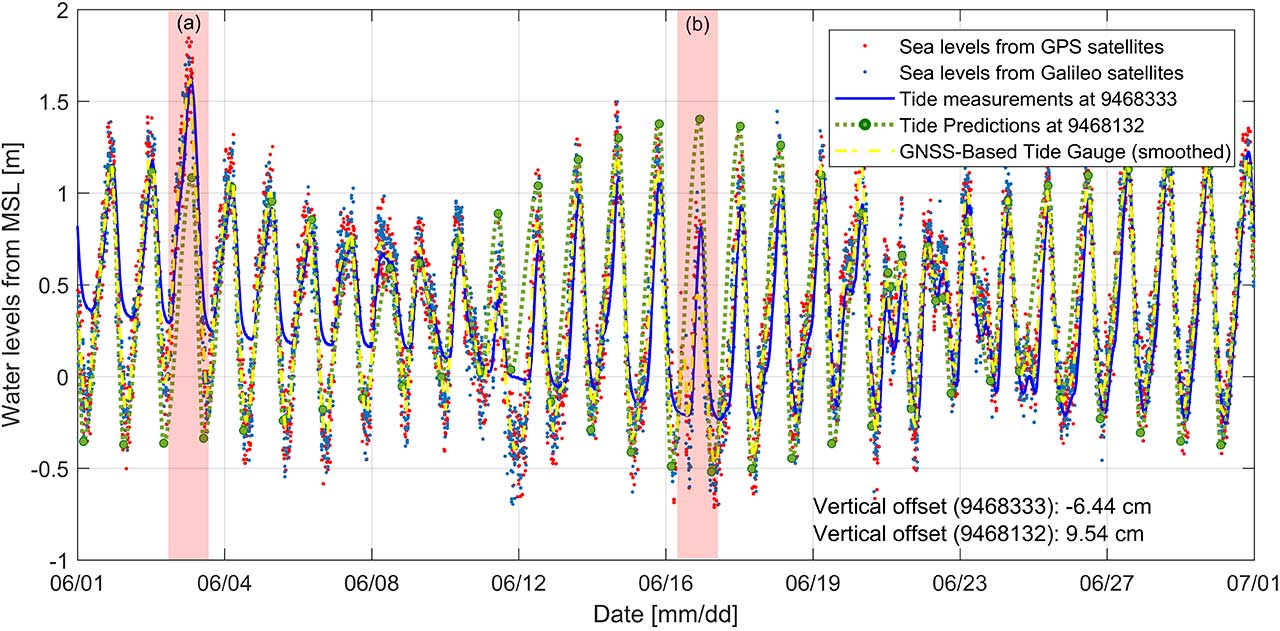
FIGURE 6 shows the sea level derived from the GNSS-based tide gauge measurements using GPS (red dots), Galileo (blue dots), the predicted sea level from the St. Michael tide gauge (green dots and lines) and measured sea level from the Unalakleet tide gauge (blue line).
FIGURE 6. Time series of sea level derived by GNSS-R-based tide gauge (AT01) in St. Michael, Alaska, during a month (red and blue dots for GPS and Galileo satellites, respectively; yellow dashed lines for the smoothed time series from two hours’ moving average filter) together with sea-level measurements from the Unalakleet tide gauge (blue solid line) and sea-level predictions from the St. Michael tide gauge (green dots for high- and low-tide predictions and green dashed line for interpolated predictions). (image: Authors)
The overall results show good agreement with the tide predictions at the nearby St. Michael tide-gauge station. It should be noted that the St. Michael tide gauge only provides high- and low-tide predictions so these were interpolated. However, some tidal characteristics not represented in the published predictions were also confirmed. In particular, as shown in the red-shaded segments of the time series marked (a) and (b) in Figure 6, larger and lower amplitudes than the tide predictions for the St. Michael tide gauge were identified on June 3 and 16, respectively.
These inconsistencies can be explained by the comparison with actual sea-level measurements at the Unalakleet tide gauge (solid blue line in Figure 6), which show very similar sea-level changes compared to those of the GNSS-R-based tide gauge. In addition, the overall larger amplitudes in the time series from the Unalakleet tide gauge can be explained by considering the fact that the amplitudes of the water levels vary along the coastline in Alaska and the Unalakleet tide gauge is approximately 74 kilometers from AT01.
To quantitatively investigate the agreement between the GNSS-R-based tide gauge and the standard tide gauges, we computed correlation coefficients. To ensure simultaneous data, the standard tide-gauge measurements and predictions were interpolated to the time tags of the GNSS-R-based time series. The correlation coefficients are 0.87 and 0.81 with the St. Michael and Unalakleet tide gauges, respectively.
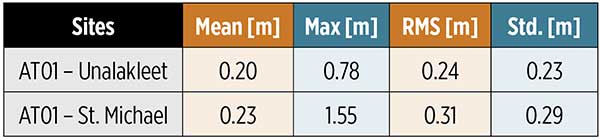
The statistical analysis of the comparison result is summarized in TABLE 1. The mean and maximum values were computed using the absolute sea-level differences. From the results, it could be established that the GNSS-R-derived sea level shows better agreement with actual sea-level measurements at the Unalakleet tide gauge even though it is approximately 74 kilometers away from AT01.
Table 1 Statistical analysis of the sea-level differences between the GNSS-R-based tide gauge (AT01) and the standard tide gauges (Unalakleet and St. Michael).
Spectral analysis was additionally conducted to validate the sea levels from the GNSS-R-based tide gauge. Because the St. Michael tide gauge does not provide actual measurements (only predictions), only the Unalakleet tide gauge was used in the spectral comparison. A fast Fourier transform (FFT) was applied to convert the time series of the sea levels to the frequency domain.
The GNSS-R-based tide gauge showed good agreement with the Unalakleet tide gauge overall. In addition, from the corresponding spectral analysis results, we were able to find meaningful harmonic constituents, M2, K1 and O1. The harmonic constituents estimated from the sea-surface measurements of the GNSS-R-based tide gauge have amplitudes most similar to the published harmonic constituents of the nearest St. Michael tide gauge, although the difference in amplitudes of the three harmonic constituents averages 12.3 centimeters.
In fact, the Unalakleet tide gauge also does not exactly match the amplitude of the estimated harmonic constituents and the published harmonic constituents. But by summarizing the corresponding results, we can conclude that the harmonic constituents estimated from the GNSS-R-based tide gauge are reliable.
As mentioned earlier, in our study, we estimated the water-level change by using GPS and Galileo satellite signals to overcome the degradation of GNSS performance due to the satellite geometry in the Arctic. The smoothed time series, calculated from a moving-average filter of two-hour intervals, is shown in Figure 6 (yellow dashed lines). The time series of sea level derived by the GNSS-R-based tide gauge during the whole month were used as ground truth for evaluating the accuracy.
This was done because the Unalakleet tide gauge is approximately 74 kilometers away from AT01 and the St. Michael tide gauge does not provide actual measurements, making it difficult to use as ground truth. As a result, the sea levels determined using the Galileo and GPS signals showed very similar accuracy with an average difference of 0.11 meters. Therefore, even if Galileo is additionally used, the estimated final water levels were at a similar level of accuracy.
However, the number of water-level observations dramatically increased (approximately doubled) when GPS and Galileo signals were both involved, even though the number of Galileo satellites is fewer than the number of GPS satellites. This is because Galileo transmits on five frequencies while GPS transmits on just three, so we can achieve more robust solutions by including Galileo.
We investigated how adding Galileo satellites changes the temporal resolution of the final sea-level measurements. At this time, several sea-level measurements pointing to the same epoch (such as sea levels from several frequency observations of the same satellite arc) were considered as one measurement for the time interval computation.
Overall, sea-level measurements using only Galileo satellites show lower temporal resolution compared to GPS satellites alone, with a mean time interval of 48.97 minutes because Galileo is not fully operational yet and fewer satellites are available. However, combining GPS and Galileo satellites to the sea-level analysis significantly increased the time resolution.
When only GPS satellites were used, the maximum time interval between two water-level measurements was greater than 3 hours, while the maximum time interval was shortened to about 1.5 hours when Galileo satellites were included in the water-level measurement.
However, even if both GPS and Galileo satellites were used, the average time interval was still 14.1 minutes, which is considerably longer than the time resolution of the standard tide gauge of 6 minutes. The lower time resolution of a GNSS-R-based tide gauge is explained by the limited ranges (azimuth and elevation angle ranges of 0° to 230° and 10° to 25°, respectively) toward the ocean at station AT01. It means the time resolution can be improved by securing a wider view of the ocean from the GNSS-R-based tide gauge.
SUMMARY AND CONCLUSION
The purpose of our study was to evaluate and verify the feasibility of using GNSS-R for sea-level monitoring in the Arctic. We used data from a GNSS station in St. Michael, Alaska, and applied an advanced algorithm that accurately determines sea levels through the comparisons of results from multiple GNSS signals along with an effective filtering procedure. Our results were validated through comparisons with measurements and predictions from nearby standard tide gauges.
From the corresponding analysis, we could confirm that the GNSS-R technique overcomes the limitations of standard tide gauges in the Arctic and successfully estimated the sea-level change in St. Michael, Alaska. The results from this study show many promising applications for a GNSS-R-based tide gauge in the Arctic, such as tsunami and flood monitoring and tidal datum determination.
In future studies, additional research should be conducted on how well the GNSS-R-based tide gauge can operate in extreme conditions such as low temperatures, wind gusts, storms, and snow. And, for further improvement of the temporal resolution of the technique, all active GNSS constellations including GPS, GLONASS, Galileo, and BeiDou should be included — that will certainly improve the temporal resolution and also potentially improve the accuracy and reliability. It would be also worth studying the spatial variations of sea-level changes by investigating the specular reflection points of GNSS multipath signals.
ACKNOWLEDGMENTS
This article is based on the paper “Monitoring Sea Level Change in the Arctic Using GNSS-Reflectometry” presented at ION ITM 2019, the 2019 International Technical Meeting of The Institute of Navigation, Reston, Virginia, Jan. 28–31, 2019.
SU-KYUNG KIM is a graduate research assistant at Oregon State University in Corvallis, Oregon. She received her M.Sc. in geoinformation engineering from Sejong University in Seoul, South Korea, in 2013. Her research interests are focused on sea-level change monitoring and crustal deformation studies using GNSS.
JIHYE PARK is an assistant professor of geomatics at Oregon State University. She holds a Ph.D. in geodetic science and surveying from The Ohio State University in Columbus, Ohio. Her research interests include GNSS positioning and navigation, GNSS reflectometry, ionospheric and tropospheric monitoring for natural hazards and artificial events, and other geospatial-related topics.
FURTHER READING
Authors’ Conference Paper
“Monitoring Sea Level Change in the Arctic Using GNSS-Reflectometry” by S.-K. Kim and J. Park in Proceedings of ION ITM 2019, the 2019 International Technical Meeting of The Institute of Navigation, Reston, Virginia, Jan. 28–31, 2019.
Pioneering Work by Manuel Martin-Neira
“The PARIS Concept: An Experimental Demonstration of Sea Surface Altimetry Using GPS Reflected Signals” by M. Martín-Neira, M. Caparrini, J. Font-Rossello, S. Lannelongue and C.S. Vallmitjana in IEEE Transactions on Geoscience and Remote Sensing, Vol. 39, No. 1, 2001, pp. 142–150, doi: 10.1109/36.898676.
“Coastal Sea Level Measurements Using a Single Geodetic GPS Receiver” by K.M. Larson, J.S. Löfgren and R. Haas in Advances in Space Research, Vol. 51, No. 8, 2013, pp. 1301–1310, doi: 10.1016/j.asr.2012.04.017.
“Monitoring Coastal Sea Level Using Reflected GNSS Signals” by J.S. Löfgren, R. Haas and J.M. Johansson in Advances in Space Research, Vol. 47, No. 2, 2011, pp. 213–220, doi: 10.1016/j.asr.2010.08.015.
“Three Months of Local Sea Level Derived from Reflected GNSS Signals” by J.S. Löfgren, R. Haas, H.-G. Scherneck and M.S. Bos in Radio Science, Vol. 46, No. 6, 2011, RS0C05, doi:10.1029/2011RS004693.
“Determination of Water Level and Tides Using Interferometric Observations of GPS Signals” by K.D. Anderson in Journal of Atmospheric and Oceanic Technology, Vol. 17, No. 8, 2000, pp. 1118-1127, doi: 10.1175/1520-0426(2000)017<1118:DOWLAT>2.0.CO;2.
Earlier Innovation Columns Dealing with GNSS Refectometry
Tides, Surges and Mean Sea-Level by D. Pugh, published originally by J. Wiley & Sons, Chichester, U.K., 1987, reprinted with corrections in 1996 and subsequently issued in e-print form by NERC Open Research Archive.
Random Sample Consensus
“Random Sample Consensus: A Paradigm for Model Fitting with Applications to Image Analysis and Automated Cartography” by M.A. Fischler and R.C. Bolles in Communications of the ACM, Vol. 24, No. 6, 1981, pp. 381–395, 10.1145/358669.358692.
Your phone or satnav receiver routinely picks up signals from navigation satellites in order to tell you precisely where you are. But have you ever thought what happens to those satnav signals afterwards? A foresighted ESA inventor had the idea of using them as a tool for observing the Earth.
More than 120 satellite navigation satellites are in orbit, making up multiple constellations including Europe’s Galileo system, sending down a continuous rain of satnav signals for the benefit of users worldwide. Just like visible light, these microwave signals go on to reflect off Earth’s land and sea surfaces.
The traditional attitude to these reflected signals is to see them as something of a nuisance — known as multipath, they can confuse satnav receivers and reduce their overall accuracy.
ESA microwave engineer Manuel Martín-Neira, inventor of the PARIS reflectometry concept. (Photo: ESA)
But back in 1993 — at the same time as the US GPS satnav system reached its full constellation of 24 satellites — a young ESA microwave engineer called Manuel Martín-Neira came up with the idea of treating these satnav reflections as a scientific resource instead.
“My head of division asked me to come up with a budget-friendly way of increasing the overall sampling rate to build up a fuller picture of mesoscale phenomena, and that led me to start looking into making use of additional signals of opportunity, chiefly satnav signals.
“The initial reaction was mixed, because the forecast accuracy was not as precise as the ERS-1 altimeter could deliver — but on the plus side there would be a lot of these signals to make use of, and the performance has improved a lot since those early days.”
PARIS, detecting reflected satnav. (Photo: ESA)
Inspiration from reflection
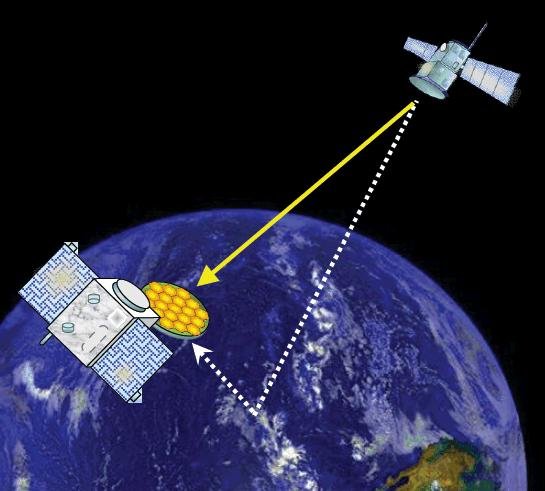
The basic idea of what Manuel christened the Passive Reflectometry and Interferometry System, or PARIS, comes down to a two-sided antenna. As the topmost side picks up a satnav signal from the satellites in orbit, the other side picks up the version of the signal bounced back from Earth.
By comparing this initial, overhead signal with its reflected equivalent using a process called interferometry — measuring tiny differences in signal phases – the extra travel time of this reflected beam can be determined, down to an accuracy of less than five centimetres, determining sea height and sea ice thickness.
Additional amplitude waveform processing can deliver further data on wind and wave measurements over the ocean, and soil moisture and biomass over land.
Satellite reflectometry has since grown into a thriving field. This summer, Manuel attended the latest international workshop on the method he first devised 26 years ago.
Reflectometry reaches space
“It’s been fantastic to have experimental evidence, and that’s really been made possible by the growing availability of smaller satellites,” explains Manuel.
“Because satellite reflectometry is a passive form of remote sensing, it makes for an attractive potential payload because it doesn’t need a lot of power to operate. Then one of the results is meteorology data that private companies intend to make money with by delivering to public agencies.”
Surrey Satellite Technology Ltd.’s UK-DMC satellite was the first orbital mission with a reflectometry payload. (Photo: ESA)
In 2003, the UK-DMC satellite was the first mission to fly a reflectometry payload, followed in recent years by, for example, the UK’s TechDemoSat-1, NASA’s CyGNSS constellation to monitor hurricanes and the Spire global constellation of commercial nanosatellites.
“These satellites have really given the reflectometry community a wealth of signals, demonstrating what reflections look like over different surfaces including sea ice, forests, and even inland water bodies such as the Amazon River and its tributaries.
“In parts of the ocean near continental masses and within atolls we are seeing reflected signals from very calm waters which resembled a mirror, giving us very high precision down to 1 cm level. Such measurements could potentially complement current altimetry missions, by for instance measuring sea level rise.”
Example of a CYGNSS Microsatellite Observatory. (Image: Southwest Research Institute)
ESA activities taking flight
ESA meanwhile is active on reflectometry in various ways, having developed and tested a steerable airborne antenna called the Software PARIS Interferometric Receiver or SPIR, capable of steering separate antenna beams to build up a rapid surface picture, and differentiating between different signal sources, such as GPS from Galileo.
Manuel adds: “ESA’s GNSS Science Support Centre, based at the Agency’s European Space Astronomy Centre near Madrid, has been taking a keen interest in these activities.”
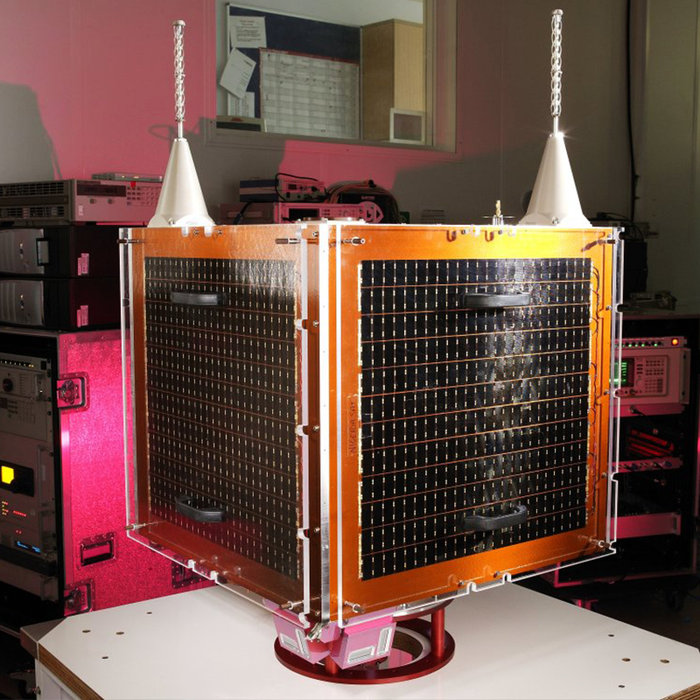
Missions are also in development, including a dedicated CubeSat with RUAG-Austria and the University of Graz called PRETTY (for Passive REflecTomeTry and dosimetry, which would also carry a radiation detector), and a small satellite pair called FSSCat from Spain’s Universitat Politècnica de Catalunya, backed through the Copernicus Masters competition, seen as a prototype for a future reflectometry constellation.
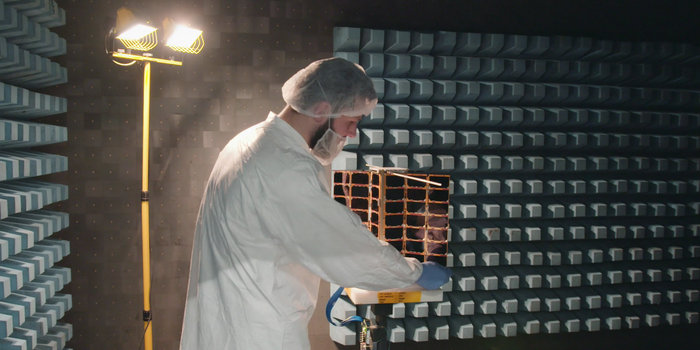
ESA’s Directorate of Telecommunications and Integrated Applications is also working with the Spire company to fly enhanced reflectometry instruments, starting at the end of this year.
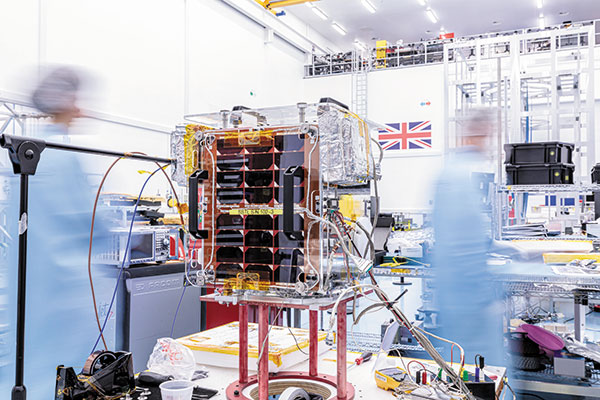
One of Spire’s Satellite Manufacturing Technicians (Tomasz Chanusiak) tests the Radio Frequency capabilities of a LEMUR2 nanosatellite in Spire’s cleanroom in Glasgow, Scotland. (Photo: ESA)
When it comes to the thriving state of today’s reflectometry community, Manuel recalls the patenting of his idea as a turning point: ‘Having had this idea, which was not particularly well received, the proposal by ESA’s Patents Group to patent it made all the difference. It gave me a feeling of confidence, that somebody else at least saw the potential of this idea — and the rest is history.”
The first global GNSS-reflectometry ocean-wind data service has been launched by Surrey Satellite Technology Ltd. (SSTL) with the National Oceanography Centre (NOC), and with support from the European Space Agency.
The online data service, dubbed MERRBYS (Measurement of Earth Reflected Radio-navigation signals By Satellite), is free.
Users can access measurements of wind taken by a specially designed GNSS receiver hosted on SSTL’s TechDemoSat-1 satellite, which collects signals reflected off the surface of the ocean. The service offers monthly maps of wind speed over the oceans.
TechDemoSat-1 is also collecting GNSS reflections off land and polar regions, opening the door for new applications of this technology, such as soil moisture and ice measurements.
TechDemoSat-1 was launched in 2014 and carried eight payloads from different U.K. organizations. On successful completion of the satellite’s original mission, a life extension now allows the GNSS reflectometry payload to be operated continuously.
Onboard processed GNSS-R data is relayed to SSTL’s ground station in the U.K. and inverted for geophysical parameters using NOC retrieval algorithms for the estimation of near-surface ocean wind speed.
Users have access to data from the past three years, and new data is added daily with a latency of 30 days. Users can also register for a fast service allowing retrieval of data with a shorter delay — currently 48 hours, but with a target of less than 24 hours as the service matures.
Pilot demonstration
The current service is a pilot demonstration showing the potential for a new source of wind and wave measurements from in orbit using a small satellite. In the future, a constellation of low-cost small satellites carrying enhanced instruments could provide measurements in near-real time to support weather and wave forecasting.
The TechDemoSat-1 satellite and payload were supported by U.K. Centre for Earth Observation Instrumentation and the U.K. Space Agency, and sponsorship from European Space Agency has allowed the release of data.
More than 50 international journal papers have been published based on the use of the TechDemoSat-1 GNSS-R data. GPS World first discussed the technology in a 1999 Innovation column by GPS World Leadership Award Winner Attila Komjathy, “GPS, a new tool for ocean science.”
SSTL also provided the same GNSS reflectometry instrument to the NASA CYGNSS mission, where eight small satellites are using this technique to probe and analyze hurricanes.
Surrey Satellite Technology’s Space GNSS Receiver Remote Sensing Instrument (SGR-ReSI) is the primary payload onboard NASA’s CYGNSS constellation, launched today, Dec. 15, from Cape Canaveral Air Force Station in Florida.
The Cyclone Global Navigation Satellite System (CYGNSS) mission is part of the NASA Earth System Science Pathfinder Program that aims to improve extreme weather prediction by studying how tropical cyclones form.
Artist’s concept of one of the eight CYGNSS satellites in orbit. (Image: NASA/University of Michigan)
The CYGNSS space segment consists of a constellation of eight micro satellites, each carrying the Surrey SGR-ReSI as the observatory payload in the form of a delay Doppler mapping instrument (DDMI). Making use of reflected global positioning signals, the DDMI collects ocean surface roughness data using a technique called GNSS reflectometry, providing CYGNSS with a new method for looking inside hurricanes. Wind speed will be estimated from this reflectometry data.
“At the end of last year, we delivered the SGR-ReSI flight models, low-noise amplifiers, and antennas to Southwest Research Institute for final integration into the CYGNSS observatories — marking a significant hardware shipment out of our Englewood, Colorado, manufacturing facility,” said Clare Martin, vice president of programs at Surrey Satellite Technology U.S.. “All of us at Surrey are proud that our instrument is playing an integral role in this mission, and we will watch with great interest as the satellites are put to work.”
The CYGNSS team is made up of the University of Michigan Department of Climate and Space Sciences and Engineering, Southwest Research Institute (SwRI), Surrey Satellite Technology and Sierra Nevada Corporation.
Surrey Satellite Technology demonstrated the concept of GNSS reflectometry for the first time on its UK-DMC mission launched in 2003, and subsequently developed the SGR-ReSI, which is currently flying on Surrey’s TechDemoSat-1 mission.
CYGNSS is NASA’s first Earth science small satellite constellation, designed to help improve forecasting hurricane intensity, hurricane tracks and storm surges.
CYGNSS will measure previously unknown details crucial to accurately understanding the formation and intensity of tropical cyclones and hurricanes.
“This is a first-of-its-kind mission,” said Thomas Zurbuchen, associate administrator for NASA’s Science Mission Directorate at the agency’s headquarters in Washington. “As a constellation of eight spacecraft, CYGNSS will do what a single craft can’t in terms of measuring surface wind speeds inside hurricanes and tropical cyclones at high time-resolution, to improve our ability to understand and predict how these deadly storms develop.”
The CYGNSS mission is expected to lead to more accurate weather forecasts of wind speeds and storm surges — the walls of water that do the most damage when hurricanes make landfall.
Using the same GPS technology that allows drivers to navigate streets, CYGNSS will use a constellation of eight micro satellite observatories to measure the surface roughness of the world’s oceans. Mission scientists will use the data collected to calculate surface wind speeds, providing a better picture of a storm’s strength and intensity.
Unlike existing operational weather satellites, CYGNSS can penetrate the heavy rain of a hurricane’s eyewall to gather data about a storm’s intense inner core. The eyewall is the thick ring of thunderstorm clouds and rain that surrounds the calm eye of a hurricane. The inner core region acts like the engine of the storm by extracting energy from the warm surface water via evaporation into the atmosphere.
The latent heat contained in the water vapor is then released into the atmosphere by condensation and precipitation. The intense rain in eyewalls blocks the view of the inner core by conventional satellites, however, preventing scientists from gathering much information about this key region of a developing hurricane.
“Today, we can’t see what’s happening under the rain,” said Chris Ruf, professor in the University of Michigan’s Department of Climate and Space Sciences and Engineering and principal investigator for the CYGNSS mission. “We can measure the wind outside of the storm cell with present systems. But there’s a gap in our knowledge of cyclone processes in the critical eyewall region of the storm — a gap that will be filled by the CYGNSS data. The models try to predict what is happening under the rain, but they are much less accurate without continuous experimental validation.”
The CYGNSS small satellite observatories will continuously monitor surface winds over the oceans across Earth’s tropical hurricane-belt latitudes. Each satellite is capable of capturing four wind measurements per second, adding as many as 32 wind measurements per second for the entire constellation.
CYGNSS is the first complete orbital mission competitively selected by NASA’s Earth Venture program. Earth Venture focuses on low-cost, rapidly developed, science-driven missions to enhance our understanding of the current state of Earth and its complex, dynamic system and enable continual improvement in the prediction of future changes.
The National Oceanography Centre (NOC) has developed global wind speed products based on reflected GPS signals, using data from the UK TechDemoSat-1 satellite, reports Hydro International.
The TechDemoSat-1 satellite, built by Surrey Satellite Technology Ltd. (Photo: SSTL)
The achievement demonstrates the potential of GNSS reflectometry (GNSS-R) to improve sampling of ocean surface winds, as well as improve weather monitoring and forecasting by complementing existing satellite measurements from scatterometers and radiometers.
The GNSS-R receiver on TechDemoSat-1 is a precursor to eight similar receivers to be flown as a constellation for the NASA CYGNSS mission. CYGNSS — Cyclone Global Navigation Satellite System — will be launched Dec. 12 and will observe winds within cyclones, hurricanes and typhoons with unprecedented spatial and temporal sampling.
CYGNSS will launch aboard the Pegasus XL rocket from Cape Canaveral Air Force Station in Florida. It will make frequent and accurate measurements of ocean surface winds throughout the life cycle of tropical storms and hurricanes.
GNSS-R Data collections. The measured reflection tracks are shown in yellow over the Globe. A sequence of Delay Doppler Maps from one track is shown below — the spread of each is related to the sea surface roughness and surface wind speed.
New weather datasets, which could prove highly valuable for weather forecasting and for longer term climate monitoring, have just been made available from the Space GNSS Receiver-Remote Sensing Instrument (SGR-ReSI) instrument on board TechDemoSat-1, a small technology demonstration satellite launched by Surrey Satellite Technology Ltd (SSTL) in 2014.
With support from the European Space Agency, SSTL and the National Oceanography Centre (NOC) are continuing to work on the data received from TechDemoSat-1 and have been steadily improving the calibration of the measurements and researching new techniques and applications.
New data, including delay Doppler maps and wind speed analysis over oceans, has been released on the MERRYBS website (Measurement of Earth Reflected Radio-navigation Signals By Satellite).
Looking to the future, the NASA CYGNSS mission due to launch later this year will fly eight satellites carrying SSTL’s SGR-ReSI instrument to measure the winds within cyclones, hurricanes and typhoons.
The SGR-ReSI instrument was developed by SSTL and is able to calculate TechDemoSat-1’s position and speed in much the same way as does a car-based SatNav, by measuring ranges and triangulating its position from high-altitude GNSS satellites orbiting 20,000 km above the satellite itself. The SGR-ReSI also carries a high-gain nadir (downward-pointing) antenna to utilize GNSS reflectometry, a technique where the GNSS signals scattered off the Earth’s surface are collected and measured.
A calm ocean will give a clean reflection, while a rough, wind-driven ocean will spread the signal out. SSTL’s partner, the National Oceanography Centre in Southampton, has developed an algorithm that calculates from the signals the ocean roughness and in turn estimates the wind speed at the surface of the ocean.
To validate the algorithm, NOC has compared the wind speed measurements from the SGR-ReSI against radar measurements from EUMETSAT’s MetOp satellite. These wind speed measurements are valuable for weather forecasting, and could also prove to be of significant benefit to the scientific community for climate monitoring.
The GNSS reflections off ice are much stronger than reflections off the ocean, and it has been possible to demonstrate from the results a new method for measuring the changing location of ice edges over time, and the potential for a new method of measuring ice height and thickness.
GPS reflections are not only collected by the SGR-ReSI over the ocean, but over land, where measurements to date show strong variations that could contain valuable geophysical information about the land surface. For instance, healthy vegetation will absorb more of the signal while damp soil can cause stronger reflections. Soil moisture is considered an essential parameter for climate monitoring, and is not currently measured with sufficient coverage over the globe.
TechDemoSat-1 was in part funded by Innovate UK and is jointly operated by SSTL in Guildford and by the Satellite Applications Catapult in Harwell.
SSTL received funding to support the development of the SGR-ReSI and ground processing from the UK CEOI, SEEDA, Innovate UK and the European Space Agency.
The below videos show processing and application of the SGR-ReSI data.
Video 1: This video shows in about 20 times real-time speed the motion of the TechDemoSat-1 satellite over an orbit, indicated by a white cross on the world map. The specular reflections targeted by the SGR-ReSI are shown by yellow spots, and the measurement tracks are shown in yellow.
The four Delay Doppler Map channels from measurement tracks are shown in yellow. The four Delay Doppler Map channels from the SGR-ReSI are shown at the top right.
The spreading horseshoe shape is caused by reflections being received away from the specular point, and a rougher ocean causes more spreading. When reflections are received from over land and over ice, there is much less spreading.
The red band on the map indicates the collection of “raw” unprocessed data, which takes a few minutes to transfer before the processed Delay Doppler Maps resume.
Video 2: This video shows reflections over the Northwest Passage, with and without ice.